
Submitted:
13 July 2026
Posted:
14 July 2026
You are already at the latest version
Abstract
Grassland degradation is a global ecological crisis that profoundly alters aboveground vegetation and soil properties, yet its impacts on soil microbial co‑occurrence networks remain poorly understood. Here, we investigated soil bacterial and fungal communities along a well‑defined five‑stage degradation gradient spanning from non‑degraded Leymus chinensis grassland to extremely degraded bare saline patches in the Songnen meadow steppe of northeastern China, using Illumina MiSeq sequencing and co‑occurrence network analysis. Our results revealed that bacterial α‑diversity exhibited a unimodal (hump‑shaped) response peaking at the moderately degraded KA stage, whereas fungal diversity declined monotonically along the gradient, indicating greater sensitivity of fungi to degradation stress. Both bacterial and fungal community compositions shifted directionally with degradation, driven primarily by soil alkalization (pH) and electrical conductivity (EC). Network complexity followed a unimodal pattern for both kingdoms, maximizing at KA and collapsing at AS, suggesting a critical ecological threshold between moderate and severe degradation, while the increased proportion of positive correlations under severe degradation implied enhanced microbial cooperation in response to environmental stress. Structural equation models further revealed distinct regulatory pathways: bacterial networks were governed by both direct environmental filtering and indirect diversity‑mediated effects, whereas fungal networks responded more strongly to direct pH/EC constraints and compositional shifts. Our findings demonstrate that microbial networks exhibit nonlinear threshold responses to grassland degradation, with fungi serving as more sensitive bioindicators than bacteria, and highlight the importance of integrating network‑level properties into degradation monitoring and restoration frameworks.
Keywords:
grassland degradation
; soil bacteria
; soil fungi
; co-occurrence network
; microbial diversity
; environmental filtering
; ecological threshold
; Songnen Plain
; structural equation model
; bioindicator
1. Introduction
Grassland is one of the most widely distributed terrestrial ecosystems, covering approximately 40% of the Earth’s land surface, and plays an irreplaceable role in global nutrient cycling, biodiversity conservation, soil stabilization, and livestock production[1,2,3]. However, due to intensive anthropogenic activities—including overgrazing, agricultural intensification, and land-use change—coupled with climate variability, approximately 49% of global grasslands have experienced degradation to varying degrees[4]. In China, an estimated 90% of grasslands have been degraded to varying degrees, posing serious threats to ecosystem productivity, stability, and regional sustainable development[5,6]. Grassland degradation is essentially a process of retrogressive succession, characterized by declining vegetation cover, aboveground biomass reduction, shifts in plant community composition from climax species (e.g., Leymus chinensis) to salt-tolerant pioneer species (e.g., Artemisia anethifolia, Suaeda spp.), and ultimately the formation of bare saline patches[7]. This continuous degradation gradient provides an ideal natural experimental platform for investigating the response of belowground ecological processes to ecosystem deterioration.
Soil microorganisms, comprising complex assemblages of bacteria, fungi, archaea, and viruses, are central to the functioning and resilience of grassland ecosystems[8]. They drive critical biogeochemical processes including organic matter decomposition, nitrogen fixation, phosphorus mobilization, and soil aggregate formation[9]. For instance, arbuscular mycorrhizal fungi (AMF) form extensive hyphal networks that enhance plant nutrient acquisition and drought tolerance, while nitrogen-fixing bacteria such as Rhizobium and Bradyrhizobium contribute substantially to the nitrogen economy of grasslands[10,11]. Given their sensitivity to environmental change, soil microbial communities often serve as early indicators of ecosystem stress and degradation[12,13]. Degraded grasslands are frequently characterized by reduced microbial biomass and diversity, breakdown of mutualistic interactions, and dominance of opportunistic or pathogenic taxa, leading to diminished soil quality and impaired recovery potential[14,15].
In recent years, there has been a paradigm shift in microbial ecology from merely describing community composition to understanding interspecific interactions and network dynamics[16]. Co-occurrence network analysis provides a powerful framework to infer potential ecological interactions (e.g., mutualism, competition, niche overlap) among microbial taxa and to characterize community-level topological properties such as complexity, connectivity, modularity, and stability[17,18]. These network attributes are increasingly recognized as critical determinants of ecosystem resistance and resilience to environmental perturbations[19,20]. For instance, complex networks with higher connectivity and redundancy are generally more resistant to species loss and environmental disturbances[21,22]. Conversely, network simplification—manifested as reduced nodes, links, and average degree—may indicate functional vulnerability and loss of ecosystem buffering capacity[23].
Despite growing interest, our understanding of how microbial co-occurrence networks respond along complete grassland degradation gradients remains fragmented and sometimes contradictory. Some studies report that degradation reduces microbial diversity and network complexity[24], while others reveal that degraded grasslands harbor more tightly connected networks as microbes strengthen cooperation to cope with environmental stress[8,14,25]. For example, research on the Qinghai-Tibet Plateau found that alpine grassland degradation increased fungal network complexity while decreasing bacterial and protistan network complexity, suggesting differential responses among microbial kingdoms[26]. Furthermore, studies in the Songnen Plain—a region characterized by low precipitation, high evaporation, saline parent material, and overgrazing—have shown that soil salinization and alkalization are primary filters shaping microbial community structure and function[27,28]. However, the relative importance of direct environmental filtering (e.g., pH, electrical conductivity) versus indirect vegetation-mediated pathways (e.g., reduced plant biomass and litter inputs) in driving network changes remains poorly resolved[29]. Moreover, whether bacteria and fungi exhibit consistent or divergent network responses across degradation stages has not been systematically examined, particularly in saline-alkaline meadow steppe ecosystems[30].
To address these knowledge gaps, we conducted a field study along a well-defined five-stage degradation gradient in the Songnen Grassland Ecosystem National Observation and Research Station, Northeast China. The gradient spans from non-degraded Leymus chinensis grassland (LH), through lightly degraded mixed forbs (ML), moderately degraded Artemisia anethifolia (KA), severely degraded Artemisia + Suaeda/Kochia (AS), to extremely degraded bare crust/vegetation patches (CV). This sequence represents a continuous retrogressive succession driven by soil salinization and alkalization, providing an ideal context for investigating gradual microbial responses.
Specifically, our study aimed to address the following questions: (1) How do bacterial and fungal community diversity, composition, and co-occurrence network topology change along the degradation gradient? (2) Do bacteria and fungi exhibit divergent network responses to degradation? (3) What are the key environmental drivers—direct soil physicochemical factors versus indirect vegetation-mediated pathways—that regulate microbial network changes? We hypothesized that (i) degradation would progressively simplify microbial networks, with the most drastic changes occurring between moderate and severe degradation stages; (ii) fungal networks would be more sensitive to degradation than bacterial networks due to their stronger dependence on vegetation inputs; and (iii) soil alkalization and salinization would serve as primary direct drivers, while vegetation biomass loss would exert indirect effects through reducing resource availability. By elucidating the patterns and drivers of microbial network changes along a complete degradation gradient, this study aims to provide a theoretical basis for developing microbial indicators of grassland degradation and informing restoration strategies.
2. Materials and Methods
2.1. Study Site Description
This study was conducted in August 2024 at the Jilin Songnen Grassland Ecosystem National Observation and Research Station, Northeast Normal University, Jilin Province, China (44°45′ N, 123°45′ E). The site is located in the low-lying area of the Songnen Plain, with relatively flat terrain at an elevation of 138–167 m above sea level. The region has a semi-arid continental monsoon climate, characterized by cold, dry winters and warm, rainy summers. Mean annual temperature ranges from 4.6 to 6.4°C, and mean annual precipitation varies between 280 and 400 mm, with most rainfall occurring during the growing season (June to August). Annual evaporation (1200–1600 mm) is three to four times higher than precipitation. Soils are classified as castaneozem, light chernozem, and meadow chernozem, with pH values ranging from 7.0 to 10.5. Low precipitation, high surface evaporation, saline parent material, and overgrazing are the primary drivers of soil salinization and grassland degradation in this region. The dominant vegetation is the perennial rhizomatous grass Leymus chinensis, a common species in the eastern Eurasian steppes. Other common species include Phragmites australis, Calamagrostis epigejos, Artemisia scoparia, and Messerschmidia sibirica.
2.2. Experimental Design and Sampling
Five degradation stages were selected based on vegetation community composition and soil properties: Leymus chinensis grassland (LH, non-degraded), mixed forbs (ML, lightly degraded), Artemisia anethifolia (KA, moderately degraded), Artemisia + Suaeda/Kochia (AS, severely degraded), and bare crust/vegetation patches (CV, extremely degraded). At each stage, six plots (25 m × 25 m) were established as replicates.
Vegetation sampling was conducted in mid-August. Within each plot, four parallel transects (25 m) were set at 5-m intervals, and 50 cm × 50 cm quadrats were placed along each transect at 5-m intervals. Aboveground living plants from 16 quadrats per plot were harvested, oven-dried at 65°C for 48 h, and weighed to determine biomass. Plant species richness was recorded in each quadrat. Litter biomass was collected separately and weighed. Plant carbon and nitrogen concentrations were measured using a Vario MICRO cube Elemental Analyzer (Elementar GmbH, Hanau, Germany).
Soil samples were collected from the top 0–10 cm layer using a soil auger (5 cm diameter). Five soil cores were randomly collected from each subplot, mixed thoroughly, and homogenized to form one composite sample. After removing roots and plant residues, each sample was sieved through a 2-mm mesh and divided into three portions: one stored at −80°C for DNA extraction, one kept at 4°C for soil physicochemical analyses, and one air-dried at room temperature for total carbon and nitrogen determination. Soil pH and electrical conductivity (EC) were measured in a 1:5 (soil:water) suspension. Soil organic carbon (SOC) was determined using the K₂Cr₂O₇ oxidation method. Soil NO₃⁻-N and available phosphorus (AP) were measured using a continuous flow analyzer (Futura, Alliance, Frépillon, France) following standard protocols.
2.3. DNA Extraction, PCR Amplification, and Sequencing
Microbial DNA was extracted from 0.4 g of frozen soil using the MOBIO PowerSoil DNA Extraction Kit (MoBio Laboratories, Carlsbad, USA) following the manufacturer’s instructions. DNA quality was verified by 1% agarose gel electrophoresis. Bacterial 16S rRNA genes were amplified using primer pairs 338F (5′-ACTCCTACGGGAGGCAGCAG-3′) and 806R (5′-GGACTACHVGGGTWTCT AAT-3′), targeting the V3–V4 region. Fungal ITS regions were amplified using primers ITS1 (5′-CTTGGTCATTTAGAGGAAGTAA-3′) and ITS2 (5′-GCTGCGTTCTTCATCGATGC-3′). PCR products were purified using the AxyPrep DNA Gel Extraction Kit (Axygen Biosciences, USA), quantified with QuantiFluor™-ST (Promega, USA), and sequenced on the Illumina MiSeq platform (Majorbio, Shanghai, China).
2.4. Bioinformatics and Network Analysis
Raw sequences were demultiplexed, quality-filtered using fastp (version 0.20.0), and merged using FLASH (version 1.2.7). Operational taxonomic units (OTUs) were clustered at 97% similarity using UPARSE (version 7.1), and chimeric sequences were removed. Taxonomic assignment was performed using the RDP Classifier against the SILVA database (version 119) for bacteria and the UNITE database (version 7.0) for fungi, with a confidence threshold of 70%. To account for sequencing depth variation, samples were rarefied to the minimum sequence number (25,586 for bacteria; 32,000 for fungi) prior to downstream analysis. Alpha diversity indices (Shannon, Simpson, observed richness, Chao1, ACE) were calculated using mothur. Beta diversity was assessed via non-metric multidimensional scaling (NMDS) based on Bray–Curtis distances. Co-occurrence networks were constructed at the genus level using Spearman’s rank correlations with |ρ| > 0.6 and P < 0.01. Networks were visualized using Gephi with a Fruchterman–Reingold layout. Topological parameters (nodes, links, average degree, modularity, average path length, clustering coefficient) were calculated using the igraph package in R.
2.5. Statistical Analysis
One-way analysis of variance (ANOVA) followed by Tukey's HSD post-hoc test was used to compare vegetation characteristics, soil physicochemical properties, and microbial alpha diversity indices across the five degradation stages. Permutational multivariate analysis of variance (PERMANOVA, Adonis) with 999 permutations was performed to test for significant differences in microbial community structure (β-diversity) among stages, based on Bray–Curtis distance matrices. Non-metric multidimensional scaling (NMDS) was employed to visualize the dissimilarities in bacterial and fungal community composition across degradation gradients.
To disentangle the direct and indirect effects of environmental drivers (soil pH, EC, vegetation biomass, microbial α-diversity, and β-diversity) on microbial co-occurrence network properties (average degree as a proxy for network complexity), we constructed partial least squares structural equation models (PLS-SEM) using the plspm package in R. Prior to model construction, all variables were standardized to achieve a mean of zero and unit variance. The model fit was evaluated using the goodness-of-fit index (GOF), standardized root mean square residual (SRMR), and the coefficient of determination (R²) for endogenous variables. Path coefficients and their significance were estimated using bootstrap resampling with 1,000 iterations. The total, direct, and indirect effects were calculated to partition the relative importance of each pathway. Model adequacy was confirmed by GOF > 0.6 and SRMR < 0.08. All statistical analyses were performed using R software (version 4.0.3, R Core Team, 2020) with packages vegan, igraph, psych, ggplot2, and plspm. Statistical significance was set at P < 0.05 unless otherwise specified. All data are presented as mean ± standard deviation (SD).
3. Results
3.1. Vegetation and Soil Properties Along the Degradation Gradient
Plant community structure deteriorated progressively along the LH → ML → KA → AS → CV gradient (Table 1). Species richness declined from 5.67 ± 2.07 in LH to near-zero in AS (F = 32.10, P < 0.001), while total biomass decreased from 458.01 ± 98.72 g m⁻² in LH to 364.35 ± 96.76 g m⁻² in KA, collapsed completely in AS, and partially recovered in CV (247.34 ± 75.14 g m⁻²) due to colonization by salt-tolerant pioneer species. Litter biomass exhibited the most dramatic reduction, decreasing by approximately 84% from ML to KA and approaching zero in AS and CV (F = 105.87, P < 0.001), indicating near-complete cessation of organic matter return to soil under advanced degradation.
Soil properties underwent systematic modification along the gradient (Table 1). Soil pH shifted from mildly alkaline in LH (8.38 ± 0.15) and ML (8.05 ± 0.06) to extremely alkaline in KA–CV (9.70–10.01; F = 212.50, P < 0.001), accompanied by progressive accumulation of soluble salts and exchangeable cations (Na⁺ increased from 0.008 to 1.880 cmol kg⁻¹; F = 124.60, P < 0.001). Soil organic carbon decreased by 37.7% from LH to AS (F = 89.30, P < 0.001), while NO₃⁻-N and available P accumulated exceptionally in AS (38.20 and 28.91 mg kg⁻¹, respectively), suggesting nutrient cycling decoupling under severe degradation.
3.2. Shifts in Soil Microbial Diversity Along the Degradation Gradient
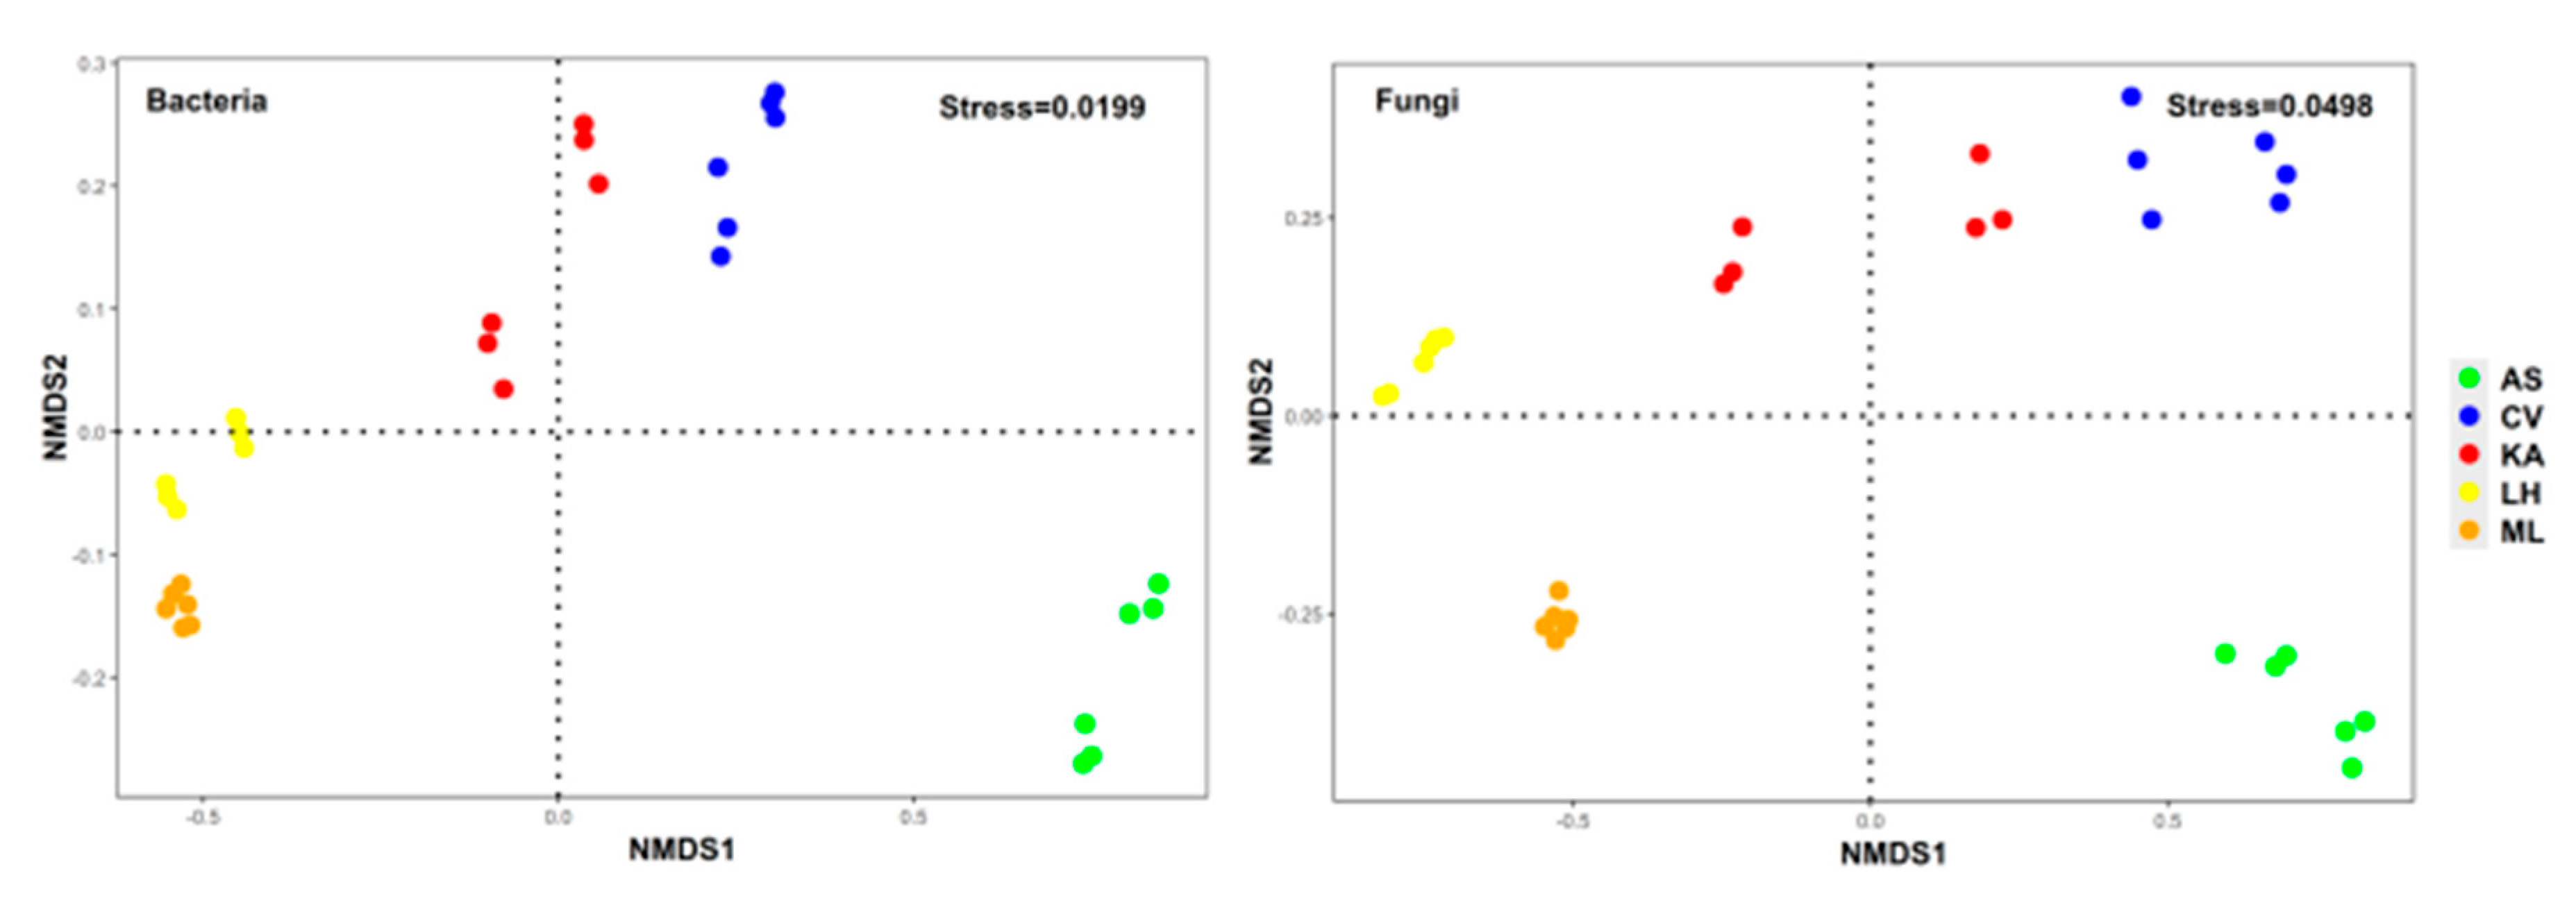
Bacterial α-diversity exhibited a unimodal response along the degradation gradient (Table 2). Observed richness (sobs) increased from LH (848.00 ± 36.98) to KA (888.83 ± 26.55), then declined sharply in AS (500.17 ± 17.12) and CV (734.00 ± 10.60). Shannon diversity followed the same pattern, peaking in KA (5.44 ± 0.03) and reaching the lowest value in AS (4.59 ± 0.04). In contrast, Simpson diversity increased progressively from LH to AS, indicating reduced community evenness under severe degradation. For β-diversity, NMDS1 increased monotonically along the gradient from -0.53 (ML) to 0.78 (AS), demonstrating a directional shift in bacterial community composition (F = 54.37, P < 0.001). PERMANOVA confirmed that degradation stage explained 61.2% of bacterial community variation (R² = 0.612, P < 0.001).
Fungal α-diversity showed contrasting patterns. Observed richness (sobs) remained relatively stable from LH to KA (288.67–334.17), but decreased significantly in CV (252.00) and AS (239.33) (F = 15.86, P < 0.001). Fungal Shannon diversity was highest in KA (3.78 ± 0.18) and lowest in LH (2.43 ± 0.25), indicating that moderate degradation did not reduce fungal diversity. Simpson diversity was highest in LH (0.24 ± 0.04) and lowest in KA (0.05 ± 0.01), suggesting that undegraded communities were dominated by few taxa. For β-diversity, FMDS1 exhibited a clear directional shift from -0.76 (ML) to 0.74 (AS) (F = 48.21, P < 0.001), with PERMANOVA indicating that degradation stage explained 58.3% of fungal community variation (R² = 0.583, P < 0.001). Overall, bacterial communities were more sensitive to moderate degradation, while fungi showed greater resistance until severe degradation stages.
Figure 1.
NMDS ordination of soil bacterial and fungal communities along the grassland degradation gradient based on Bray-Curtis distance. LH, Leymus chinensis grassland (non-degraded); ML, mixed forbs (lightly degraded); KA, Artemisia anethifolia (moderately degraded); AS, Artemisia + Suaeda/Kochia (severely degraded); CV, bare crust (extremely degraded).
Figure 1.
NMDS ordination of soil bacterial and fungal communities along the grassland degradation gradient based on Bray-Curtis distance. LH, Leymus chinensis grassland (non-degraded); ML, mixed forbs (lightly degraded); KA, Artemisia anethifolia (moderately degraded); AS, Artemisia + Suaeda/Kochia (severely degraded); CV, bare crust (extremely degraded).
3.3. Degradation-Induced Shifts in Microbial Co-Occurrence Network Topology
Bacterial and fungal co-occurrence networks exhibited pronounced changes along the degradation gradient (Figure 2 and Figure 3). For bacterial networks, nodes and links followed a unimodal pattern, increasing from LH (1,220 nodes, 12,860 links) to KA (1,311 nodes, 16,989 links), then declining sharply in AS (768 nodes, 6,993 links). Average degree peaked at KA (25.918) and was lowest in AS (18.211). Modularity reached its maximum at KA (1.967), while clustering coefficient increased monotonically from 0.655 (LH) to 0.703 (AS), suggesting intensified local connectivity under severe degradation.
Fungal networks showed similar trends but with lower overall complexity. Links increased from ML (4,340) to KA (6,584) and then decreased to 2,800 in AS, while average degree followed the same pattern (ML: 17.823 → KA: 24.430 → AS: 13.054). Average path length decreased from ML (5.179) to KA (3.620), then increased sharply in AS (5.764), indicating network fragmentation under extreme degradation. Notably, both bacterial and fungal networks exhibited a critical tipping point between KA and AS, with links decreasing by 59.5% and 57.5%, respectively, coinciding with the transition from moderate to severe degradation.
3.4. Drivers of Microbial Co-Occurrence Network Changes
To disentangle the direct and indirect pathways linking degradation to microbial network simplification, we constructed PLS-SEM linking vegetation biomass, soil properties (pH and EC), microbial diversity (α- and β-diversity), and network complexity (average degree) for both bacterial and fungal communities (Figure 4). The models explained 74% and 68% of variance in bacterial and fungal network properties, respectively. For bacterial networks, soil pH (β = -0.38, P < 0.01) and EC (β = -0.31, P < 0.05) exerted strong negative direct effects on network complexity, while vegetation biomass had a positive direct effect (β = 0.29, P < 0.05). Soil properties also indirectly affected bacterial networks through suppression of α-diversity (pH → α-diversity: β = -0.44, P < 0.001; EC → α-diversity: β = -0.33, P < 0.01), which in turn positively influenced network complexity (β = 0.36, P < 0.01). This indirect pathway accounted for approximately 35% of the total effect of soil degradation on bacterial networks, highlighting the mediating role of diversity loss.
For fungal networks, soil pH (β = -0.42, P < 0.01) and EC (β = -0.28, P < 0.05) again had strong negative direct effects on network complexity, but the indirect pathway via α-diversity was weaker (α-diversity → Net property: β = 0.21, P < 0.05), and vegetation biomass showed no significant effect (β = 0.14, P = 0.21). Instead, β-diversity exerted a stronger direct negative effect on fungal network complexity (β = -0.34, P < 0.01), indicating that fungal networks were more directly responsive to community compositional turnover along the degradation gradient. Overall, the SEM results reveal that soil alkalization and salinization were the primary drivers of network simplification for both groups, with bacteria more susceptible to diversity-mediated indirect effects while fungi responded more strongly to direct environmental filtering and compositional shifts.
4. Discussion
4.1. Soil Alkalization and Salt Accumulation as Primary Environmental Filters
Our results demonstrated that soil pH and electrical conductivity (EC) were the strongest environmental filters shaping microbial community composition and network structure along the degradation gradient. The dramatic increase in pH from 8.05 (ML) to 10.01 (AS) and the 235-fold increase in Na⁺ concentration from LH to AS represent the most pronounced edaphic responses to degradation. These findings align with studies in the Songnen alkaline salt-degraded grassland, where EC, pH, and available phosphorus (AP) were identified as the main drivers of soil bacterial community composition, while EC, pH, and soil organic carbon (SOC) primarily drove fungal community composition[27]. The extreme alkaline conditions (pH > 9.5) in KA, AS, and CV stages likely impose strong physiological constraints on microbial taxa, as high pH disrupts cellular homeostasis and enzyme activity.
The systematic increase in the relative abundance of Actinobacteria, Firmicutes, Gemmatimonadetes, and Deinococcus–Thermus along the degradation gradient, coupled with the decline of Acidobacteria and Nitrospirae, provides compelling evidence for salt-driven selection. Studies in saline environments have consistently identified Actinobacteria and Deinococcus–Thermus as halotolerant phyla that thrive under salt stress[31,32]. Deinococcus–Thermus, which increased dramatically under severe degradation, is a phylum of extremophiles with exceptional resistance to radiation, desiccation, and oxidative stress, making it a strong candidate as a bioindicator of severe degradation. Previous research on crude oil-contaminated saline soils has also identified Actinobacteria, Firmicutes, and Deinococcus–Thermus as dominant bacteria participating in degradation under dual stresses of salinization and contamination[33]. Conversely, Acidobacteria, typically oligotrophic and adapted to acidic or neutral pH, declined sharply under alkaline conditions, consistent with their documented sensitivity to high pH. This compositional shift from copiotrophic to stress-tolerant strategists mirrors the "environmental filtering" paradigm, wherein abiotic conditions selectively eliminate poorly adapted taxa.
4.2. Divergent Diversity Responses: Bacterial Unimodality Versus Fungal Monotonic Decline
A striking finding of this study was the contrasting alpha diversity patterns between bacteria and fungi along the degradation gradient. Bacterial Shannon diversity exhibited a hump-shaped (unimodal) response, peaking at the moderately degraded KA stage, whereas fungal Shannon diversity decreased monotonically along the gradient. This divergence underscores fundamental differences in the ecological strategies and environmental sensitivities of these two microbial kingdoms.
The unimodal bacterial response can be explained by the intermediate disturbance hypothesis and the ecotone effect observed in salinity gradients. Studies on planktonic protists have demonstrated maximum species richness in the challenging zone of critical salinity 5–8‰, where small, fast-developing unicellular organisms benefit from relative vacancy of ecological niches and impaired competitiveness of larger organisms[34,35]. Moderate degradation (KA stage) introduces environmental heterogeneity—increased salinity and pH, reduced but not eliminated plant cover, and altered resource inputs—which may create novel niches and reduce competitive exclusion, thereby promoting bacterial diversity. However, as degradation intensifies beyond a critical threshold (the AS–CV transition), environmental stress exceeds the physiological tolerance of most taxa, leading to a sharp decline in diversity. Studies in the Songnen Plain have confirmed that saline-alkali degradation has a negative effect on microbial biodiversity, with different degradation gradients exhibiting different adaptability and tolerance species[27].
In stark contrast, fungal diversity declined consistently with increasing degradation, indicating that fungi are more sensitive to degradation than bacteria. This differential sensitivity can be attributed to several mechanisms. First, fungi, particularly mycorrhizal species, depend on living plant hosts for carbon substrates and are thus directly affected by vegetation degradation. Second, fungal hyphae are physically more vulnerable to soil structural disruption and desiccation than bacterial cells. Third, fungi generally lack the sophisticated osmoregulatory mechanisms found in many salt-tolerant bacteria. Studies on alpine cushion plant degradation have similarly found that fungal networks exhibited greater stability than bacterial networks, with bacterial networks being more vulnerable to environmental changes[36]. The progressive decline in plant diversity and biomass along the gradient, coupled with the loss of litter inputs, likely reduced the diversity of fungal substrates, as fungi are more dependent on plant-derived organic matter than bacteria. Thus, fungal communities may serve as more sensitive bioindicators of grassland degradation.
4.3. Network Responses to Degradation: Complexity Decline and Cooperative Shifts
Our co-occurrence network analysis revealed that both bacterial and fungal networks exhibited a unimodal pattern of complexity along the degradation gradient, peaking at KA and collapsing at AS for most topological parameters (nodes, links, average degree). This pattern mirrors the bacterial diversity response and indicates that moderate degradation may temporarily increase network complexity—possibly through increased niche differentiation and resource partitioning—while severe degradation leads to network simplification. The dramatic reductions in links from KA to AS (bacteria: -59.5%; fungi: -57.5%) suggest a critical ecological threshold between moderate and severe degradation stages. Studies on alpine cushion plant degradation have similarly identified nonlinear thresholds in network complexity at key degradation stages, where fungal networks reorganized while bacterial networks simplified[36].
However, despite the decrease in overall complexity, we observed a consistent increase in the proportion of positive correlations and the clustering coefficient in networks from LH to SD. This pattern indicates that surviving microbial taxa tend to enhance cooperation under extreme degradation stress. This finding aligns with the stress gradient hypothesis (SGH), which posits that positive interactions become more prevalent under harsh environmental conditions as organisms cooperate to mitigate stress[37,38]. In saline-alkaline soils, microbes may engage in metabolite exchange, synergistic degradation of complex substrates, or shared production of extracellular polymeric substances to create protective biofilms. Recent studies in saline-alkali agroecosystems have confirmed that co-occurrence networks exhibit a rise in both overall and cross-kingdom positive correlations with increasing saline-alkali stress, supporting the SGH at the microbial scale[39]. Notably, significant increases in positive correlations were observed between viruses and fungi, and between viruses and bacteria, while within-kingdom positive correlations declined, suggesting intensified intra-kingdom competition under stress[39].
However, studies in saline ephemeral lakes have found that while competition decreased along salinity gradients, stress-promoted facilitation was not consistently observed, suggesting that the application of SGH may depend on ecosystem type and stressor characteristics[39]. In those systems, co-exclusions decreased along the salinity gradient, indicating reduced competition, but co-occurrences remained stable, suggesting a potential lack of facilitation processes[40]. This highlights that network complexity (number of links, nodes) and network "tightness" (clustering, positive edge ratio) may respond in opposite directions, emphasizing the necessity of using multiple topological metrics to capture the full spectrum of network responses.
4.4. Distinct Drivers of Bacterial and Fungal Networks: Direct Versus Indirect Pathways
Our SEM results provided mechanistic insights into the differential regulation of bacterial and fungal networks. For bacterial networks, soil pH and EC exerted both strong direct negative effects and significant indirect effects through the suppression of α-diversity. This indicates that bacterial networks are influenced by a dual pathway: direct physiological constraints imposed by alkaline-saline stress, and indirect effects mediated by diversity loss. Research on Songnen alkaline salt-degraded grassland has confirmed that soil pH and EC are key drivers shaping bacterial community composition, with different microorganisms affected by different soil properties[27].
For fungal networks, the direct effects of pH and EC were even stronger, while the indirect pathway via α-diversity was weaker, and vegetation biomass showed no significant effect. Instead, β-diversity exerted a stronger direct negative effect on fungal network complexity. This suggests that fungal networks are more directly responsive to environmental filtering and compositional shifts rather than diversity-mediated cascades. In the Songnen Plain, EC, pH, and SOC were identified as the main drivers of soil fungal community composition, while AP primarily drove bacterial communities. Studies on revegetation have also shown that soil chemical properties such as pH and EC correlated with symbiotic fungi-dominated modules, while both soil aggregate stability and chemical properties were linked to pathogenic fungi-dominated modules[27]. These findings indicate that fungal trophic modes govern species-dependent responses via modular soil–microbe linkages.
The decoupling of fungal networks from aboveground biomass in our results is surprising given the documented dependence of mycorrhizal fungi on plant carbon. However, in heavily degraded stages (AS and CV), the near-complete loss of vegetation likely eliminated the responsive fungal taxa, leaving only saprotrophic and stress-tolerant species that are less dependent on live plants. Overall, these contrasting pathways suggest that bacterial networks are more susceptible to diversity-mediated indirect effects, while fungal networks respond more strongly to direct environmental filtering and compositional displacement.
4.5. Ecological Implications and the Potential for Microbial Indicators of Grassland Degradation
Our findings have several important implications for grassland management and restoration. First, the critical threshold identified between KA and AS stages (for both diversity and network structure) suggests that intervention strategies should prioritize preventing degradation from progressing beyond moderate severity. Once the AS stage is reached, microbial networks become severely simplified and may not recover spontaneously, potentially leading to long-term functional impairment. Studies on alpine cushion plant degradation have similarly proposed a vulnerability-focused management framework that prioritizes protecting bacterial network integrity and targets pre-threshold stages as intervention windows[36].
Second, the divergent responses of bacterial and fungal communities suggest that fungi—particularly their diversity and network properties—could serve as more sensitive bioindicators of grassland degradation than bacteria. The consistent decline in fungal α-diversity along the gradient and the earlier collapse of fungal networks make them promising candidates for monitoring soil health. Soil fungal community characteristics have been proposed as indicators of soil quality and health in degraded grasslands[41]. Moreover, the extreme enrichment of Deinococcus–Thermus in SD soils highlights this phylum as a potential indicator of severe degradation, consistent with its known role as a stress-resistant phylum in saline environments[42].
Third, the observed increase in positive interactions under severe degradation suggests that microbial communities may develop alternative stability mechanisms—such as functional redundancy and cooperative networks—to maintain essential functions even under extreme stress. Studies have shown that complex networks with higher modularity reduce the propagation of potential perturbations, limiting their effect on the community as a whole[43]. This underscores the importance of maintaining microbial interaction networks, rather than merely preserving species diversity, in restoration efforts. Restoration strategies that promote positive microbial interactions (e.g., through inoculation of beneficial consortia or organic amendments that foster cooperation) may accelerate recovery of degraded soils.
Finally, our study highlights the need to incorporate network-level properties into routine soil quality assessments. Traditional indicators based solely on diversity or biomass may not fully capture the functional integrity of microbial communities. Network metrics such as average degree, modularity, and the ratio of positive to negative edges could provide complementary information about ecosystem resilience and stability. As high-throughput sequencing becomes increasingly accessible, integrating network analysis into monitoring frameworks holds promise for advancing ecosystem management[44].
5. Conclusions
This study systematically investigated the responses of soil bacterial and fungal communities to grassland degradation along a five-stage gradient in the Songnen meadow steppe. Our findings reveal that bacterial and fungal communities exhibit fundamentally different response patterns, with bacterial α-diversity showing a unimodal trajectory while fungal diversity declined monotonically, indicating that fungi are more sensitive indicators of degradation stress. Co-occurrence network analysis revealed that network complexity followed a unimodal pattern for both kingdoms, peaking at moderate degradation (KA) and collapsing at severe degradation (AS), revealing a critical ecological threshold between these stages. Notably, the increased proportion of positive correlations under severe degradation suggests that microorganisms strengthen cooperative interactions to cope with environmental stress. Structural equation modeling further elucidated distinct regulatory mechanisms: bacterial networks were governed by both direct environmental filtering and indirect diversity-mediated effects, whereas fungal networks responded more strongly to direct pH/EC constraints and compositional shifts. Our findings highlight the importance of integrating network-level properties into degradation monitoring frameworks and provide a theoretical foundation for developing microbial indicators for grassland restoration and management.
Author Contributions
Conceptualization, Guangyin Li and Jinlong Wang; methodology, Guangyin Li, Di Shang and Zhendong Jiang; software, Zhendong Jiang; validation, Guangyin Li, Di Shang and Zhendong Jiang; formal analysis, Guangyin Li; investigation, Di Shang and Zhendong Jiang; resources, Bingbo Ni; data curation, Guangyin Li and Zhendong Jiang; writing—original draft preparation, Guangyin Li; writing—review and editing, Bingbo Ni and Jinlong Wang; visualization, Zhendong Jiang; supervision, Bingbo Ni; project administration, Jinwei Zhang; funding acquisition, Jinlong Wang. All authors have read and agreed to the published version of the manuscript.
Funding
This research was funded by the National Natural Science Foundation of China, grant numbers U24A205855, U25A20761 and 42301130. The APC was funded by the National Natural Science Foundation of China. Scientific Research Project of Heilongjiang Ecological Environment Protection, Department of Ecology and Environment of Heilongjiang Province, and the Science (Grant No. HST2024ST007) and Technology Project of the Education Department of Jilin Province (Grant No. JJKH20261186KJ).
Data Availability Statement
The original contributions presented in this study are included in the article. Further inquiries can be directed to the corresponding author.
Conflicts of Interest
The authors declare that they have no known competing financial interests or personal relationships that could have appeared to influence the work reported in this paper.
References
- Gibson, D.J. Grasses and grassland ecology; Oxford University Press, 2009. [Google Scholar]
- Petermann, J.S.; Buzhdygan, O.Y. Grassland biodiversity. Curr. Biol. 2021, 31, R1195–R1201. [Google Scholar] [CrossRef] [PubMed]
- Lu, X. Degraded grassland vegetation and soil characteristics: Challenges, opportunities, and sustainable development. Adv. Resour. Res. 2024, 4, 205–220. [Google Scholar] [CrossRef]
- Bardgett, R.D.; Bullock, J.M.; Lavorel, S.; Manning, P.; Schaffner, U.; Ostle, N.; Chomel, M.; Durigan, G.; Fry, L.; Johnson, E. Combatting global grassland degradation. Nat. Rev. Earth Environ. 2021, 2, 720–735. [Google Scholar] [CrossRef]
- Brown, C.G. Sustainable development in western China: managing people, livestock and grasslands in pastoral areas. In Sustainable Development in Western China; Edward Elgar Publishing, 2008. [Google Scholar]
- Bryan, B.A.; Gao, L.; Ye, Y.; Sun, X.; Connor, J.D.; Crossman, N.D.; Stafford-Smith, M.; Wu, J.; He, C.; Yu, D. China’s response to a national land-system sustainability emergency. Nature 2018, 559, 193–204. [Google Scholar] [CrossRef] [PubMed]
- Li, L.; Chen, J.; Han, X.; Zhang, W.; Shao, C. Meadow Grassland Ecosystem. In Grassland Ecosystems of China: A Synthesis and Resume; Springer, 2020; pp. 455–514. [Google Scholar]
- Du, Y.; Yang, Y.; Wu, S.; Gao, X.; He, X.; Dong, S. Core microbes regulate plant-soil resilience by maintaining network resilience during long-term restoration of alpine grasslands. Nat. Commun. 2025, 16, 3116. [Google Scholar] [CrossRef] [PubMed]
- Pedrinho, A.; Mendes, L.W.; de Araujo Pereira, A.P.; Araujo, A.S.F.; Vaishnav, A.; Karpouzas, D.G.; Singh, B.K. Soil microbial diversity plays an important role in resisting and restoring degraded ecosystems. Plant Soil 2024, 500, 325–349. [Google Scholar] [CrossRef]
- Compant, S.; Cassan, F.; Kostić, T.; Johnson, L.; Brader, G.; Trognitz, F.; Sessitsch, A. Harnessing the plant microbiome for sustainable crop production. Nat. Rev. Microbiol. 2025, 23, 9–23. [Google Scholar] [PubMed]
- Koshila Ravi, R.; Balachandar, M.; Yuvarani, S.; Anaswara, S.; Pavithra, L.; Muthukumar, T. Arbuscular mycorrhiza in sustainable plant nitrogen nutrition: mechanisms and impact. In Soil Nitrogen Ecology; Springer, 2021; pp. 407–436. [Google Scholar]
- Trivedi, P.; Delgado-Baquerizo, M.; Anderson, I.C.; Singh, B.K. Response of soil properties and microbial communities to agriculture: Implications for primary productivity and soil health indicators. Front. Plant Sci. 2016, 7, 990. [Google Scholar] [CrossRef] [PubMed]
- Muscolo, A.; Settineri, G.; Attinà, E. Early warning indicators of changes in soil ecosystem functioning. Ecol. Indic. 2015, 48, 542–549. [Google Scholar] [CrossRef]
- Yuan, X.L.; Zhu, X.T.; Shi, Y.; Miao, Y.; Zhang, R.G.; Li, P.; Shen, C. Soil microbiomes in degraded grasslands: Assembly, function, and application. Grassl. Res. 2025, 4, 352–365. [Google Scholar] [CrossRef]
- Qiao, X.; Yan, X.; Dong, C.; Tao, L.; Aili, A.; Waheed, A. From microbiome collapse to recovery: a roadmap for microbiome-informed grassland restoration under global change. Front. Microbiol. 2026, 17, 1741287. [Google Scholar] [CrossRef] [PubMed]
- Gralka, M.; Szabo, R.; Stocker, R.; Cordero, O.X. Trophic interactions and the drivers of microbial community assembly. Curr. Biol. 2020, 30, R1176–R1188. [Google Scholar] [CrossRef] [PubMed]
- Oña, L.; Shreekar, S.K.; Kost, C. Disentangling microbial interaction networks. Trends Microbiol. 2025, 33, 619–634. [Google Scholar] [CrossRef] [PubMed]
- Delmas, E.; Besson, M.; Brice, M.H.; Burkle, L.A.; Dalla Riva, G.V.; Fortin, M.J.; Gravel, D.; Guimarães, P.R., Jr.; Hembry, D.H.; Newman, E.A. Analysing ecological networks of species interactions. Biol. Rev. 2019, 94, 16–36. [Google Scholar] [PubMed]
- Aquilué, N.; Filotas, É.; Craven, D.; Fortin, M.J.; Brotons, L.; Messier, C. Evaluating forest resilience to global threats using functional response traits and network properties. Ecol. Appl. 2020, 30, e02095. [Google Scholar] [CrossRef] [PubMed]
- Wu, Z.; Cheng, S.; Xu, K.; Qian, Y. Ecological network resilience evaluation and ecological strategic space identification based on complex network theory: A case study of Nanjing city. Ecol. Indic. 2024, 158, 111604. [Google Scholar] [CrossRef]
- Keyes, A.A.; McLaughlin, J.P.; Barner, A.K.; Dee, L.E. An ecological network approach to predict ecosystem service vulnerability to species losses. Nat. Commun. 2021, 12, 1586. [Google Scholar] [CrossRef] [PubMed]
- Sole, R.V.; Montoya, M. Complexity and fragility in ecological networks. Proc. R. Soc. London. Ser. B Biol. Sci. 2001, 268, 2039–2045. [Google Scholar] [CrossRef]
- Tong, A.; Zhou, Y.; Chen, T.; Qu, Z. Constructing an ecological spatial network optimization framework from the pattern–process–function perspective: A case study in Wuhan. Remote Sens. 2025, 17, 2548. [Google Scholar] [CrossRef]
- Wu, Y.; Liang, A.; Ding, M.; Zhang, H.; Xu, H.; Zhang, Y. Meadow degradation reduces microbial β diversity and network complexity while enhancing network stability. Appl. Soil Ecol. 2024, 204, 105733. [Google Scholar] [CrossRef]
- Guo, P.; Guo, W.; Hao, B.; Zhang, Z.; Lu, C.; Liu, T.; Ding, S.; Zhao, L.; Cheng, J.; Li, F.Y. Microbial community in the Leymus chinensis rhizosphere associates with its high production in mild saline–alkaline grassland. Land Degrad. Dev. 2023, 34, 5788–5804. [Google Scholar] [CrossRef]
- Yang, R.; Qi, Z.; Yang, T.; Li, Y.; Xu, L. Distinct bacterial and fungal coexistence patterns and their associations with grassland productivity on the Tibetan Plateau. Agric. Ecosyst. Environ. 2026, 397, 110076. [Google Scholar] [CrossRef]
- Bai, Z.; Jia, A.; Li, H.; Wang, M.; Qu, S. Explore the soil factors driving soil microbial community and structure in Songnen alkaline salt degraded grassland. Front. Plant Sci. 2023, 14, 1110685. [Google Scholar] [CrossRef] [PubMed]
- Wang, S.; Sun, L.; Ling, N.; Zhu, C.; Chi, F.; Li, W.; Hao, X.; Zhang, W.; Bian, J.; Chen, L. Exploring soil factors determining composition and structure of the bacterial communities in saline-alkali soils of Songnen Plain. Front. Microbiol. 2020, 10, 2902. [Google Scholar] [CrossRef] [PubMed]
- Liu, M.; Zhang, F.; Xu, J.; Ding, Y.; Zhang, N. Soil microbial community responses to alpine meadow degradation in Maqu: implications for semi-arid ecosystem restoration. J. Arid Environ. 2026, 234, 105580. [Google Scholar] [CrossRef]
- Ding, J.; Wang, Y.; Yu, S. Divergent Assembly of Bacteria and Fungi During Saline–Alkali Wetland Degradation. Biology 2025, 15, 61. [Google Scholar] [CrossRef] [PubMed]
- Abdelkader, M.S.; Abdalla, S.; Abdelrahman, A.A.; Amin, I.A.; Ramadan, M.; Salah, M. Irrigation water quality shapes soil microbiomes: a 16 S rRNA-based biogeographic study in arid ecosystems. Sci. Rep. 2025, 15, 28460. [Google Scholar] [CrossRef] [PubMed]
- Genderjahn, S.; Alawi, M.; Mangelsdorf, K.; Horn, F.; Wagner, D. Desiccation-and saline-tolerant bacteria and archaea in kalahari pan sediments. Front. Microbiol. 2018, 9, 2082. [Google Scholar] [CrossRef] [PubMed]
- Gao, Y.-c.; Wang, J.-n.; Guo, S.-h.; Hu, Y.-L.; Li, T.-t.; Mao, R.; Zeng, D.-H. Effects of salinization and crude oil contamination on soil bacterial community structure in the Yellow River Delta region, China. Appl. Soil Ecol. 2015, 86, 165–173. [Google Scholar] [CrossRef]
- Telesh, I.; Schubert, H.; Skarlato, S. Life in the salinity gradient: discovering mechanisms behind a new biodiversity pattern. Estuar. Coast. Shelf Sci. 2013, 135, 317–327. [Google Scholar] [CrossRef]
- Skarlato, S.O.; Telesh, I.V.; Matantseva, O.V.; Pozdnyakov, I.A.; Berdieva, M.A.; Schubert, H.; Filatova, N.A.; Knyazev, N.A.; Pechkovskaya, S.A. Studies of bloom-forming dinoflagellates Prorocentrum minimum in fluctuating environment: contribution to aquatic ecology, cell biology and invasion theory. Protistology 2018, 12, 113–157. [Google Scholar] [CrossRef]
- Yin, M.; Ye, Y.; Liu, X.; Xiong, W.; Liu, S.; Sun, H.; Sun, W.; Zhang, Y. Divergent Responses of Microbial Networks to Global Change Scenarios during Alpine Cushion Plant Degradation. Plant Divers. 2026. [Google Scholar] [CrossRef]
- Bertness, M.D.; Cavieres, L.A.; Lortie, C.; Callaway, R.M. Positive interactions and interdependence in communities. Trends Ecol. Evol. 2024, 39, 1014–1023. [Google Scholar] [CrossRef] [PubMed]
- He, Q.; Bertness, M.D. Extreme stresses, niches, and positive species interactions along stress gradients. Ecology 2014, 95, 1437–1443. [Google Scholar] [CrossRef] [PubMed]
- Li, F.; Wu, L.; Xu, C.; Guo, S.; Zhao, J.; Wang, Y.; Li, P.; Zhu, B. Virus-inclusive microbial network relationships align with the stress gradient hypothesis in saline-alkali agroecosystems. Soil Biol. Biochem. 2026, 216, 110123. [Google Scholar] [CrossRef]
- Menéndez-Serra, M.; Ontiveros, V.J.; Barberán, A.; Casamayor, E.O. Absence of stress-promoted facilitation coupled with a competition decrease in the microbiome of ephemeral saline lakes. 2022. [Google Scholar] [CrossRef] [PubMed]
- Wu, X.; Yang, J.; Ruan, H.; Wang, S.; Yang, Y.; Naeem, I.; Wang, L.; Liu, L.; Wang, D. The diversity and co-occurrence network of soil bacterial and fungal communities and their implications for a new indicator of grassland degradation. Ecol. Indic. 2021, 129, 107989. [Google Scholar] [CrossRef]
- Hira, P.; Bajaj, A.; Puri, A.; Talwar, C.; Khurana, H.; Negi, R.; Singh, Y.; Lal, R.; Shakarad, M. Microbial genomics and metagenomics in India: explorations and perspectives. In Proceedings of the Proc Indian Natl Sci Acad, 2019; pp. 999–1023. [Google Scholar]
- Gilarranz, L.J.; Rayfield, B.; Liñán-Cembrano, G.; Bascompte, J.; Gonzalez, A. Effects of network modularity on the spread of perturbation impact in experimental metapopulations. Science 2017, 357, 199–201. [Google Scholar] [CrossRef] [PubMed]
- Cordier, T.; Alonso-Sáez, L.; Apothéloz-Perret-Gentil, L.; Aylagas, E.; Bohan, D.A.; Bouchez, A.; Chariton, A.; Creer, S.; Frühe, L.; Keck, F. Ecosystems monitoring powered by environmental genomics: a review of current strategies with an implementation roadmap. Mol. Ecol. 2021, 30, 2937–2958. [Google Scholar] [CrossRef] [PubMed]
Figure 2.
Co-occurrence networks of bacterial and fungal communities across five degradation stages. Nodes represent microbial genera, with node size proportional to degree. LH, Leymus chinensis grassland (non-degraded); ML, mixed forbs (lightly degraded); KA, Artemisia anethifolia (moderately degraded); AS, Artemisia + Suaeda/Kochia (severely degraded); CV, bare crust (extremely degraded).
Figure 2.
Co-occurrence networks of bacterial and fungal communities across five degradation stages. Nodes represent microbial genera, with node size proportional to degree. LH, Leymus chinensis grassland (non-degraded); ML, mixed forbs (lightly degraded); KA, Artemisia anethifolia (moderately degraded); AS, Artemisia + Suaeda/Kochia (severely degraded); CV, bare crust (extremely degraded).
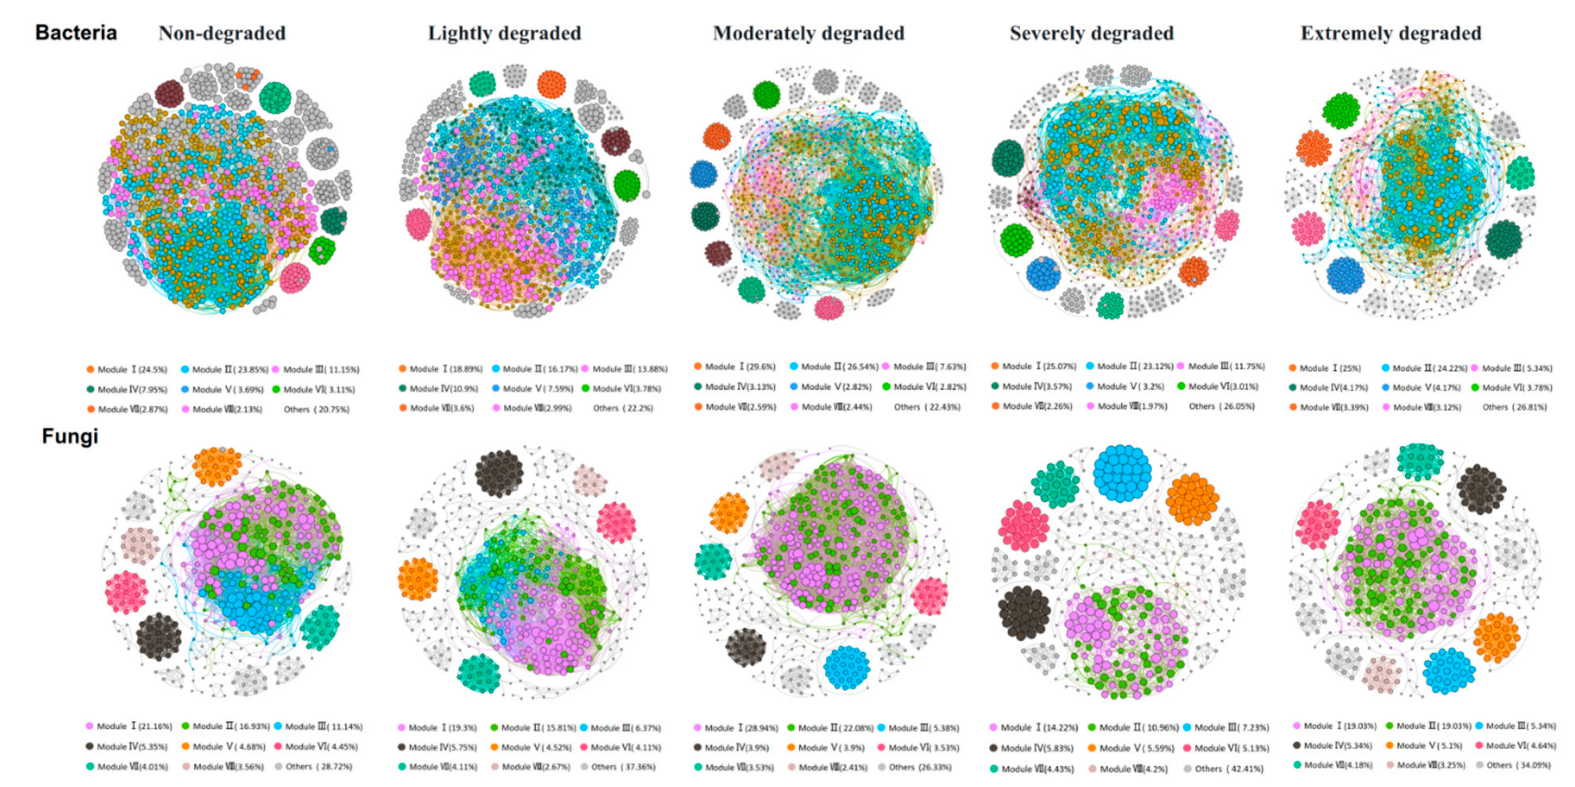
Figure 3.
Co-occurrence networks of soil bacterial (a) and fungal (b) communities across five degradation stage. LH, Leymus chinensis grassland (non-degraded); ML, mixed forbs (lightly degraded); KA, Artemisia anethifolia (moderately degraded); AS, Artemisia + Suaeda/Kochia (severely degraded); CV, bare crust (extremely degraded).
Figure 3.
Co-occurrence networks of soil bacterial (a) and fungal (b) communities across five degradation stage. LH, Leymus chinensis grassland (non-degraded); ML, mixed forbs (lightly degraded); KA, Artemisia anethifolia (moderately degraded); AS, Artemisia + Suaeda/Kochia (severely degraded); CV, bare crust (extremely degraded).
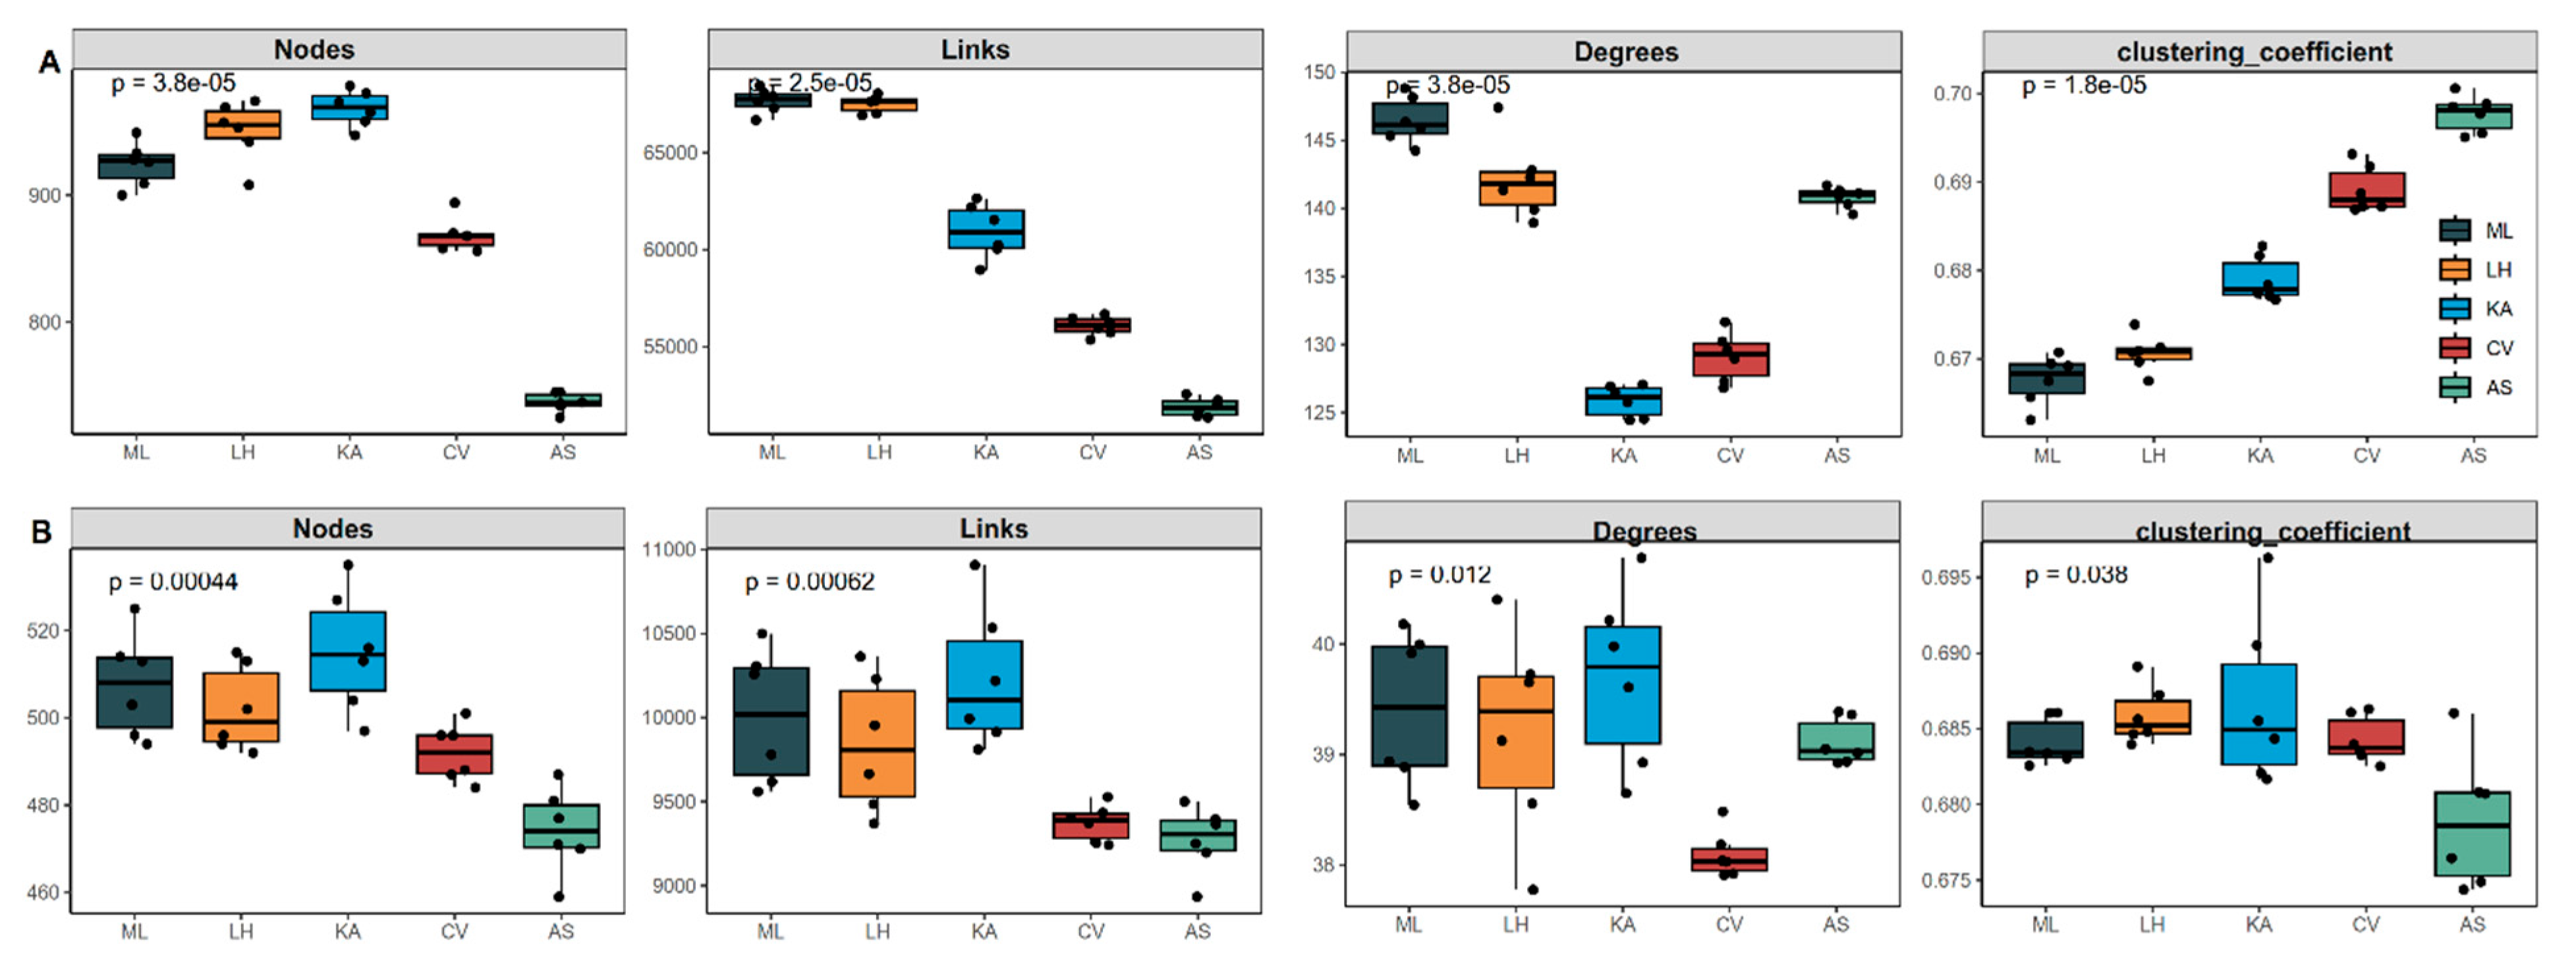
Figure 4.
Structural equation models (SEM) showing direct and indirect effects of environmental drivers on microbial network properties for bacteria (a) and fungi (b). Blue and red arrows indicate positive and negative relationships, respectively. Arrow width is proportional to standardized path coefficients (β). Numbers adjacent to arrows represent significant standardized path coefficients (*P < 0.05, **P < 0.01, ***P < 0.001). Dashed arrows indicate non-significant paths (P > 0.05). R² values denote the proportion of variance explained for each endogenous variable. EC, electrical conductivity; α-diversity, Shannon diversity index; β-diversity, community compositional dissimilarity (NMDS1); Net property, average degree of co-occurrence networks.
Figure 4.
Structural equation models (SEM) showing direct and indirect effects of environmental drivers on microbial network properties for bacteria (a) and fungi (b). Blue and red arrows indicate positive and negative relationships, respectively. Arrow width is proportional to standardized path coefficients (β). Numbers adjacent to arrows represent significant standardized path coefficients (*P < 0.05, **P < 0.01, ***P < 0.001). Dashed arrows indicate non-significant paths (P > 0.05). R² values denote the proportion of variance explained for each endogenous variable. EC, electrical conductivity; α-diversity, Shannon diversity index; β-diversity, community compositional dissimilarity (NMDS1); Net property, average degree of co-occurrence networks.
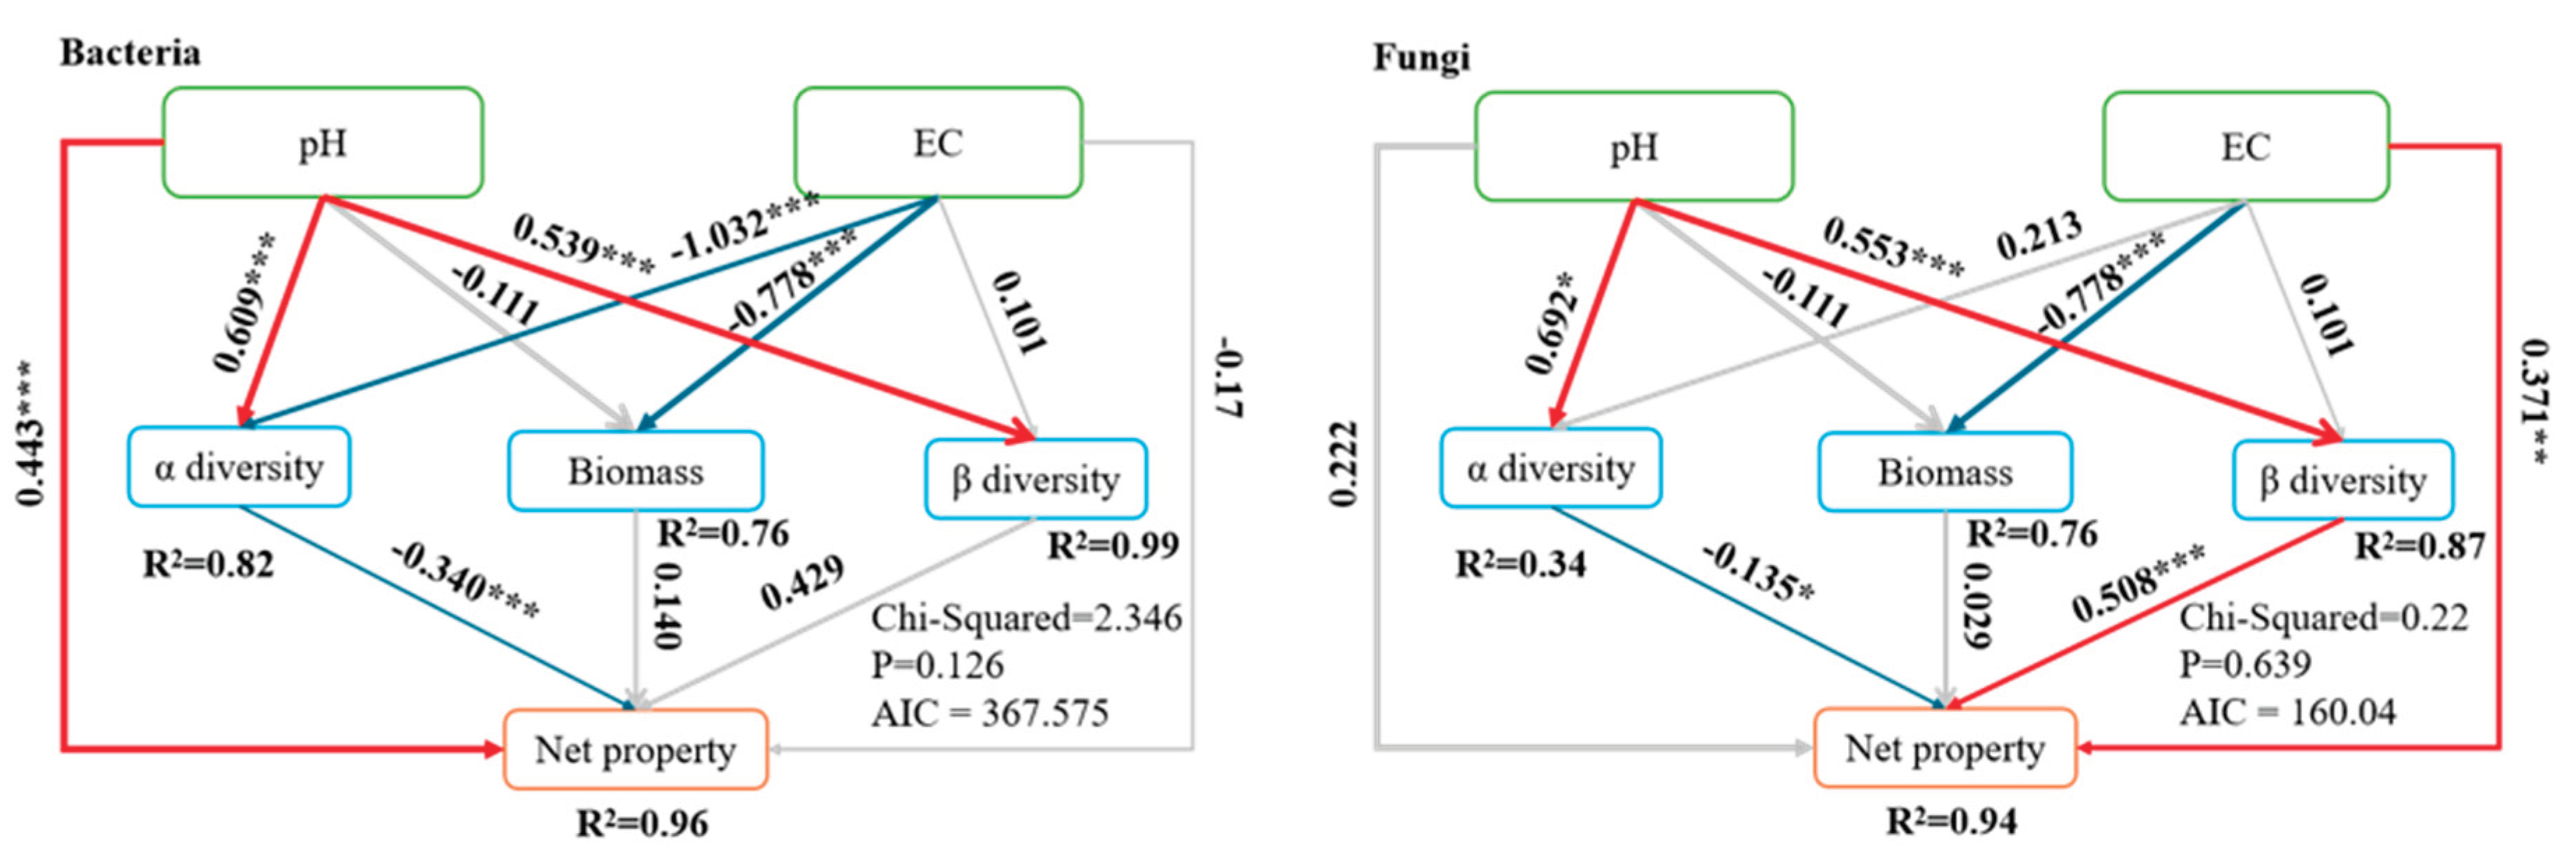

Table 1.
Soil physicochemical properties along the grassland degradation gradient.
| Variable | ML | LH | KA | CV | AS |
| pH | 8.05 ± 0.06c | 8.38 ± 0.15b | 9.70 ± 0.12a | 9.86 ± 0.09a | 10.01 ± 0.06a |
| CO₃²⁻ | 0.00 ± 0.00d | 0.00 ± 0.00d | 0.18 ± 0.07c | 0.42 ± 0.11b | 1.05 ± 0.16a |
| HCO₃⁻ | 0.39 ± 0.05d | 0.58 ± 0.06c | 3.59 ± 0.68b | 5.23 ± 0.65a | 3.82 ± 0.53b |
| Cl⁻ | 0.006 ± 0.002d | 0.008 ± 0.003d | 0.057 ± 0.038c | 0.106 ± 0.039b | 0.293 ± 0.108a |
| SO₄²⁻ | 0.005 ± 0.001d | 0.006 ± 0.001d | 0.053 ± 0.045c | 0.091 ± 0.024b | 0.397 ± 0.089a |
| Na⁺ | 0.010 ± 0.008d | 0.008 ± 0.002d | 0.800 ± 0.201c | 1.410 ± 0.232b | 1.880 ± 0.283a |
| K⁺ | 0.033 ± 0.008c | 0.040 ± 0.013b | 0.460 ± 0.092a | 0.880 ± 0.285a | 0.490 ± 0.186a |
| Mg²⁺ | 0.014 ± 0.004c | 0.014 ± 0.004c | 0.162 ± 0.032b | 0.166 ± 0.024b | 0.142 ± 0.028b |
| Ca²⁺ | 0.110 ± 0.021c | 0.110 ± 0.012c | 0.380 ± 0.062b | 0.480 ± 0.083a | 0.250 ± 0.034b |
| NH₄⁺ | 2.23 ± 0.29b | 2.66 ± 0.19a | 2.12 ± 0.22b | 2.47 ± 0.14a | 2.21 ± 0.19b |
| NO₃⁻ | 2.58 ± 0.42c | 2.26 ± 0.95c | 3.15 ± 3.02b | 5.53 ± 0.89a | 38.20 ± 12.58d |
| Available P | 5.79 ± 1.12b | 4.70 ± 1.42b | 10.47 ± 2.34a | 11.44 ± 1.85a | 28.91 ± 5.67c |
| SOC | 9.14 ± 0.47a | 10.01 ± 0.24a | 7.70 ± 0.31b | 6.68 ± 0.41c | 6.24 ± 0.32c |
Notes: Different lowercase letters indicate significant differences among treatments (P < 0.05). ML, lightly degraded grassland; LH, moderately degraded grassland; KA, heavily degraded grassland; CV, severely degraded grassland; AS, bare land.
Table 2.
Bacterial and fungal α- and β-diversity across degradation stages (mean ± SD).
| Category | Diversity Index | ML | LH | KA | CV | AS |
| Bacterial α-diversity | sobs | 791.67±19.74a | 848.00±36.98b | 888.83±26.55b | 734.00±10.60c | 500.17±17.12c |
| shannon | 5.32±0.09 a | 5.36±0.13 ab | 5.44±0.03 b | 5.01±0.09 c | 4.59±0.04 d | |
| simpson | 0.01±0.00 a | 0.01±0.00 ab | 0.01±0.00 ab | 0.02±0.00 c | 0.02±0.00 d | |
| ace | 978.81±40.09 a | 1056.39±52.42 b | 1112.33±53.37 b | 926.00±34.62 a | 646.13±36.39 c | |
| chao | 983.98±50.85 a | 1064.54±55.43 b | 1114.19±61.30 b | 942.51±57.33 a | 653.42±65.92 c | |
| Bacterial β-diversity | MDS1 | -0.53±0.01 a | -0.50±0.05 a | -0.02±0.07 b | 0.27±0.04 c | 0.78±0.05 d |
| MDS2 | -0.15±0.01 a | -0.03±0.03 c | 0.15±0.09 b | 0.23±0.06 b | -0.20±0.07 a | |
| Fungal α-diversity | sobs | 315.17±25.86 a | 288.67±18.33 a | 334.17±25.67 a | 252.00±13.30 b | 239.33±17.82 b |
| shannon | 3.21±0.55 ab | 2.43±0.25 c | 3.78±0.18 b | 3.29±0.02 a | 3.39±0.13 a | |
| simpson | 0.11±0.06 ab | 0.24±0.04 c | 0.05±0.01 a | 0.08±0.00 b | 0.08±0.02 b | |
| ace | 391.32±32.98 ab | 343.93±23.99 a | 384.37±28.89 b | 287.32±20.59 c | 250.81±15.55 d | |
| chao | 385.70±30.40 ab | 345.45±25.85 a | 383.98±26.77 b | 284.79±22.41 c | 255.17±18.67 d | |
| Fungal β-diversity | MDS1 | -0.53±0.01 a | -0.76±0.04 b | -0.02±0.23 c | 0.57±0.13 d | 0.74±0.09 e |
| MDS2 | -0.26±0.02 a | 0.07±0.03 b | 0.23±0.06 c | 0.32±0.06 d | -0.36±0.06 e |
Different letters within a row indicate significant differences (P < 0.05, Tukey's HSD).
Disclaimer/Publisher’s Note: The statements, opinions and data contained in all publications are solely those of the individual author(s) and contributor(s) and not of MDPI and/or the editor(s). MDPI and/or the editor(s) disclaim responsibility for any injury to people or property resulting from any ideas, methods, instructions or products referred to in the content. |
© 2026 by the authors. Licensee MDPI, Basel, Switzerland. This article is an open access article distributed under the terms and conditions of the Creative Commons Attribution (CC BY) license.
Copyright: This open access article is published under a Creative Commons CC BY 4.0 license, which permit the free download, distribution, and reuse, provided that the author and preprint are cited in any reuse.


