

Submitted:
10 July 2026
Posted:
13 July 2026
You are already at the latest version
Abstract
Soil salinity and bacterial spot of tomato (BST), caused by Xanthomonas perforans, are major abiotic and biotic stresses limiting tomato production, particularly in Florida. While their individual effects are well documented, their combined impacts remain poorly understood. This greenhouse study evaluated how increasing irrigation water salinity (electrical conductivity [EC] = 0.5, 3, 5, or 7 dS m⁻¹) affected tomato growth, physiology, BST severity, fruit quality, and transcriptomic responses. Salinity reduced plant growth and BST severity but did not directly affect X. perforans populations, indicating that salt stress altered the plant response to infection rather than bacterial growth. Increased salinity enhanced fruit sugar accumulation and improved flavor taste and overall fruit quality, supported by taste panel, osmolarity, and transcriptomic analyses. Transcriptomic analysis showed that responses to salinity (EC = 7 dS m⁻¹) and X. perforans infection were strongly time dependent. Salt-treated plants exhibited fewer differentially expressed genes following inoculation, whereas comparisons between EC 7-treated and control plants revealed extensive salinity-induced transcriptional reprogramming. KEGG analysis indicated enrichment of photosynthesis, carbon metabolism, amino acid biosynthesis, and ribosome pathways, while defense-related pathways, including MAPK signaling and plant–pathogen interaction, were downregulated, suggesting that tomato prioritized adaptation to salinity over pathogen defense.
Keywords:
Xanthomonas perforans
; tomato
; bacterial spot
; soil salinity
; abiotic and biotic stress
; transcriptomics
1. Introduction
Tomatoes are a staple food in cuisines worldwide. In the United States, tomato production is valued at $1.97 billion [1]. In Florida, tomatoes are the number one vegetable in terms of hectares harvested and total production. With an agricultural production value at over $330 million [2], tomatoes are a crucial part of Florida’s economy, therefore ensuring their proper care is essential. Unfortunately, tomato production is frequently challenged by a combination of biotic and abiotic stressors. A major biotic stressor of tomato plants is bacterial spot of tomato disease (BST) [3] and a major abiotic stressor of tomato, and many other crops is high soil salinity [4,5]. This study aimed to explore the interactions between BST and salinity on tomato plants. While each of these stress factors has been studied individually in tomato, their combined effects remain poorly understood.
BST is a devastating bacterial disease primarily caused by X. euvesicatoria pv. perforans (referred to X. perforans thereafter) in Florida, although it is also caused by X. vesicatoria, X. euvesicatoria pv. euvesicatoria, and X. hortorum pv. gardneri. This disease significantly affects tomato production worldwide. Under greenhouse conditions, the pathogen is disseminated through water droplets aerosolized by overhead irrigation and is further spread by close plant spacing and handling of wet plants [6,7,8]. The pathogen enters plant tissue through natural openings and wounds, causing water-soaked small lesions initially and then brown to black lesions on leaf surfaces. Eventually these lesions spread leading to yield loss and reduced fruit quality. In 2007-2008, it was reported that losses due to bacterial spot were over $7,600 per hectare in Florida [9]. Additionally in 2010, the Midwestern USA’s processing industry reported losses of $7-8 million due to BST [9]. Therefore, the management of BST remains an ongoing challenge for growers, primarily due to the pathogen’s resistance to copper bactericides and the lack of commercially available resistant tomato varieties.
Soil salinization, the accumulation of soluble salts in soils, typically occurs naturally, but is often exacerbated by human activities such as overfertilization, land clearing, and poor irrigation practices [4,5]. Also, in many agricultural regions including Florida, saltwater intrusion inland as a result of sea-level rise is increasing the salinity of the soil and irrigation water, thus threatening crop production [10]. According to FAO (2024), soil salinization results in substantial losses in agricultural productivity worldwide [11]. Estimates reported in the literature vary, with FAO also citing global crop production losses from salt-induced land degradation in irrigated areas of approximately $27.3 billion annually [11,12]. Furthermore, it is projected that, by 2050, 50% of land suitable for growing crops will be impacted by salinity [4,13]. While small amounts of salts are essential for plant growth, salt levels beyond a crop’s tolerance can negatively affect its morphology, physiology, and productivity, ultimately leading to plant damage or death [4,14].
The impacts of salinity on disease vary based on the pathogen and crop. Soil salinity has been shown to enhance the proliferation of Fusarium solani, which causes wilt disease in potato, and angular leaf spot in cucumber caused by Pseudomonas syringe pv. lachrymans [15,16]. Conversely, in dragon fruit, salinity treatments reduced stem canker caused by Neoscytalidium sp. [17]. In tomatoes, salt treatments, depending on the concentration and type of salt (e.g., chloride, sulfate, carbonate salts of calcium, magnesium, and sodium) used, have been shown to both increase and reduce susceptibility of tomato plants to bacterial spot caused by Xanthomas euvesicatoria and grey mold incited by Botrytis cinerea, [4,18]. Tomato is considered moderately tolerant to salinity, with yield reductions occurring above a threshold salinity level of approximately 2.5 dS m−1 [19]. Depending on the cultivar and crop condition, low to moderate salinity levels (approximately 25–50 mM NaCl) may enhance plant resilience by inducing adaptive responses, including reduced disease, increased antioxidant activity, and osmotic adjustment [20,21,22]. However, higher salinity levels (generally ≥75–100 mM NaCl) can impair plant performance by causing osmotic stress, ion toxicity, and oxidative damage, thereby increasing susceptibility to stress and certain diseases [4,21,22,23]. Therefore, growers require solutions to effectively address the impact of soil salinization on crops and explore the potential strategies for its management.
Many studies on the effects of soil salinity in tomatoes focused on seed or early seedling stages in nutrient solutions [24,25,26,27]. In contrast, our study uniquely investigated this effect on four-week-old tomato plants grown in soils, more closely reflecting commercial tomato production. The objectives of this study were to evaluate the effects of soil salinity on tomato plant physiology, BST severity, plant growth and fruit quality; and to investigate changes in gene expression in response to combined effects of salinity and BST through comparative transcriptomic analysis. In this study, the salt, sodium chloride (NaCl), was selected for its dominance and significance in agricultural soils, even though salinization can arise from a variety of salts [4].
2. Materials and Methods
2.1. Preparation for Salinity Treatments
Salinity treatments were based on electrical conductivity (EC), which reflects the concentration of dissolved salts by measuring a solution’s ability to conduct electricity. Salinity treatments were prepared by dissolving NaCl (≥99.0%; Thermo Fisher Scientific, Waltham, MA, USA) in tap water (basal EC of approx. 0.5 dS m-1). In this study, the treatments were: EC 0.5 dS m-1 (control), EC 3 dS m-1 (1.45 g NaCl/L), EC 5 dS m-1 (2.59 g NaCl/L), and EC 7 dS m-1 (3.50 g NaCl/L). Final EC measurements were confirmed using a benchtop EC meter (Fisherbrand accument AR60; Thermo Fisher Scientific, Waltham, MA, USA).
2.2. Preparation of X. perforans Bacterial Suspension
The X. perforans strain QL, which was isolated from diseased tomato plants in Homestead, FL, USA, was used for all inoculations in this study. Bacterial cells were recovered from –80 °C storage by streaking onto nutrient agar (NA; Thermo Fisher Scientific, Waltham, MA, USA) and plates were then incubated at 28 °C for 24 h. A loopful of bacterial cells was then re-streaked onto fresh NA plates, which were incubated for another 24 h. Bacterial cells were removed from the agar surface and suspended in sterile tap water (STW). The suspension was adjusted to ~5×10⁸ colony forming units (CFU)/mL based on an optical density at 600 nm (OD600=0.3). For experiments where lower concentrations were used, the suspension was serially diluted in STW.
2.3. Impact of Salinity on Leaf Gas Exchange, Plant Growth, and BST
To evaluate the effects of salinity on tomato plant growth and BST, the experiment included two groups: inoculated and non-inoculated tomato plants. Inoculated plants were used to assess the impact of salinity on BST development, while non-inoculated plants served as controls to characterize the effects of salinity stress alone. Four-week-old tomato seedlings (cv. FL 47) were transplanted into 15-cm pots filled with a commercial potting mix (Pro-Line C/B HydraFiber blend, Jolly Gardener, Poland Spring, ME, USA). After transplanting, plants were allowed to acclimate for one week before the salt treatments began. Plants were manually irrigated every two days with 150 mL of salt solutions (EC 3, EC 5, or EC 7 dS m-1). Tap water with no salt added (EC ~ 0.5 dS m-1) served as the untreated control. Styrofoam plates were placed under the pots to capture any leachate.
After irrigating plants five times with salt solutions (8 days after treatments started), half of the plants were inoculated with a suspension of X. perforans at ~5×10⁸ CFU/ml and the inoculated plants were placed in a moist chamber for 48 h for disease promotion. Non-inoculated plants were sprayed with STW and placed in a separate moist chamber for consistency and to prevent contamination by the pathogen. After 48 h, all plants were arranged on the bench in a randomized complete block design, and irrigation treatments were applied directly to the soil. Irrigation treatments continued for the duration of the experiments. Following the onset of BST symptoms (within 5-7 days post inoculation), disease severity was assessed by visually estimating the percentage of diseased area on three leaves randomly selected between the third and fifth nodes below the apical meristem of each plant. The area under the disease progress curve (AUDPC) was calculated based on disease severity ratings collected over the experimental period. Plant height was measured from the soil surface to the shoot apex, and shoot fresh weight was recorded after cutting the stem at the soil surface. Soil and leachate (drained from the bottom of each pot) samples were also collected to determine the accumulated salinity.
To assess physiological plant response to salt treatments and BST, leaf gas exchange [net CO2 assimilation (A), transpiration (E), and stomatal conductance (gs)] was measured with a CIRAS-3 portable gas exchange analyzer (PP Systems, Amesbury, MA, USA). Measurements were made biweekly on one fully expanded leaflet from the upper-middle section of the canopy. During leaf gas exchange measurements, the following parameters were set: air flow rate into the leaf cuvette at 300 ml min−1, photosynthetic photon flux inside the cuvette at 1000 μmol quanta m−2 s−1, the reference CO2 concentration in the leaf cuvette at 390 μmol CO2 mol−1, the air temperature in the cuvette at 25°C, and the relative humidity at 70%. There were five replicates per treatment and each single plant as a replicate. The experiment was conducted twice.
2.4. Electrical Conductivity of Water Leachate and Soil Samples as Affected by Salinity Treatment
Quantification of soil salinity was conducted with leachate and soil samples collected from pots of the control and salt-treated plants (EC 3, 5, and 7 dS m-1). Water leachate draining from the holes in the bottom of each pot was collected at the beginning and end of the experiment and filtered through medium flow rate filter paper (Thermo Fisher Scientific, Waltham, MA, USA). Soil samples were collected, placed in paper bags, and oven-dried at 40 °C for approximately 48 h. Dried soil samples were screened through a 2-mm sieve, and 2 g of soil was mixed with 20 mL of double-distilled (dd) water. The resulting soil suspension was filtered using medium flow rate filter paper, and the filtrate was collected. Filtrates for water leachate and soil samples were measured with a benchtop EC meter (Fisherbrand accument AR60; Thermo Fisher Scientific, Waltham, MA, USA). There were three replicates per treatment, and the experiment was conducted twice.
2.5. Impact of Salt Treatments on X. perforans Bacterial Population
2.5.1. In Vitro Activity of Salinity Treatments Against Bacterial Populations
To evaluate the antibacterial activity of salinity treatments against X. perforans (QL), salinity treatments (EC 3, 5, or 7 dS m-1) were prepared using NaCl and STW as previously described (adjusted for smaller volume). A bacterial suspension was prepared as previously stated and adjusted to 105 CFU/mL. Then, 20 μL of the suspension was added to tubes containing 2 mL of saline solution. Additionally, three tubes containing 2 mL of STW and 20 μL of the bacterial suspension served as the control. All tubes were incubated at 28 °C on an orbital shaker at 150 rpm for 0, 1, 4, and 24 h. At each timepoint, 50 μL of the suspension from each tube was streaked onto each NA plate, and the plates were incubated at 28 °C for 48 h. Colonies were counted, and the CFU/ml was calculated. Each treatment consisted of three replicates, and the experiment was conducted two times.
2.5.2. In Planta Bacterial Populations in Leaf Apoplast
To assess the impact of salinity on X. perforans bacterial populations, four-week-old tomato plants were irrigated with 150 mL of salt solutions (EC of 3, 5, or 7 dS m-1) and tap water (control) via soil drench every two days. After the fifth application, three leaflets per plant, located between the third and fifth nodes below the apical meristem, were infiltrated using a 3 mL syringe with a suspension of X. perforans (strain QL) at 105 CFU/mL, prepared in sterile double-deionized (DD) water amended with 0.01 M MgSO4. The inoculated area was marked by small perforations along the margin for identification after drying. Following inoculation, plants were allowed to air-dry for 1 h. At each time point (0, 3, 6, and 9 days post-inoculation), an infiltrated leaflet was excised, and two leaf discs (0.5 cm2) were collected from the inoculated region. The leaf discs were homogenized in 1 mL of 0.01 M MgSO4 solution using a sterile glass rod in a test tube. Serial 1:10 dilutions were prepared by adding 50 µL of homogenate to 450 µL of 0.01 M MgSO4, making dilutions up to 103 for day 0 samples and up to 107 for days 3, 6, and 9. Aliquots (50 µL) from each dilution were streaked onto each NA plate and the plates were incubated at 28 °C for 48 h. The CFU/ cm2 was calculated based on the following equation:
where C = number of colonies counted, D = dilution factor, Vtotal = total volume to extrapolate (typically 1000 µL = 1 mL), and Vplated = Volume plated (in µL). Each plant consisted of three biological replicates, and the experiment was conducted twice.
2.6. Osmotic Adjustment of Plants in Response to Salinity
Four-week-old tomato plants (cv. FL 47) were irrigated via soil drench with 150 mL of tap water (control) and salt solutions (EC 3, 5, and 7 dS m−1) every two days for four weeks. At the end of the treatment period, three leaflets located between the third and fifth nodes below the apical meristem were collected and submerged in DD water at 4 °C in the dark for 24 h for full turgidity. Then leaflets were drained, patted dry, and homogenized in a mortar using pestle to extract sap. The sap was then centrifuged at 10,000 g for 20 minutes at 4 °C. The resulting supernatant was transferred to 2 mL tubes and stored at 4 °C until further use. Then 10 µL of each sap sample were placed on a filter paper disc and loaded into a vapor pressure osmometer (Vapro5600, Wescor, Inc., Logan, UT, USA) to measure osmolarity, the measure of solute concentration. Osmotic potential at full turgor (Ψs100) was calculated using the van’t Hoff equation (Paulino et al. 2020):
where C = osmolarity (mol/kg), R = universal gas constant (0.00831 MPa·kg·mol−1·K−1), and T = absolute temperature (298 K). Osmotic adjustment (OA), which is the process by which plants accumulate solutes to maintain water uptake and turgor under salt stress [64], was determined by subtracting the osmotic potential of stressed plants (Ψs100 stress) from that of control plants (Ψs100 control), using the formula:
The experiment included three replicates and was conducted two times.
2.7. Impact of Salinity on Fruit Flavor and Quality
To evaluate the effects of salinity on tomato fruit quality, a blind taste panel was formed with 32 participants. Tomato plants were grown in a greenhouse under the same conditions as previously described, except they were transplanted into 19-cm pots and irrigated every two days with 250 mL of tap water (control) and salt solutions (EC 3, 5, or 7 dS m−1) until harvest, about three months later. Each treatment had four replicates.
Tomato fruit were harvested at the 50-75% color break stage and ripened in paper bags at room temperature (20–21 °C) for 7–9 days. Once fully red, tomatoes were washed, cut, and presented to participants for a blind tasting. Each participant completed a standardized evaluation form (Figure S1) with rating attributes including appearance, sweetness, acidity, texture, and overall flavor. Treatment identities were disclosed after evaluations were submitted.
2.8. Transcriptomic Analysis
2.8.1. Pathogen Inoculation and Sample Collection
To evaluate the changes in gene expression between salt-treated and control plants, an RNA-seq experiment was conducted in a temperature-controlled greenhouse in the Department of Plant Pathology at the University of Florida in Gainesville, FL. Treatments included EC 7 and control plants, both with and without inoculation. Tomato plants and treatments were prepared as previously described above in “Impact of salinity on leaf gas exchange, plant growth, and BST” with modifications for RNA sample collection. Following inoculation, plants were covered with clear polyethylene bags, which were secured around the pots with rubber bands, and maintained for 48 h to promote BST disease development. Non-inoculated plants were mock treated with STW and bagged in the same manner. After 48 h, all plants were unbagged and arranged in a completely randomized block design. Disease severity was assessed by visually estimating the percentage of disease of the whole plant, and AUDPC was calculated based on disease severity ratings collected over the experimental period. Leaf tissue samples were collected at five timepoints: after the five initial salt treatments (AT), 12 h post-inoculation (hpi), and 2, 4, and 7 days post-inoculation (dpi). Tissue samples were also collected before any treatment started (BT). Collected tissue samples were flash-frozen in liquid nitrogen, homogenized using a Qiagen TissueLyser II (Qiagen GmbH, Hilden, Germany), and stored at −80 °C for RNA extraction.
2.8.2. RNA Extraction and Sequencing
Total RNA was extracted using the RNeasy Plant Mini Kit (Qiagen GmbH, Hilden, Germany), following the manufacturer’s protocol and stored at -20 °C. RNA quantity and purity was assessed with a NanoDrop spectrophotometer (Thermo Fisher Scientific, Waltham, MA, USA) and RNA samples were sent to Novogene Co. Inc. (Sacramento, CA, USA) for library preparation, sequencing, and data analysis. Libraries were constructed from messenger RNA (mRNA) purified from total RNA using poly-T oligo-attached magnetic beads. After fragmentation, first-strand cDNA was synthesized using random hexamer primers, followed by second-strand synthesis with either dTTP for non-strand-specific libraries or dUTP for strand-specific libraries. The libraries were quantified using Qubit and real-time PCR, and their size distribution was assessed with a Bioanalyzer. Quantified libraries were pooled based on effective concentration and desired data yield, then sequenced on the Illumina NovaSeq X Plus platform to generate paired-end reads. Raw sequencing data were processed by adapter trimming and quality filtering. All data have been deposited in the NCBI Sequence Read Archive (SRA) under BioProject number PRJNA1303723.
2.8.3. Transcriptomic Analysis Pipeline
The original image data file from high-throughput sequencing platforms (like Illumina) was transformed into sequenced reads (called Raw Data or Raw Reads) by CASAVA base recognition (Base Calling). Initial processing was done by Novogene’s bioinformatics team, followed by additional processing on the University of Florida’s HiPerGator supercomputing system. Quality of the sequences was assessed using FastQC. Reads were then aligned to the tomato reference genome (Solanum lycopersicum cv. Heinz 1706, SL3.0; NCBI Accession GCF_000188115.3) using HISAT2. The resulting BAM files were indexed with SAMtools, and gene-level quantification was performed using HTSeq2.
2.8.4. Differential Gene Expression Analysis
Differential expression analysis was performed using the DESeq2 package in R (version 4.4.2, R Core Team, 2024). Raw read counts obtained from HTSeq2 were used to identify differentially expressed genes (DEGs) across treatment conditions. Gene expression was compared over time between inoculated (I) and non-inoculated (NI) treatments (I EC 7 vs NI EC 7; I CK vs NI CK) to assess disease effects. Additionally, comparisons between salt treatments (I EC 7 vs I CK; NI EC 7 vs NI CK) were conducted to evaluate the impacts of salt stress on gene expression changes in the presence or absence of disease over sampled timepoints. Statistical significance was assessed using the Wald test, with p-values adjusted (adj p-value) using the Benjamini–Hochberg method [65]. Genes with adjusted p-value ≤ 0.05 and absolute log2 fold-change ≥ 1 were considered significant DEGs.
2.8.5. Pathway Enrichment Analysis
Enrichment analysis focused on DEGs between inoculated salt treated (I EC 7) and control (I CK) plants to specifically examine how salt stress modifies the transcriptional response to X. perforans infection (I EC 7 vs I CK) across sampled timepoints. Analyses were conducted using the ClusterProfiler package in R. Gene Ontology (GO) and Kyoto Encyclopedia of Genes and Genomes (KEGG) enrichment analyses were conducted on DEGs, including upregulated, downregulated, and total subsets. Analyses were carried out across five timepoints (AT, 12 hpi, and 2, 4, and 7 dpi) to capture condition-specific and time-dependent responses. GO and KEGG annotations provided by Novogene were filtered to retain terms with adj p-values ≤ 0.05 and gene counts ≥ 10. The top enriched terms (based on gene count) were visualized using customized dots and bubble plots in ggplot2, with dot size indicating gene count and color representing statistical significance.
2.9. Statistical Analysis
All statistical analyses were conducted using SAS (version 9.4, SAS Institute Inc., Cary, NC, USA). For experiments evaluating the effects of salinity on plant growth and BST, and for EC of water leachate and soil, data were analyzed by one-way analysis of variance (ANOVA) with treatment as the fixed effect. Means were compared using Tukey’s HSD post hoc test at a significance level of 0.05. For antibacterial activity of salinity treatments against X. perforans in vitro and in planta, data were analyzed using a linear mixed model (PROC GLIMMIX), with treatment rate, time, and their interaction as fixed effects, and experiment as a random effect. An AR(1) covariance structure was used to account for repeated measurements over time. For leaf gas exchange measurements, data were sorted by week and inoculation (inoculated or non-inoculated). A two-way ANOVA was performed separately for each week x inoculation combination, with salinity treatment as a fixed factor and A, E, and gs as response variables. Means were compared using a Waller-Duncan k-ratio test. For the taste panel, flavor attributes (appearance, aroma, texture, etc.), and osmolarity, osmotic potential and osmotic adjustment were analyzed using one-way ANOVA with treatment as the fixed effect. Post hoc comparisons were conducted using Tukey’s HSD at a significance level of 0.05.
3. Results
3.1. Impact of Salinity on Plant Growth and BST
Salt-treated plants showed a clear reduction in BST disease symptoms (Figure 1). EC 3-treated plants had fewer lesions and minimal yellowing; EC 5-treated plants showed even fewer lesions and no yellowing; and EC 7-treated plants displayed only minimal lesions with no other visible BST symptoms. In contrast, control plants exhibited the most severe symptoms, including extensive lesion development, leaf yellowing and necrosis. Salinity treatments led to a significant reduction in disease severity (DS) and disease progression (AUDPC) compared to the control (Table 1). Inoculated, salt-treated plants showed a 79-95% decrease in DS, with an 85-97% reduction in AUDPC, and 0.58-12% decrease in plant height compared to the control. While there were no significant effects on fresh shoot weight with EC 3 or EC 5 plants, there was a significant decrease (23%) in EC 7 plants compared to the control. Although increasing salinity reduced disease, there was a negative impact on plant growth. Similarly, in non-inoculated plants, plant height decreased by 0.85–5% and weight by 17–26% compared to the control, with control plants exhibiting the highest values and in the EC 7-treatment exhibiting the lowest. Even though the differences in plant height among salinity treatments were not significant in non-inoculated plants, the general trend of decline as salt concentrations increased was the same in both groups.
The EC values of water leachate and soil samples reflected the salt accumulation in salinity treatments (Table 2). Before treatment, water leachate collected at the beginning of the experiment showed similar EC values across all salinity treatments. By the end of the experiment, however, there was a sharp increase in EC related to salt concentration. Control samples showed the lowest EC, while EC 7 samples had the highest. A similar trend was observed in soil samples collected at the end of the experiment, with EC values increasing significantly with increasing salt levels. These results indicate significant differences in soil salinity in the treatments, which had a negative impact on overall plant growth, and also significantly decreased BST compared to the control.
3.2. Leaf Gas Exchange in Response to Salinity and BST
Overall, net CO2 assimilation (A), transpiration (E), and stomatal conductance (gs) declined over time in both inoculated and non-inoculated plants (Figure 2), with no statistical differences between inoculated and non-inoculated treatment groups. For instance, plants across all salinity treatments initially had similar A, E and gs. However, as the exposure time to salt stress increased, salt-treated plants exhibited a significant decline in all three leaf gas exchange variables compared to the control.
Two weeks after treatments started, net CO2 assimilation (A) differed significantly among salinity treatments in both inoculated and non-inoculated groups, with net CO2 assimilation (A) of plants in the EC 7 treatment consistently lower than that of the control plants (Figure 2A). These differences were more pronounced in non-inoculated plants. In inoculated plants, transpiration (E) also declined significantly in all salt-treated groups by week 2 (Figure 2B), though by week 4 values had dropped across all treatments, reducing statistical separation. In non-inoculated plants, significant differences emerged by week 2, with plants in the EC 5 and EC 7 treatments showing the lowest transpiration rates. Furthermore, stomatal conductance (gs) followed a similar pattern. In non-inoculated plants, stomatal conductance (gs) declined as salinity increased, with greater reductions at higher salinity levels (Figure 2C). Inoculated plants showed further reductions across all salinity treatments by week 2. These results suggest that both salinity and disease lead to progressive physiological decline.
3.3. Effect of Salinity Treatment on X. perforans Populations In Vitro and in Planta
Growth of X. perforans, both in vitro and in planta, showed no statistically significant differences across treatments at any given time compared to the control (Figure 3). In vitro assays conducted over a 24-h period showed no statistical differences in bacterial populations in any treatment at any sampling time, compared to the control (Figure 3A). In all treatments, bacterial populations continued to steadily rise over time. Similarly, tomato leaves infiltrated with X. perforans also demonstrated no significant differences among salinity treatments at any given time throughout the 9-day experimental period (Figure 3B). These findings suggest that salinity treatments did not have a direct effect on the growth of X. perforans.
3.4. Osmotic Adjustment in Tomato Plants Under Salinity Treatments
Osmolarity (Osm) increased slightly as salinity treatment level increased, ranging from 0.32 mol/kg in control plants to 0.36 mol/kg in the EC 7 treatment; however, the differences were not statistically significant (Table 3). Similarly, osmotic potential tended to be more negative with increasing salinity, from -0.80 MPa in controls to -0.89 MPa in the EC 7 treatment, but the differences were also not significant. Osmotic adjustment increased with increasing salinity, ranging from 0.06 MPa in EC3 and EC5 to 0.10 MPa in EC 7 treatments, albeit not statistically significant among the treatments.
3.5. Impact of Salinity on Fruit Flavor and Quality
Blind taste panel participants preferred tomato fruit produced from plants in the salinity treatments than in the control (Figure 4). The fruit from plants in the EC 7 treatment were the most favored, followed by those in the EC 5, EC 3 treatments, and fruit from the control were the least favored (Figure 4A). Fruit yields differed significantly across treatments (Figure 4B), with plants in the EC 3 treatment having yielded the highest fruit weight, followed by the control, EC 7, and EC 5 treatments. Taste evaluations showed that salt-treated fruit scored higher across most attributes. However, appearance and acidity ratings did not differ significantly among treatments (Figure 4C). Fruit from the EC 7 treated plants were consistently rated the highest for attributes such as aroma, texture, sweetness, taste, and overall flavor, whereas fruit in the control treatment were rated lowest with significant differences among the treatments. Fruit in the EC 3 treatment were not significantly different from those in the control treatment and received similar ratings across all attributes. Fruit in the EC 5 and EC 7 treatments were preferred for aroma, texture, sweetness, taste, and overall quality.
3.6. Comparative Transcriptomic Analysis of Tomato Plants Under Salinity Treatment and BST
3.6.1. Transcriptomics Assembly Statistics
A total of 56 RNA-seq libraries were constructed and sequenced. The number of raw reads per sample ranged from approximately 70.8 million to 158.3 million generating between 10.62 Gb and 23.74 Gb of raw data (Table S1). After quality control, clean reads ranged from 68.1 million to 149.1 million, indicating a high retention rate. Sequencing quality was consistently high, with an average error rate of 0.01%, Q30 scores above 94%, and GC content ranging from 41.6% to 43.2%. In total, 31,210 genes were annotated, providing a comprehensive and high-quality dataset suitable for downstream transcriptomic analyses.
3.6.2. Transcriptomic Comparison of Inoculated EC 7 and Inoculated Control Plants
Plants in the EC 7 treatment exhibited a dramatic reduction in BST disease severity and AUDPC compared to the control (CK) (Table S2). Disease severity was about 24% in control plants, but only 0.6% for plants in the EC 7 treatment. AUDPC showed a similar trend with disease progressing significantly more in control plants than in plants in the EC 7 treatment. Additionally, there was a sharp increase in water leachate and soil EC in the EC 7 treatment compared to the control (Table S3).
Samples were collected at multiple timepoints to capture the dynamics of transcriptional changes (Figure 5). Principal component analysis (PCA) revealed that sample clustering was primarily driven by timepoint rather than by treatment or inoculation alone (Figure 5A). Three major clusters were observed: one comprising of before treatment (BT) and after treatment (AT) samples, a second consisting of samples collected at 12 hpi, and a third containing the 2, 4, and 7 dpi samples.
DEG analysis between inoculated (I) and non-inoculated (NI) plants was performed for each timepoint in each of CK and EC 7 treatments (I_12h_CK vs NI_12h_CK, I_12h_EC 7 vs NI_12h_EC 7, I_2d_CK vs NI_2d_CK, I_2d_EC 7 vs NI_2d_EC 7, I_4d_CK vs NI_4d_CK, I_4d_EC 7 vs NI_4d_EC 7, I_7d_CK vs NI_7d_CK, and I_7d_EC 7 vs NI_7d_EC 7) (Figure 5B). In CK plants, DESeq2 identified 51 (24 upregulated and 27 downregulated), 196 (125 up and 71 down), 995 (869 up and 126 down), and 1970 (1344 up and 626 down) DEGs at 12 hpi, 2 dpi, 4 dpi, and 7 dpi, respectively. In plants in the EC 7 treatment, there were 4 (2 up and 2 down) at 12 hpi, 552 (217 up and 335 down) at 2 dpi, 8 (8 up and 0 down) at 4 dpi, and 60 (37 up and 23 down) DEGs at 7 dpi, respectively. At all timepoints except 2 dpi, fewer DEGs were detected between inoculated and non-inoculated plants in the EC 7 treatment, suggesting that salt stress may override or suppress the transcriptional response to X. perforans infection.
To further explore the effect of salt stress, comparisons between plants in the EC 7 and those in the CK treatment were made to identify changes in gene expression in each of inoculated (I_12h_EC 7 vs I_12h_CK, I_2d_EC 7 vs I_2d_CK, I_4d_EC 7 vs I_4d_CK, and I_7d_EC 7 vs I_7d_CK) and non-inoculated (NI_12h_EC 7 vs NI_12h_CK, NI_2d_EC 7 vs NI_2d_CK, NI_4d_EC 7 vs NI_4d_CK, and NI_7d_EC 7 vs NI_7d_CK) groups (Figure 5C). In inoculated plants, DESeq2 identified 1056 (514 upregulated and 542 downregulated), 1258 (598 up and 660 down), 1583 (603 up and 980 down), and 1781 (650 up and 1131 down) DEGs between EC 7 and CK treatments at 12 hpi, 2, 4, and 7 dpi, respectively. In non-inoculated plants, 165 (112 up and 53 down), 739 (340 up and 399 down), 194 (90 up and 104 down), and 1638 (864 up and 774 down) DEGs were detected at the same timepoints. These results indicate that while salt stress alone influences gene expression, most notably at 7 dpi, the presence of both salt stress and pathogen infection leads to a consistently higher number of DEGs across all timepoints. This suggests a compounding effect of simultaneous abiotic and biotic stress on the transcriptional response in tomato.
Given the focus on understanding how salinity treatment alters the transcriptional response to X. perforans infection, further analysis centered on comparisons between inoculated plants in the EC 7 and CK treatments. A Venn diagram was used to visualize the overlap and uniqueness of DEGs across all timepoints in this comparison (Figure 5D). Among the upregulated DEGs, 6 genes were shared across all timepoints, while the number of unique upregulated genes at each timepoint was 362 at AT, 303 at 12 hpi, 254 at 2 dpi, 331 at 4 dpi, and 426 at 7 dpi. For downregulated DEGs, 7 genes were common across all timepoints, with 731, 269, 273, 271, and 446 genes uniquely downregulated at AT, 12 hpi, 2 dpi, 4 dpi, and 7 dpi, respectively.
3.6.3. GO Enrichment
GO enrichment analysis revealed distinct patterns of functional enrichment based on time post inoculation (Figure 6). In the early timepoints, AT and 12 hpi, most enriched genes were downregulated, particularly those involved in microtubule-based processes, motor activity, and intracellular transport (AT). Key processes related to translation and protein synthesis were also downregulated, indicating a reduction in protein production (12 hpi). However, by 12 hpi, genes linked to cytoskeletal remodeling and motor activity were upregulated, marking the onset of cellular reorganization.
A more significant increase was found 2 to 4 dpi in gene counts and upregulated genes associated with photosynthesis, ribosomal function, and protein synthesis. Significant enrichment of thylakoid, photosystem II oxygen evolving complex, and oxidoreductase activity reflects a metabolic shift toward enhanced energy production and biosynthesis. Meanwhile, downregulated genes were enriched in categories related to carbohydrate biosynthesis, vesicle-mediated transport, and ion channel activity, implying a reprioritization away from growth and signaling pathways to focus on metabolic restoration and stress acclimation.
By 7 dpi, gene expression indicated a transition toward recovery and structural reinforcement. GO terms related to cell wall organization, carbohydrate metabolism, and extracellular regional components (such as apoplast and glycosyltransferase activity) were significantly upregulated, suggesting enhanced cell wall remodeling and sugar metabolism critical for long-term stress tolerance. Simultaneously, genes involved in transcription regulation, oxidative stress response, and mitochondrial functions were downregulated, indicating a downshift in active defense and signaling pathways as the system stabilizes.
3.6.4. KEGG Enrichment: Inoculated EC 7 Treated Plants vs Inoculated CK Plants
Several pathways were significantly enriched in inoculated plants in the EC7 treatment compared to inoculated plants in the CK treatment across multiple timepoints (AT, 12 h, 2 d, 4 d, 7 d) (Figure 7). They fell into four major functional categories: energy and primary metabolism, photosynthesis-related processes, defense and signaling, and hormone and secondary metabolism. Among the most consistently enriched were carbon metabolism, amino acid biosynthesis, and carbon fixation in photosynthetic organisms, followed by MAPK signaling, plant-pathogen interaction (PPI), and glyoxylate and dicarboxylate metabolism. The most significantly enriched single pathway was the ribosome pathway at 2 days post-inoculation (2 dpi; adj p = 2.06 × 10−91, 208 genes), indicating a robust increase in protein synthesis in response to the salt and disease stress.
After treating tomato plants with salt (AT), plants showed upregulation of carbon metabolism, carbon fixation, and amino acid biosynthesis, accompanied by downregulation of motor proteins, indicating a shift in energy allocation toward photosynthetic activity and the reduction in intracellular transport. By 12 hpi, motor proteins and photosynthesis-related pathways such as carbon fixation and porphyrin metabolism were upregulated, indicating increased investment in light-driven energy production. Meanwhile, suppression of ribosome biogenesis and oxidative phosphorylation pathways suggests a temporary reallocation of energy away from protein synthesis and mitochondrial respiration toward photosynthetic activity. From 12 hpi to 7 dpi, there was a sustained enrichment of one or more photosynthetic pathways.
At 2 dpi, ribosomal activity was strongly up-regulated, along with spliceosome and sustained photosynthetic activity, whereas defense-associated pathways such as MAPK signaling, PPI, and fatty acid metabolism were downregulated, indicating a shift away from active defense toward recovery and metabolic rebuilding. This trend continued at 4 dpi, with enrichment in photosynthesis, porphyrin metabolism, and biosynthesis of secondary metabolites, alongside suppression of endoplasmic reticulum protein processing, glutathione metabolism, and stress signaling.
By 7 dpi, plants exhibited a distinct shift toward growth and recovery, marked by upregulation of starch and sucrose metabolism, amino sugar metabolism, and hormone biosynthesis pathways (zeatin, steroids, cysteine and methionine), as well as secondary metabolite pathways such as flavonoid and phenylpropanoid biosynthesis. Simultaneously, defense and signaling pathways, including MAPK signaling, hormone signaling, and glutathione metabolism, were broadly downregulated. Together, these patterns reflect a coordinated stress adaptation strategy involving early metabolic reprogramming, suppression of defense, and late-stage hormonal remodeling to support growth and repair under combined abiotic and biotic stress.
4. Discussion
Pre-exposing plants to a stressor, such as high salinity, prior to inoculation with a pathogen can prime plant defense mechanisms and increase tolerance to subsequent stressors [28,29,30]. This pre-exposure can enhance germination uniformity, plant growth, and tolerance to a subsequent stress by establishing a “stress memory” that accelerates defense activation [18,25,27,31]. For instance, priming tomato seeds with 300 mM NaCl for 24 h improved germination, seedling vigor, and tolerance to both salinity and pathogens such as Ralstonia solanacearum, the causal agent of bacterial wilt in tomatoes [25]. Consistent with these findings, salinity treatments in our study strengthened defense against X. perforans and reduced BST severity compared to untreated controls. However, these benefits came with notable physiological trade-offs.
Tomatoes are considered moderately tolerant to salt stress [4]. However, high salinity can result in reduced seed germination, plant growth, biomass, and final fruit yield [32,33,34]. In our greenhouse trials, repeated exposure to NaCl treatments (EC 3, EC 5, and EC 7) reduced plant height and fresh shoot weight relative to untreated controls. These effects were more pronounced at EC 5 and EC 7, indicating that physiological stress intensified with repeated exposure at higher salinity levels. In contrast, EC 3 produced a more limited and inconsistent response, significantly affecting only non-inoculated plant weight without broader impacts on other measured parameters. Together, these results suggest that reduced plant growth is driven by physiological constraints induced by salinity.
Salinity treatments significantly altered key leaf gas exchange variables, with decreases in net CO2 assimilation (A), transpiration (E), and stomatal conductance (gs) across all salt-treated tomato plants compared to the controls. These reductions indicate that osmotic stress induced by the salinity treatments was the dominant physiological stressor. This stress reduced stomatal conductance and transpiration and may have limited pathogen ingress, thereby overshadowing any measurable effects of bacterial infection. Studies have shown that increasing salinity can increase the osmotic pressure in soil, thereby lowering water availability and limiting water uptake by the roots [22]. This mechanism was reflected in our greenhouse trials, where salt-treated soils retained moisture longer than controls. In turn, plants respond by restricting leaf expansion and closing stomata to maintain osmotic balance, though this comes at the cost of limited photosynthesis due to reduced CO2 uptake through the stomata [4]. These physiological adjustments manifest as chlorosis, wilting, and stunted growth, all of which are characteristic of systemic salt stress [32,33,34].
In the present study, salt-induced stomatal closure apparently served a dual protective role: mitigating water loss and limiting bacterial invasion. Given that bacteria enter plant tissues through natural openings such as stomata or through wounds [35], reduced stomatal aperture under salt stress can limit pathogen entry. Consistent with this, inoculation with X. perforans had little impact on leaf gas exchange, as similar values were measured in both inoculated and non-inoculated plants. Similarly, in vitro and in planta population assays showed no differences between control and salt-treated plants, with bacterial populations continuing to increase despite salt treatments. These findings indicate that NaCl at tested levels did not directly inhibit X. perforans growth. Instead, the observed reduction in BST severity is best explained by salt-induced changes in host physiology that restricts infection, rather than by direct effects on the pathogen [31,36]. Therefore, in the greenhouse experiment for comparative transcriptomic analysis, tomato plants were inoculated by foliar spray rather than injection. In contrast, direct salt-mediated changes in plant-pathogen interactions have been reported in other systems. For example, in Arabidopsis exposed to 300 mM NaCl, disease severity was reduced, as indicated by smaller lesions caused by Pseudomonas syringae pv. maculicola DG3 [36]. In that system, disease reduction was attributed to ion accumulation in the host’s intracellular spaces, which limited bacterial colonization [36,37]. Future studies could quantify salt accumulation in the apoplast, leaf, and root tissues to clarify the potential role of intercellular ions in mediating disease suppression.
KEGG enrichment revealed significant downregulation of the MAPK signaling and PPI pathways, both of which are central to pattern-triggered immunity (PTI). PTI is initiated by pattern recognition receptors such as FLS2, which perceives bacterial flagellin and activates downstream signaling through co-receptors, MAPK cascades, WRKY transcription factors, and ROS production [38,39,40]. Although FLS2 itself was not differentially expressed in our dataset, multiple downstream PTI components, including MPK3, MKK2/MKK4, WRKY33, PR1 isoforms, SERK3A/B, EDS1, CNGC15, and RBOH1, were significantly suppressed under salt stress. This coordinated repression reflects a reprioritization of resources from bacterial defense.
In EC 7-treated plants, very few DEGs were detected between inoculated and non-inoculated samples at all time points, apart from 2 dpi, indicating a minimal transcriptional response to bacterial inoculation. This suggests that the high salinity induced a strong response in tomato, causing both inoculated and non-inoculated plants to show similar transcriptional patterns, explaining the limited DEGs. Another potential explanation for the low number of DEGs could be the limited disease development observed in EC7-treated plants. Therefore, because disease severity was minimal, the associated transcriptional response was also low, resulting in fewer detectable changes in gene expression. In contrast, control plants exhibited a much stronger transcriptional response to infection, particularly at 7 dpi, consistent with the more pronounced disease symptoms observed in these plants. Together, these results indicate that BST primarily drives transcriptional changes under non-saline conditions, whereas salt stress overrides this response. Another reason could be the overlap in transcriptional pathways involved in salt stress and disease response. A recent comparative transcriptomic study in tomato identified 1,474 DEGs commonly shared between biotic and abiotic stresses, highlighting key regulatory pathways, including hormone signaling, transcription factors, calcium signaling, and cell wall metabolism [41]. Salinity stress is known to trigger extensive transcriptional reprogramming in tomato, affecting pathways related to ion homeostasis, detoxification, metabolism, and oxidative stress [4,22]. This overlap suggests potential competition for regulatory resources between stresses, allowing dominant factors like salinity to reprogram the transcriptional response to prioritize abiotic stress tolerance [41].
In place of active immune signaling, salinity treatments induce comprehensive ROS management through metabolic and cellular reprogramming that supports survival under stress [18,22,25,36,37]. Salinity imposes both osmotic and ionic stress, disrupting cellular homeostasis and altering hormone signaling, particularly abscisic acid (ABA) and indole-3-acetic acid (IAA), which regulate processes such as stomatal closure to reduce water loss and adjust growth patterns, helping the plant adapt to the stress [4,32]. The major consequence of elevated ROS levels is oxidative damage to plant cells. To counteract this, plants activate antioxidant enzymes such as superoxide dismutase (SOD), catalase (CAT), and glutathione peroxidase (GPx), which neutralize harmful oxidative molecules produced under salt stress [4,22,42].
KEGG enrichment revealed strong upregulation of pathways associated with carbon metabolism, including carbon fixation and carbohydrate metabolism across timepoints. This coordinated response is further supported by the increased expression of central metabolic genes, such as SlFBA1/2/6/7, rbcS1, GPI, MDH, and CAT2, which integrates carbon flux with ROS detoxification processes. Early upregulation of photosynthesis-related genes, including light-harvesting chlorophyll a/b-binding (CAB) proteins and the photoprotective factor psbS, suggests enhanced dissipation of excess excitation energy, thereby limiting ROS generation in the chloroplast and maintaining the photosynthetic capacity in salt-stressed plants [43]. Concurrent enrichment of porphyrin metabolism, including POR2 and GSAAT, point to regulation of chlorophyll biosynthesis, likely minimizing the accumulation of phototoxic intermediates that could exacerbate ROS production [44,45,46].
Consistent with these adjustments, citrate cycle-associated (TCA) enzymes such as ICDH1 and Slα-KGDH were also enriched, indicating increased respiratory activity to generate ATP and metabolic intermediates required for stress tolerance [47]. However, although the upregulation of photosynthesis and light-harvesting components may help meet elevated energy demands under salt stress, it also increases susceptibility to light-induced damage. Excess excitation above tolerance in chloroplasts can generate ROS, leading to photoinhibition and oxidative damage [48]. This imbalance was partially mitigated by 4 dpi through increased expression of carotenoid biosynthesis genes such as PSY1 and VDE, which facilitate the dissipation of excess light energy and reduce oxidative damage [49]. In parallel, enrichment of the pentose phosphate pathway suggests an additional layer of redox regulation, as this pathway generates NADPH required to sustain antioxidant systems, including glutathione and ascorbate recycling [50].
At later stages (4–7 dpi), the transcriptional profile shifts from early stress mitigation, such as protection of the photosynthetic apparatus, toward longer-term adaptation marked by metabolic stabilization that sustains growth under salt stress. Enrichment of amino acid biosynthesis, carbohydrate metabolism, and secondary metabolite pathways indicates sustained metabolic reprogramming. Activation of hormone-related pathways, including zeatin and steroid biosynthesis, along with upregulation of SAM3, CKX1, and CAS1, highlights an increasing role for hormonal signaling in coordinating growth and stress tolerance. [51,52,53]. Moreover, the enrichment of endoplasmic reticulum protein processing pathways, particularly heat shock proteins such as HSP70 and HSP90, show that maintaining protein homeostasis is a critical component of prolonged stress tolerance [54].
Additionally, KEGG analysis revealed that EC 7 treated tomato plants accumulated osmoprotectants such as proline and soluble sugars, which help maintain osmotic balance and protect against dehydration [4,55]. The upregulation of sugar metabolism genes, including GolS2, together with the enrichment of pathways involved in osmoprotectant production, indicates a coordinated shift toward osmotic adjustment and redox buffering [56]. These compatible solutes likely play dual roles by stabilizing cellular structures and contributing to antioxidant capacity under sustained salinity stress.
These transcriptional changes are reflected at the physiological level, where salt treated plants showed increased osmolarity and higher sugar accumulation in fruits, particularly in EC 5 and EC 7 treatments. This increase in sugar content likely results from multiple physiological adjustments, including reduced leaf and fruit size, solute concentration effects, and enhanced carbohydrate metabolism, such as increased starch accumulation during early fruit development followed by its conversion to sugars during ripening [55]. Furthermore, osmolarity experiments revealed that salt-treated plants had higher solute concentrations and showed evidence of osmotic adjustment, which is a key mechanism in plants to cope with salinity stress by accumulating solutes to maintain cellular water balance [4,55,57]. Together, these findings demonstrated that salinity stress can enhance sugar accumulation in tomato fruits, thereby improving taste and overall fruit quality, as supported by taste panel results where participants consistently rated fruits grown under the high salinity treatments as more favorable than controls in our study.
A higher incidence of blossom-end rot was observed in salt-treated fruit compared to the control. This may result from high salinity interfering with calcium transport to the fruit or gradual nutrient depletion in the soil. Calcium is transported via the xylem, and reduced transpiration has been shown to limit calcium delivery to developing tissues, leading to disorders such as blossom-end rot [58]. Consistent with this mechanism, high salinity in our study decreased transpiration, likely restricting calcium transport and contributing to the increased incidence of blossom-end rot [59]. KEGG analysis further revealed downregulation of calcium-associated signaling components, including CNGC channels, calmodulin (SlCaM6), and CDPK1, along with suppression of MAPK and phosphatidylinositol signaling pathways, indicating a reduced capacity for calcium uptake and downstream calcium signal transduction under sustained salt stress [60,61,62,63]. Future studies should investigate whether optimizing nutrient availability, such as calcium, can reduce blossom-end rot while maintaining the flavor benefits of the higher salinity treatments. Collectively, these results indicate that inoculated EC 7-treated tomato plants enhance salt tolerance through a multi-layered strategy that limits ROS production, reinforces antioxidant defenses, and preserves cellular integrity, thereby maintaining redox homeostasis. Also, reinforcing the idea that energy and oxidative stress management are prioritized over pathogen defense.
Future research should be conducted to determine the range of soil salinity levels for reducing BST without compromising fruit yield and to explore the effects of salinity on BST under field conditions, with particular attention to its impacts on disease pressure, yield, and fruit quality, which will be essential for practical application in commercial tomato production. Additionally, integrating salt stress into breeding programs to select for dual tolerance to salinity and disease could offer a strategic approach to crop improvement. Understanding the role of stomatal dynamics in disease suppression may also provide deeper insight into plant responses under combined stress conditions. While salinity is often viewed as a limiting factor in agriculture, our findings suggest that, when managed appropriately, it can play a beneficial role in enhancing disease resistance and fruit quality in tomato plants for sustainable tomato production in Florida and beyond.
5. Conclusions
In conclusion, this study provides valuable insights into how salinity affected tomato plants and BST development. Salt priming with NaCl significantly reduced BST severity, likely through indirect physiological effects such as stomatal closure, altered hormone signaling, and the activation of abiotic stress pathways. Given its effectiveness in reducing BST, there may be a potential for salt treatment with NaCl at low concentrations in BST disease management, particularly in controlled environments like greenhouses.
Supplementary Materials
The following supporting information can be downloaded at the website of this paper posted on Preprints.org. Figure S1: Evaluation form completed by all participants in the taste panel to assess quality of tomatoes grown under salinity treatments.; Table S1: Summary of RNA-Seq Data Quality Metrics.; Table S2: Effect of salinity on bacterial spot of tomato plants in a greenhouse; from RNA-seq experiment.; Table S3: Electrical conductivity (EC) of water leachate and soil samples under salinity treatments from RNA-seq experiments.
Author Contributions
Conceptualization, S.Z.; methodology, K.P., A.V., and B.S.; validation, B.S., J.B.J. and S.Z.; formal analysis, K.P.; investigation, K.P.; resources, B.S., J.B.J., and S.Z.; data curation, K.P.; writing—original draft preparation, K.P.; writing—review and editing, K.P., B.S., J.B.J., and S.Z.; visualization, K.P.; supervision, G.M., B.S., J.B.J., and S.Z.; project administration, K.P. and S.Z.; funding acquisition, G.M. and S.Z. All authors have read and agreed to the published version of the manuscript.
Funding
This research was funded through a subrecipient grant awarded by the United State Department of Agriculture, Agriculture Marketing Service through the Florida Department of Agriculture and Consumer Services Specialty Crop Block Grant Program (AWD11715) (2022–2024). The contents do not necessarily reflect the views or policies of the United States Department of Agriculture nor does mention of trade names, commercial productions, services or organization imply endorsement by the U.S. Government.
Data Availability Statement
This manuscript includes all data produced or analyzed during this project. Further inquiries can be directed to the corresponding authors.
Acknowledgments
The authors thank Dr. Pamela S. Dutra and Christ Mane Belizaire for their assistance with plant care, including watering and treatment. We also thank Dr. Yuncong Li for his advice on salinity testing of water leachate and soil samples, Dr. Edivan Rodrigues de Souza for his assistance with the osmolarity methodology. We thank Dr. Mousami Poudel for her advice on leaf sampling and Jerry Minsavage for maintaining the greenhouse plants used for RNA extraction. We are grateful to Dr. Aastha Subedi for her assistance with RNA extraction and to Dr. Mukesh Jain for his guidance and support in optimizing the RNA extraction protocol. The authors also thank Dr. Yi Huang, Dr. Anuj Sharma, Dr. Jose Tapia, Dr. Vincent N. Michael, and Sisi Chen for their valuable advice and assistance with transcriptomic analyses. We are grateful to the students and staff at the UF/IFAS Tropical Research and Education Center for their participation in the taste trials. Finally, we acknowledge the contributions of all members of the Bruce, Zhang, and Jones laboratories from 2022 to 2025.
Conflicts of Interest
The authors declare no conflicts of interest. The funders had no role in the design of the study; in the collection, analyses, or interpretation of data; in the writing of the manuscript; or in the decision to publish the results.
References
- U.S. Department of Agriculture; National Agricultural Statistics Service. Vegetables Annual Summary 2024. USDA-NASS: Washington, DC, USA, 2025 . Available online: https://downloads.usda.library.cornell.edu/usda-esmis/files/02870v86p/v405v633x/sq87dp937/vegean25.pdf (accessed on 29 June 2026).
- Florida Department of Agriculture and Consumer Services. Florida Agriculture Overview and Statistics. Available online: https://www.fdacs.gov/Agriculture-Industry/Florida-Agriculture-Overview-and-Statistics (accessed on 29 June 2026).
- Strayer-Scherer, A.; Liao, Y.-Y.; Abrahamian, P.; Timilsina, S.; Paret, M.; Momol, T.; Jones, J.; Vallad, G.E. Integrated Management of Bacterial Spot on Tomato in Florida. Edis 2019, 2019, 8. [Google Scholar] [CrossRef]
- Roșca, M.; Mihalache, G.; Stoleru, V. Tomato Responses to Salinity Stress: From Morphological Traits to Genetic Changes. Front. Plant Sci. 2023, 14. [Google Scholar] [CrossRef] [PubMed]
- Maathuis, F.J.M. Sodium in Plants: Perception, Signalling, and Regulation of Sodium Fluxes. J. Exp. Bot. 2014, 65, 849–858. [Google Scholar] [CrossRef] [PubMed]
- Osdaghi, E. Xanthomonas euvesicatoria pv. perforans (Bacterial Spot of Tomato). CABI Compendium. 2020. Available online: https://www.cabidigitallibrary.org/doi/10.1079/cabicompendium.108936 (accessed on 29 June 2026).
- Potnis, N.; Timilsina, S.; Strayer, A.; Shantharaj, D.; Barak, J.D.; Paret, M.L.; Vallad, G.E.; Jones, J.B. Bacterial Spot of Tomato and Pepper: Diverse Xanthomonas Species with a Wide Variety of Virulence Factors Posing a Worldwide Challenge. Mol. Plant Pathol. 2015, 16, 907–920. [Google Scholar] [CrossRef] [PubMed]
- Abrahamian, P.; Klein-Gordon, J.M.; Jones, J.B.; Vallad, G.E. Epidemiology, Diversity, and Management of Bacterial Spot of Tomato Caused by Xanthomonas Perforans. Appl. Microbiol. Biotechnol. 2021, 105, 6143–6158. [Google Scholar] [CrossRef] [PubMed]
- U.S. Department of Agriculture; National Institute of Food and Agriculture. Bacterial Spot of Tomato. Washingto DC, USA: USDA-NIFA, 2016. Available online: https://www.nifa.usda.gov/sites/default/files/resource/Tomato_Spot_Fact_Sheet.pdf (accessed on 29 June 2026).
- Bayabil, H.K.; Li, Y.; Crane, J.; Schaffer, B.; Smyth, A.; Zhang, S.; Evans, E.A.; Blare, T. Saltwater Intrusion and Flooding: Risks to South Florida’s Agriculture and Potential Management Practices. EDIS 2022. [Google Scholar] [CrossRef]
- Food and Agriculture Organization of the United Nations. Soil Salinity. Available online: https://www.fao.org/global-soil-partnership/areas-of-work/soil-salinity/en/ (accessed on 26 June 2026).
- Qadir, M.; Quillérou, E.; Nangia, V.; Murtaza, G.; Singh, M.; Thomas, R.J.; Drechsel, P.; Noble, A.D. Economics of Salt-induced Land Degradation and Restoration. Nat. Resour. Forum 2014, 38, 282–295. [Google Scholar] [CrossRef]
- Jamil, A.; Riaz, S.; Ashraf, M.; Foolad, M.R. Gene Expression Profiling of Plants under Salt Stress. CRC. Crit. Rev. Plant Sci. 2011, 30, 435–458. [Google Scholar] [CrossRef]
- Nebauer, S.G.; Sánchez, M.; Martínez, L.; Lluch, Y.; Renau-Morata, B.; Molina, R.V. Differences in Photosynthetic Performance and Its Correlation with Growth among Tomato Cultivars in Response to Different Salts. Plant Physiol. Biochem. 2013, 63, 61–69. [Google Scholar] [CrossRef] [PubMed]
- Chojak-Koźniewska, J.; Kuźniak, E.; Zimny, J. The Effects of Combined Abiotic and Pathogen Stress in Plants: Insights From Salinity and Pseudomonas Syringae Pv Lachrymans Interaction in Cucumber. Front. Plant Sci. 2018, 9. [Google Scholar] [CrossRef] [PubMed]
- Tiwari, R.K.; Lal, M.K.; Kumar, R.; Mangal, V.; Kumar, A.; Kumar, R.; Sharma, S.; Sagar, V.; Singh, B. Salt Stress Influences the Proliferation of Fusarium Solani and Enhances the Severity of Wilt Disease in Potato. Heliyon 2024, 10, e26718. [Google Scholar] [CrossRef] [PubMed]
- Riska, R.; Jumjunidang, J.; Budiyanti, T.; Darma Husada, E.; Indriyani, N.L.P.; Hadiati, S.; Muas, I.; Mansyah, E. Stem Canker of Dragon Fruit (Hylocereus Polyrhizus): Neocytalidium Sp. Is the New Cause of the Disease and Its Control Using the Sodium Salt. Plant Prot. Sci. 2023, 59, 245–255. [Google Scholar] [CrossRef]
- Gupta, R.; Leibman-Markus, M.; Anand, G.; Rav-David, D.; Yermiyahu, U.; Elad, Y.; Bar, M. Nutrient Elements Promote Disease Resistance in Tomato by Differentially Activating Immune Pathways. Phytopathology 2022, 112, 2360–2371. [Google Scholar] [CrossRef] [PubMed]
- Tanji, K.K.; Kielen, N.C. Agricultural Drainage Water Management in Arid and Semi-Arid Areas Annex 1, Crop Salt Tolerance Data. In FAO Irrigation and Drainage Paper 61; Food and Agriculture Organization of the United Nations: Rome, Italy, 2002; Available online: https://www.fao.org/4/ap103e/ap103e.pdf (accessed on 29 June 2026).
- Rivera, P.; Moya, C.; O’Brien, J.A. Low Salt Treatment Results in Plant Growth Enhancement in Tomato Seedlings. Plants 2022, 11, 807. [Google Scholar] [CrossRef] [PubMed]
- Debouba, M.; Gouia, H.; Ghorbel, M.H. NaCl Effects Growth, Ions and Water Status of Tomato (Lycopersicon Esculentum) Seedlings. Acta Botan. Gall. 2006, 153, 297–307. [Google Scholar] [CrossRef]
- Guo, M.; Wang, X.S.; Guo, H.D.; Bai, S.Y.; Khan, A.; Wang, X.M.; Gao, Y.M.; Li, J.S. Tomato Salt Tolerance Mechanisms and Their Potential Applications for Fighting Salinity: A Review. Front. Plant Sci. 2022, 13. [Google Scholar] [CrossRef] [PubMed]
- Aazami, M.A.; Rasouli, F.; Ebrahimzadeh, A. Oxidative Damage, Antioxidant Mechanism and Gene Expression in Tomato Responding to Salinity Stress under in Vitro Conditions and Application of Iron and Zinc Oxide Nanoparticles on Callus Induction and Plant Regeneration. BMC Plant Biol. 2021, 21, 597. [Google Scholar] [CrossRef] [PubMed]
- Borromeo, I.; Del Gallo, M.; Forni, C. Salt Stress and Tomato Resilience: From Somatic to Intergenerational Priming Memory. Horticulturae 2025, 11, 236. [Google Scholar] [CrossRef]
- Nakaune, M.; Tsukazawa, K.; Uga, H.; Asamizu, E.; Imanishi, S.; Matsukura, C.; Ezura, H. Low Sodium Chloride Priming Increases Seedling Vigor and Stress Tolerance to Ralstonia Solanacearum in Tomato. Plant Biotechnol. 2012, 29, 9–18. [Google Scholar] [CrossRef]
- Habibi, N.; Terada, N.; Sanada, A.; Koshio, K. Alleviating Salt Stress in Tomatoes through Seed Priming with Polyethylene Glycol and Sodium Chloride Combination. Stresses 2024, 4, 210–224. [Google Scholar] [CrossRef]
- Habibi, N.; Aryan, S.; Amin, M.W.; Sanada, A.; Terada, N.; Koshio, K. Potential Benefits of Seed Priming under Salt Stress Conditions on Physiological, and Biochemical Attributes of Micro-Tom Tomato Plants. Plants 2023, 12. [Google Scholar] [CrossRef] [PubMed]
- Tippmann, H.F.; Schlüter, U.; Collinge, D.B.; Teixeira da Silva, J.A. Common Themes in Biotic and Abiotic Stress Signalling in Plants. Floric. Ornam. Plant Biotechnol. 2006, 3, 52–67. [Google Scholar]
- Liu, H.; Able, A.J.; Able, J.A. Priming Crops for the Future: Rewiring Stress Memory. Trends Plant Sci. 2022, 27, 699–716. [Google Scholar] [CrossRef] [PubMed]
- Ben Abdallah, M.; Methenni, K.; Taamalli, W.; Hessini, K.; Ben Youssef, N. Cross-Priming Approach Induced Beneficial Metabolic Adjustments and Repair Processes during Subsequent Drought in Olive. Water . 2022, 14, 4050. [Google Scholar] [CrossRef]
- Nasrallah, A.K.; Atia, M.A.M.; Abd El-Maksoud, R.M.; Kord, M.A.; Fouad, A.S. Salt Priming as a Smart Approach to Mitigate Salt Stress in Faba Bean (Vicia Faba L.). Plants 2022, 11, 1610. [Google Scholar] [CrossRef] [PubMed]
- Raziq, A.; Wang, Y.; Mohi Ud Din, A.; Sun, J.; Shu, S.; Guo, S. A Comprehensive Evaluation of Salt Tolerance in Tomato (Var. Ailsa Craig): Responses of Physiological and Transcriptional Changes in RBOH’s and ABA Biosynthesis and Signalling Genes. Int. J. Mol. Sci. 2022, 23. [Google Scholar] [CrossRef] [PubMed]
- Kiferle, C.; Gonzali, S.; Beltrami, S.; Martinelli, M.; Hora, K.; Holwerda, H.T.; Perata, P. Improvement in Fruit Yield and Tolerance to Salinity of Tomato Plants Fertigated with Micronutrient Amounts of Iodine. Sci. Rep. 2022, 12, 14655. [Google Scholar] [CrossRef] [PubMed]
- Martinez-Rodriguez, M.M.; Estañ, M.T.; Moyano, E.; Garcia-Abellan, J.O.; Flores, F.B.; Campos, J.F.; Al-Azzawi, M.J.; Flowers, T.J.; Bolarín, M.C. The Effectiveness of Grafting to Improve Salt Tolerance in Tomato When an ‘Excluder’ Genotype Is Used as Scion. Environ. Exp. Bot. 2008, 63, 392–401. [Google Scholar] [CrossRef]
- Vidaver, A.K.; Lambrecht, P.A. Bacteria as Plant Pathogens. In The Plant Health Instructor; 2004. [Google Scholar] [CrossRef]
- Yang, Y.-B.; Yin, J.; Huang, L.-Q.; Li, J.; Chen, D.-K.; Yao, N. Salt Enhances Disease Resistance and Suppresses Cell Death in Ceramide Kinase Mutants. Plant Physiol. 2019, 181, 319–331. [Google Scholar] [CrossRef] [PubMed]
- Pandey, P.; Patil, M.; Priya, P.; Senthil-Kumar, M. When Two Negatives Make a Positive: The Favorable Impact of the Combination of Abiotic Stress and Pathogen Infection on Plants. J. Exp. Bot. 2024, 75, 674–688. [Google Scholar] [CrossRef] [PubMed]
- Meng, X.; Zhang, S. MAPK Cascades in Plant Disease Resistance Signaling. Annu. Rev. Phytopathol. 2013, 51, 245–266. [Google Scholar] [CrossRef] [PubMed]
- Thilmony, R.; Underwood, W.; He, S.Y. Genome-wide Transcriptional Analysis of the Arabidopsis Thaliana Interaction with the Plant Pathogen Pseudomonas Syringae Pv. Tomato DC3000 and the Human Pathogen Escherichia Coli O157:H7. Plant J. 2006, 46, 34–53. [Google Scholar] [CrossRef] [PubMed]
- Subedi, A.; Minsavage, G. V.; Roberts, P.D.; Goss, E.M.; Sharma, A.; Jones, J.B. Insights into Bs5 Resistance Mechanisms in Pepper against Xanthomonas Euvesicatoria through Transcriptome Profiling. BMC Genom. 2024, 25. [Google Scholar] [CrossRef] [PubMed]
- Amoroso, C.G.; D’Esposito, D.; Aiese Cigliano, R.; Ercolano, M.R. Comparison of Tomato Transcriptomic Profiles Reveals Overlapping Patterns in Abiotic and Biotic Stress Responses. Int. J. Mol. Sci. 2023, 24, 4061. [Google Scholar] [CrossRef] [PubMed]
- Hasanuzzaman, M.; Raihan, Md.R.H.; Masud, A.A.C.; Rahman, K.; Nowroz, F.; Rahman, M.; Nahar, K.; Fujita, M. Regulation of Reactive Oxygen Species and Antioxidant Defense in Plants under Salinity. Int. J. Mol. Sci. 2021, 22, 9326. [Google Scholar] [CrossRef] [PubMed]
- Li, X.-P.; Björkman, O.; Shih, C.; Grossman, A.R.; Rosenquist, M.; Jansson, S.; Niyogi, K.K. A Pigment-Binding Protein Essential for Regulation of Photosynthetic Light Harvesting. Nature 2000, 403, 391–395. [Google Scholar] [CrossRef] [PubMed]
- Hunsperger, H.M.; Ford, C.J.; Miller, J.S.; Cattolico, R.A. Differential Regulation of Duplicate Light-Dependent Protochlorophyllide Oxidoreductases in the Diatom Phaeodactylum Tricornutum. PLoS ONE 2016, 11, e0158614. [Google Scholar] [CrossRef] [PubMed]
- Sinha, N.; Eirich, J.; Finkemeier, I.; Grimm, B. Glutamate 1-Semialdehyde Aminotransferase Is Connected to GluTR by GluTR-Binding Protein and Contributes to the Rate-Limiting Step of 5-Aminolevulinic Acid Synthesis. Plant Cell 2022, 34, 4623–4640. [Google Scholar] [CrossRef] [PubMed]
- Tripathy, B.C.; Pattanayak, G.K. Chlorophyll Biosynthesis in Higher Plants. In Photosynthesis;Advances in Photosynthesis and Respiration; Eaton-Rye, J.J., Tripathy, B.C., Sharkey, T.D., Eds.; Springer: Dordrecht, The Netherlands, 2012; Vol. 34, pp. 63–94. [Google Scholar] [CrossRef]
- Obata, T.; Fernie, A.R. The Use of Metabolomics to Dissect Plant Responses to Abiotic Stresses. Cell. Mol. Life Sci. 2012, 69, 3225–3243. [Google Scholar] [CrossRef] [PubMed]
- Khan, I.; Sohail; Zaman, S.; Li, G.; Fu, M. Adaptive Responses of Plants to Light Stress: Mechanisms of Photoprotection and Acclimation. A Review. Front. Plant Sci. 2025, 16. [Google Scholar] [CrossRef] [PubMed]
- Sathasivam, R.; Radhakrishnan, R.; Kim, J.K.; Park, S.U. An Update on Biosynthesis and Regulation of Carotenoids in Plants. South Afr. J. Bot. 2021, 140, 290–302. [Google Scholar] [CrossRef]
- Rashida, Z.; Laxman, S. The Pentose Phosphate Pathway and Organization of Metabolic Networks Enabling Growth Programs. Curr. Opin. Syst. Biol. 2021, 28, 100390. [Google Scholar] [CrossRef]
- Heidari, P.; Mazloomi, F.; Nussbaumer, T.; Barcaccia, G. Insights into the SAM Synthetase Gene Family and Its Roles in Tomato Seedlings under Abiotic Stresses and Hormone Treatments. Plants 2020, 9, 586. [Google Scholar] [CrossRef] [PubMed]
- Cueno, M.E.; Imai, K.; Ochiai, K.; Okamoto, T. Cytokinin Dehydrogenase Differentially Regulates Cytokinin and Indirectly Affects Hydrogen Peroxide Accumulation in Tomato Leaf. J. Plant Physiol. 2012, 169, 834–838. [Google Scholar] [CrossRef] [PubMed]
- Li, B.; Hou, L.; Song, C.; Wang, Z.; Xue, Q.; Li, Y.; Qin, J.; Cao, N.; Jia, C.; Zhang, Y.; et al. Biological Function of Calcium-Sensing Receptor (CAS) and Its Coupling Calcium Signaling in Plants. Plant Physiol. Biochem. 2022, 180, 74–80. [Google Scholar] [CrossRef] [PubMed]
- Jiang, Z.; van Zanten, M.; Sasidharan, R. Mechanisms of Plant Acclimation to Multiple Abiotic Stresses. Commun. Biol. 2025, 8, 655. [Google Scholar] [CrossRef] [PubMed]
- Yin, Y.G.; Kobayashi, Y.; Sanuki, A.; Kondo, S.; Fukuda, N.; Ezura, H.; Sugaya, S.; Matsukura, C. Salinity Induces Carbohydrate Accumulation and Sugar-Regulated Starch Biosynthetic Genes in Tomato (Solanum Lycopersicum L. Cv. ’Micro-Tom’) Fruits in an ABA-and Osmotic Stress-Independent Manner. J. Exp. Bot. 2010, 61, 563–574. [Google Scholar] [CrossRef] [PubMed]
- Zhang, H.; Zhang, K.; Zhao, X.; Bi, M.; Liu, Y.; Wang, S.; He, Y.; Ma, K.; Qi, M. Galactinol Synthase 2 Influences the Metabolism of Chlorophyll, Carotenoids, and Ethylene in Tomato Fruits. J. Exp. Bot. 2024, 75, 3337–3350. [Google Scholar] [CrossRef] [PubMed]
- Petersen, K.K.; Willumsen, J.; Kaack, K. Composition and Taste of Tomatoes as Affected by Increased Salinity and Different Salinity Sources. J. Hortic. Sci. Biotechnol. 1998, 73, 205–215. [Google Scholar] [CrossRef]
- Kabir, Md.Y.; Díaz-Pérez, J.C. Calcium Route in the Plant and Blossom-End Rot Incidence. Horticulturae 2025, 11, 807. [Google Scholar] [CrossRef]
- Zhai, Y.; Yang, Q.; Hou, M. The Effects of Saline Water Drip Irrigation on Tomato Yield, Quality, and Blossom-End Rot Incidence --- A 3a Case Study in the South of China. PLoS ONE 2015, 10, e0142204. [Google Scholar] [CrossRef] [PubMed]
- Hu, Z.; Lv, X.; Xia, X.; Zhou, J.; Shi, K.; Yu, J.; Zhou, Y. Genome-Wide Identification and Expression Analysis of Calcium-Dependent Protein Kinase in Tomato. Front. Plant Sci. 2016, 7. [Google Scholar] [CrossRef] [PubMed]
- Saand, M.A.; Xu, Y.-P.; Munyampundu, J.-P.; Li, W.; Zhang, X.-R.; Cai, X.-Z. Phylogeny and Evolution of Plant Cyclic Nucleotide-Gated Ion Channel (CNGC) Gene Family and Functional Analyses of Tomato CNGCs. DNA Res. 2015, 22, 471–483. [Google Scholar] [CrossRef] [PubMed]
- Munnik, T.; Meijer, H.J.G. Osmotic Stress Activates Distinct Lipid and MAPK Signalling Pathways in Plants. FEBS Lett. 2001, 498, 172–178. [Google Scholar] [CrossRef] [PubMed]
- Yang, T.; Peng, H.; Bauchan, G.R. Functional Analysis of Tomato Calmodulin Gene Family during Fruit Development and Ripening. Hortic. Res. 2014, 1, 14057. [Google Scholar] [CrossRef] [PubMed]
- Ashraf, M.; Harris, P.J.C. Potential Biochemical Indicators of Salinity Tolerance in Plants. Plant Sci. 2004, 166, 3–16. [Google Scholar] [CrossRef]
- Benjamini, Y.; Hochberg, Y. Controlling the False Discovery Rate: A Practical and Powerful Approach to Multiple Testing. J. R. Stat. Soc. Ser. B Stat. Methodol. 1995, 57, 289–300. [Google Scholar] [CrossRef]
Figure 1.
Disease severity of bacterial spot on tomato leaves inoculated with QL strain of X. perforans under salinity treatments in greenhouse. Photo courtesy of author Ketsira Pierre.
Figure 1.
Disease severity of bacterial spot on tomato leaves inoculated with QL strain of X. perforans under salinity treatments in greenhouse. Photo courtesy of author Ketsira Pierre.
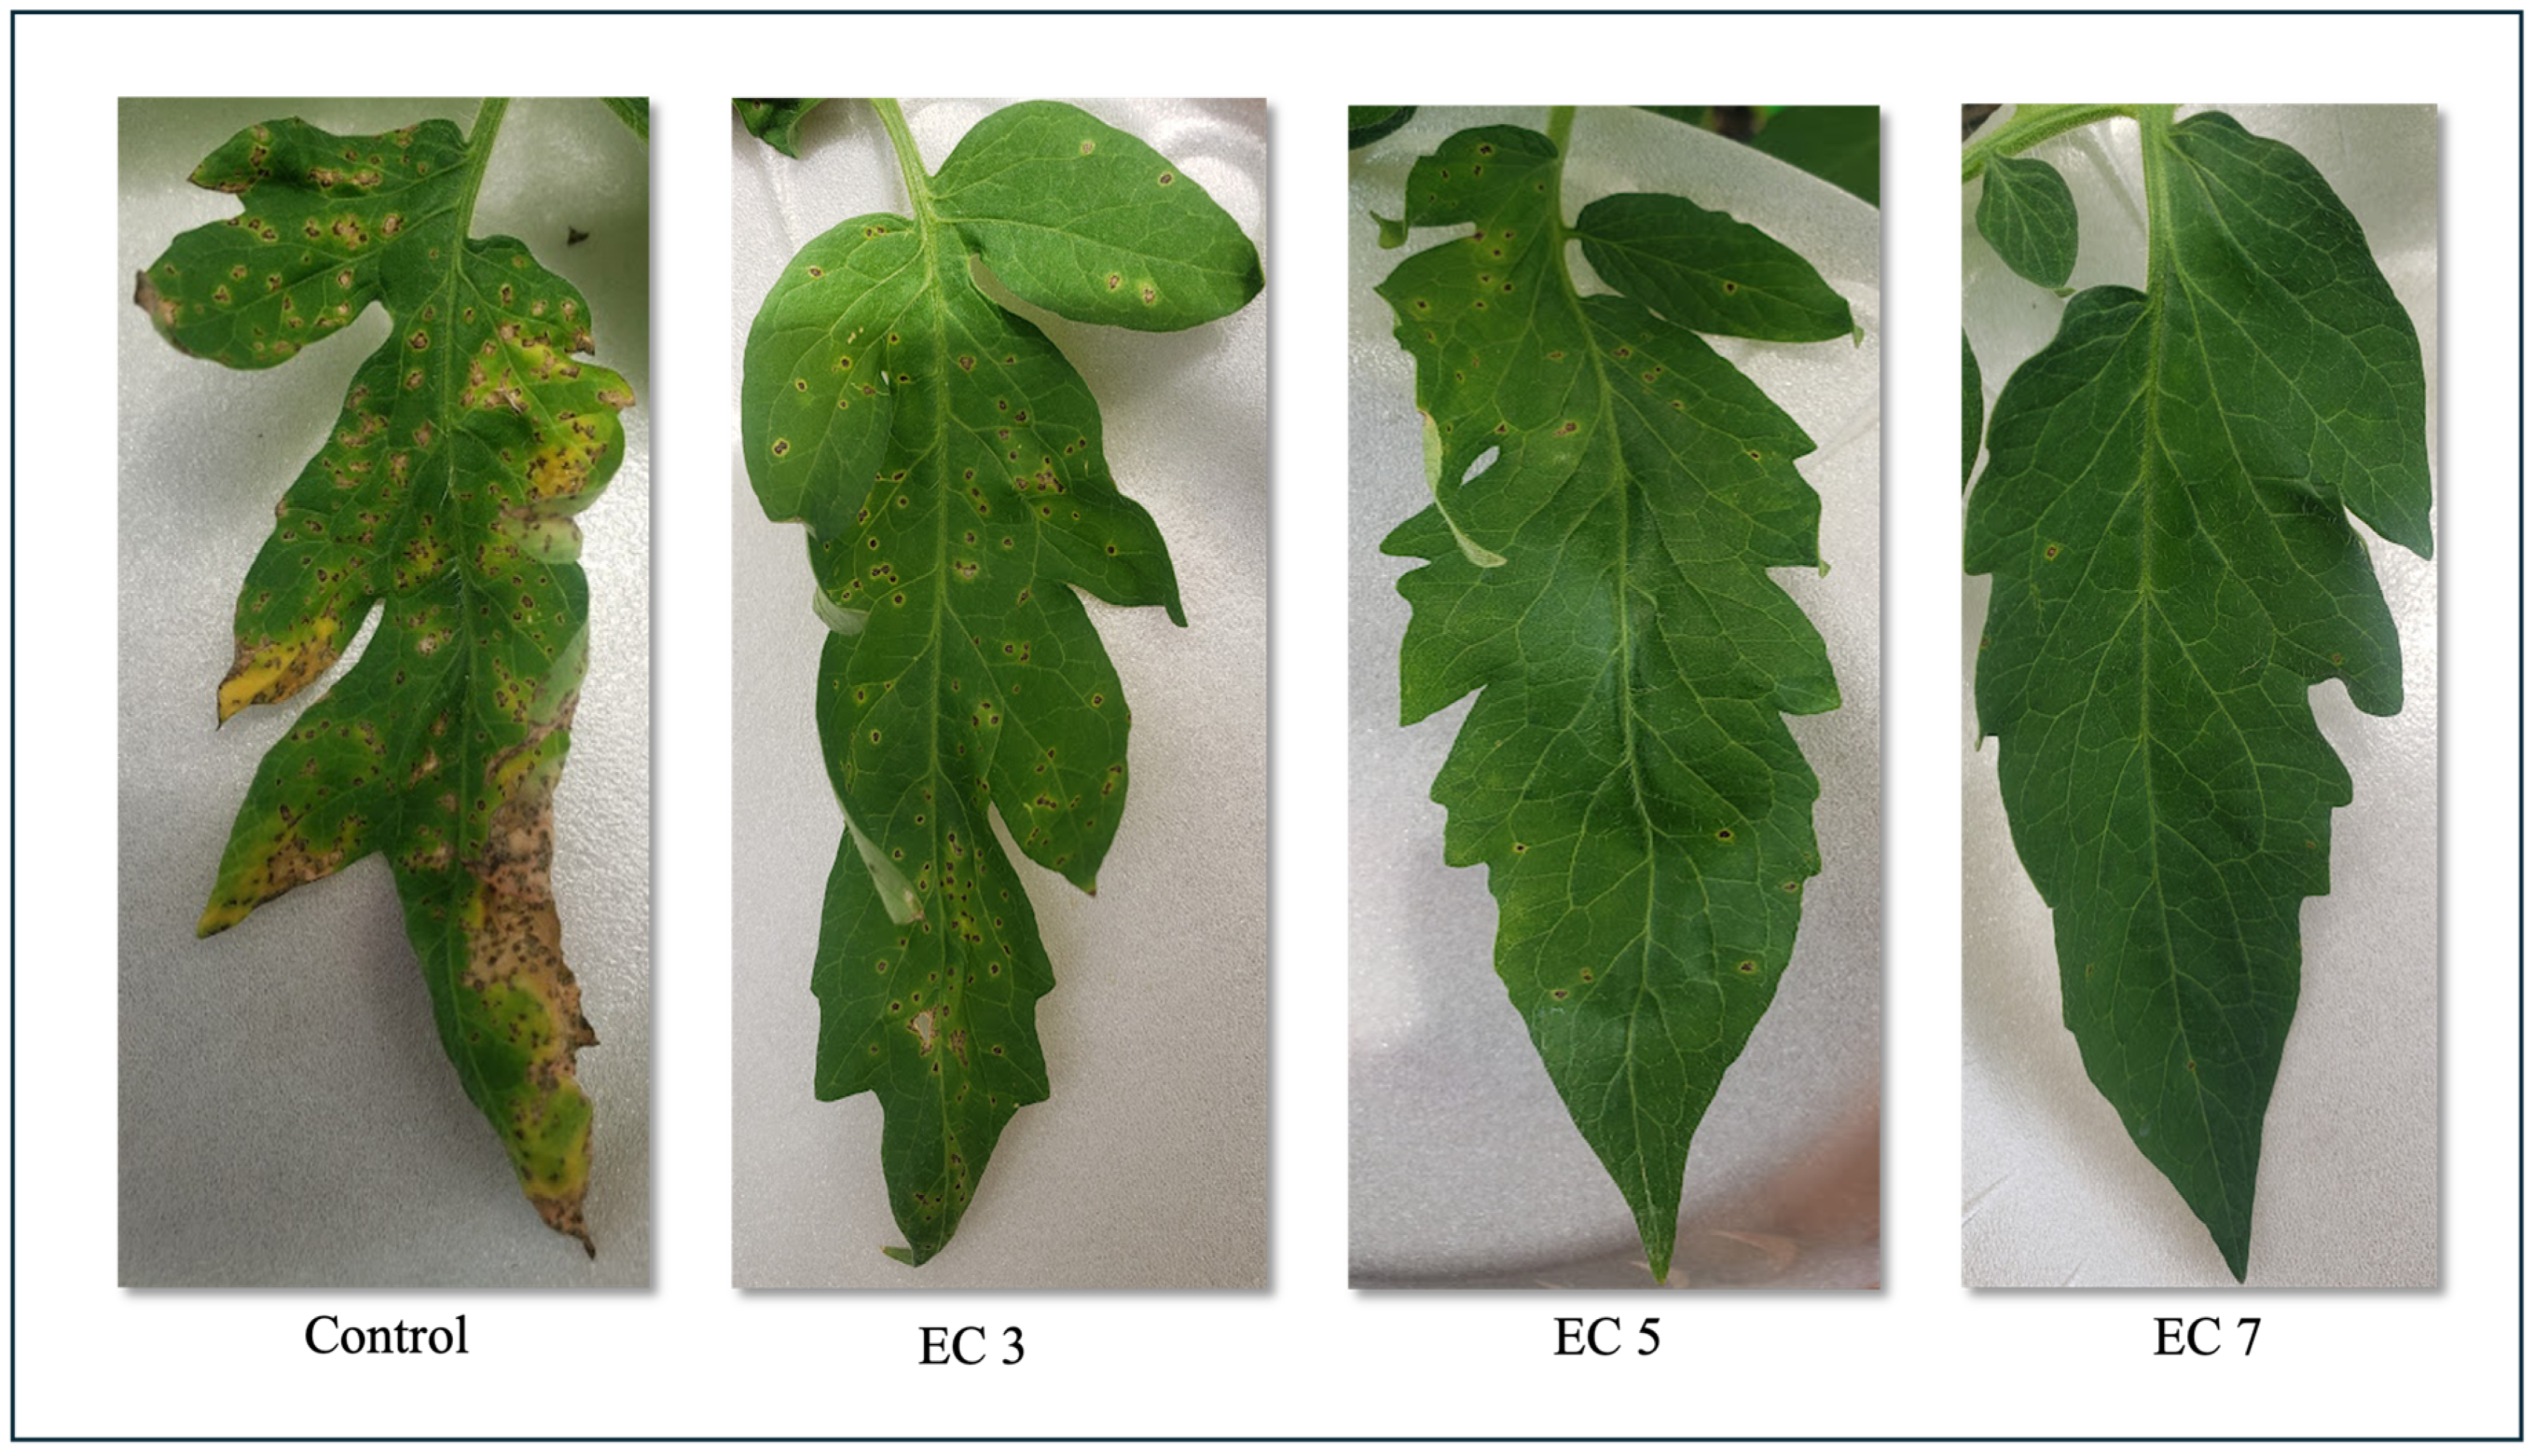
Figure 2.
Effect of salinity treatment on photosynthesis parameters. Measurements of (A) net CO2 assimilation (A), (B) transpiration (E), and (C) stomatal conductance (gs) to assess the physiological response of inoculated and non-inoculated tomato plants under salt stress. Each treatment included three replicates, and error bars represent standard deviation. Statistical analysis was performed by ANOVA followed by Tukey’s post-hoc test; different letters above the bars indicate statistically significant differences among treatments (P < 0.05). Each experiment was conducted twice.
Figure 2.
Effect of salinity treatment on photosynthesis parameters. Measurements of (A) net CO2 assimilation (A), (B) transpiration (E), and (C) stomatal conductance (gs) to assess the physiological response of inoculated and non-inoculated tomato plants under salt stress. Each treatment included three replicates, and error bars represent standard deviation. Statistical analysis was performed by ANOVA followed by Tukey’s post-hoc test; different letters above the bars indicate statistically significant differences among treatments (P < 0.05). Each experiment was conducted twice.
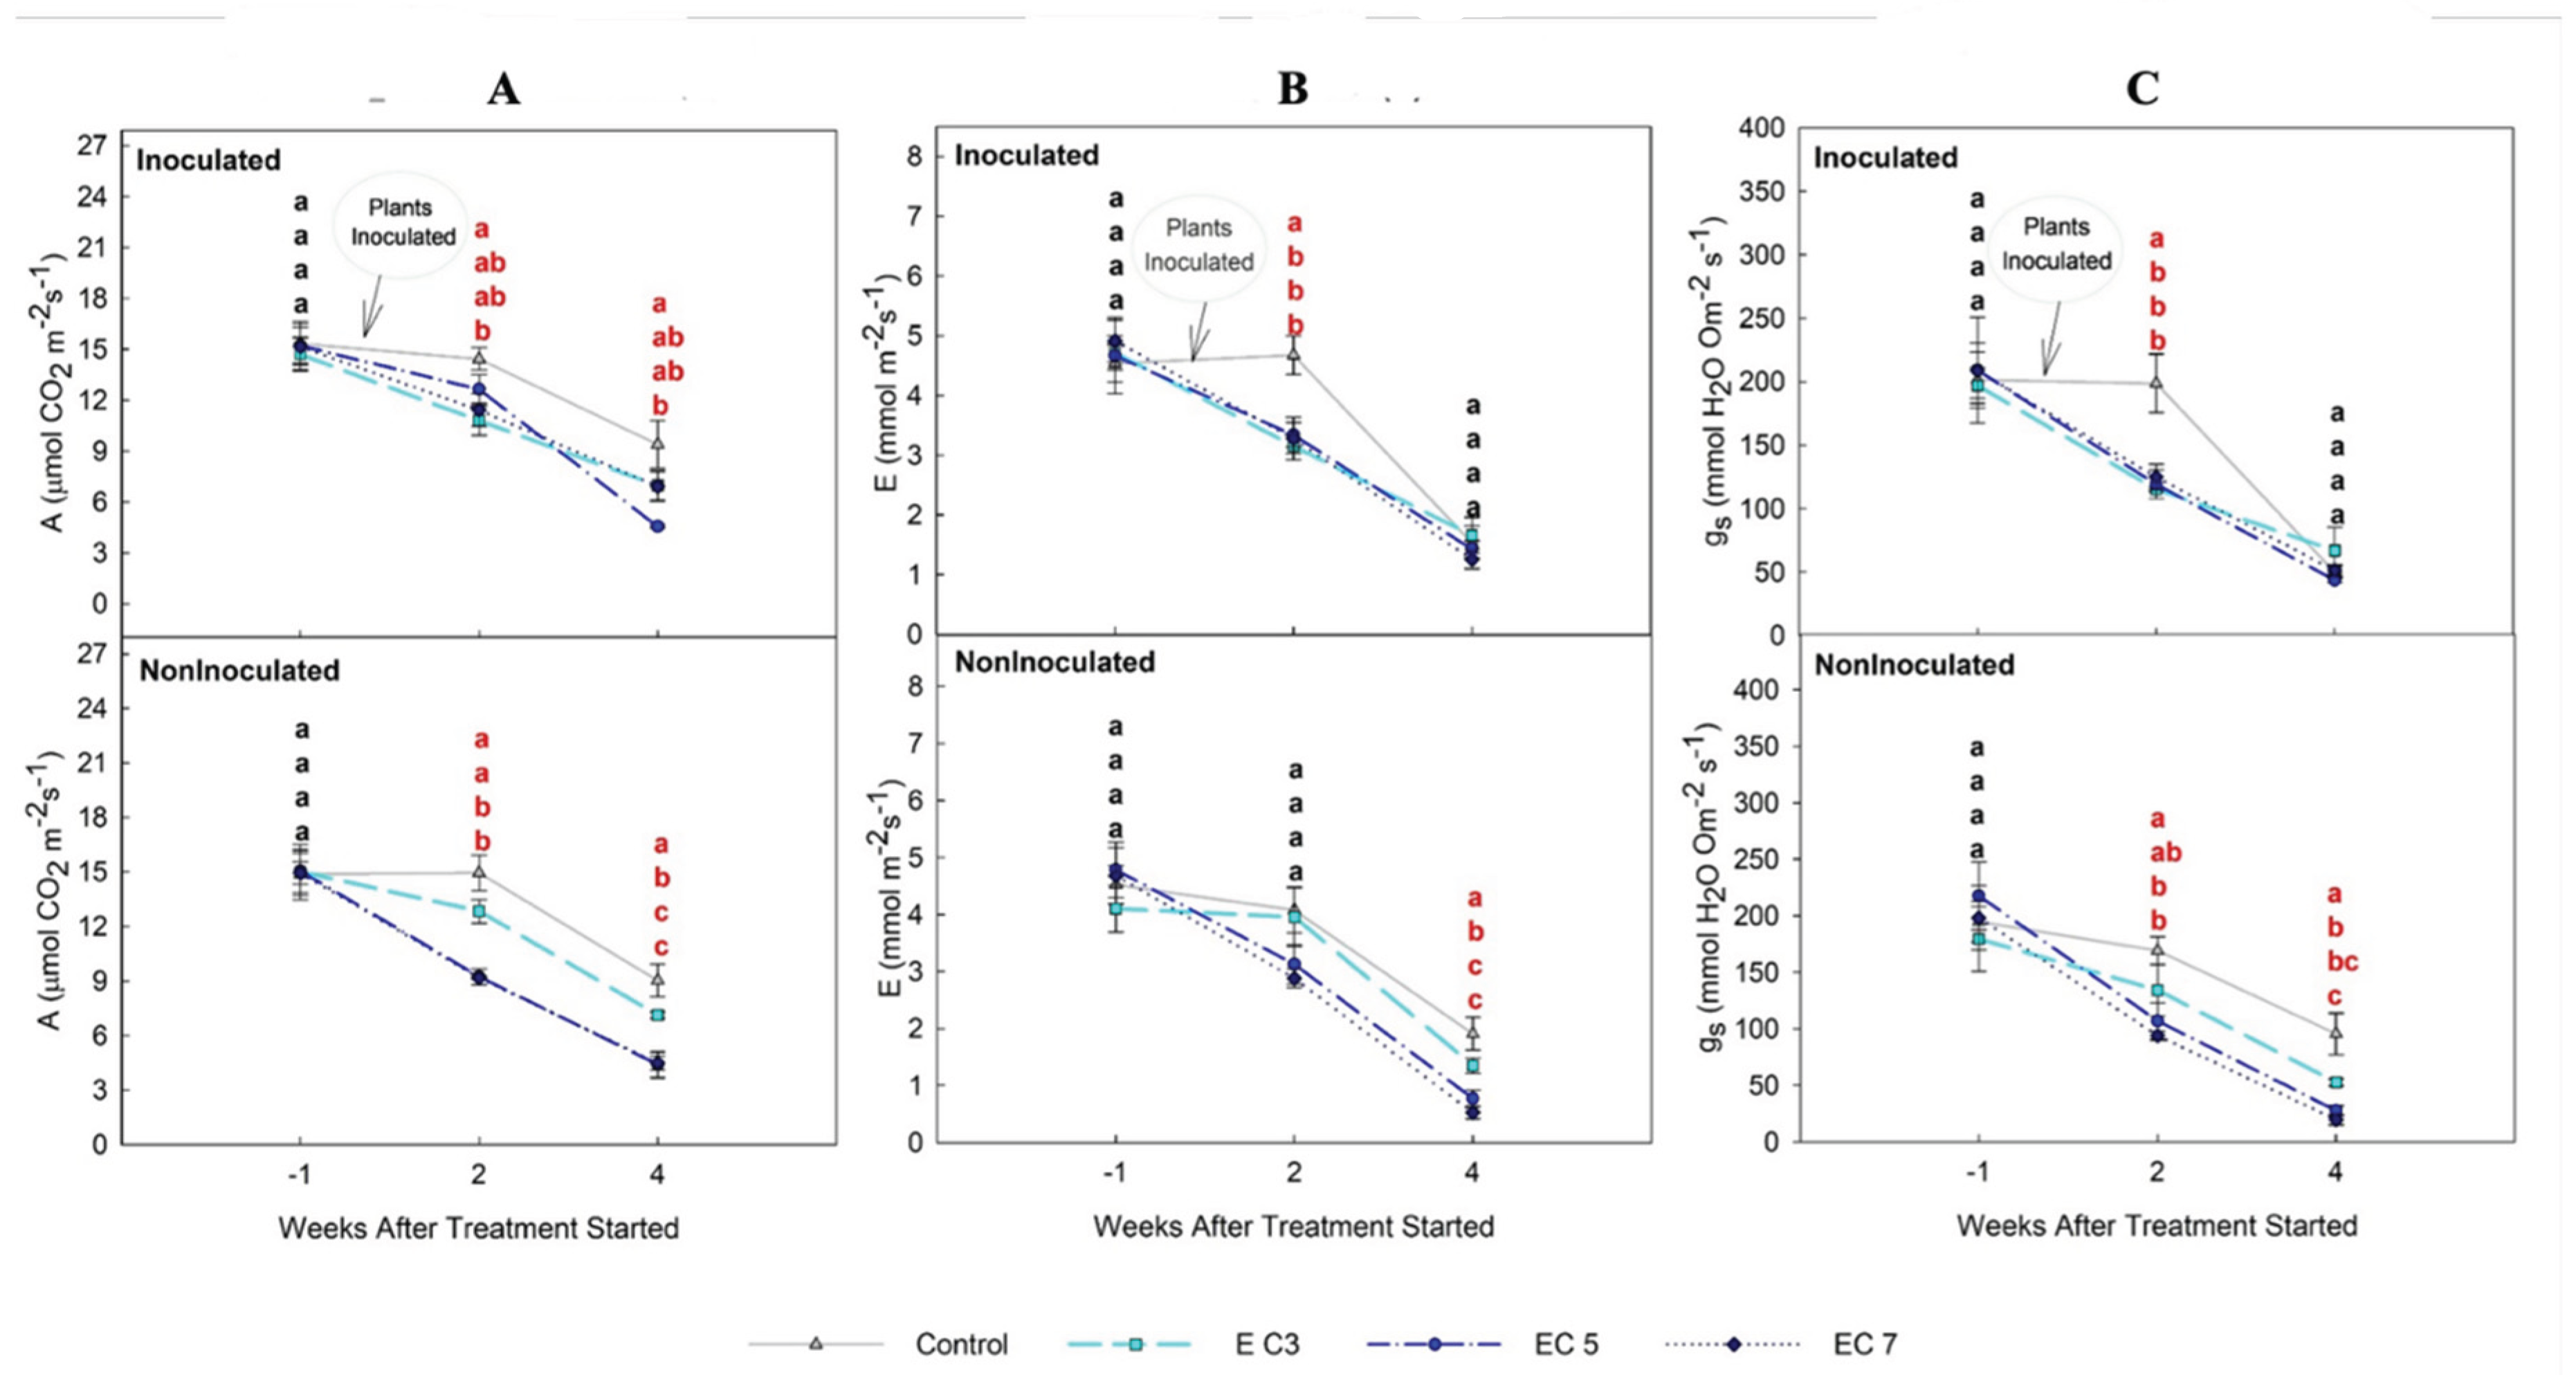
Figure 3.
Effect of salinity treatments on bacterial populations. (A) In vitro activity of salinity treatments against X. perforans (QL) at 0 h, 1 h, 4 h, and 24 h. (B) In planta bacterial populations of X. perforans (QL) in tomato leaves under salinity treatments at 0-, 3-, 6-, and 9-days post-inoculation. Each treatment included three replicates, and error bars represent standard deviation. Statistical analysis was performed by ANOVA followed by Tukey’s post-hoc test; different letters above the bars indicate statistically significant differences among treatments (P < 0.05). Each experiment was conducted twice.
Figure 3.
Effect of salinity treatments on bacterial populations. (A) In vitro activity of salinity treatments against X. perforans (QL) at 0 h, 1 h, 4 h, and 24 h. (B) In planta bacterial populations of X. perforans (QL) in tomato leaves under salinity treatments at 0-, 3-, 6-, and 9-days post-inoculation. Each treatment included three replicates, and error bars represent standard deviation. Statistical analysis was performed by ANOVA followed by Tukey’s post-hoc test; different letters above the bars indicate statistically significant differences among treatments (P < 0.05). Each experiment was conducted twice.
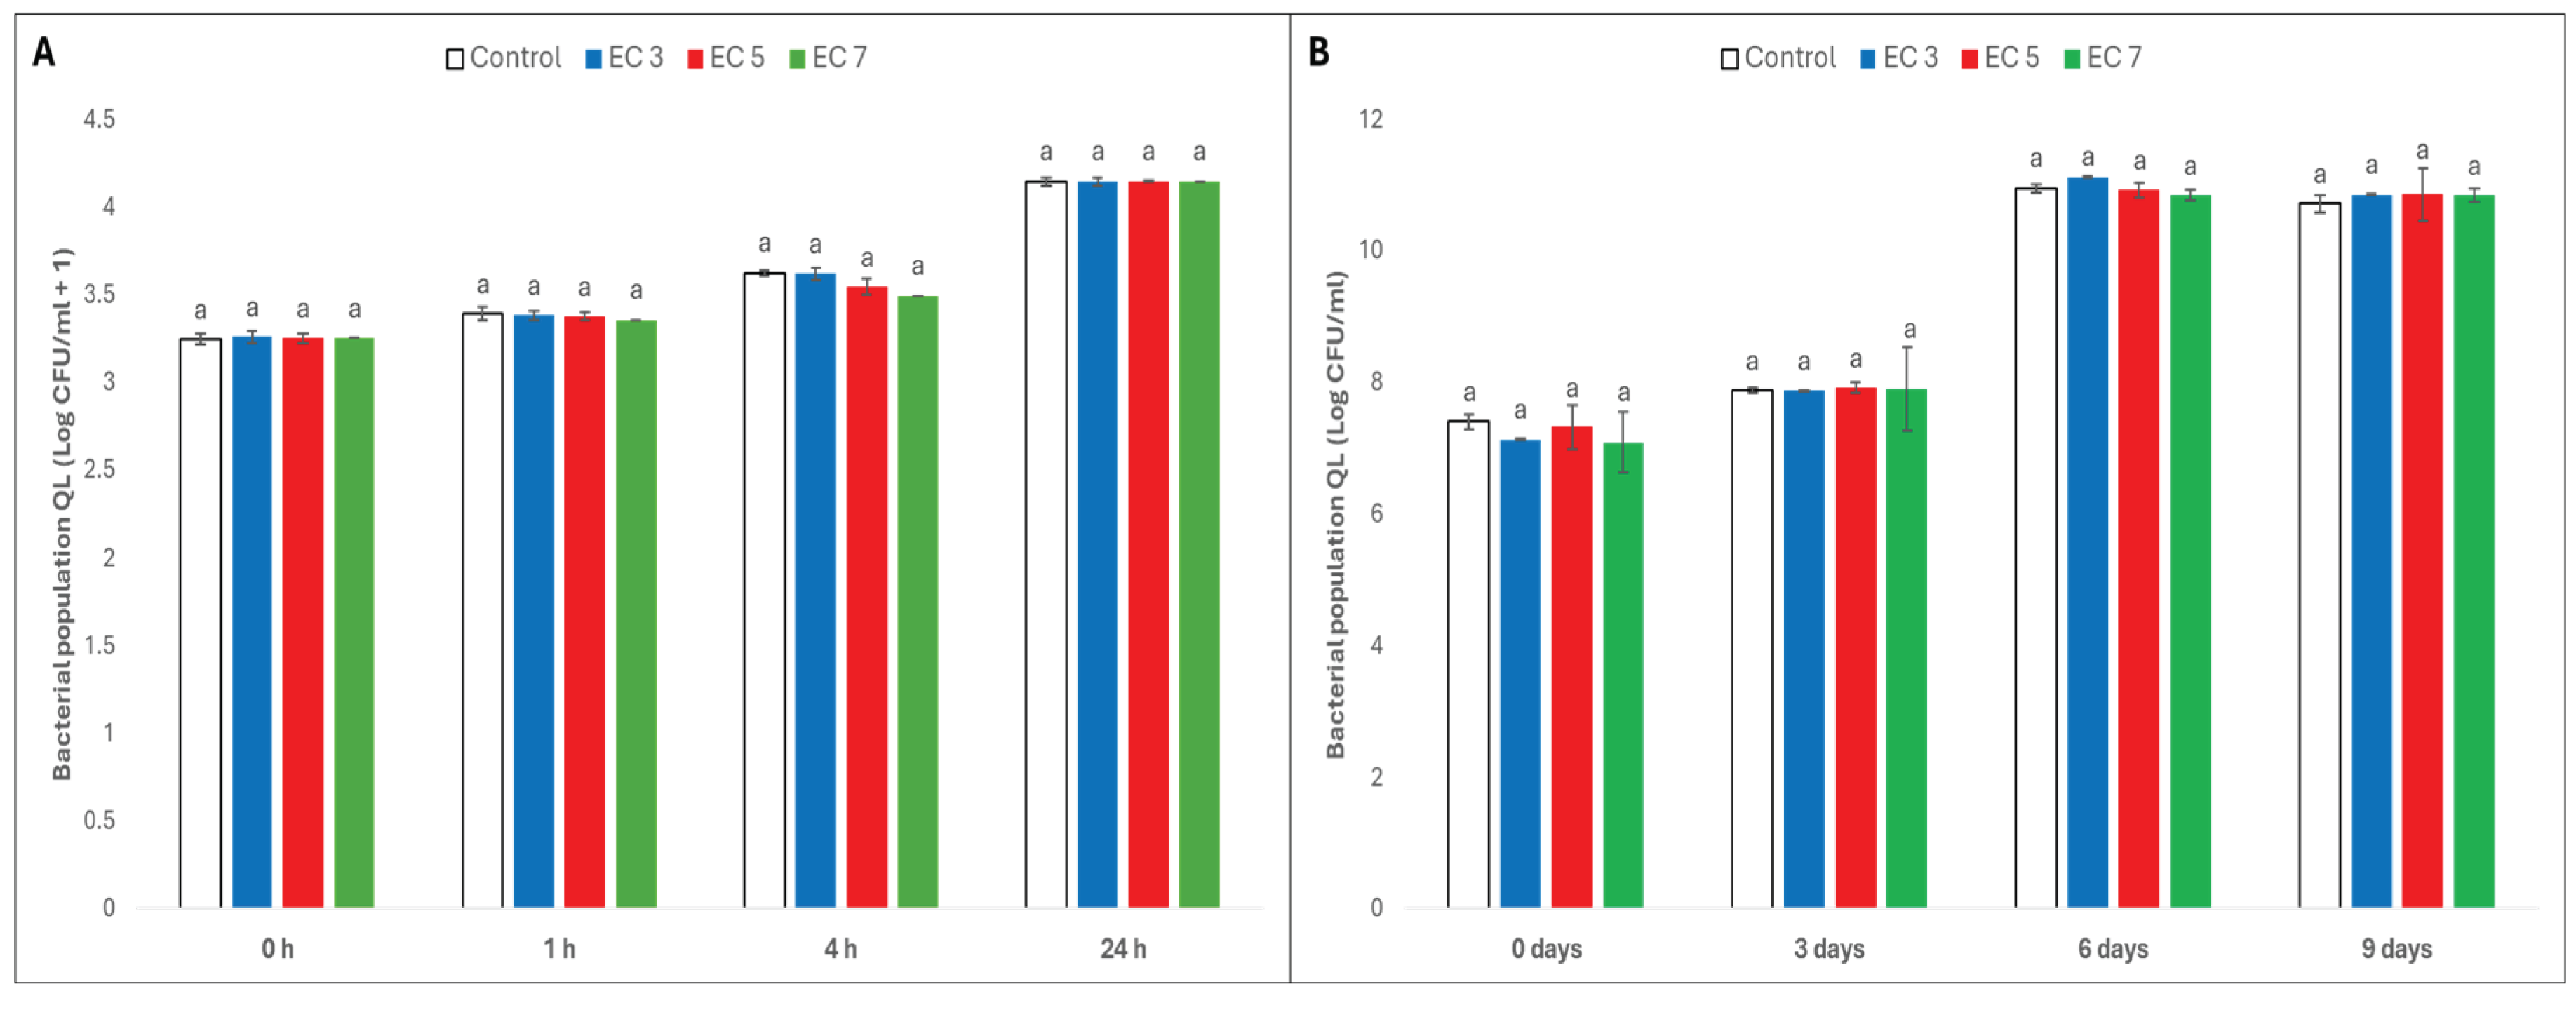
Figure 4.
Results from the tomato taste panel of tomato fruit quality in each salinity treatment. (A) Participant rankings of overall taste preference for tomatoes grown under salinity treatments. (B) Fruit yield of tomato plants subjected to different salinity treatments. (C) Participant evaluations of taste attributes (e.g., sweetness, acidity, sweetness) for tomatoes grown under salinity treatments. Each treatment included three replicates, and error bars represent standard deviation. Statistical analysis was performed by ANOVA followed by Tukey’s post-hoc test; different letters above the bars indicate statistically significant differences among treatments (P < 0.05). Each experiment was conducted twice.
Figure 4.
Results from the tomato taste panel of tomato fruit quality in each salinity treatment. (A) Participant rankings of overall taste preference for tomatoes grown under salinity treatments. (B) Fruit yield of tomato plants subjected to different salinity treatments. (C) Participant evaluations of taste attributes (e.g., sweetness, acidity, sweetness) for tomatoes grown under salinity treatments. Each treatment included three replicates, and error bars represent standard deviation. Statistical analysis was performed by ANOVA followed by Tukey’s post-hoc test; different letters above the bars indicate statistically significant differences among treatments (P < 0.05). Each experiment was conducted twice.
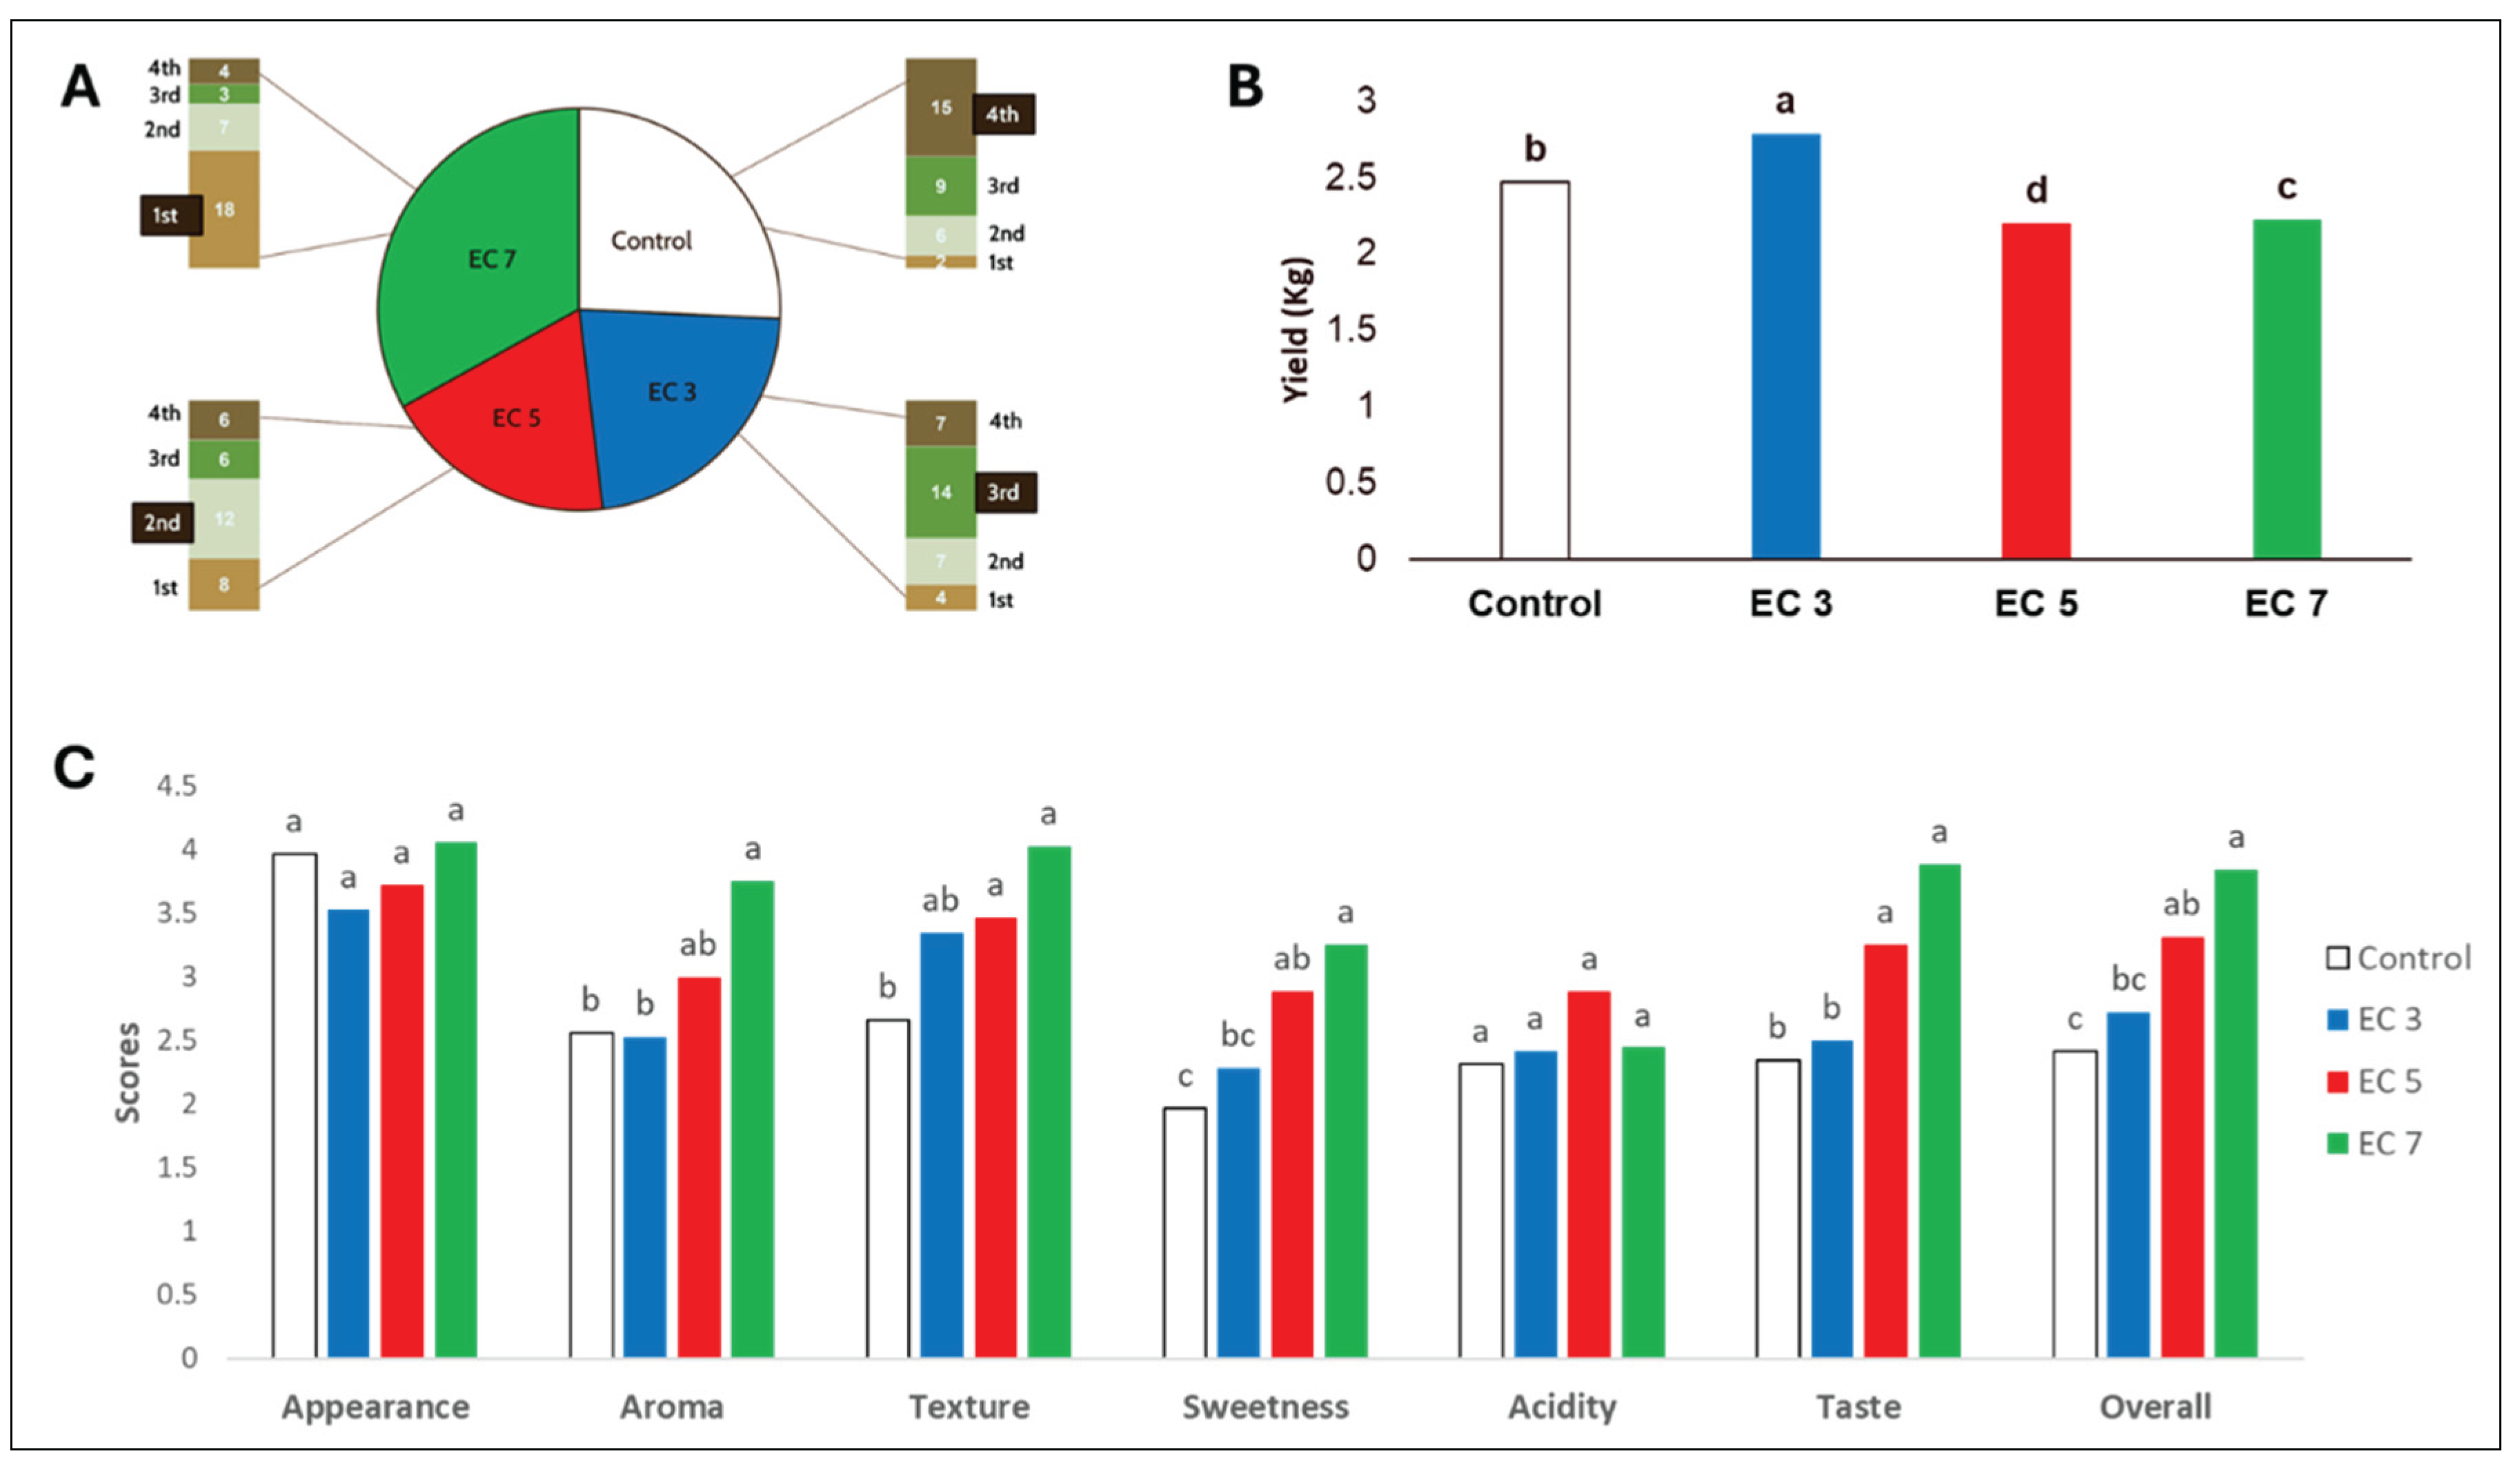
Figure 5.
Transcriptomic comparison of inoculated (I) and non-inoculated (NI) tomato plants in EC 7 (electrical conductivity = 7 dS m-1) and the control (CK) treatments using DESeq2 CK across all sampled timepoints: Before treatment (BT), after treatment (AT), 12-hours post-inoculation [12hpi], 2-, 4-, and 7-days post-inoculation [dpi]). (A) Principal component analysis (PCA) showing sample clustering based on gene expression profiles. (B) Number of differentially expressed genes (DEGs) between I vs. NI plants within each of CK and EC 7 treatments at 12hpi, 2-, 4-, and 7- dpi. (C) Number of DEGs between EC 7 vs. CK treatments in each of I and NI plant groups over time. (D) Venn diagrams showing the number of upregulated and downregulated DEGs in inoculated EC 7 vs. CK at 12hpi, 2-, 4-, and 7- dpi.
Figure 5.
Transcriptomic comparison of inoculated (I) and non-inoculated (NI) tomato plants in EC 7 (electrical conductivity = 7 dS m-1) and the control (CK) treatments using DESeq2 CK across all sampled timepoints: Before treatment (BT), after treatment (AT), 12-hours post-inoculation [12hpi], 2-, 4-, and 7-days post-inoculation [dpi]). (A) Principal component analysis (PCA) showing sample clustering based on gene expression profiles. (B) Number of differentially expressed genes (DEGs) between I vs. NI plants within each of CK and EC 7 treatments at 12hpi, 2-, 4-, and 7- dpi. (C) Number of DEGs between EC 7 vs. CK treatments in each of I and NI plant groups over time. (D) Venn diagrams showing the number of upregulated and downregulated DEGs in inoculated EC 7 vs. CK at 12hpi, 2-, 4-, and 7- dpi.
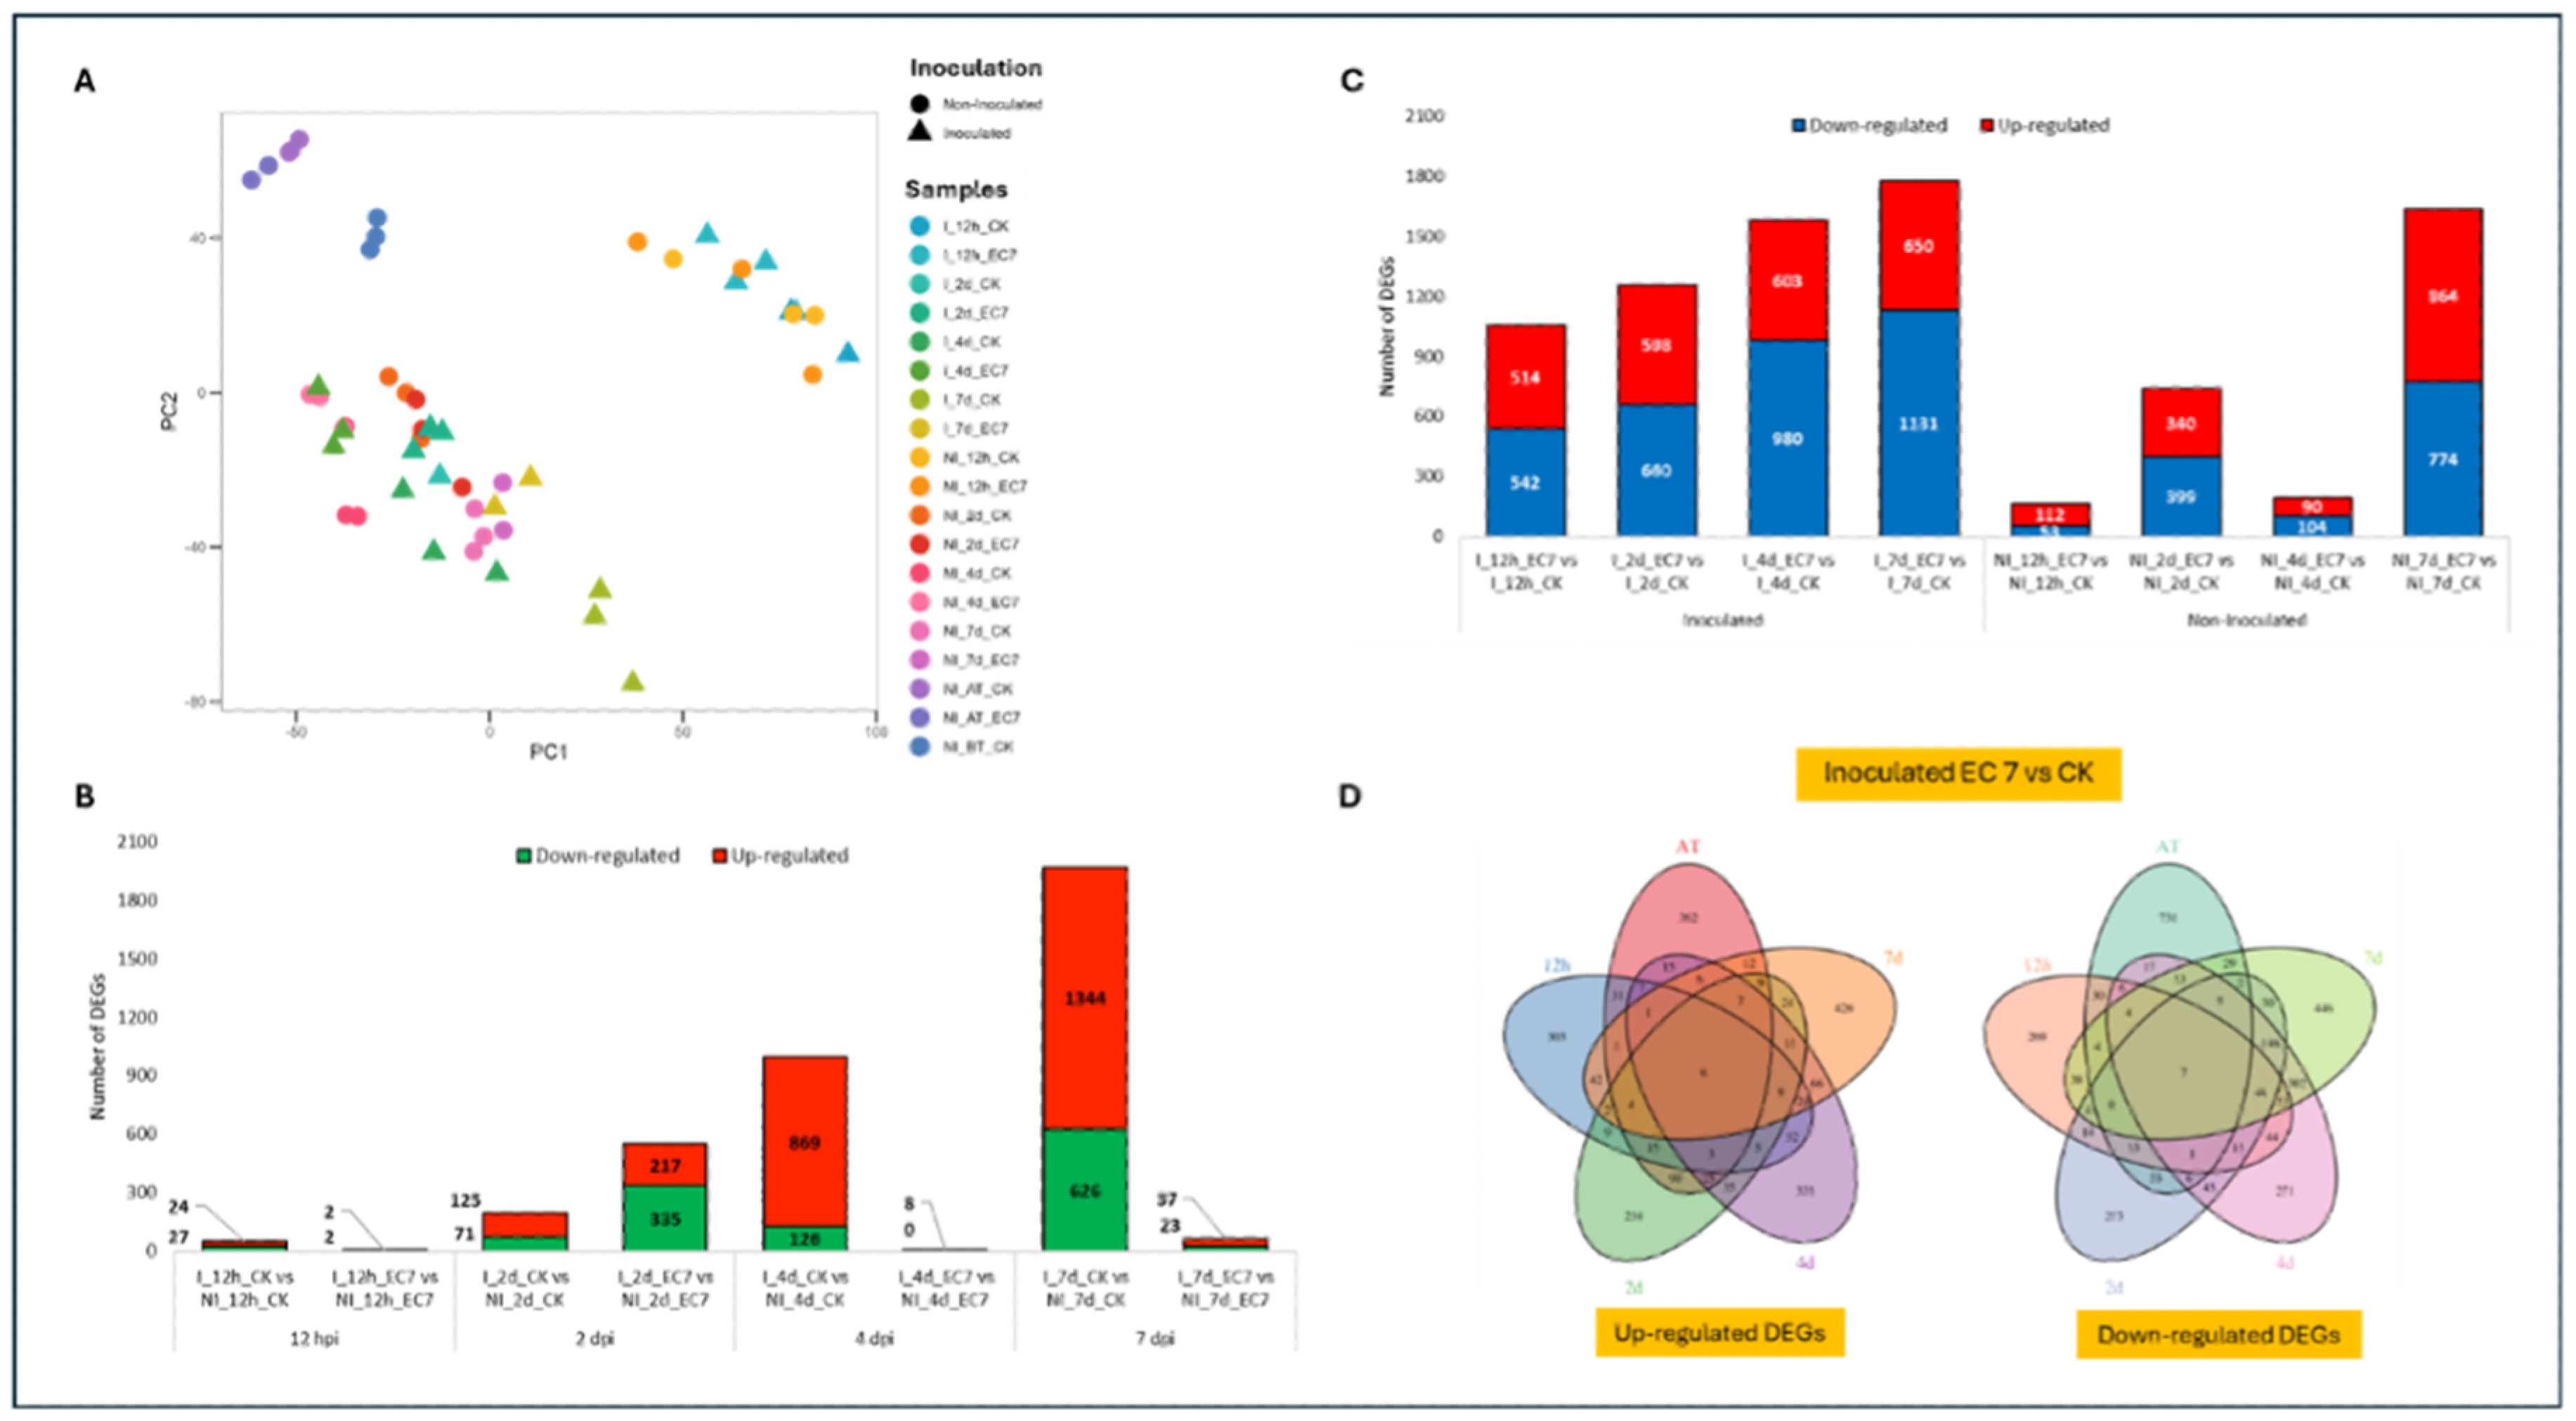
Figure 6.
GO enrichment analysis of differentially expressed genes (DEGs) over time in EC 7 (electrical conductivity = 7 dS m-1) vs. CK (control) treatments. The bubble plot displays the top significantly enriched Gene Ontology (GO) terms at each timepoint (AT, 12h, 2d, 4d, 7d) across three domains: Biological Process (BP), Cellular Component (CC), and Molecular Function (MF). GO terms were identified from up- and down-regulated, and all DEGs (based on DESeq2), with criteria: adj p value ≤ 0.05 and gene count ≥ 10. Bubble size indicates the number of genes enriched in each GO term and bubble color represents category of regulated genes.
Figure 6.
GO enrichment analysis of differentially expressed genes (DEGs) over time in EC 7 (electrical conductivity = 7 dS m-1) vs. CK (control) treatments. The bubble plot displays the top significantly enriched Gene Ontology (GO) terms at each timepoint (AT, 12h, 2d, 4d, 7d) across three domains: Biological Process (BP), Cellular Component (CC), and Molecular Function (MF). GO terms were identified from up- and down-regulated, and all DEGs (based on DESeq2), with criteria: adj p value ≤ 0.05 and gene count ≥ 10. Bubble size indicates the number of genes enriched in each GO term and bubble color represents category of regulated genes.
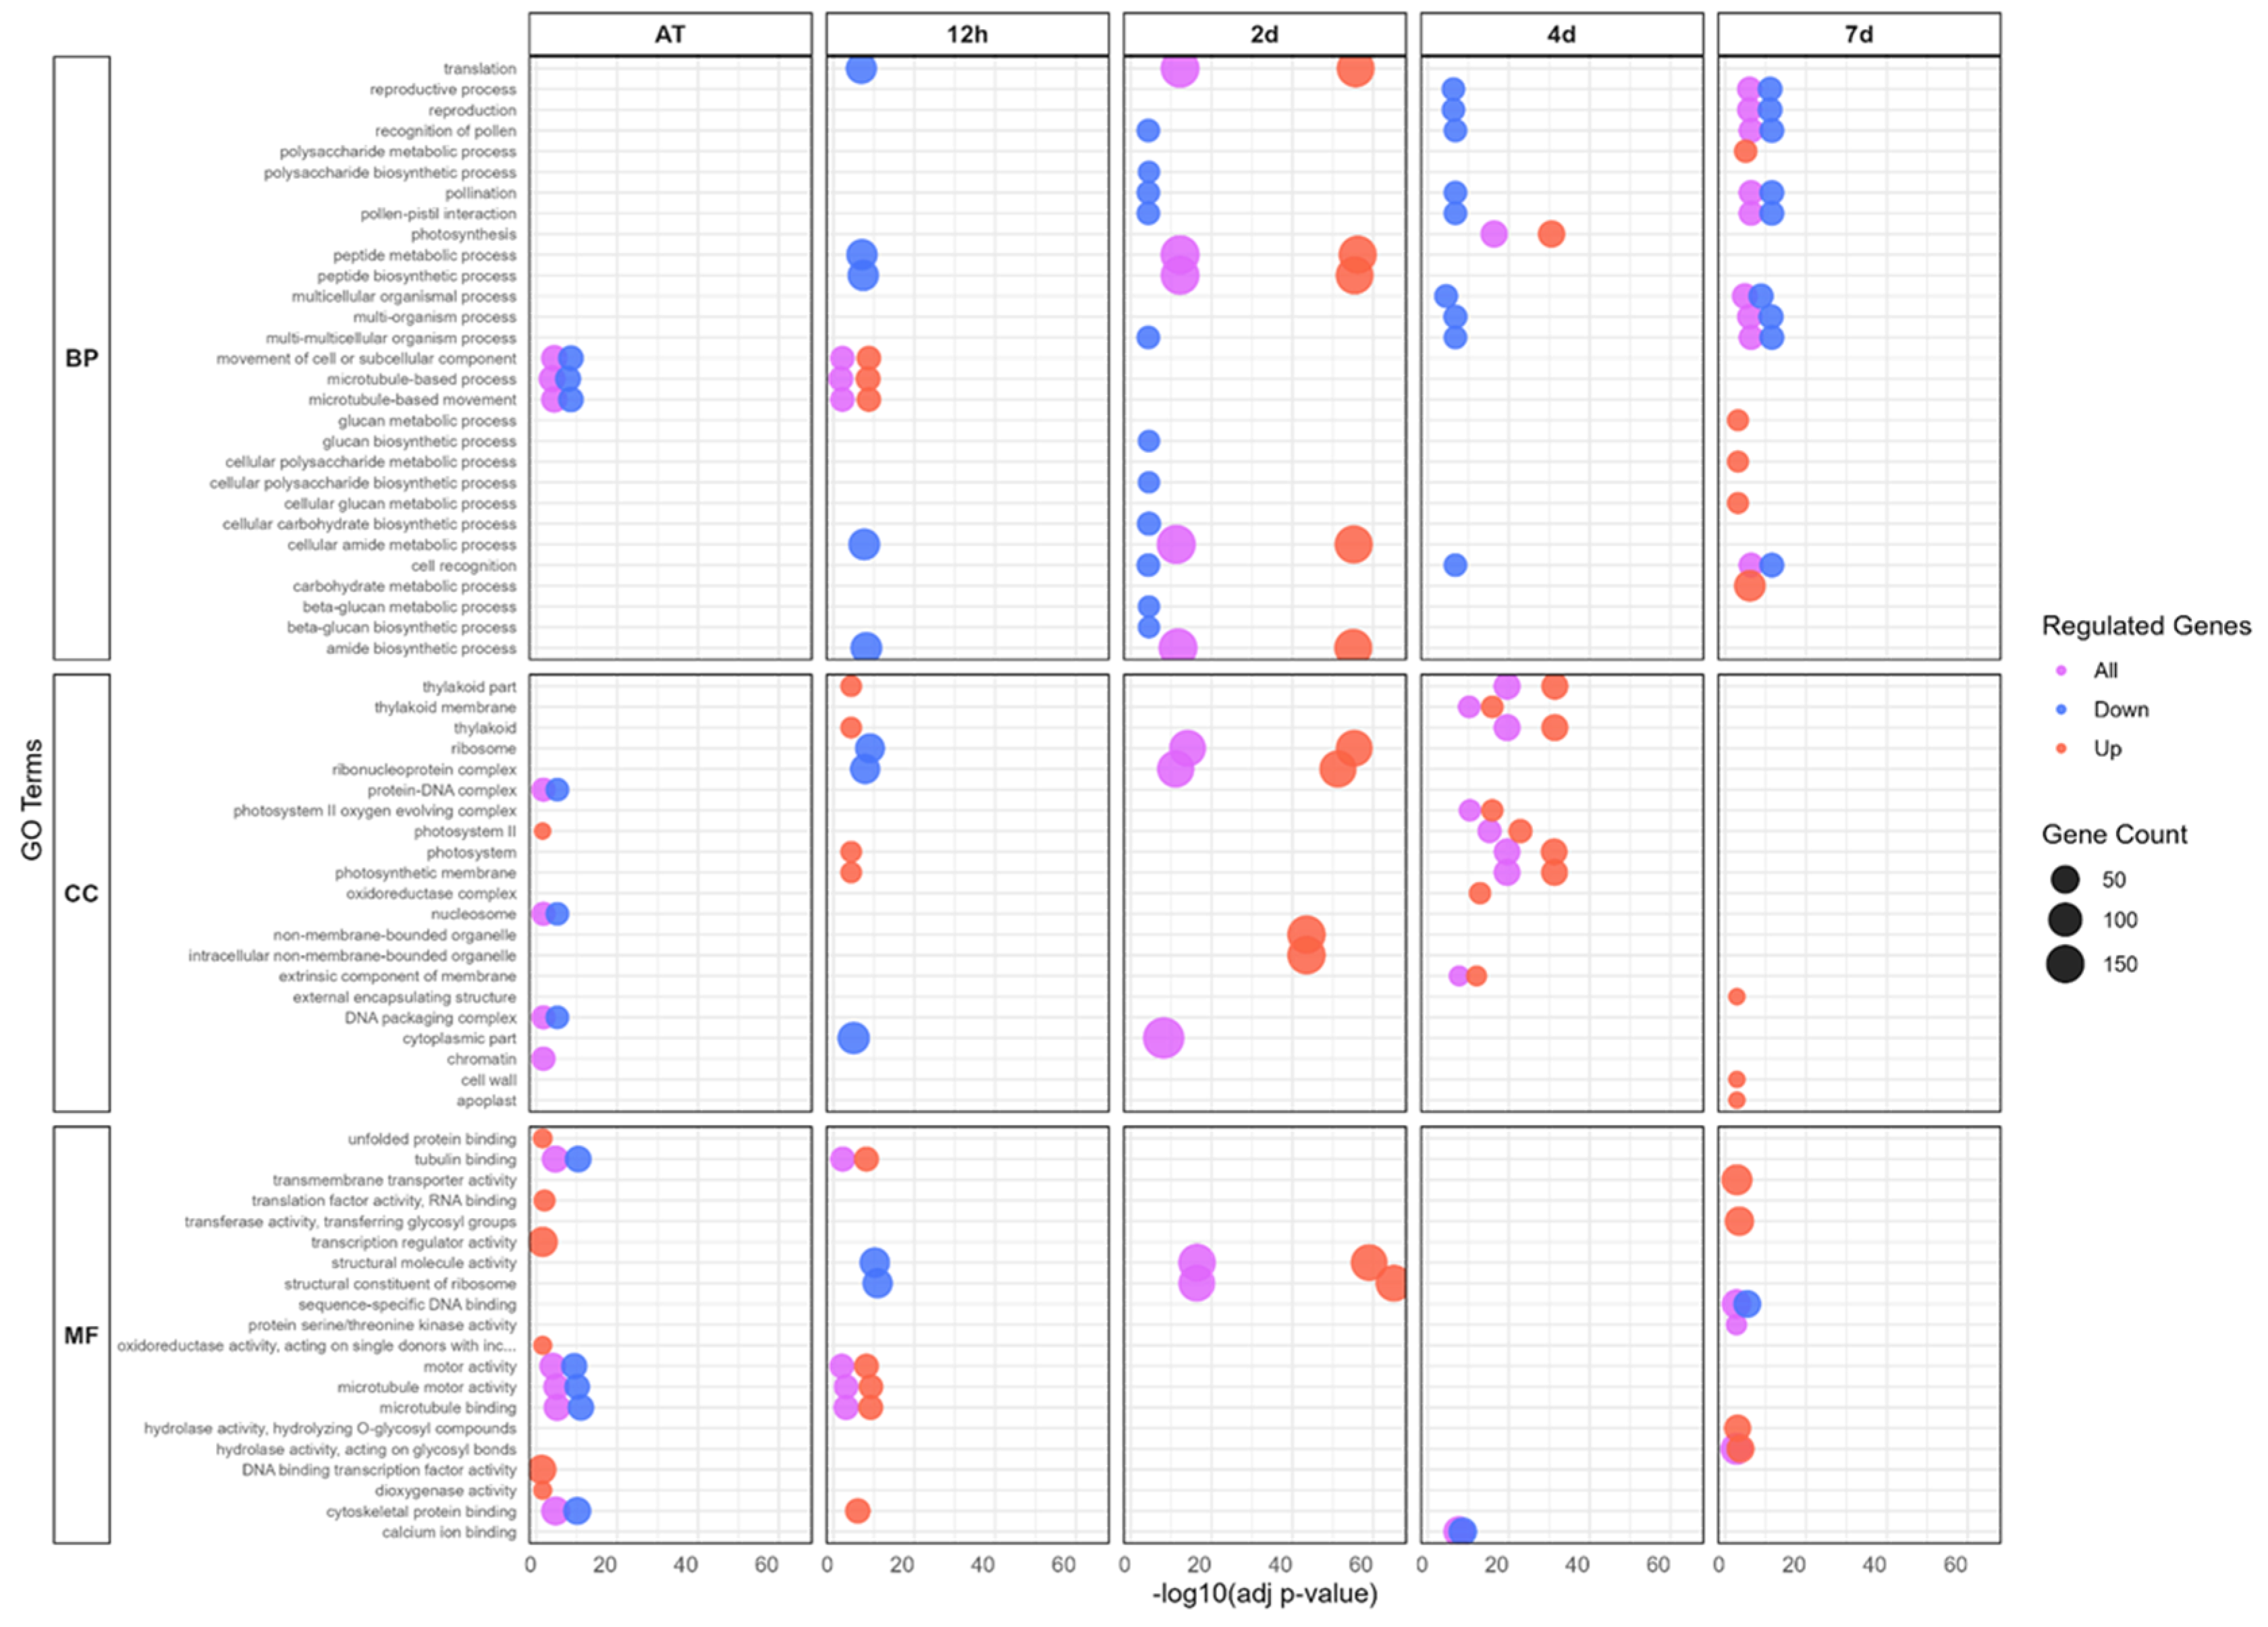
Figure 7.
KEGG pathway enrichment analysis of differentially expressed genes (DEGs) across timepoints in EC 7 (electrical conductivity = 7 dS m-1) vs. CK (control) treatments. Bubble plots show the top significantly enriched Kyoto Encyclopedia of Genes and Genomes (KEGG) pathways at each timepoint (AT, 12h, 2d, 4d, 7d) for up- and down-regulated, and all differentially expressed genes (DEGs). Only pathways with an adj p-value ≤ 0.05 and gene count ≥ 10 were included. Bubble size indicates the number of genes enriched in a pathway and bubble color represents the adj p-value.
Figure 7.
KEGG pathway enrichment analysis of differentially expressed genes (DEGs) across timepoints in EC 7 (electrical conductivity = 7 dS m-1) vs. CK (control) treatments. Bubble plots show the top significantly enriched Kyoto Encyclopedia of Genes and Genomes (KEGG) pathways at each timepoint (AT, 12h, 2d, 4d, 7d) for up- and down-regulated, and all differentially expressed genes (DEGs). Only pathways with an adj p-value ≤ 0.05 and gene count ≥ 10 were included. Bubble size indicates the number of genes enriched in a pathway and bubble color represents the adj p-value.
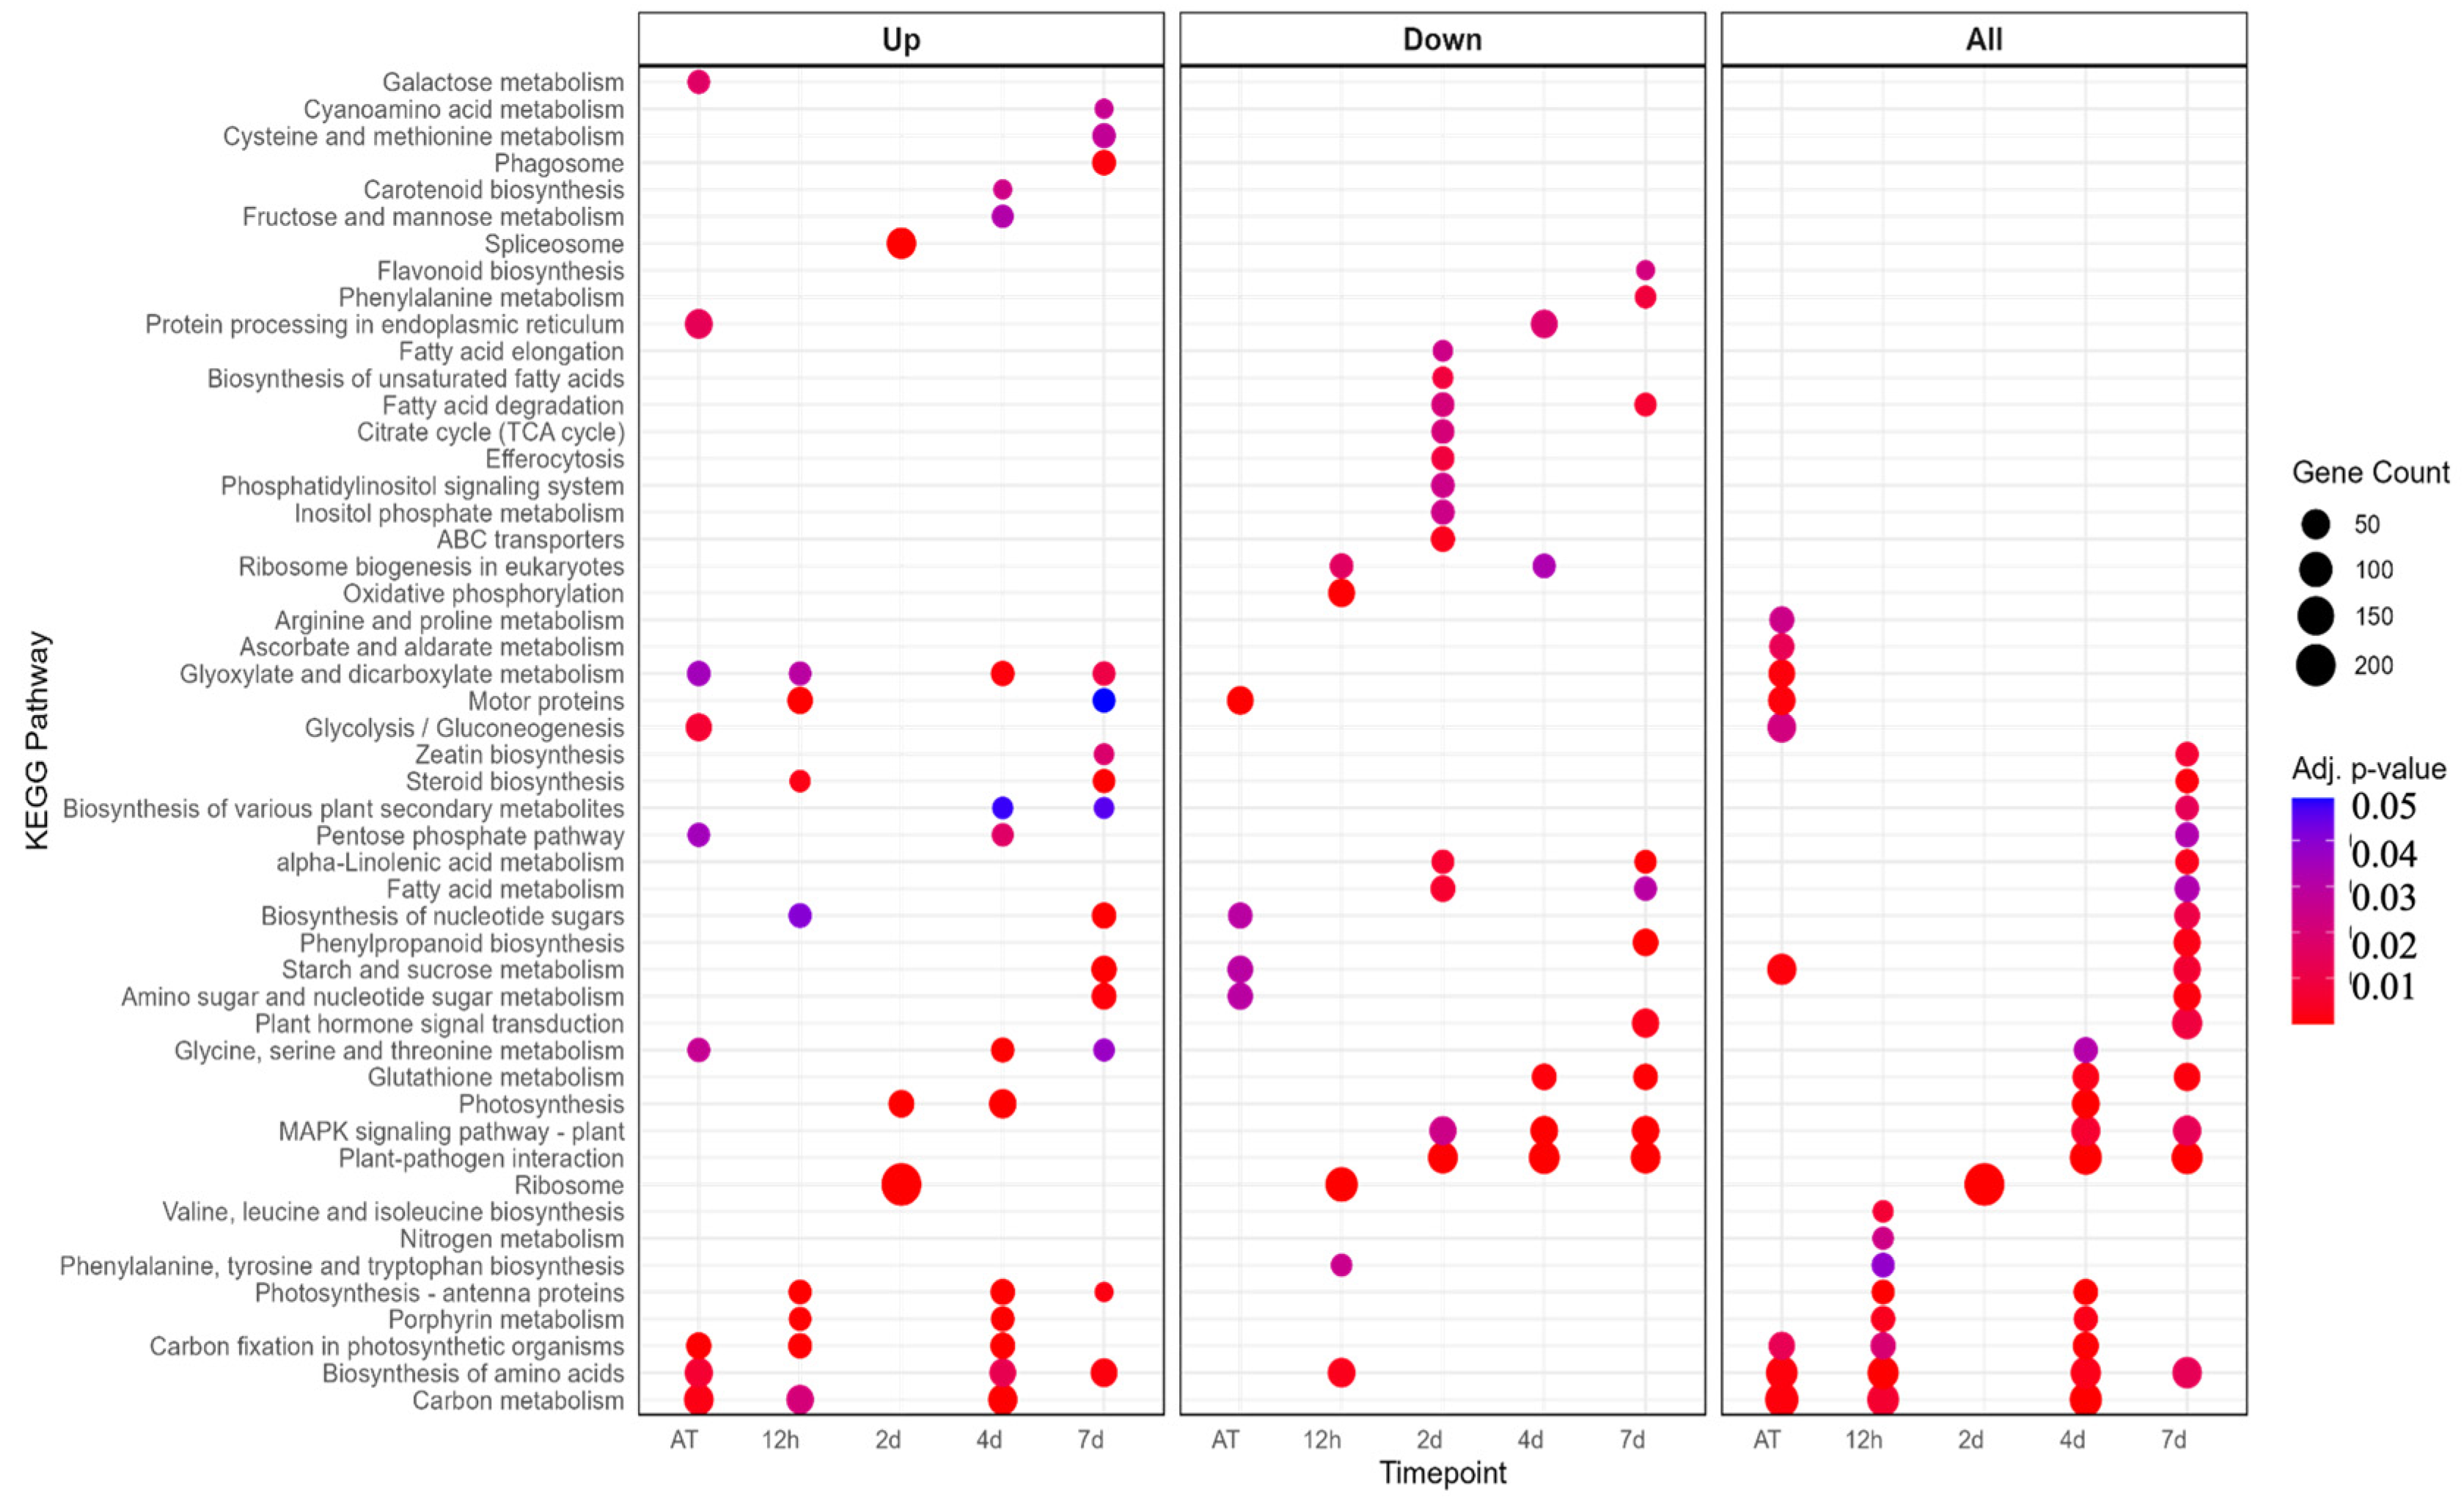

Table 1.
Effect of salinity and inoculation with Xanthomonas perforans on tomato plant growth and disease severity in greenhouse.
Table 1.
Effect of salinity and inoculation with Xanthomonas perforans on tomato plant growth and disease severity in greenhouse.
| Inoculated a | Non-Inoculated a | |||||
|---|---|---|---|---|---|---|
| Treatment | Height (cm) | Weight (g) | DS (%) | AUDPC | Height (cm) | Weight (g) |
| Control | 79.68 a | 63.17 a | 65.28 a | 248.9 a | 75.14 a | 95.6 a |
| EC 3 | 79.22 a | 70.63 a | 13.72 b | 38.5 b | 74.5 a | 79.26 b |
| EC 5 | 74.12 ab | 59.33 ab | 8.28 b | 22.8 b | 74.04 a | 73.52 b |
| EC 7 | 70.12 b | 48.62 b | 3.39 b | 8.5 b | 71.60 a | 71.08 b |
a Tomato cultivar was FL 47. Inoculated = tomato plants inoculated with QL strain of X. perforans. Non-Inoculated = Tomato plants not exposed to the pathogen. b Final tomato plant height measured from the soil surface to the shoot apex (cm). c Final fresh shoot weight measured by cutting at stem base (at the soil surface) and weighing (g). d DS = the average percentage of bacterial spot disease severity of three leaves at Day 11. e The area under the disease progress curve (AUDPC) was calculated based on disease severity ratings recorded throughout the experiment. Statistical analysis was done by ANOVA and means were separated using Tukey’s post-hoc test at p = 0.05. Different letters within columns indicate statistically significant differences among treatments.
Table 2.
Electrical conductivity (EC) of water leachate and soil samples under salinity treatments.
| Water Leachate a | Soil b | ||
|---|---|---|---|
| Treatment | Beg. of Exp c | End of Exp | End of Exp |
| Control | 1.64 a | 0.84 d | 0.24 c |
| EC 3 | 1.89 a | 8.57 c | 2.32 b |
| EC 5 | 1.67 a | 11.16 b | 4.51 a |
| EC 7 | 1.99 a | 17.18 a | 5.08 a |
a Electrical conductivity (EC, measured in dS m-1) of water leachate from pots treated with saline water at the beginning (beg.) and end of the experiment. b Electrical conductivity (EC, measured in dS m-1) of soil samples collected to evaluate salt accumulation in the soil at the end of the experiment. c Statistical analysis was done by ANOVA followed by Tukey’s post-hoc test at p = 0.05. Different letters within columns indicate statistically significant differences among treatments.
Table 3.
Osmotic adjustments of salt-treated tomato plants.
| Treatment | Osma (mol/kg) |
Ψs100b (Mpa) |
OAc (Mpa) |
|---|---|---|---|
| Control | 0.32 a | -0.80 a | -- |
| EC 3 | 0.34 a | -0.85 a | 0.06 a |
| EC 5 | 0.35 a | -0.86 a | 0.06 a |
| EC 7 | 0.36 a | -0.89 a | 0.10 a |
a Osmolarity (Osm) = measurement of solute concentration in sap extracted from leaf tissue. b Ψs100 = osmotic potential at full turgidity. c Osmotic adjustment (OA) = difference in osmotic potential at full turgor between control and salt-treated plants. OA = Ψo (control treatment)100 - Ψo (stressed treatment) 100. Statistical analysis was performed by ANOVA followed by Tukey’s post-hoc test; different letters within columns indicate statistically significant differences among treatments (P < 0.05). Each experiment was conducted twice.
Disclaimer/Publisher’s Note: The statements, opinions and data contained in all publications are solely those of the individual author(s) and contributor(s) and not of MDPI and/or the editor(s). MDPI and/or the editor(s) disclaim responsibility for any injury to people or property resulting from any ideas, methods, instructions or products referred to in the content. |
© 2026 by the authors. Licensee MDPI, Basel, Switzerland. This article is an open access article distributed under the terms and conditions of the Creative Commons Attribution (CC BY) license (http://creativecommons.org/licenses/by/4.0/).
Copyright: This open access article is published under a Creative Commons CC BY 4.0 license, which permit the free download, distribution, and reuse, provided that the author and preprint are cited in any reuse.


