

Submitted:
09 July 2026
Posted:
10 July 2026
You are already at the latest version
Abstract
Stem blight, caused by Phomopsis asparagi, is the most serious disease of asparagus (Asparagus officinalis L.) cultivation in warm regions of east and southeast Asia including Japan. Although Asparagus kiusianus, a wild species endemic to Japan, shows strong resistance and is cross-compatible with cultivated asparagus, the genetic basis of this resistance remains unclear. In this study, we used BC₁ populations from interspecific crosses between A. officinalis and A. kiusianus to dissect the inheritance of stem blight resistance and identify markers suitable for marker-assisted selection. Disease severity was evaluated by P. asparagi inoculation, and RAD sequencing was used to construct a linkage map and perform QTL analysis. Segregation patterns suggested that resistance was controlled by major genes and polygenic factors depending on the cross combination. A major QTL was detected on chromosome 1, and SNP_PRK showed significant association (LOD > 3). A dCAPS marker derived from SNP_PRK identified resistant individuals, with about 80% of heterozygotes showing resistance. CAPS marker PR1 discriminated susceptible, resistant, and heterozygous genotypes, and its genotyping results for all three genotypes were identical to those obtained with PRK. This marker may therefore provide a useful basis for selecting resistant lines in breeding programs.
Keywords:
Asparagus officinalis
; Asparagus kiusianus
; stem blight
; Phomopsis asparagi
; disease resistance
; RAD sequencing
; SNP marker
; dCAPS marker
; QTL analysis
; marker- assisted selection
1. Introduction
Asparagus (garden asparagus: Asparagus officinalis L.), native to the Mediterranean region, is a dioecious perennial herb belonging to the Asparagaceae family. Asparagus is utilized not only as a food crop but also as a source of bioactive compounds with potential health promoting functions [1]. This plant can be harvested for over 10 years with high economic value, and is widely cultivated across cold and temperate regions, including Europe, North and South America and northern China, as well as subtropical regions such as Mexico, southern China, and Southeast Asia. It is also extensively cultivated across Japan, from Hokkaido in the north to Kyushu in the south. The main diseases affecting asparagus are stem blight, spot disease, and brown spot disease there. Among these, stem blight is the most significant constraint in open field cultivation in the southwestern warm regions of Japan [2]. The primary control measure is rain-protected cultivation in plastic houses, but the method is costly and involves harsh working conditions during the height of summer [3].
Stem blight is caused when the spores of Phomopsis asparagi, a fungus present on the soil surface, are splashed by rain and attach to young stems, leading to infection. As the infected young stems elongate, the lesions expand, causing the above-ground stems to turn yellow and die. The pathogen overwinters as conidia and becomes source of infection in the following year, making comprehensive control difficult. Therefore, there is a strong demand for the development of stem blight-resistant varieties. However, no stem blight-resistant varieties have been identified within A. officinalis [4]. Although relative species, such as A. densiflorus, A. virgatus, A. asparagoides, and A. macowanii, have shown strong resistance to the disease, all of these species are cross-incompatible with edible asparagus, which makes their practical use in breeding difficult [5].
Asparagus kiusianus, a relative species endemic to Japan, is native to the coastal region from northern Kyushu to Yamaguchi Prefecture. It exhibits strong resistance to stem blight [6] and has been shown to be cross-compatible with A. officinalis [7]. Since interspecific hybrid plants between A. kiusianus and asparagus have been reported to exhibit disease resistance similar to that of A. kiusianus [7], A. kiusianus serves as a key breeding resource for introducing stem blight resistance into asparagus. Takeuchi et al. [8] reported that the disease resistance of the interspecific hybrids between A. officinalis and A. kiusianus varied depending on the cross combinations. It is necessary to clarify the inheritance of disease resistance and to construct the genetic marker(s) for systematic breeding of the disease resistant cultivars.
In recent years, next-generation sequencing (NGS) technology has enabled to develop numerous single nucleotide polymorphic (SNP) markers in a single experiment through NGS-based genotyping by sequencing (GBS;[9]) and restriction site-associated DNA sequencing (RADseq; [10]). RADseq is a technique that focuses on short DNA fragments adjacent to specific restriction enzyme recognition sites to identify genetic variations [10]. The application of RADseq has been reported in many plant species, including eggplant [11], rice [12], soybean [13], and grape [14]. There have also been reports on SNP markers in asparagus, but the constructed linkage maps are sparse [15]. In addition, the focus on genetics in asparagus has been limited to sex [16], with no reports on disease resistance.
Based on the above background, the authors elucidated the inheritance of stem blight resistance traits in the hybrid progeny of A. officinalis and A. kiusianus, and attempted to develop SNP markers enabling efficient selection for achieving efficient breeding of asparagus varieties with strong resistance to stem blight disease.
2. Materials and Methods
2.1. Investigation of the Inheritance of Stem Blight Disease Resistance Character
2.1.1. Production of BC₁ Individuals
One female accession WC-9f of asparagus ‘Welcome’ maintained in Kyushu University and two interspecific male hybrids, OK007 and OK014 established by interspecific cross between asparagus strain AO0060F and A. kiusianus strain AK0501M in Tohoku University, were used. Interspecific back crossings were conducted from April to July, 2015 (Table 1). And fruit set at one month after pollination, harvested fruits and seeds, and seed germination were investigated.

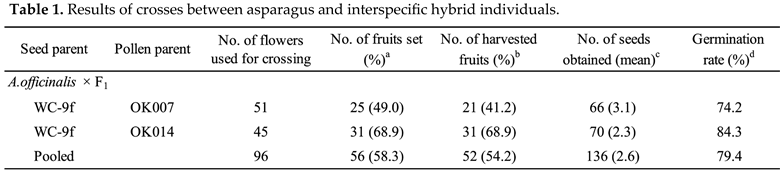 |
a: Fruit set (%) = (No. of fruits set / No. of flowers used for crossing) ×100; b: Harvested fruits rate (%) = (No. of harvested fruits / No. of flowers used for crossing) × 100; c: No. of seeds per fruit = No. of seeds obtained / No. of harvested fruits; d: Germination rate (%) = (No. of germinated seeds / No. of seeds obtained) × 100.
2.1.2. Evaluation Time for Disease Severity Grades
The back-crossed (BC₁) seedlings and 18 control asparagus plants obtained from the intraspecific crosses with ‘Welcome’, grown in plastic pots in unheated greenhouse, were used for inoculation test. The similar BC1 plants between asparagus ‘Welcome’ (WC2) and interspecific hybrid (WCK3) established in Kagawa Agricultural Experiment Station were also provided. Pathogen inoculation was performed from March to November, 2016, following the method described by Iwato et al. [7] with slight modification. Specifically, a preserved strain of Phomopsis asparagi (P1) was cultured on potato dextrose agar (PDA) medium under black light blue (BLB) illumination at 25°C. The strain was routinely stored at 4°C and subcultured on PDA as needed; cultures were generally used after approximately 1-2 weeks of growth. Long-term serial subculturing was avoided, and the strain was renewed only when necessary for inoculum preparation. When reduced infectivity was observed, the strain was inoculated onto asparagus stems and subsequently re-isolated from infected tissues. The re-isolated strain was then used as a virulence-restored inoculum.
After pycnidium formation, a spore suspension was prepared at a concentration of 7.0 × 10⁶ spores/mL. The spore suspension was used as the treatment solution, and cotton wool soaked in the treatment solution was wrapped around the main stem of each plant that had resprouted after being cut back and had been growing for 2-3 weeks. The cotton was secured with vinyl tape to ensure proper inoculum contact.
Following inoculation, plants were maintained in a constant temperature room at 25°C and 80-90% relative humidity for 3 days. Then, the absorbent cotton and vinyl tape were removed, and the humidity was adjusted to 60-70%. From the day of inoculation until all of the control asparagus plants exhibited above-ground stem death, disease progression was assessed weekly.
Disease severity grade (DSG) was evaluated using the following disease scores in accordance with the previous report [7]:
0: No visible symptoms (healthy)
1: Small lesion formation (<1 cm)
2: Enlarged lesion covering less than half of the stem
3: Large lesion covering more than half of the stem, or cladophyll abscission
4: Complete or near complete wilting of the above-ground part
For subsequent analysis, disease resistance was categorized according to DSG values. Individuals with DSG scores of 0-2 were considered resistant, whereas those scoring 3-4 were classified as susceptible. Scores in the 0-2 range generally reflected limited lesion development that did not lead to severe damage or plant death, suggesting a degree of resistance. In contrast, scores of 3-4 were associated with severe disease symptoms, including extensive stem damage or complete wilting, and were therefore considered susceptible.
The progression of disease symptoms in BC1 plants was compared between the times when half of the control asparagus plants showed above-ground death and when all control plants did. The stage at which approximately 50% of the control plants exhibited above-ground death corresponded to an intermediate phase of disease development, at which symptoms were sufficiently expressed to allow clear discrimination among genotypes while avoiding saturation effects at later stages. Previous studies have shown that disease assessments conducted at intermediate stages of disease progression provide the highest resolution for distinguishing differences in host resistance [17,18].
2.1.3. Segregation of Stem Blight Disease Resistance in BC1 Progeny
Four BC1 populations, namely 65 seedlings from WC-9f×OK007, 116 from WC-9f×OK014, 32 from WC2×WCK3 and 19 from OK011×KAG WC No. 28 were provided for inoculation tests from March, 2016 to November, 2017. Eighteen asparagus seedlings were also used for the test as control, and inoculation methods followed the procedures outlined in 1-1. Disease progression was assessed when the percentage of above-ground stem mortality in control asparagus plants reached half.
3. Establishment of SNP Markers
3.1. Plant Materials and DNA Extraction
Genomic DNA was isolated from cladophyll tissues of one female asparagus plant (WC-9), A. kiusianus and two male interspecific hybrids (OK014 and OK007) using the potassium-based extraction method [19]. Approximately 30 mg of fresh, healthy cladophylls, free from visible damage or senescence, were collected from actively growing shoots for DNA extraction. The collected tissues were pulverized using a Multi-bead Shocker (Yasui Kikai, Osaka, Japan) equipped with three 1/8 size stainless beads (AS ONE, Osaka, Japan). The ground tissue was then combined with an extraction buffer composed of 100 mM Tris (pH 8), 50 mM EDTA, 500 mM NaCl and 1% SDS, along with 7 units of RNase (Qiagen, Hilden, Germany). The mixture was incubated at 65 °C for 90 minutes. Subsequently, one-third volume of 5 M potassium acetate were added to the lysate, which was then chilled on ice for 10 minutes. DNA was recovered by precipitation using an equal volume of isopropanol. After washing with 70 % ethanol, the DNA was dissolved in 50 μL of TE buffer containing 10 mM Tris and 1mM EDTA. The concentration of extracted DNA was standardized to approximately 20 ng/μL using the QuantiFluor™ dsDNA System (Promega, Madison, WI, USA) in conjunction with the Mx3000P Real-Time QPCR System (Agilent Technologies, CA, USA.).
3.2. Adjustment of Adapters
To construct the sequencing library, a dual-enzyme restriction digestion approach was applied, producing DNA fragments flanked by forward and reverse adapters. The forward adapters, each containing a unique barcode, were designed to match the KpnI restriction site overhang, while a universal reverse adapter was compatible with the MspI overhang. A set of 96 barcoded forward adapters with KpnI overhangs was generated using the Bar Coded Adapter Generator tool (http://www.deenabio.com/services/gbs-adapters). The reverse adapter was structured as a Y-adapter to suppress amplification of MspI-MspI fragments. Adapter annealing was performed by heating to 95°C for 1 minute, followed by a gradual temperature decrease of 1°C per cycle over 65 cycles. After ligation, adapter concentrations were measured using the same QuantiFluor™ system and QPCR setup, and normalized to 0.1 μM.
3.3. RAD Library Construction
RADseq libraries were assembled following a modified version of the protocol by Poland et al. [20]. A total of 200 ng of genomic DNA was digested in a 20 μL reaction containing CutSmart Buffer (New England BioLabs, Ipswich, MA, USA), 8 units each of KpnI-HF and MspI (New England BioLabs). The digestion was carried out at 37°C for 2 hours, followed by heat inactivation at 65°C for 20 minutes. The resulting fragments were ligated to adapters compatible with Illumina flow cells (Figure 1A). Each sample received 0.1 pmol of forward adapter and 15 pmol of the common reverse adapter, along with CutSmart Buffer, 1 mM ATP (Thermo Fisher Scientific, San Jose, CA, USA), and 200 units of T4 DNA ligase (New England BioLabs). Ligation was performed at 22°C for 2 hours and terminated at 65°C for 20 minutes. Ligated products were pooled and purified using the QIAquick PCR Purification Kit (Qiagen). Library amplification was conducted with an initial denaturation at 95°C for 30 seconds, followed by 16 cycles of 95°C (30 sec), 62°C (30 sec), and 68°C (30 sec), and a final extension at 72°C for 5 minutes (Figure 1B). A second purification step was performed post-PCR.
3.4. RAD Sequencing and SNP Identification
Sequencing was carried out on an Illumina MiSeq platform using the MiSeq Reagent Kit v3 (Illumina, San Diego, CA, USA), generating 86 bp reads from both ends. Base calling was performed using the TASSEL pipeline, which processes raw fluorescence signals into nucleotide sequences. These reads were aligned to the asparagus reference genome (https://www.ncbi.nlm.nih.gov/genome/?term=asparagus) using the Burrows-Wheeler Aligner (BWA). SNP identification and base quality recalibration were executed using a custom Java script available from the TASSEL software suite (http://www.maizegenetics.net/tassel).
3.5. Linkage Map Construction and QTL Analysis
Based on the RAD sequencing analysis results, linkage map construction and QTL analysis were performed using the genetic linkage analysis software JoinMap 4.0 (https://www.kyazma.nl/index.php/JoinMap/) and MapQTL 6 (https://www.kyazma.nl/index.php/MapQTL/). Linkage map was constructed by grouping with LOD scores ranging from 3.0 to 8.0, and by the application of the Maximum Likelihood (ML) method.
3.6. Development of dCAPS (PRK) and CAPS (PR1) Markers for Stem Blight Resistance
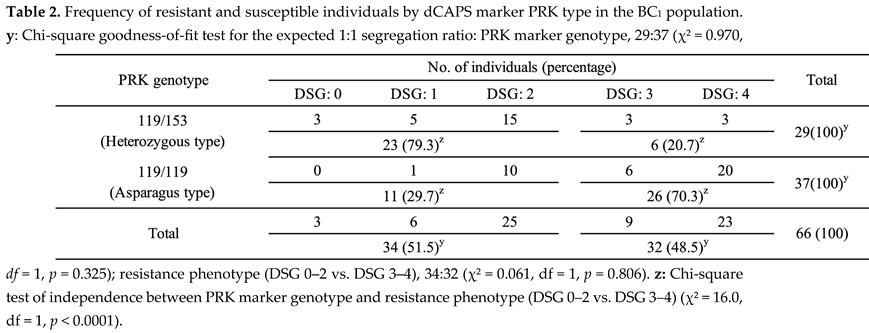
The SNP_PRK identified through the linkage map and QTL analysis as being associated with resistance was dCAPS-modified to facilitate the detection of polymorphisms. The dCAPS marker, PRK, was designed using the primer pair PRK_Fw (5'-CAAGAATCTCTCCTTCACTATCAACCACAG-3', with an artificially introduced mismatch base G at the 3' end) and PRK_Rv (5'-GCGTGTTTGATGCTAAGATTATGCCTTTGA-3'), with BsmAI (recognition sequence: GTCTC) as the restriction enzyme. Screening was performed on 66 individuals in the BC1 population using the PRK marker, and the correlation with DSG results was investigated for the verification of the selection effect. However, in some asparagus individuals, the banding pattern was occasionally unstable and could not be reliably scored.
Therefore, a new CAPS marker, PR1, was developed based on sequences flanking the PRK region. The PR1 marker was designed using the primer pair PR1_Fw (5'-CCTATTCGGCCACCAGGACC-3') and PR1_Rv (5'-CAGCTGTCGCTTGTTGGTTGTC-3'). PCR amplification was performed in a total volume of 25 µL containing 100 ng template DNA, 0.5 µM of each primer, 0.2 mM of each dNTP, 2.5 µL 10× PCR Ex Taq buffer, and 0.5 Unit Ex Taq polymerase. Amplification was carried out with one cycle of 2 min at 94°C, followed by 35 cycles of 30 s at 94°C, 30 s at 55°C, and 1 min at 72°C, and finally one cycle of 10 min at 72°C. The amplified products were digested in a total volume of 20 µL containing 10.0 µL PCR product, 2.0 µL 10× M buffer, 2.0 µL BSA, and 10 Unit XbaI at 37°C for 2 h, followed by enzyme inactivation at 65°C for 15 min. For electrophoresis, 5.0 µL of the digested product was mixed with 1.0 µL of 6× Loading Dye and separated on a 1% agarose gel.
4. Results
4.1. Investigation of the Inheritance of Stem Blight Disease Resistance Character
4.1.1. Production of BC₁ Individuals
The results of the crossing experiments are summarized in Table 1. The fruit set rates were 49.0% and 68.9% in WC-9f × OK007 and WC-9f × OK014, respectively, and the fruit harvest rate averaged 54.2%. Commercial asparagus cultivars can, typically, produce up to six seeds per fruit, and the average number of seeds per fruit reached from 2.3 to 3.1 in the interspecific back-crosses. Seed germination rates were relatively high, ranging 74.2 to 84.3%.
4.1.2. Evaluation Time for Disease Severity Grades
A half and all of the control asparagus plants showed above-ground death 4 to 8, and 7 to 11 weeks after inoculation, respectively. When a half of the control plants had their aboveground stems die off, the remaining half were all DSG 3.
In all BC1 populations, individual variation was observed in both the onset of disease and the progression of symptoms. Specifically, regarding the timing of symptom onset, individuals ranged from those showing symptoms as early as one week after inoculation to those showing no symptoms even after seven weeks. The rate of disease progression also varied among individuals. Some individuals showed a gradual progression from DSG 1 to DSG 4, with the disease severity grade increasing by one grade each week, and the aboveground stems dying after 4 weeks. Others showed no symptoms one week after inoculation but developed DSG3 after 2 weeks.
Figure 2 shows the frequency distributions of individuals with their DSGs from three crosses (WC-9f × OK007, WC-9f × OK014, and WC2 × WCK3) at different evaluation time points. The distribution patterns of individuals with disease severity grade represented similar tendency between the two evaluation time points in each cross. Based on the results, the evaluation time point was defined as the time when a half of the control asparagus plants showed above-ground stem death for early diagnosis.
4.1.3. Segregation of Stem Blight Disease Resistance in BC1 Progeny
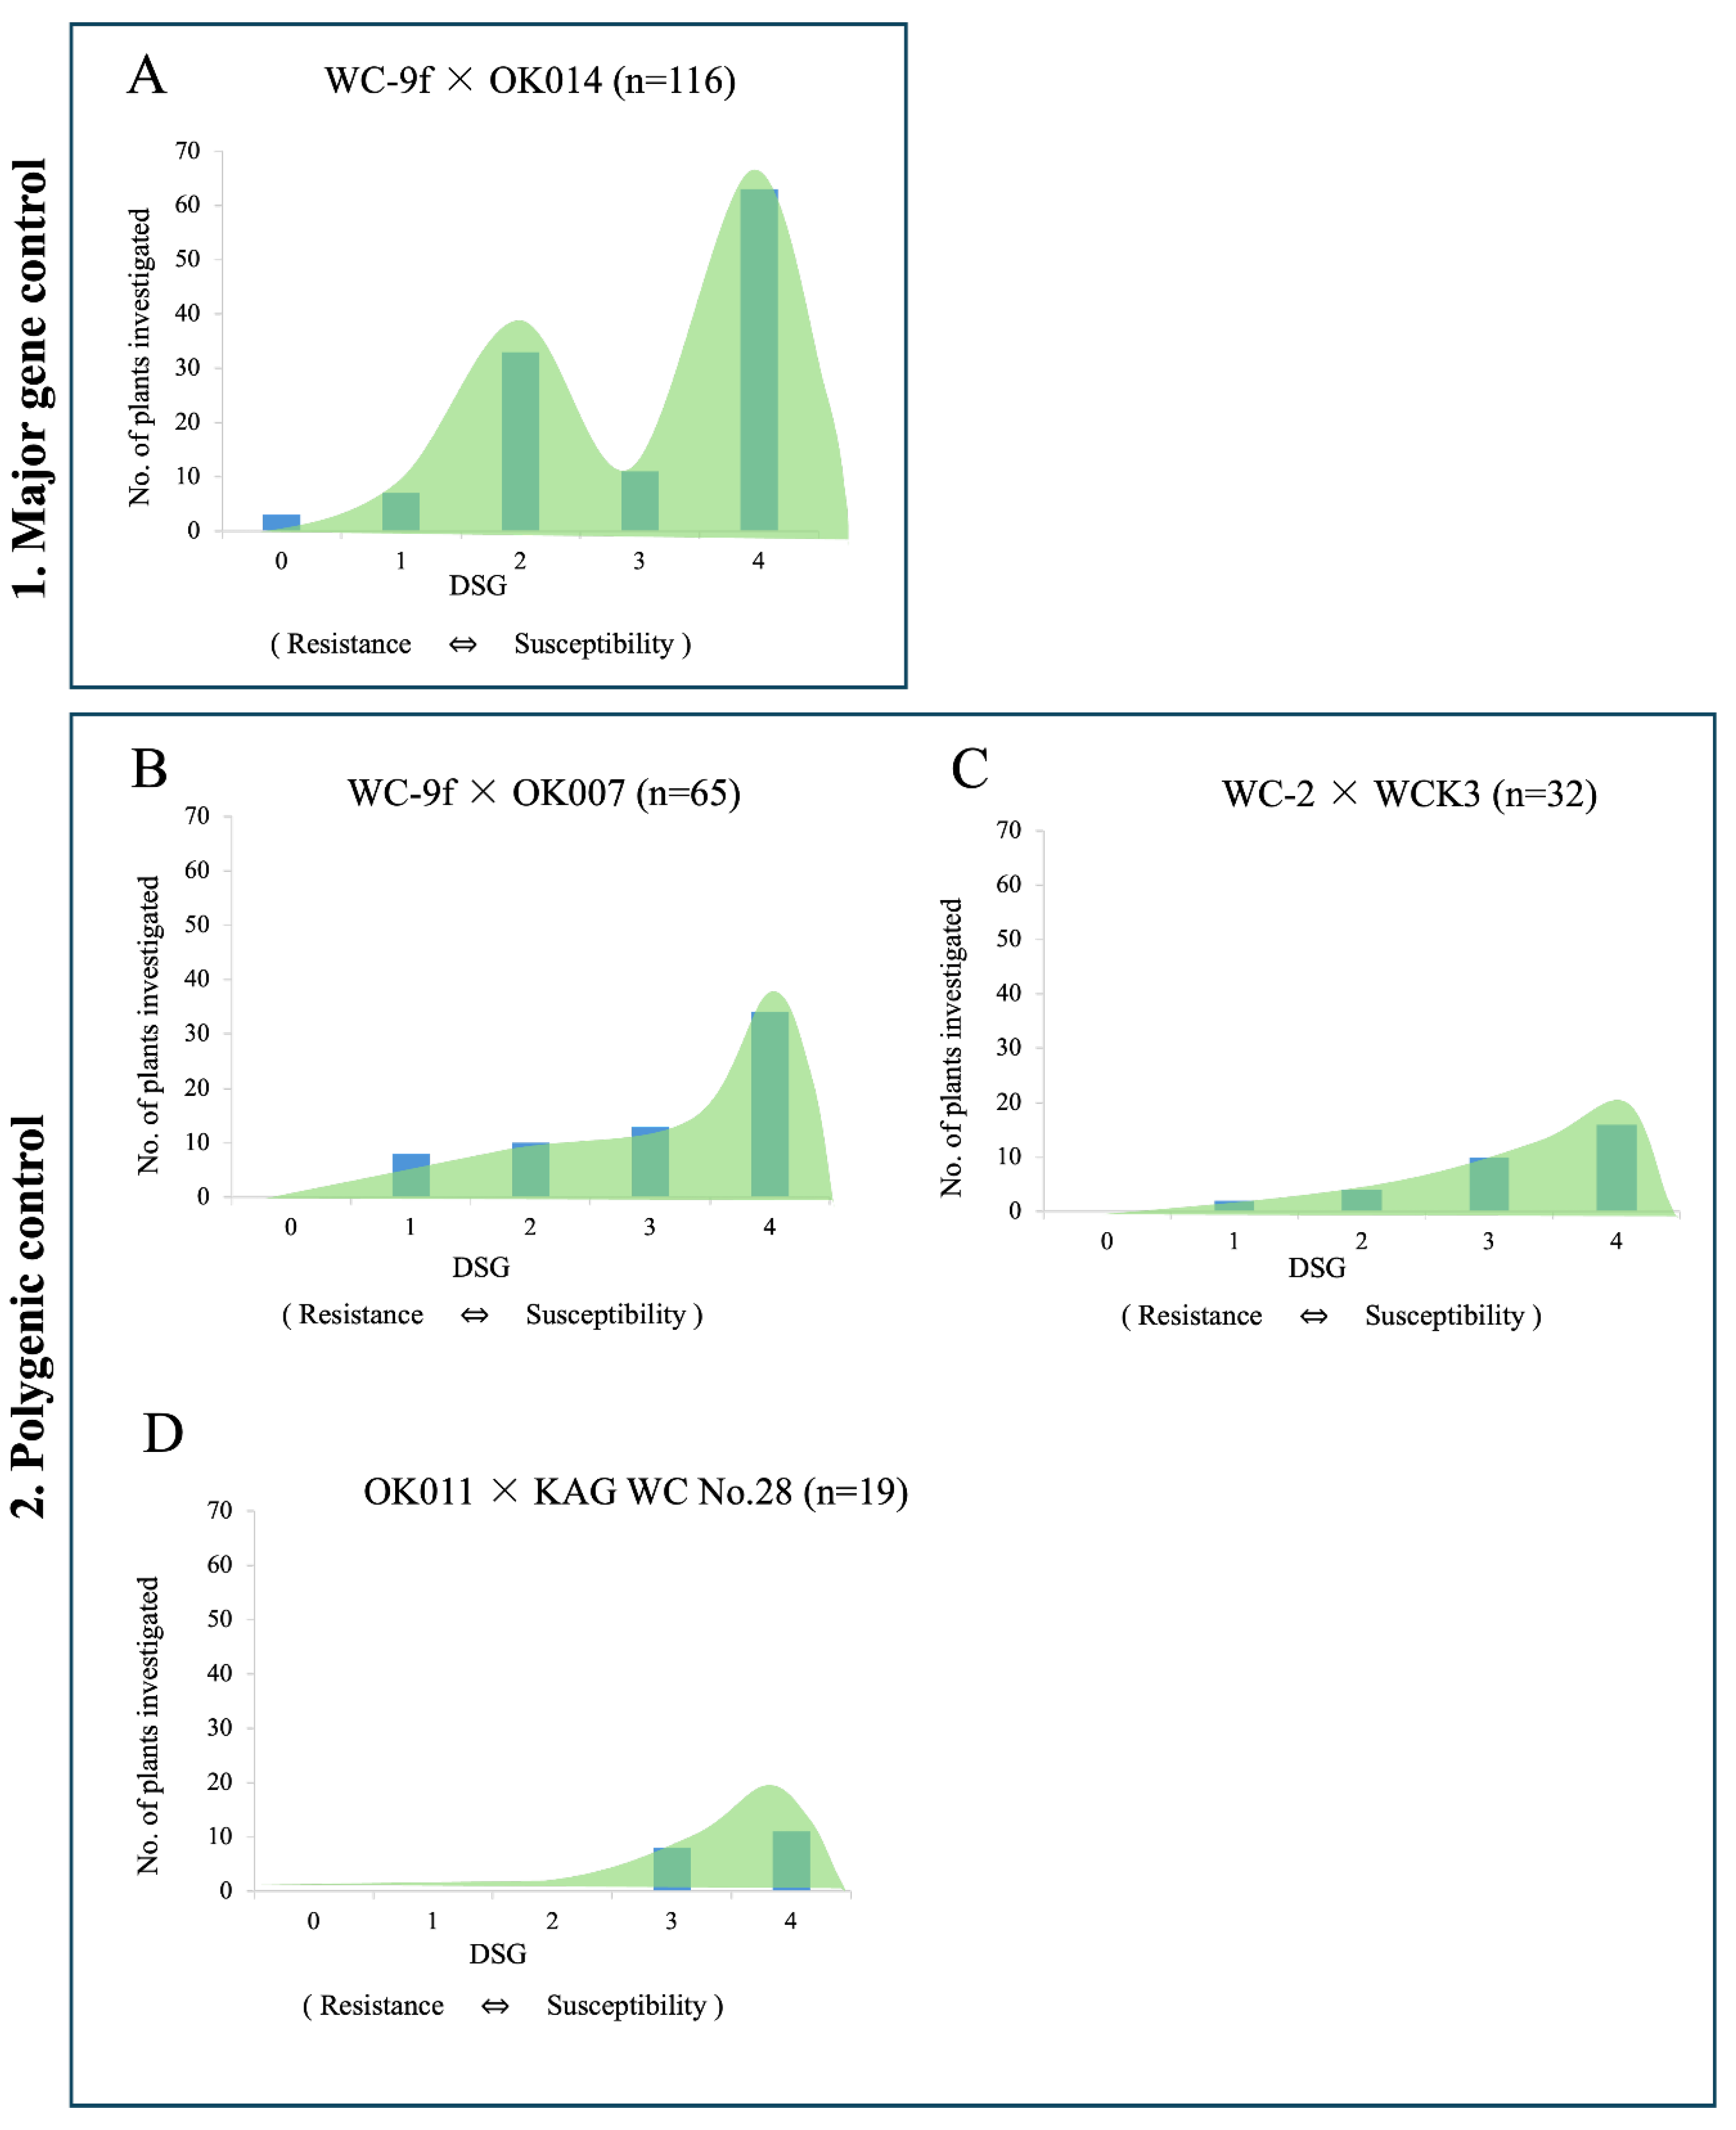
Figure 3 shows the segregation of the number of individuals in each disease severity grade category. The segregation patterns differed among crosse combinations. In WC-9f × OK014, a bimodal distribution with peaks at DSG 2 and DSG 4 was observed, suggesting separation into a relatively resistant group and a clearly susceptible group. In contrast, in WC-9f × OK007, WC2 × WCK3 and OK011×KAG WC No.28 the distributions were more continuous and shifted toward higher disease severity grade values; the largest number of lines were classified as DSG 4, whereas only a small number of lines fell into the lower disease severity grade classes. Segregation of stem blight resistance in the BC₁ progeny was dependent on the cross combination, and the segregation pattern of WC-9f × OK014 was markedly different from those of the other crosses.
4.2. Establishment of SNP Markers
4.2.1. Identification of SNPs and Genotyping
Since the involvement of a major gene was anticipated based on the segregation of resistant and susceptible individuals in WC-9f×OK014 population, individuals with DSG of 0-2 and 3-4 were provisionally classified as “resistant (Rr)” and “susceptible (rr)”, respectively.
A total of 3,393 SNPs were detected (hk×hk: 525, nn×np: 2,298, lm×ll: 570) between WC-9f and OK014. Genotyping of the parental individuals of OK014, AO0060F and AK0501M, revealed that p of 2,103 nn×np SNPs was derived from A. kiusianus, and they were utilized for mapping. As OK007 were also derived from the same cross, AO0060F×AK0501M, SNPs showing the same genotype between OK014 and OK007 were selected for the integrated analysis. As a result, a total of 2,624 SNPs were identified (hk×hk: 404, nn×np: 1,748, lm×ll: 472) between WC-9f and “OK007 + OK014”, and p of 1,581 nn×np markers was derived from A. kiusianus. In addition to these SNPs, previously mentioned resistant genotype and 21 RNA-seq-derived markers [6,21] were incorporated into the mapping analysis.
4.2.2. Integration of Populations and Construction of the Linkage Map
The integrated analysis with 122 individuals (Figure 4) yielded a detailed and high-density map with 402 loci, including 21 RNA-seq-derived markers, across 10 linkage groups spanning 1923 cM, with an average marker density of 4.78 cM per marker. The grouping of SNP markers and RNA-seq-derived markers was consistent with that obtained from the WC-9f×OK014 population alone (Figure S1). These results demonstrate that population integration enhances both the resolution and accuracy of linkage mapping.
4.2.3. QTL Analysis
QTL analysis was performed using MapQTL based on the linkage map constructed for the WC-9f × OK014 population (Figure S1). A major QTL associated with resistance to asparagus stem blight was detected on Chromosome 1, with a maximum LOD score of 3.68. This QTL explained 13.5% of the phenotypic variation and was located within a confidence interval of 17.2-58.6 cM, with an estimated additive effect of 0.446. SNP_PRK showed a significant association with stem blight resistance within this QTL region (Figure 5).
4.2.4. Development of dCAPS (PRK) and CAPS (PR1) Markers for Stem Blight Resistance
To enable practical marker-assisted selection, a dCAPS marker was developed based on SNP_PRK. Asparagus produced a band at 119 bp, A. kiusianus produced a band at 153 bp, and the interspecific hybrid OK014 exhibited both bands, corresponding to the 119 bp band from asparagus and the 153 bp band from A. kiusianus. The heterozygous (119/153) was defined as individuals predicted to carry a heterozygous allele, consisting of the asparagus-derived (119 bp) and the A. kiusianus-derived (153 bp) alleles. The asparagus type was defined as individuals predicted to possess the asparagus-derived allele in the homozygous state.
Screening of 66 individuals in the BC₁ population revealed that, without the marker, resistant and susceptible individuals appeared in nearly equal proportions (34:32), consistent with the expected 1:1 segregation ratio (χ² = 0.061, df = 1, p = 0.806). When heterozygous individuals carrying the A. kiusianus-derived allele were selected, 23 of 29 individuals (~80%) exhibited resistance (Table 2). Furthermore, the PRK marker genotype also segregated in a 1:1 ratio (29:37; χ² = 0.970, df = 1, p = 0.325). A chi-square test of independence confirmed that this association was statistically significant (χ² = 16.0, df = 1, p < 0.0001). These results indicate that this marker is effective for selecting resistant individuals and highlight its potential applicability in breeding programs.
Following PCR amplification with the PR1 marker, the amplicons were digested with Xba I and analyzed by agarose gel electrophoresis (Figure 6). In A. officinalis, a single band of 1,120 bp was detected, corresponding to the asparagus-derived susceptibility marker. In contrast, A. kiusianus showed a 923 bp band digested from 1,120 bp amplicon, corresponding to the A. kiusianus-derived resistance marker. The interspecific hybrid OK014 exhibited both bands, namely the A. officinalis-derived susceptibility marker (1,120 bp) and the A. kiusianus-derived resistance marker (923 bp). The results of the PR1 marker for asparagus and heterozygous types were the same as those obtained with the PRK marker.
 |
5. Discussion
The results of the mating experiment to produce BC1 individuals showed that the fruit set rates ranged from 49.0 to 68.9% for asparagus × F1. These rates are higher than the values reported for the direct interspecific cross A. officinalis (seed parent) × A. kiusianus (pollen parent), for which fruit sets were only 17.8% [22] and 9.0% [6]. Generally, even if the F1 hybrids show normal growth, poor growth, sterility, or issues such as death and weakness may occur in F2 generation onward. However, according to the results of this experiment, no such problems were observed in the backcrossed progeny from interspecific hybridization between asparagus and A. kiusianus. Therefore, it is unlikely that hybrid fertility issues will arise in future backcross hybridizations.
In the control asparagus plants inoculated on March 18 and June 1, 2016, the aboveground stems of all individuals took 7 and 11 weeks, respectively, to completely die. Previous studies using a similar inoculation procedure reported that the aboveground stems of most asparagus plants died within approximately 5 weeks after inoculation [7]. However, even in this experiment, a few individuals exhibited incomplete wilting of the inoculated stems five weeks after inoculation. Comparing the current results to these earlier reports, it took a notably longer time for the aboveground stems of asparagus to die. It was thought that infectivity of the pathogen had decreased due to successive subculture. Subculturing, defined as the transfer of a small inoculum from an existing culture into fresh sterile medium, is widely employed for short-term microbial preservation [23]. Some pathogenic fungi show attenuated virulence in response to environmental shifts or extended serial passaging on rich laboratory media [24]. The inoculum used in this study as well as the previous one was the P1 strain of Phomopsis asparagi, preserved at Kyushu University. This strain, collected from Saga Prefecture, was maintained by subculturing. The pathogenicity and infectivity of the pathogen may have decreased during successive subculturing, which is thought to have caused the delayed onset of disease in the control asparagus plants compared to previous reports. Such a reduction in virulence may influence phenotypic evaluation by delaying symptom development and introducing variability in disease progression among individuals. A similar phenomenon has been reported in Botrytis cinerea, where virulence declined with time in culture and was restored after inoculation on Arabidopsis thaliana [25]. In the resistance test conducted on November 18, 2016, the pathogen from the successive subcultured strain was first inoculated into asparagus, reisolated, and then used as the inoculum. As previously reported, infected stems of asparagus died within 5 weeks, indicating that the infectivity of the inoculum used in the tests on March 18 and June 1, 2016, had declined. These results indicate that the virulence of Phomopsis asparagi may decline during successive subculturing, leading to delayed disease development in inoculated plants. In the present study, virulence was effectively restored by inoculation onto asparagus stems followed by re-isolation, as evidenced by the shortened time to stem death in the November 2016 experiment. Therefore, for accurate phenotypic evaluation of disease resistance, it is recommended to use virulence-restored strains obtained through host passage, or to carefully standardize disease assessment based on the progression of symptoms in control plants. This approach would minimize the potential bias caused by variation in pathogen infectivity. However, systematic data on virulence stability across subculture generations were not collected in this study. Instead, the use of control plants as an internal reference provided a practical means of accounting for such variation across experimental batches. In this context, evaluating disease symptoms based on the progression of symptoms in the control asparagus plants, rather than relying solely on fixed days post-inoculation, is more appropriate, particularly when pathogen virulence may vary. Comparing disease symptoms among individuals within the BC1 cross population at the point when a half of the control asparagus plants had died and when all had died revealed similar segregation of resistance and susceptibility. This indicates that resistance evaluation can be conducted at an earlier stage, namely when approximately 50% of the control asparagus plants have died, without compromising accuracy. For future studies, the use of low-passage or freshly isolated pathogen strains, periodic host passage to restore virulence, and standardization of inoculum quality are recommended to ensure more consistent phenotypic evaluation.
Three individuals in the WC-9f × OK014 cross showed a disease severity grade of 0 at the end of the resistance test (Figure 3b). It is difficult to determine whether these individuals possess strong disease resistance or if the observed reduction in the infectivity of the fungal strain is involved at this stage. Furthermore, differences in plant growth conditions at the time of inoculation may also have influenced disease occurrence. These factors should be verified in future studies.
The inoculation assay itself also has some limitations. This assay is partially destructive, and severely susceptible plants may exhibit complete dieback of aerial stems or even plant death after inoculation. Although biological replicates could be obtained through plant division prior to inoculation, such treatment may result in differences in plant growth conditions and physiological status. This variability would reduce the uniformity of experimental conditions. Nevertheless, susceptible control asparagus plants showed similar disease progression across experiments. Furthermore, previous studies repeatedly evaluated A. officinalis UC157F1, A. kiusianus, and their F1 hybrids by inoculation assays in 2011 and 2012, and consistent resistance results were obtained [7], suggesting that this assay can provide consistent resistance results across repeated evaluations.
Figure 3 shows the distribution of the number of individuals for each disease severity grade. As shown in the figure, the resistance segregation patterns differed among cross combinations. Based on these segregation patterns, the possible involvement of both major gene control and polygenic control was considered.
- Major gene control (Figure 7)
If stem blight disease resistance in A. kiusianus is controlled by major genes with strong resistance traits, the segregation of resistance in the BC1 population is expected to result in two groups: individuals with major resistance genes showing strong resistance, and individuals without these genes showing susceptibility. In this case, the graph is expected to exhibit a bimodal distribution with two peaks. However, a bimodal distribution alone should not be regarded as definitive evidence for simple major gene control. In the WC-9f × OK014 cross, the lack of intermediate disease severity classes may indicate the involvement of one or more genetic factors with relatively large effects, but it may also reflect modifier effects or genotype–environment interactions. Therefore, this pattern was interpreted as suggesting strong genetic effects on resistance rather than as conclusive proof of simple major gene control.
- 2.
- Polygenic control (Figure 8)
If stem blight disease resistance in A. kiusianus is governed by multiple genes, involving minor genetic factors and polygenic effects, the segregation of resistance in the BC1 population is expected to result in a unimodal distribution. This would include individuals with many resistance-related genes showing high resistance, individuals with no or fewer resistance-related genes showing susceptibility, and those with moderate resistance. The graph is expected to show a unimodal distribution with the majority of individuals exhibiting moderate resistance.
The resistance segregation pattern in the BC1 population from this experiment could be divided into two distinct patterns. As shown in Figure 9, in the WC-9f×OK014 cross, number of plants with disease severity grades 2 and 4 were higher than the others, indicating the separation of resistant and susceptible individuals into two distinct groups, DSG: 0-2 and 3-4. This suggests that the stem blight disease resistance in OK014 is likely controlled by major genes. In contrast, in the crosses WC-9f×OK007, WC2×WCK3 and OK011×KAG WC No.28, a unimodal distribution was observed, with disease severity grade 4 as the peak, indicating that the stem blight disease resistance in their parental F1 hybrids may be under polygenic control. Previous studies on rice blast disease have reported resistance genes that provide strong resistance to rice blast on their own, as well as genes that show an accumulation effect when combined with other resistance genes [26]. The results of this experiment suggest that both major gene and polygenic control are involved in resistance of asparagus stem blight identified in A. kiusianus. In all three crosses exhibiting polygenic control, the majority of individuals showed disease severity grade 4, indicating susceptibility. Since the resistance inoculation test in this study was conducted under conditions that favored pathogen infection, such as high humidity, and these conditions were harsher than the plants' actual growth environment, it is believed that the resistance distribution skewed toward susceptibility.
In the WC-9f × OK014 and WC-9f × OK007 crosses, the contrasting resistance segregation patterns suggest possible genetic differences between the two F1 male parents, although direct molecular evidence at the QTL region, particularly at SNP_PRK, remains to be obtained. Although OK014 and OK007 originated from the same parental cross (AO0060F × AK0501M), the consistency in marker grouping between the integrated map and the OK014-derived map supports that these two F₁ individuals share a broadly similar genomic structure, while differing at specific loci due to meiotic recombination and independent assortment. QTL analysis based on the OK014-derived linkage map identified a major resistance locus on Chromosome 1 (LOD = 3.68). Among BC₁ individuals carrying the A. kiusianus-derived allele at this locus, approximately 80% exhibited resistance, indicating a strong effect of this locus, which is consistent with the bimodal distribution observed in the WC-9f × OK014 population. In contrast, the WC-9f × OK007 population showed a unimodal distribution skewed toward higher disease severity grades, which did not allow clear classification into resistant and susceptible groups. This phenotypic pattern suggests that resistance in the WC-9f × OK007 population may be under polygenic control and governed by multiple loci with smaller additive effects. However, because the genotype of OK007 at the Chromosome 1 QTL region, particularly at SNP_PRK, was not directly examined in this study, we cannot determine whether OK007 carries the same major resistance allele as OK014. Furthermore, the possible involvement of susceptibility-promoting genes, analogous to those identified in rice [27], differentially distributed between OK014 and OK007, cannot be excluded and warrants investigation in future studies employing diverse cross combinations. These results suggest that while OK014 and OK007 share a broadly similar genomic background, the inheritance of major genes and polygenic control may differ between their respective BC₁ populations. This difference may be associated with the contrasting resistance segregation patterns observed between the two crosses. However, because the genotypes of OK014 and OK007 at the Chromosome 1 QTL region, particularly at SNP_PRK, were not directly compared in this study, we cannot conclude that the two F₁ hybrids carry different resistance genes or alleles.
Direct genotyping of OK014 and OK007 at the Chromosome 1 QTL region, particularly at the SNP_PRK locus, will be necessary in future studies to confirm whether differences in allelic composition at this locus underlie the contrasting resistance genetic architectures observed in their respective BC₁ populations.
In this study, we successfully developed SNP markers associated with stem blight disease resistance in asparagus by integrating RAD sequencing, linkage map construction, and QTL analysis. Previous genetic studies in asparagus have been largely confined to sex determination, with no molecular investigation addressing disease resistance [16]. Furthermore, although SNP markers in asparagus have been reported, the resulting linkage maps remained sparse [15], limiting their utility for QTL-based trait dissection. The present study addresses these gaps by integrating RADseq-based high-density linkage map construction with QTL analysis, leading to the identification of a major resistance locus on chromosome 1 and the development of a codominant CAPS marker (PR1) directly applicable to marker-assisted selection in asparagus breeding programs.
The identification of over 3,000 SNPs in the WC-9f × OK014 and WC-9f × OK007 populations, including a significant proportion derived from A. kiusianus, highlights the effectiveness of RADseq in capturing polymorphisms from interspecific backgrounds.
The integration of the two BC₁ populations (WC-9f × OK014 and WC-9f × OK007) markedly improved the quality of the genetic map. Compared to single-population analysis, the integrated analysis resulted in enhanced marker density and resolution. High-density genetic linkage maps are crucial for gene identification, QTL mapping, comparative genomic analyses, and marker-assisted breeding programs [28]. Our research reveals the critical importance of population size and genetic diversity in building reliable maps.
A major QTL for stem blight disease resistance was consistently identified on chromosome 1, with SNP_PRK demonstrating a strong association (LOD > 3). SNP markers are widely used in genetic diversity assessments, molecular evolution studies, and the mapping of agronomically important traits in crop species. While SNP assays often require expensive equipment or reagents, the conversion to more accessible marker systems, such as dCAPS, offers a simpler and more cost-effective alternative. Derived cleaved amplified polymorphic sequence (dCAPS) markers detect SNPs by introducing mismatches into one PCR primer flanking the polymorphism, which creates or abolishes a restriction enzyme recognition site in one haplotype. This method is widely used in plant molecular genetics [29,30,31]. Screening of 66 individuals in the BC₁ population revealed that, when heterozygous individuals carrying the A. kiusianus-derived allele were selected, 23 of 29 individuals (~80%) exhibited resistance. The results demonstrate that individuals exhibiting resistance can be efficiently selected based on SNP_PRK. However, in some asparagus samples, the banding pattern generated by the dCAPS assay was occasionally unstable. Therefore, a CAPS marker was further developed to achieve more stable and consistent genotyping.
The CAPS marker system, also referred to as PCR–RFLP, combines PCR amplification with restriction enzyme digestion, offering a more rapid and less labor-intensive alternative to conventional Southern blot-based RFLP analysis [32]. One of the most important advantages of CAPS markers is their codominant nature, which allows clear discrimination between homozygous and heterozygous individuals, making them particularly useful for detailed genetic analyses [33].
In the present study, Xba I digestion of the CAPS marker PR1 produced a clear polymorphic pattern: a 1,120 bp band in A. officinalis, a 923 bp fragment in A. kiusianus, and both bands in the interspecific hybrid OK014. The results were consistent with those obtained using the PRK marker, suggesting that PR1 appears to be a potentially useful marker for stem blight resistance selection in asparagus breeding.
Although gene expression analysis was not performed in the present study, we compared the position of the PR1 marker with 21 resistance-related genes previously reported by Abdelrahman et al. [6]. Among these genes, two were located on the same chromosome as the PR1 marker but were genetically distant from it and therefore were not considered to be closely linked to the PR1 marker. Thus, the present genetic-map information does not support a direct relationship between the PR1 marker and these previously reported resistance-related genes. Further fine mapping, expression analysis, and functional validation will be required in future studies to identify the causal gene or genes underlying the observed resistance.
These findings suggest that PR1 may serve as a complementary tool to time-consuming field inoculation tests, with potential to improve the efficiency of stem blight resistance breeding in asparagus. Further validation using larger and more diverse populations will be required to determine its robustness and general applicability.
6. Conclusions
This study investigated the inheritance of stem blight resistance in BC₁ populations derived from interspecific crosses between Asparagus officinalis and A. kiusianus, and developed a molecular marker applicable to marker-assisted selection. The resistance segregation patterns observed in the BC₁ populations varied depending on the cross combination, suggesting that both major gene control and polygenic control are involved in stem blight resistance in A. kiusianus. In particular, the bimodal segregation pattern observed in the WC-9f × OK014 population indicated the involvement of a major resistance gene in OK014.
Using RAD sequencing, a total of 3,393 SNPs were identified, and an integrated linkage map comprising 402 loci was constructed by combining two BC₁ populations, which improved marker density and map resolution compared with single-population mapping. QTL analysis identified a major resistance locus on chromosome 1, with the SNP_PRK showing a significant association (LOD > 3). Genotyping with a dCAPS marker developed from this SNP showed that approximately 80% of heterozygous individuals exhibited resistance. The CAPS marker PR1 distinguished the A. officinalis-derived susceptible band, the A. kiusianus-derived resistant band, and the heterozygous pattern carrying both bands, and the results for the asparagus and heterozygous types were the same as those obtained with PRK.
The PR1 marker may complement time-consuming inoculation tests and could help improve the efficiency of breeding asparagus for stem blight resistance.
Supplementary Materials
The following supporting information can be downloaded at the website of this paper posted on Preprints.org.
Author Contributions
Conceptualization, T.I., A.U., S.W. and Y.O.; methodology, Y.T., E.Kakizoe, E.Kato and M.Matsumoto; software, Y.T. and Y.Y.; validation, J.M., Y.M., K.S., M.A., A.K., T.I. M.Mori and K.M.; formal analysis, Y.L., Y.T, and Y.Y.; resources, K.T., draft preparation, Y.L. and Y.O..; writing- review and editing, M.Matsumoto, Y.Y., A.K., T.I. and Y.O.; visualization, Y.L., Y.T. and E.Kakizoe; supervision, Y.O.; project administration, A.U. and S.W. All authors have read and agreed to the published version of the manuscript.
Funding
This work was supported by a Grant-in-Aid for Science and Technology Research Promotion Program (27002B) for Agriculture, Forestry, Fisheries and Food Industry from the Ministry of Agriculture, Forestry and Fisheries (MAFF) (Japan), by the Research Program on Development of Innovative Technology Grants (JPJ007097) from the Project of the Bio-oriented Technology Research Advancement Institution (BRAIN), and by the Research and Implementation Promotion Program through Open Innovation Grants (JPJ011937) from the Project of the BRAIN.
Data Availability Statement
The original contributions presented in this study are included in the article/supplementary material. Further inquiries can be directed to the corresponding author(s).
Acknowledgments
We gratefully thank Prof. Dr. M. Shigyo in Yamaguchi University and Prof. Dr. Y. Monden in Okayama University for providing useful information of RAD sequencing and integrated analyses in dioecious plants.
Conflicts of Interest
The authors declare that they have no competing interest.
References
- Guo, Q.; Wang, N.; Liu, H.; Li, Z.; Lu, L.; Wang, C. The bioactive compounds and biological functions of Asparagus officinalis L. – A review. J. Funct. Foods 2020, 65, 103727. [Google Scholar] [CrossRef]
- Sakai, Y. Disorders and Countermeasures in Asparagus. In Agricultural Technology System, Vegetable Section 8-②: Asparagus, Basic Edition; (In Japanese). Rural Culture Association Japan: Tokyo, 1986; pp. 237–239. [Google Scholar]
- Kobayashi, M.; Shinsu, T. Rain shelter cultivation of green asparagus. Bull. Nagasaki. Pref. Agric. For. Exp. Stn. Agric. Div. (In Japanese with English summary). 1990, 18, 117–145. [Google Scholar]
- Sonoda, T.; Uragami, A.; Ito, K.; Kohmura, H.; Ohwada, M.; Kaji, K. Evaluation of Asparagus species and comparison between sexes in A. oddicinalis cultivars for resistance to stem blight. J. Jpn. Soc. Hortic. Sci. In Japanese with English summary. 2001, 70, 244–250. [Google Scholar] [CrossRef]
- Kanno, A.; Yokoyama, J. Asparagus. In Wild Crop Relatives: Genomic and Breeding Resources; Kole, C., Ed.; Springer: Berlin; pp. 23–42. [CrossRef]
- Abdelrahman, M.; Suzumura, N.; Mitoma, M.; Matsuo, S.; Ikeuchi, T.; Mori, M.; Murakami, K.; Ozaki, Y.; Matsumoto, M.; Uragami, A.; et al. Comparative de novo transcriptome profiles in Asparagus officinalis and A. kiusianus during the early stage of Phomopsis asparagi infection. Sci. Rep. 2017, 7, 2608. [Google Scholar] [CrossRef] [PubMed]
- Iwato, M.; Kosaza, M.; Takeuchi, Y.; Matsumoto, M.; Inada, M.; Ozaki, Y.; Okubo, H. Stem blight resistance of Asparagus kiusianus and its hybrid with A. officinalis. Adv. Hortic. Sci. 2014, 28, 202–207. [Google Scholar] [CrossRef]
- Takeuchi, Y.; Kakizoe, E.; Yoritomi, R.; Iwato, M.; Kanno, A.; Ikeuchi, T.; Mori, M.; Murakami, K.; Uragami, A.; Matsumoto, M.; et al. Features in stem blight resistance confirmed in interspecific hybrids of Asparagus officinalis L. and Asparagus kiusianus Makino. Hortic. J. 2018, 87, 200–205. [Google Scholar] [CrossRef]
- Elshire, R.J.; Glaubitz, J.C.; Sun, Q.; Poland, J.A.; Kawamoto, K.; Buckler, E.S.; Mitchell, S.E. A robust, simple genotyping-by-sequencing (GBS) approach for high diversity species. PLoS ONE 2011, 6, e19379. [Google Scholar] [CrossRef] [PubMed]
- Baird, N.A.; Etter, P.D.; Atwood, T.S.; Currey, M.C.; Shiver, A.L.; Lewis, Z.A.; Selker, E.U.; Cresko, W.A.; Johnson, E.A. Rapid SNP discovery and genetic mapping using sequenced RAD markers. PLoS ONE 2008, 3, e3376. [Google Scholar] [CrossRef] [PubMed]
- Barchi, L.; Lanteri, S.; Portis, E.; Acquadro, A.; Valè, G.; Toppino, L.; Rotino, G.L. Identification of SNP and SSR markers in eggplant using RAD tag sequencing. BMC Genom. 2011, 12, 304. [Google Scholar] [CrossRef] [PubMed]
- Melaku, G.; Guangfu, H.; Shilai, Z.; Labroo, M.; Rhodes, B.; Harold, E.; Hu, F. Single marker analysis for leaf gas exchange traits from RILS of RD 23 (O. sativa L.) and O. longistaminata. Biotechnol. Rep. 2022, 35, e00743. [Google Scholar] [CrossRef] [PubMed]
- Wang, L.; Conteh, B.; Fang, L.; Xia, Q.; Nian, H. QTL mapping for soybean (Glycine max L.) leaf chlorophyll-content traits in a genotyped RIL population by using RAD-Seq based high-density linkage map. BMC Genom. 2020, 21, 739. [Google Scholar] [CrossRef] [PubMed]
- Volynkin, V.; Vasylyk, I.; Volodin, V.; Grigoreva, E.; Karzhaev, D.; Lushchay, E.; Ulianich, P.; Volkov, V.; Risovannaya, V.; Blinova, S.; et al. The assessment of agrobiological and disease resistance traits of grapevine hybrid populations (Vitis vinifera L. × Muscadinia rotundifolia Michx.) in the climatic conditions of Crimea. Plants 2021, 10, 1215. [Google Scholar] [CrossRef] [PubMed]
- Mercati, F.; Riccardi, P.; Leebens-Mack, J.; Abenavoli, M.R.; Falavigna, A.; Sunseri, F. Single nucleotide polymorphism isolated from a novel EST dataset in garden asparagus (Asparagus officinalis L.). Plant Sci. 2013, 203–204, 115–123. [Google Scholar] [CrossRef] [PubMed]
- Moreno, R.; Castro, P.; Vrána, J.; Kubaláková, M.; Cápal, P.; García, V.; Gil, J.; Millán, T.; Doležel, J. Integration of genetic and cytogenetic maps and identification of sex chromosome in garden asparagus (Asparagus officinalis L.). Front. Plant Sci. 2018, Volume 9-2018, 1068. [Google Scholar] [CrossRef] [PubMed]
- Bock, C.H.; Poole, G.H.; Parker, P.E.; Gottwald, T.R. Plant disease severity estimated visually, by digital photography and image. analysis, and by hyperspectral imaging. Crit. Rev. Plant Sci. 2010, 29, 59–107. [Google Scholar] [CrossRef]
- Shaner, G.; Finney, R.E. The effect of nitrogen fertilization on the expression of slow-mildewing resistance in Knox wheat. Phytopathol.> 1977, 67, 1051–1056. [Google Scholar] [CrossRef] [PubMed]
- Dellaporta, S.L.; Wood, J.; Hicks, J.B. A Plant DNA Minipreparation: Version II. Plant Mol. Biol. Report. 1983, 1, 19–21. [Google Scholar] [CrossRef]
- Poland, J.A.; Brown, P.J.; Sorrells, M.E.; Jannink, J.-L. Development of high-density genetic maps for barley and wheat using a novel two-enzyme genotyping-by-sequencing approach. PLoS ONE 2012, 7, e32253. [Google Scholar] [CrossRef] [PubMed]
- Abdelrahman, M.; Nakabayashi, R.; Mori, T.; Ikeuchi, T.; Mori, M.; Murakami, K.; Ozaki, Y.; Matsumoto, M.; Uragami, A.; Tsujimoto, H.; et al. Comparative metabolome and transcriptome analyses of susceptible Asparagus officinalis and resistant wild A. kiusianus reveal insights into stem blight disease resistance. Plant Cell Physiol. 2020, 61, 1464–1476. [Google Scholar] [CrossRef] [PubMed]
- Ito, T.; Konno, I.; Kubota, S.; Ochiai, T.; Sonoda, T.; Hayashi, Y.; Fukuda, T.; Yokoyama, J.; Nakayama, H.; Kameya, T.; et al. Production and characterization of interspecific hybrids between Asparagus kiusianus Makino and A. officinalis L. Euphytica 2011, 182, 285–294. [Google Scholar] [CrossRef]
- Senaratne, W.M.T.N.; Jayaweera, J.A.A.S. Comparison of microbial preservation methods: A narrative review. Germs 2024, 14, 375–386. [Google Scholar] [CrossRef] [PubMed]
- Tini, F.; Beccari, G.; Marconi, G.; Porceddu, A.; Sulyok, M.; Gardiner, D.M.; Albertini, E.; Covarelli, L. Identification of putative virulence genes by DNA methylation studies in the cereal pathogen Fusarium graminearum. Cells 2021, 10, 1192. [Google Scholar] [CrossRef] [PubMed]
- Breen, J.; Mur, L.A.J.; Sivakumaran, A.; Akinyemi, A.; Wilkinson, M.J.; Rodriguez Lopez, C.M. Botrytis cinerea loss and restoration of virulence during in vitro culture follows flux in global DNA methylation. Int. J. Mol. Sci. 2022, 23, 3034. [Google Scholar] [CrossRef] [PubMed]
- Yasuda, N.; Mitsunaga, T.; Hayashi, K.; Koizumi, S.; Fujita, Y. Effects of pyramiding quantitative resistance genes Pi21, Pi34, and Pi35 on rice leaf blast disease. Plant Dis. 2015, 99, 904–909. [Google Scholar] [CrossRef] [PubMed]
- Fukuoka, S.; Yamamoto, S.-I.; Mizobuchi, R.; Yamanouchi, U.; Ono, K.; Kitazawa, N.; Yasuda, N.; Fujita, Y.; Nguyen, T.T.T.; Koizumi, S.; et al. Multiple functional polymorphisms in a single disease resistance gene in rice enhance durable resistance to blast. Sci. Rep. 2014, 4, 4550. [Google Scholar] [CrossRef]
- Sasai, R.; Tabuchi, H.; Shirasawa, K.; Kishimoto, K.; Sato, S.; Okada, Y.; Kuramoto, A.; Kobayashi, A.; Isobe, S.; Tahara, M.; et al. Development of molecular markers associated with resistance to Meloidogyne incognita by performing quantitative trait locus analysis and genome-wide association study in sweetpotato. DNA Res. 2019, 26, 399–409. [Google Scholar] [CrossRef] [PubMed]
- Neff, M.M.; Turk, E.; Kalishman, M. Web-based primer design for single nucleotide polymorphism analysis. Trends Genet. 2002, 18, 613–615. [Google Scholar] [CrossRef] [PubMed]
- Neff, M.M.; Neff, J.D.; Chory, J.; Pepper, A.E. dCAPS, a simple technique for the genetic analysis of single nucleotide. polymorphisms: Experimental applications in Arabidopsis thaliana genetics. Plant J. 1998, 14, 387–392. [Google Scholar] [CrossRef] [PubMed]
- Michaels, S.D.; Amasino, R.M. A robust method for detecting single-nucleotide changes as polymorphic markers by PCR. Plant J. 1998, 14, 381–385. [Google Scholar] [CrossRef] [PubMed]
- An, H.; Lee, H.-Y.; Shim, D.; Choi, S.H.; Cho, H.; Hyun, T.K.; Jo, I.-H.; Chung, J.-W. Development of CAPS markers for evaluation of genetic diversity and population structure in the germplasm of button mushroom (Agaricus bisporus). J. Fungi 2021, 7. [Google Scholar] [CrossRef] [PubMed]
- Kulkarni, K.P.; Appiah, R.K.; Reddy, U.K.; Melmaiee, K. Cleaved amplified polymorphic sequence markers in horticultural crops: current status and future perspectives. Agronomy 2024, 14. [Google Scholar] [CrossRef]
Figure 1.
Procedure of ligation (A) and PCR (B) for RADseq. (modified from [18]).
Figure 1.
Procedure of ligation (A) and PCR (B) for RADseq. (modified from [18]).
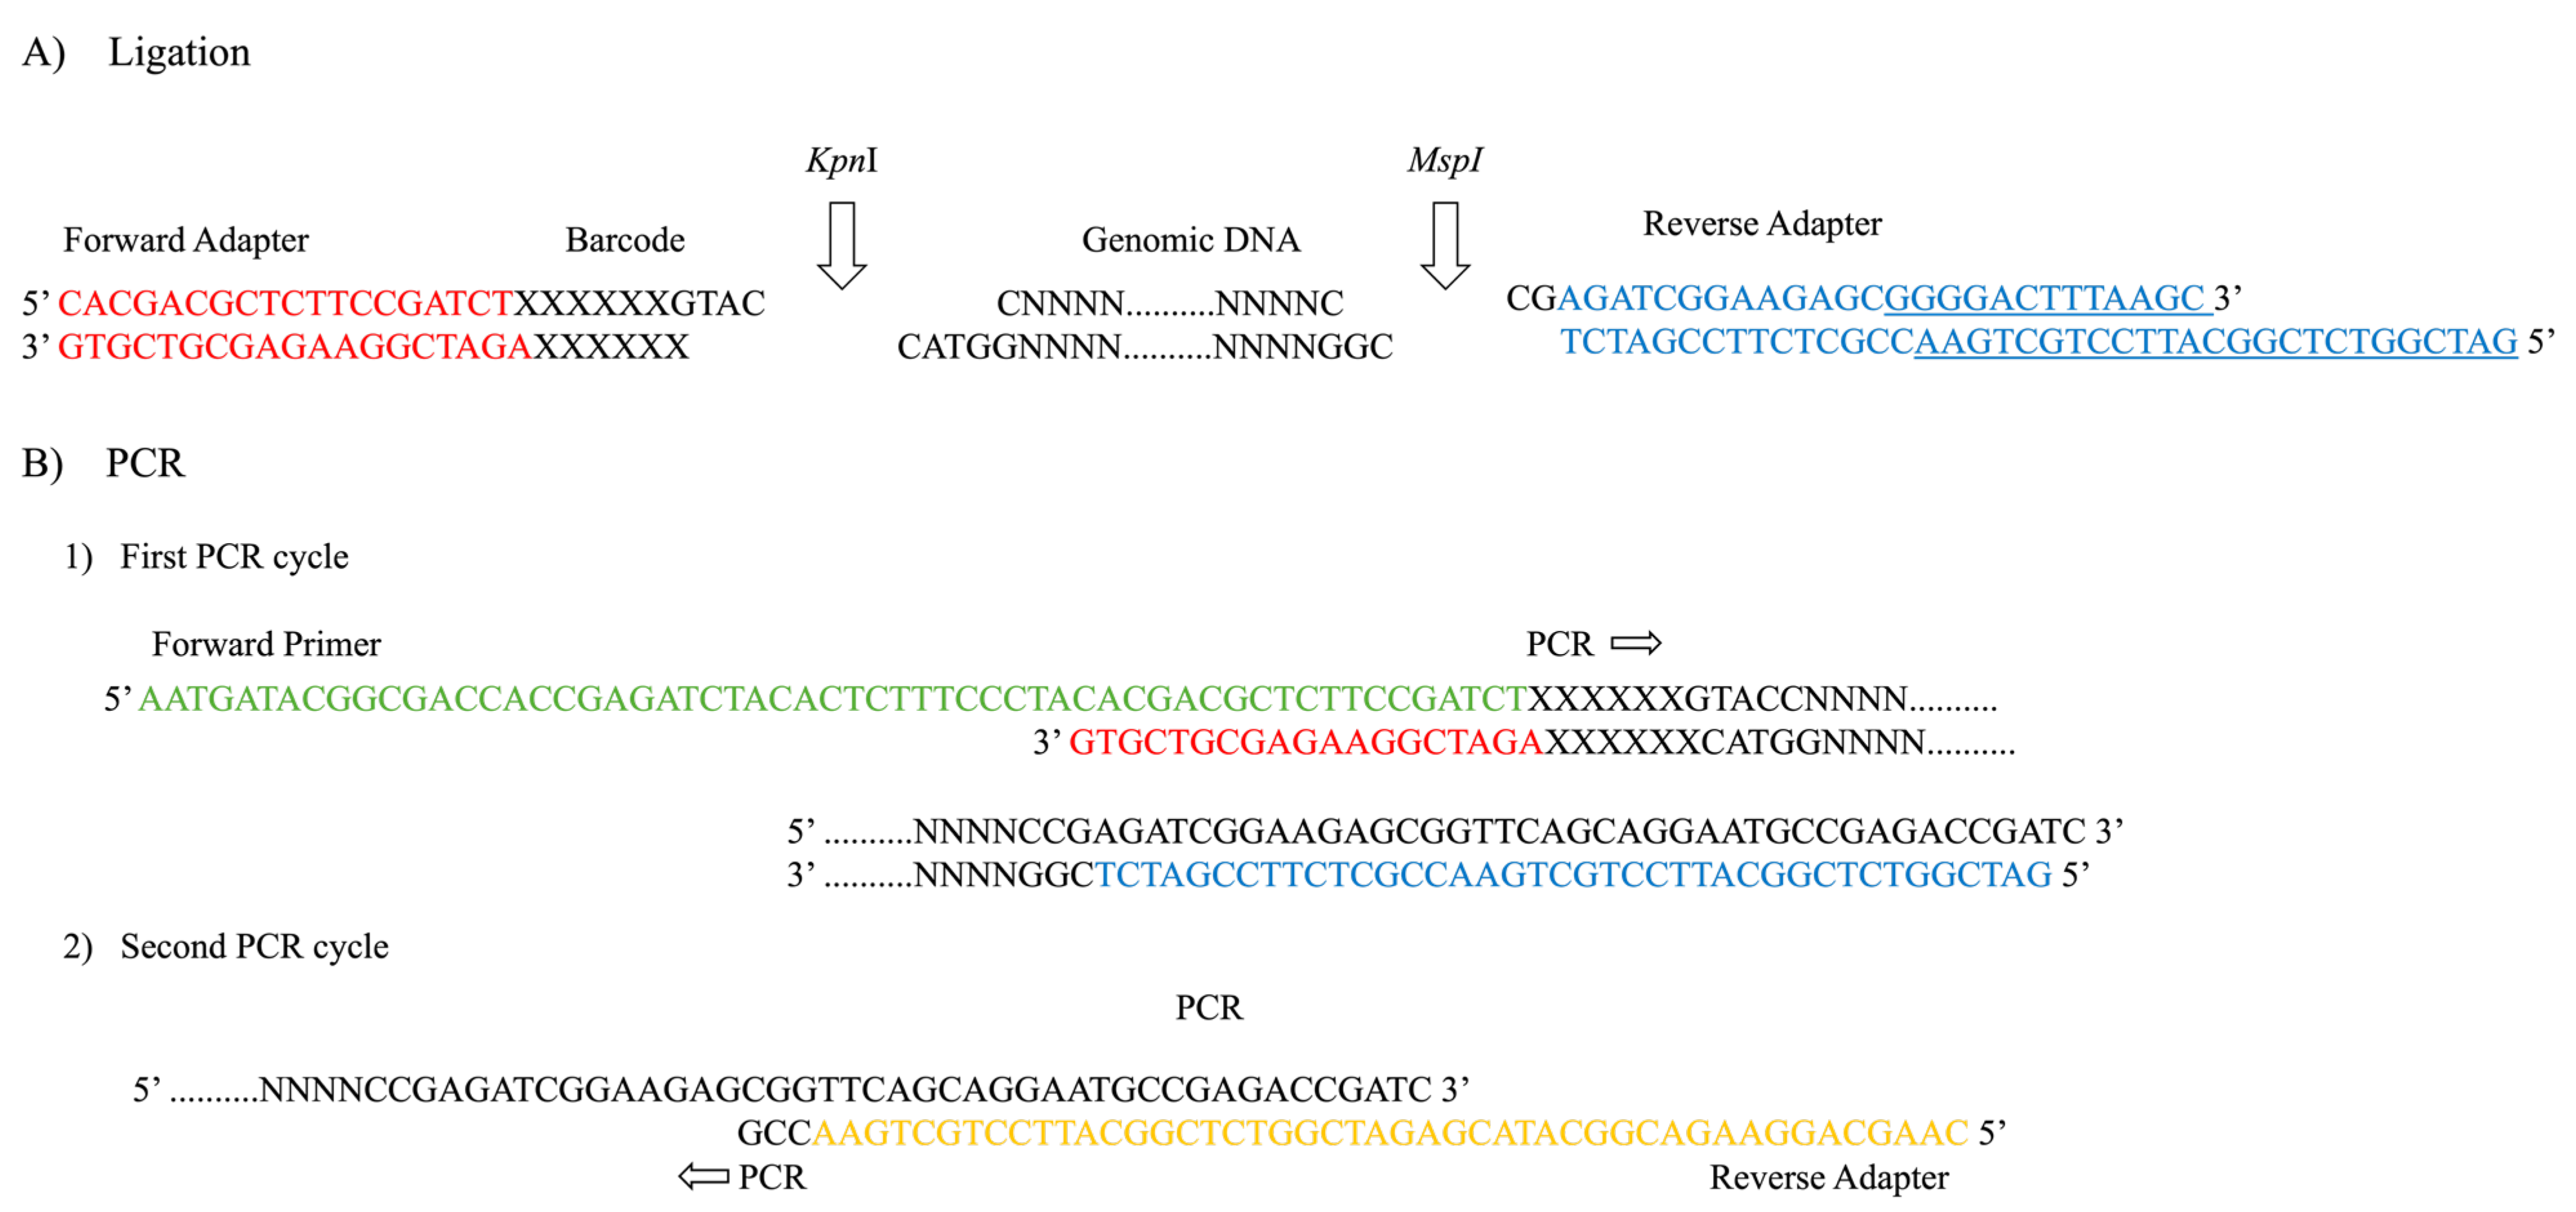
Figure 2.
Number of individuals in each cross combination classified by disease severity grade at different evaluation time points in the inoculation test. (n) number of individuals tested; (a) & (a’) WC-9f × OK007; (b) & (b’) WC-9f × OK014; (c) & (c’) WC2 × WCK3; (a) - (c) Evaluation performed when a half of the control asparagus plants reached a DSG of 4; (a’) - (c’): Evaluation performed when all control asparagus plants reached a DSG of 4.
Figure 2.
Number of individuals in each cross combination classified by disease severity grade at different evaluation time points in the inoculation test. (n) number of individuals tested; (a) & (a’) WC-9f × OK007; (b) & (b’) WC-9f × OK014; (c) & (c’) WC2 × WCK3; (a) - (c) Evaluation performed when a half of the control asparagus plants reached a DSG of 4; (a’) - (c’): Evaluation performed when all control asparagus plants reached a DSG of 4.
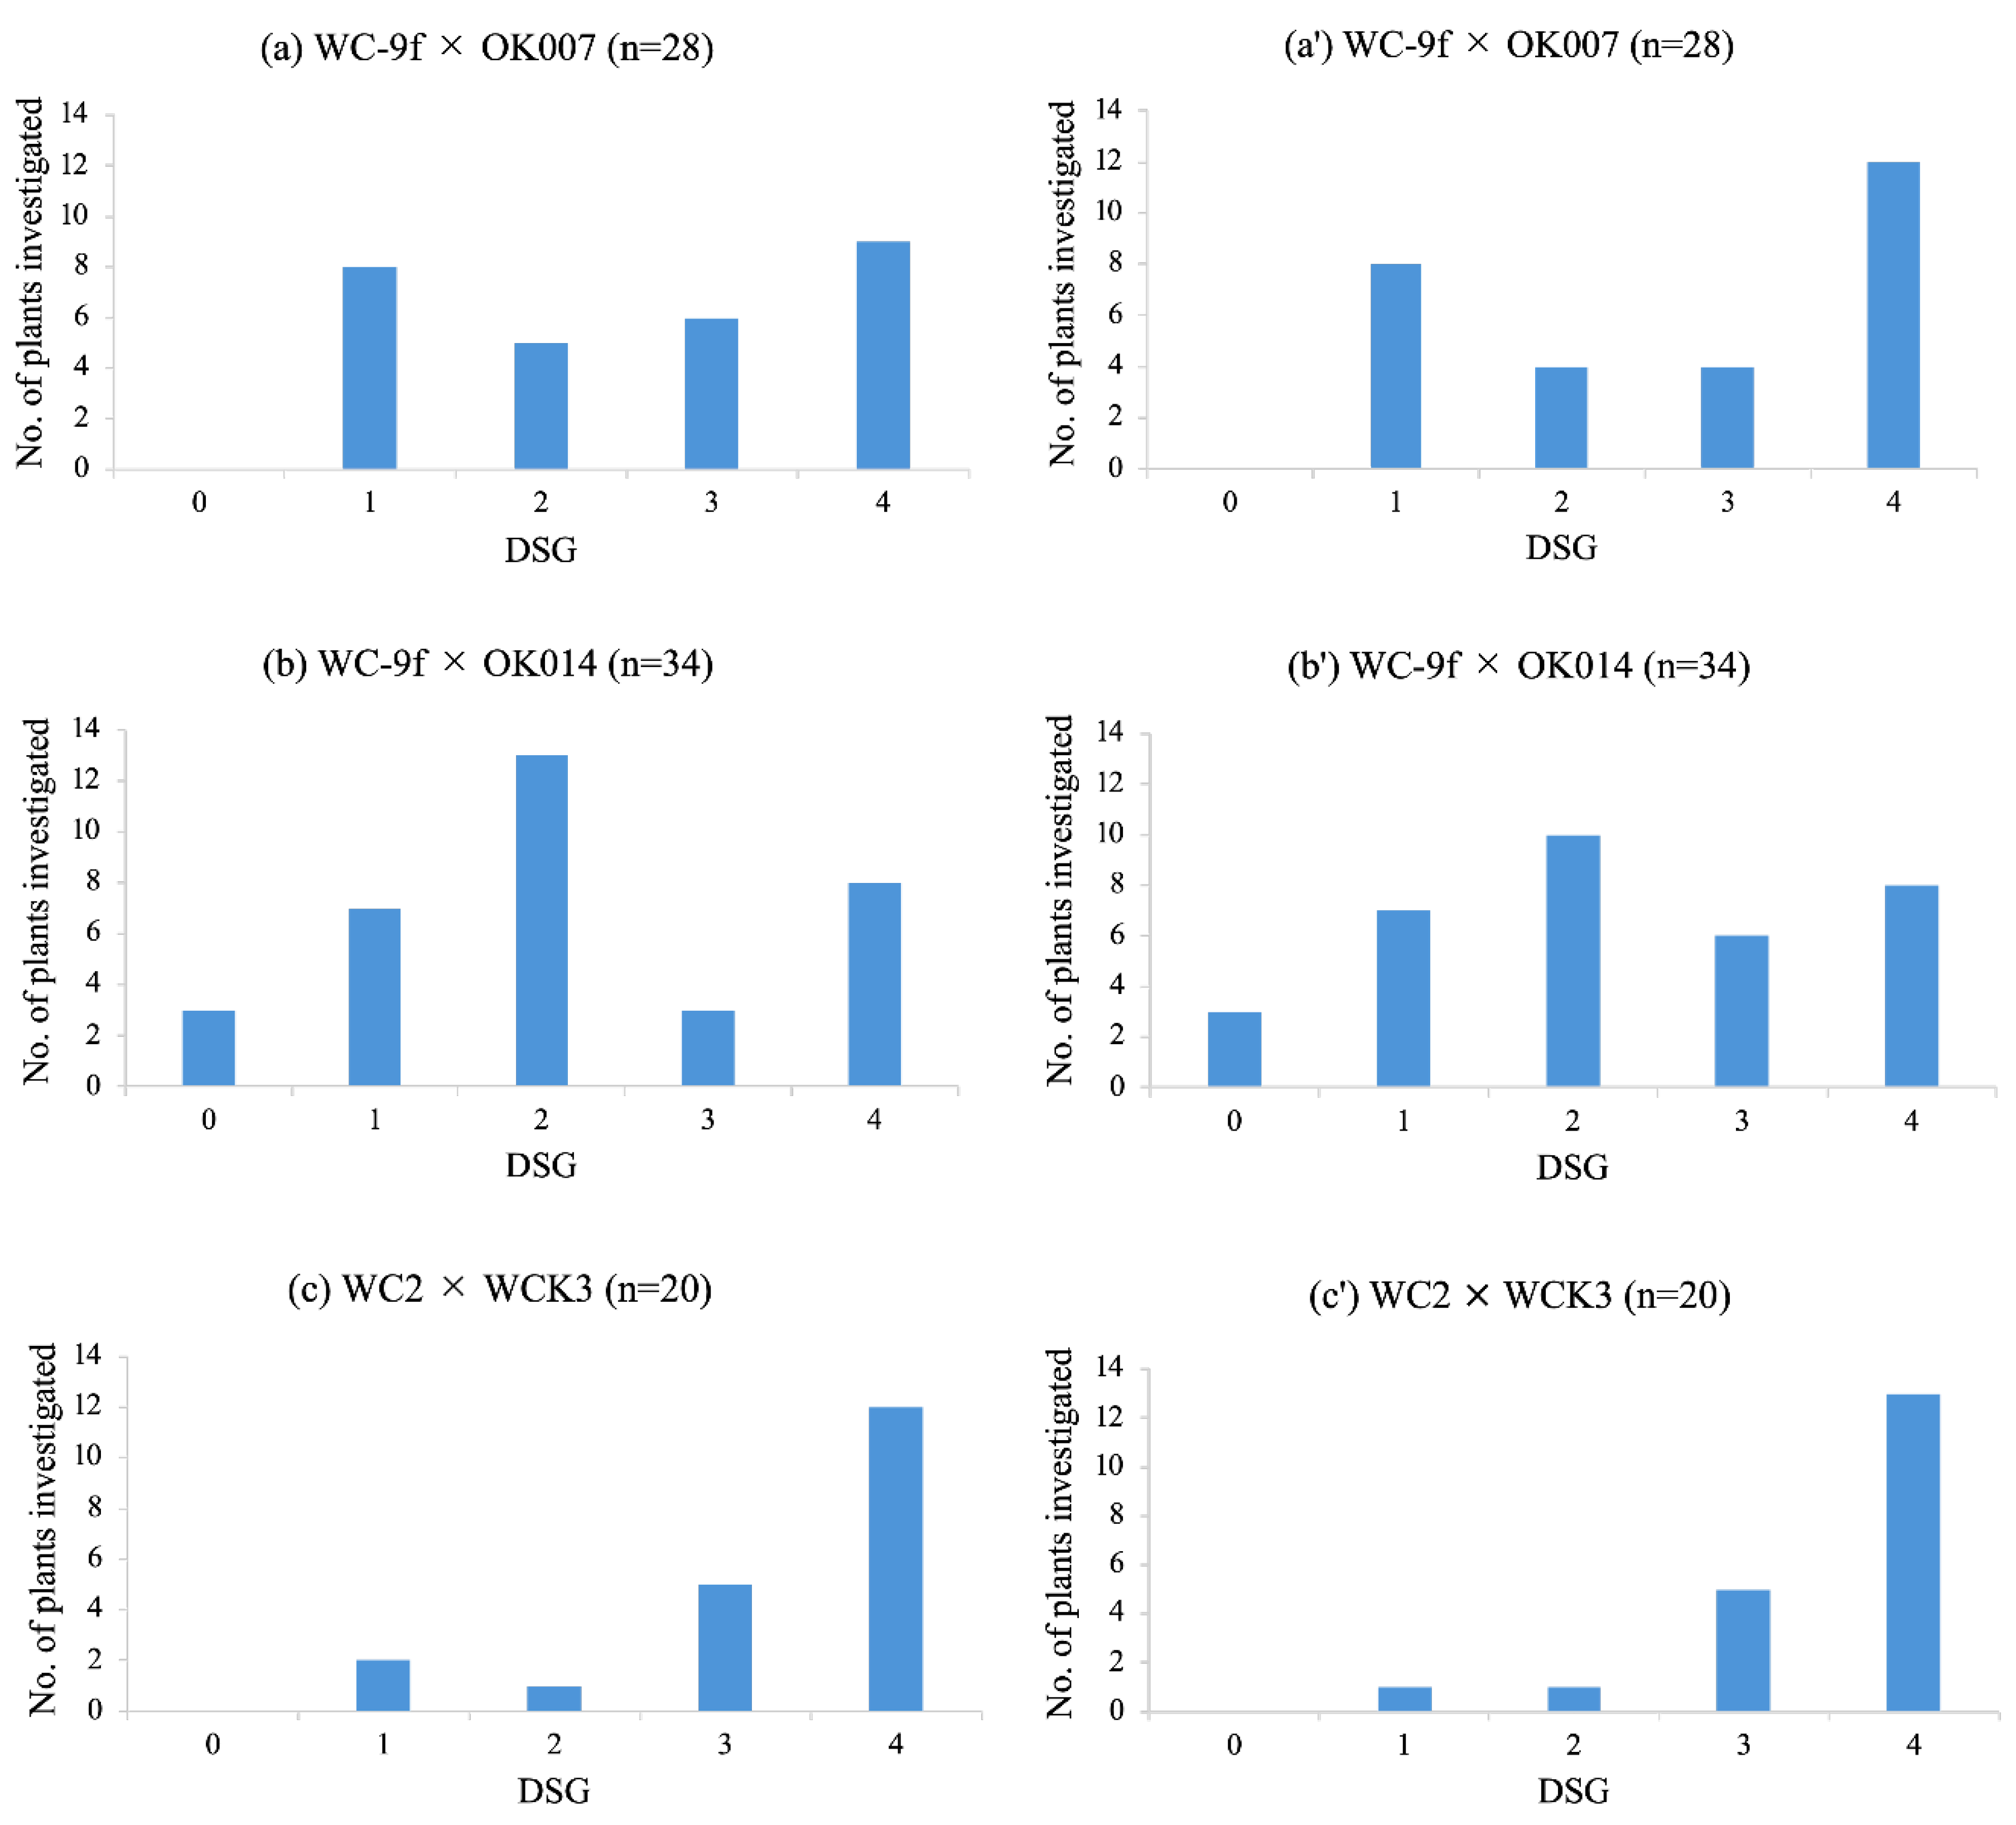
Figure 3.
Number of BC1 individuals with disease severity grade (DSG) category. (a) WC-9f × OK007; (b) WC-9f × OK014; (c) WC2 × WCK3; (d) OK011 × KAG WC No.28.
Figure 3.
Number of BC1 individuals with disease severity grade (DSG) category. (a) WC-9f × OK007; (b) WC-9f × OK014; (c) WC2 × WCK3; (d) OK011 × KAG WC No.28.
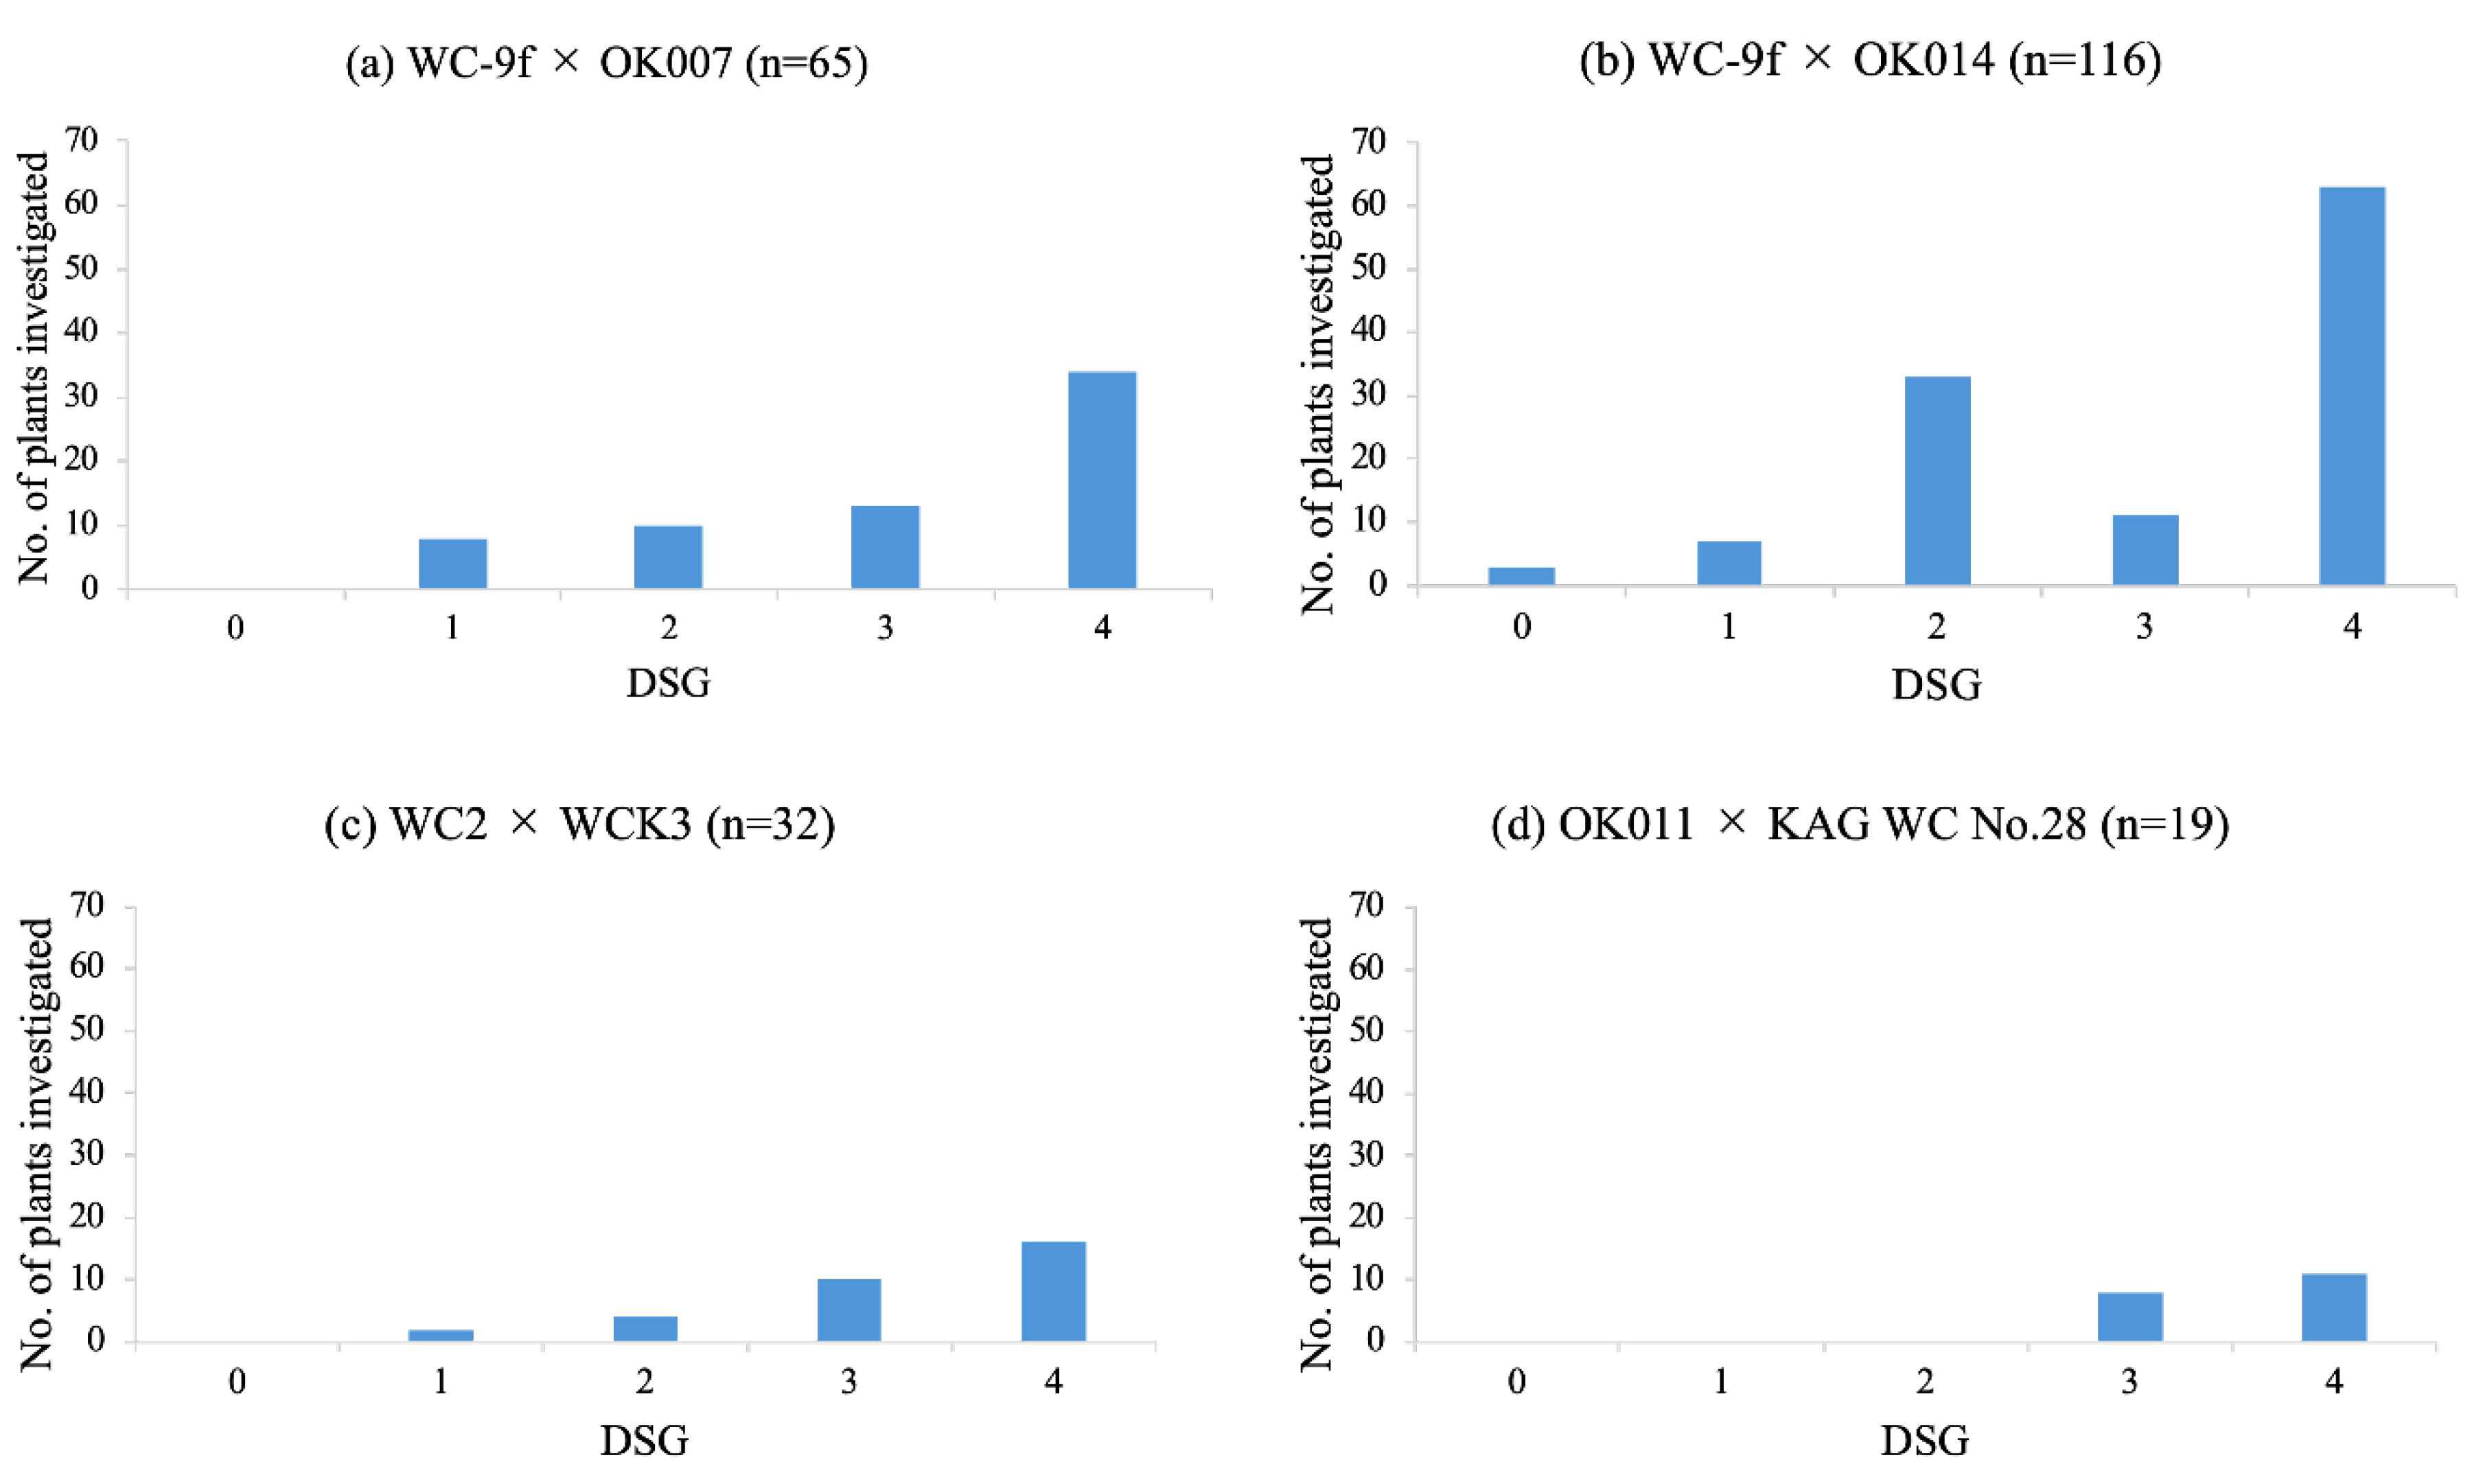
Figure 4.
Genetic map using WC-9f × OK014 (68 individuals) and WC-9f × OK007 (54 individuals). (No. of loci: 402, No. of linkage groups: 10, Map distance: 1923 cM, Average marker density: 4.78 cM/marker).
Figure 4.
Genetic map using WC-9f × OK014 (68 individuals) and WC-9f × OK007 (54 individuals). (No. of loci: 402, No. of linkage groups: 10, Map distance: 1923 cM, Average marker density: 4.78 cM/marker).
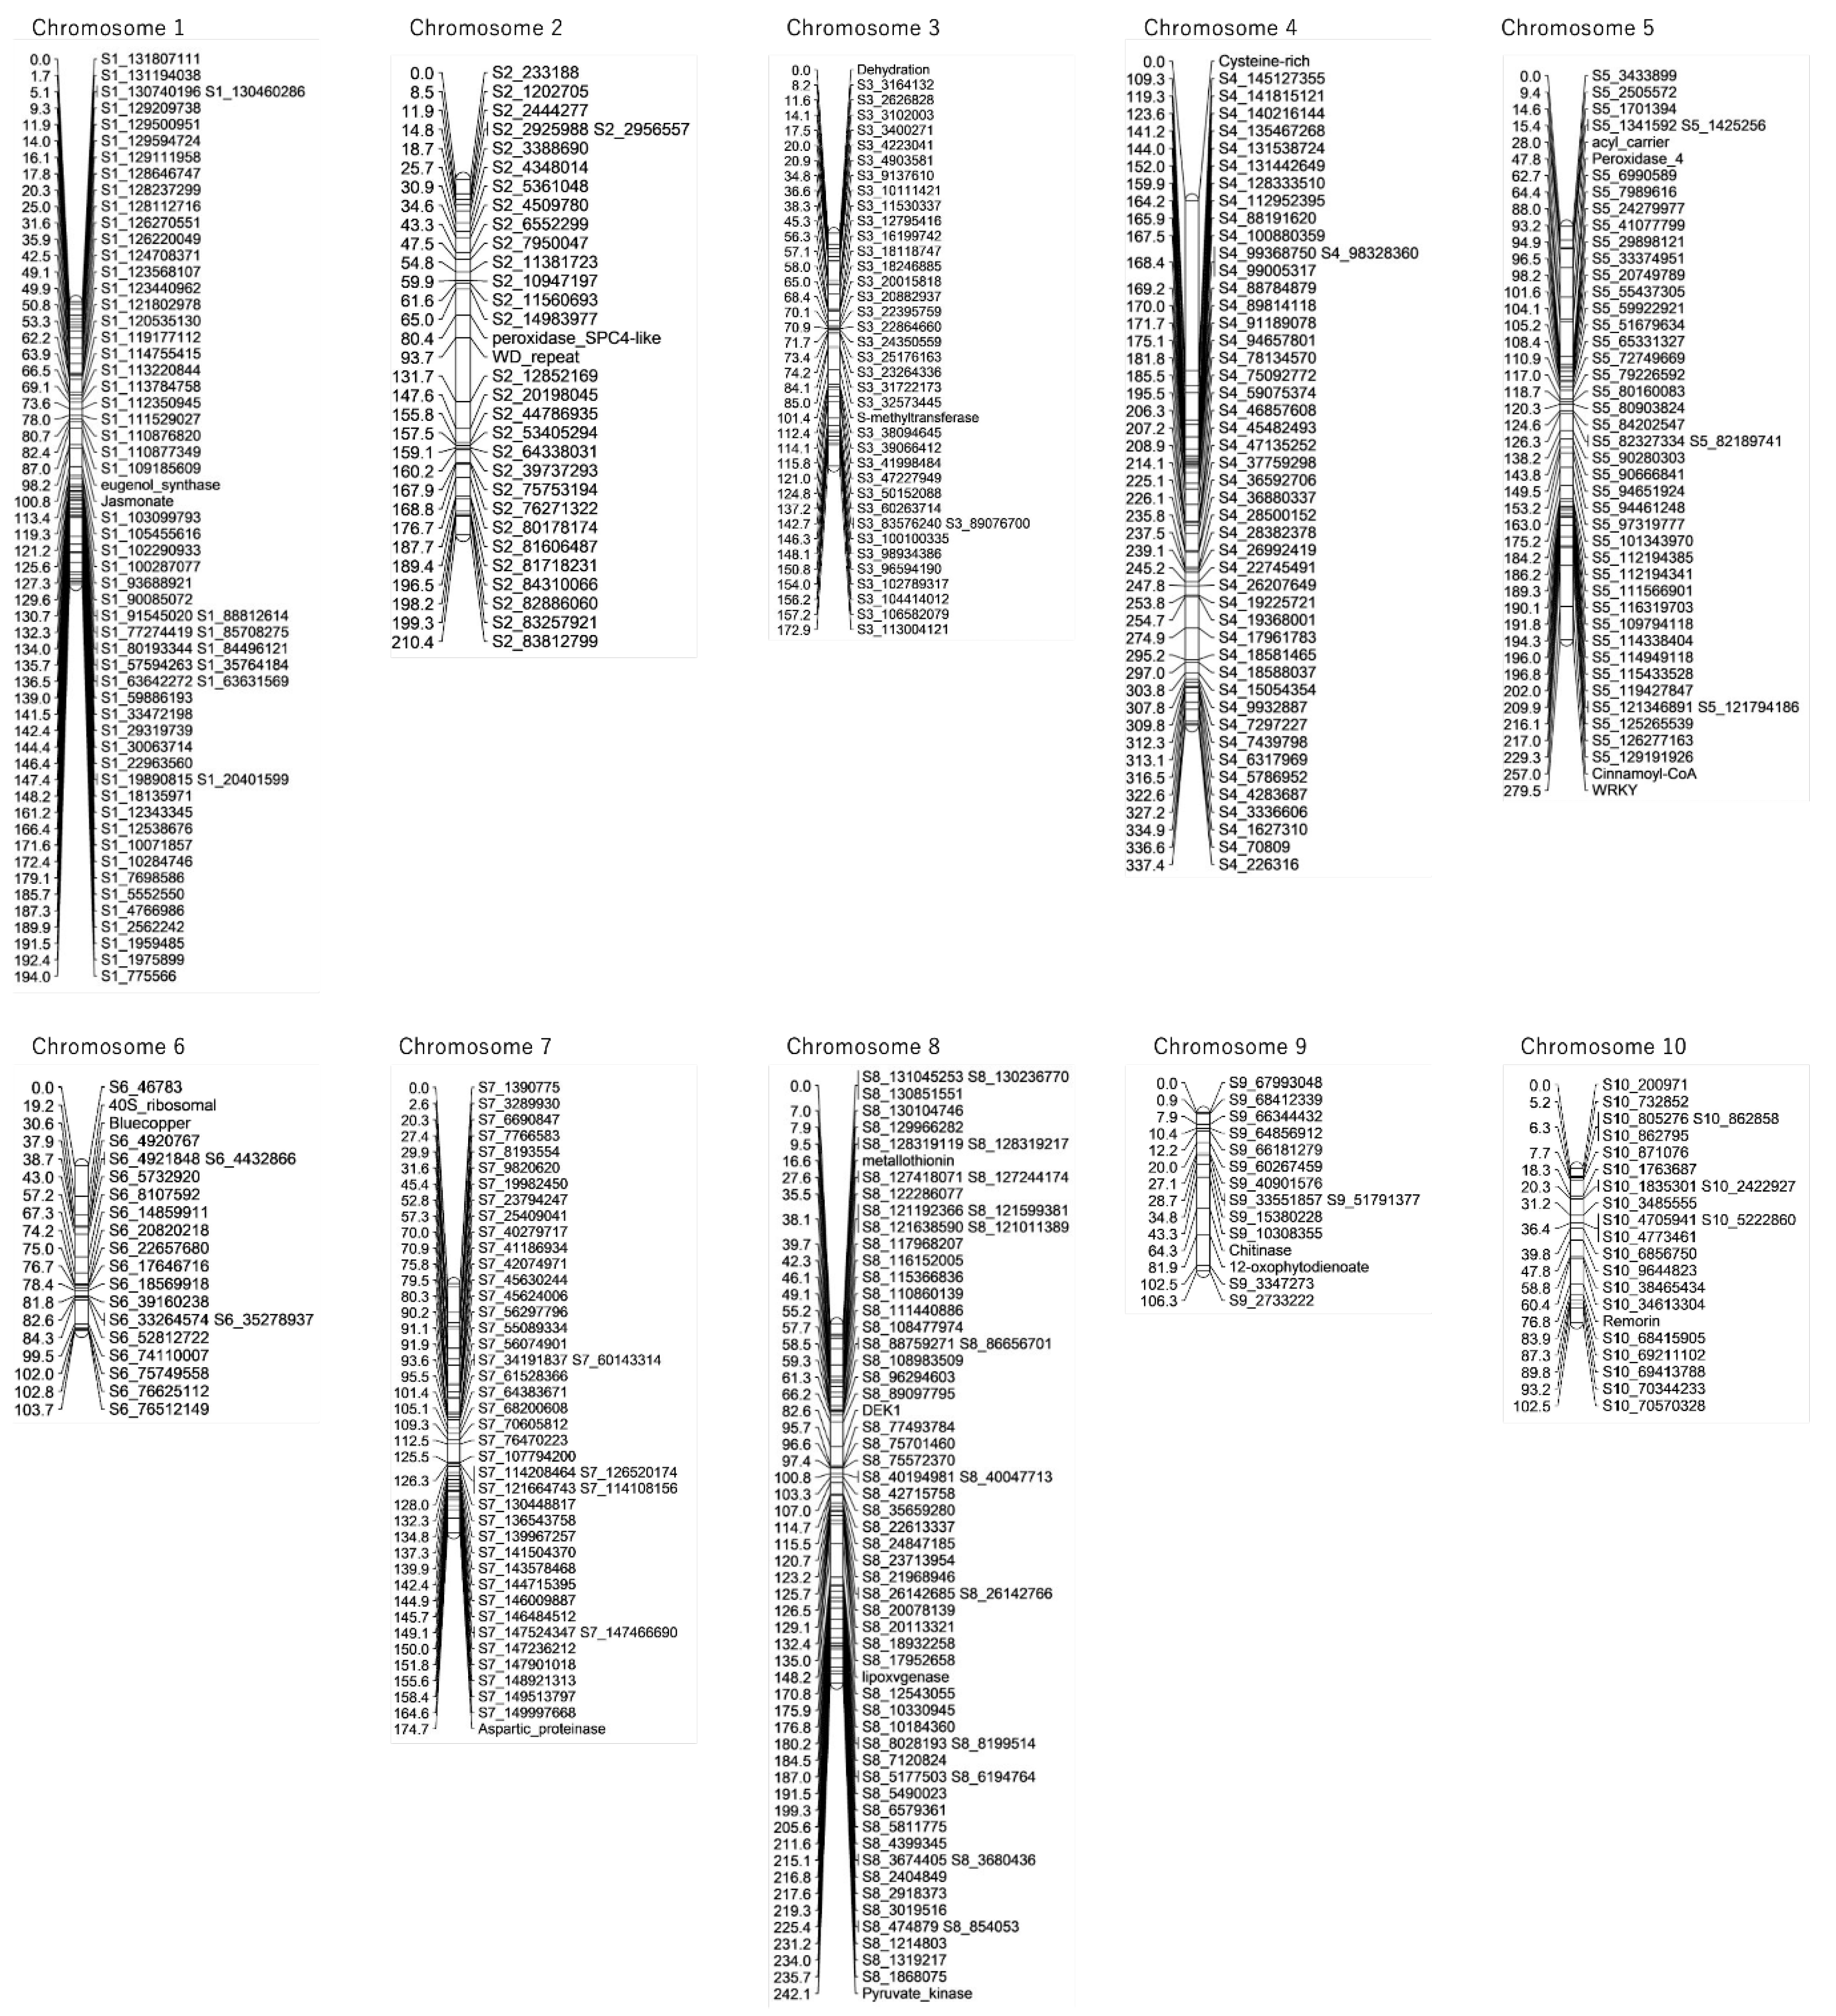
Figure 5.
Linkage map of chromosome 1 showing QTL associated with resistance to asparagus stem blight. Gray bar: LOD > 3 (Maximum LOD value: 3.68).
Figure 5.
Linkage map of chromosome 1 showing QTL associated with resistance to asparagus stem blight. Gray bar: LOD > 3 (Maximum LOD value: 3.68).
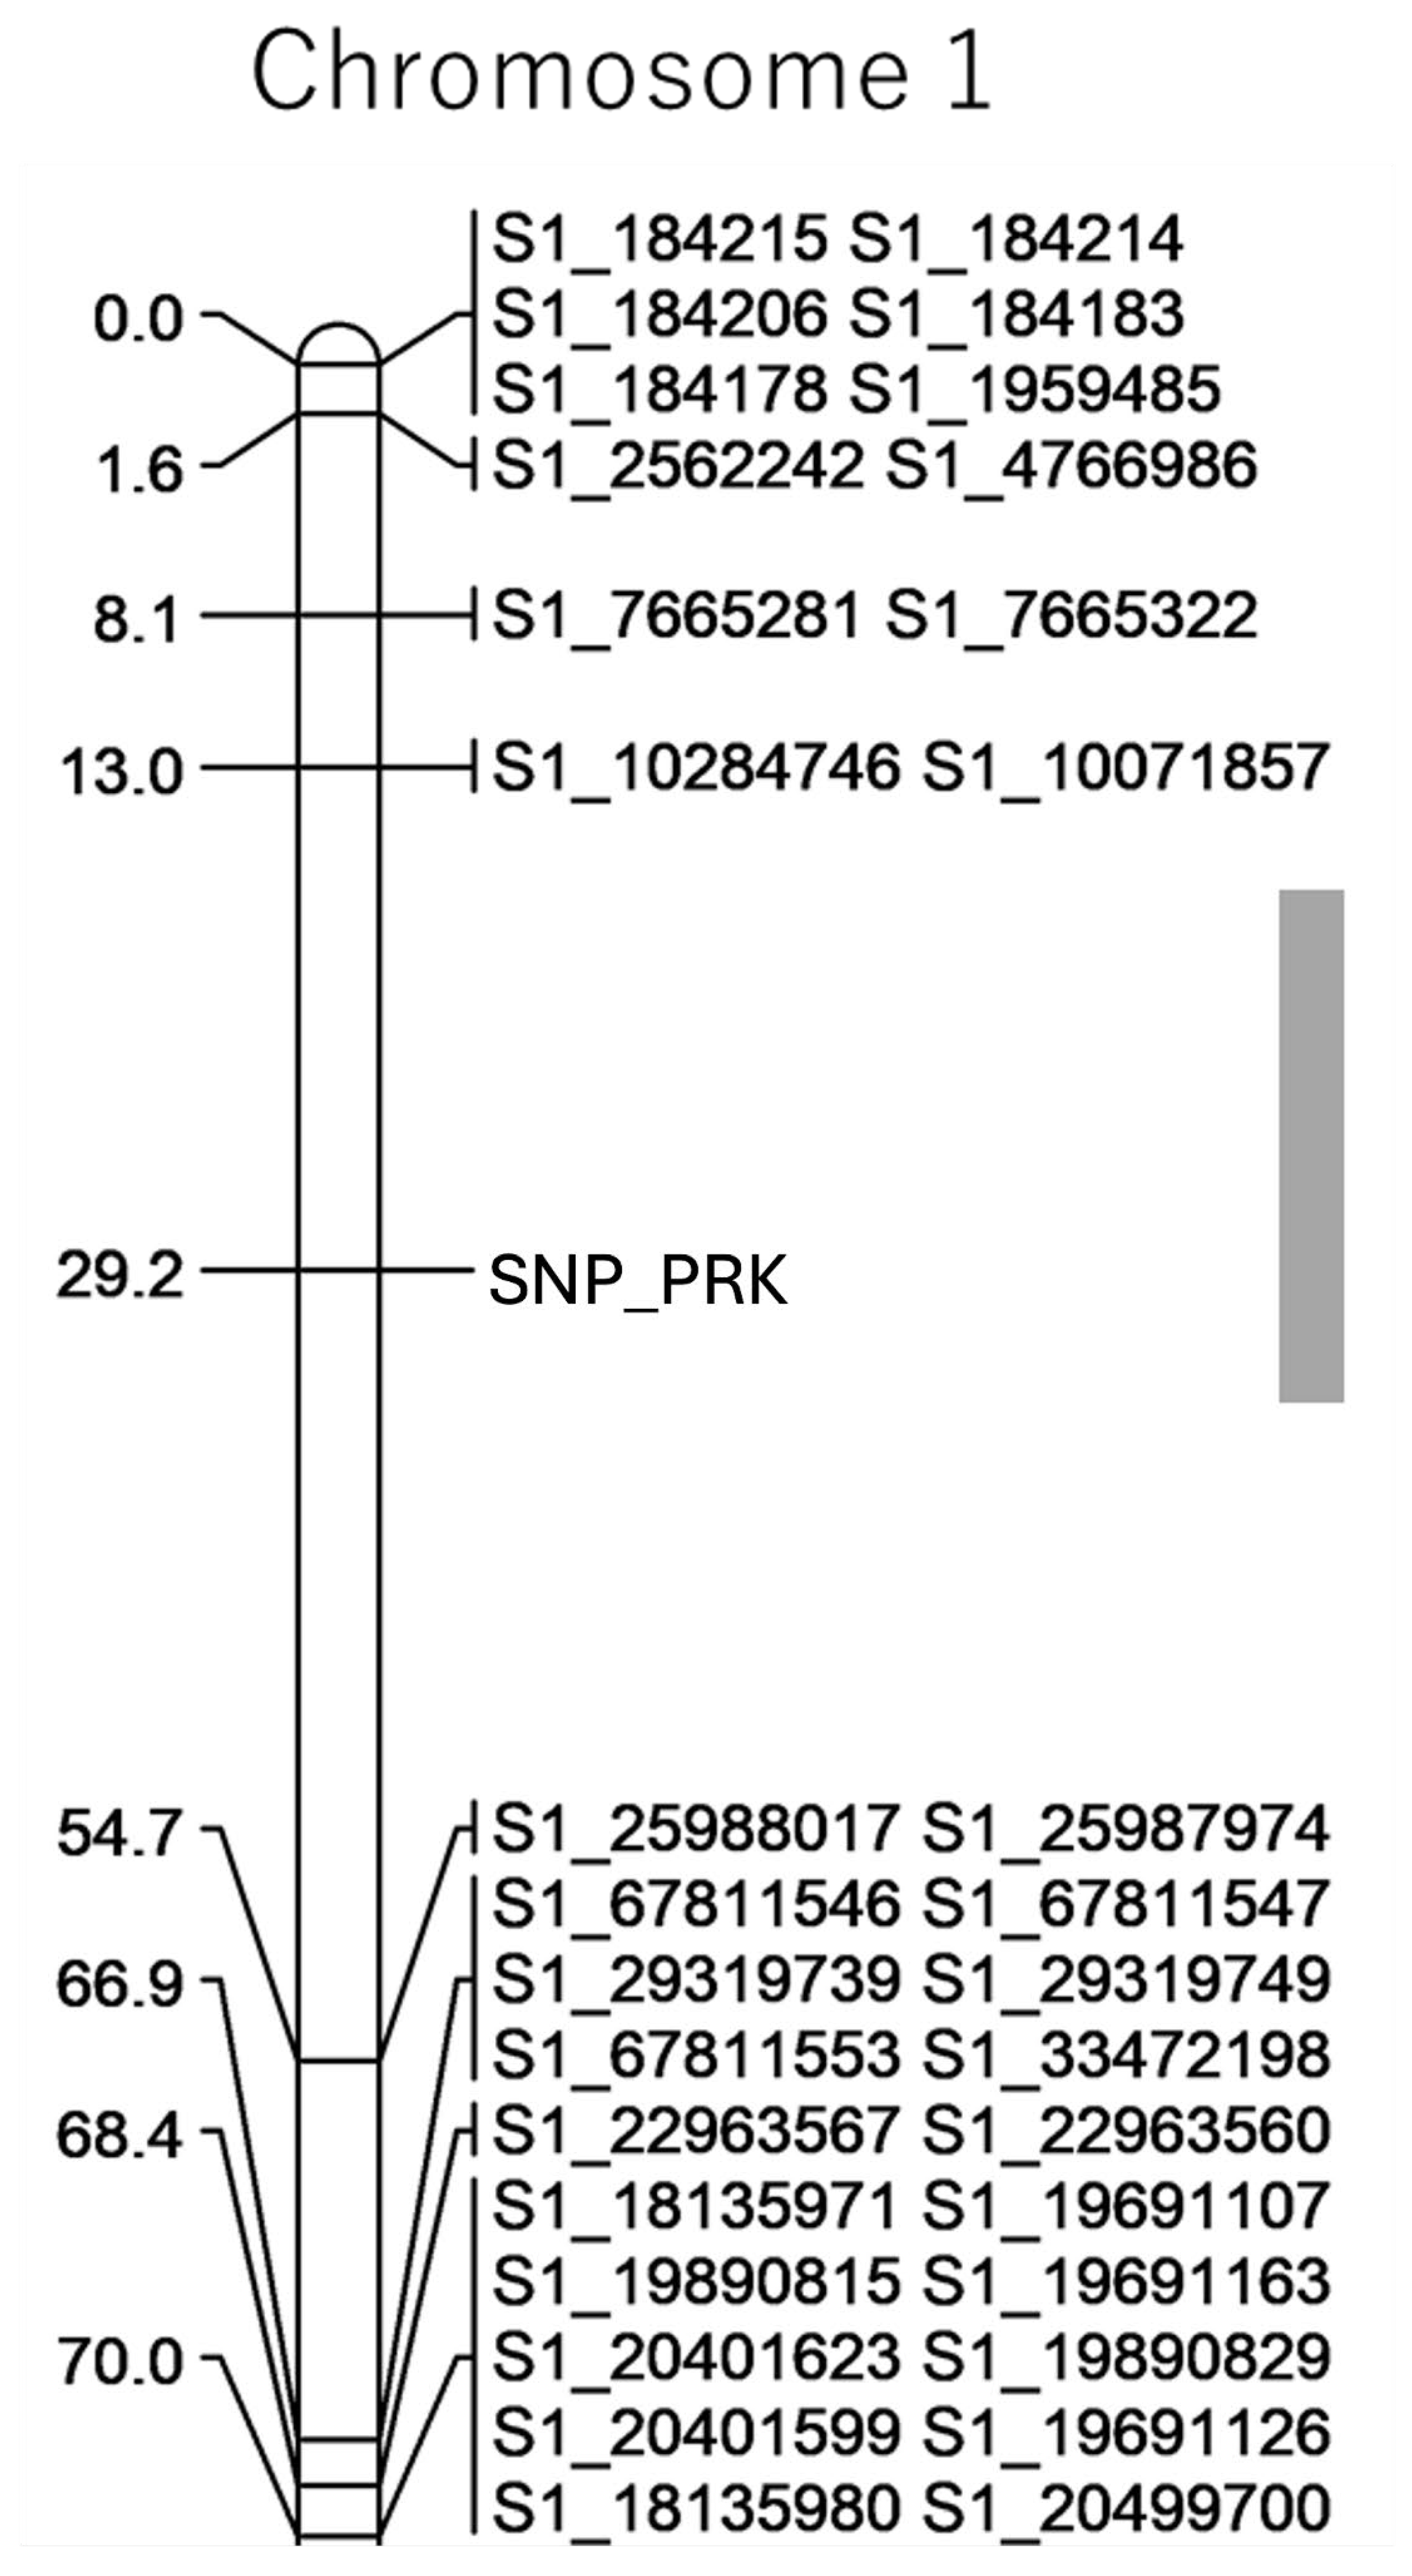
Figure 6.
Electrophoretic analysis of the CAPS marker PR1. (M)100 bp DNA ladder marker; (1) A. officinalis; (2) A. kiusianus; (3) interspecific hybrid OK014.
Figure 6.
Electrophoretic analysis of the CAPS marker PR1. (M)100 bp DNA ladder marker; (1) A. officinalis; (2) A. kiusianus; (3) interspecific hybrid OK014.
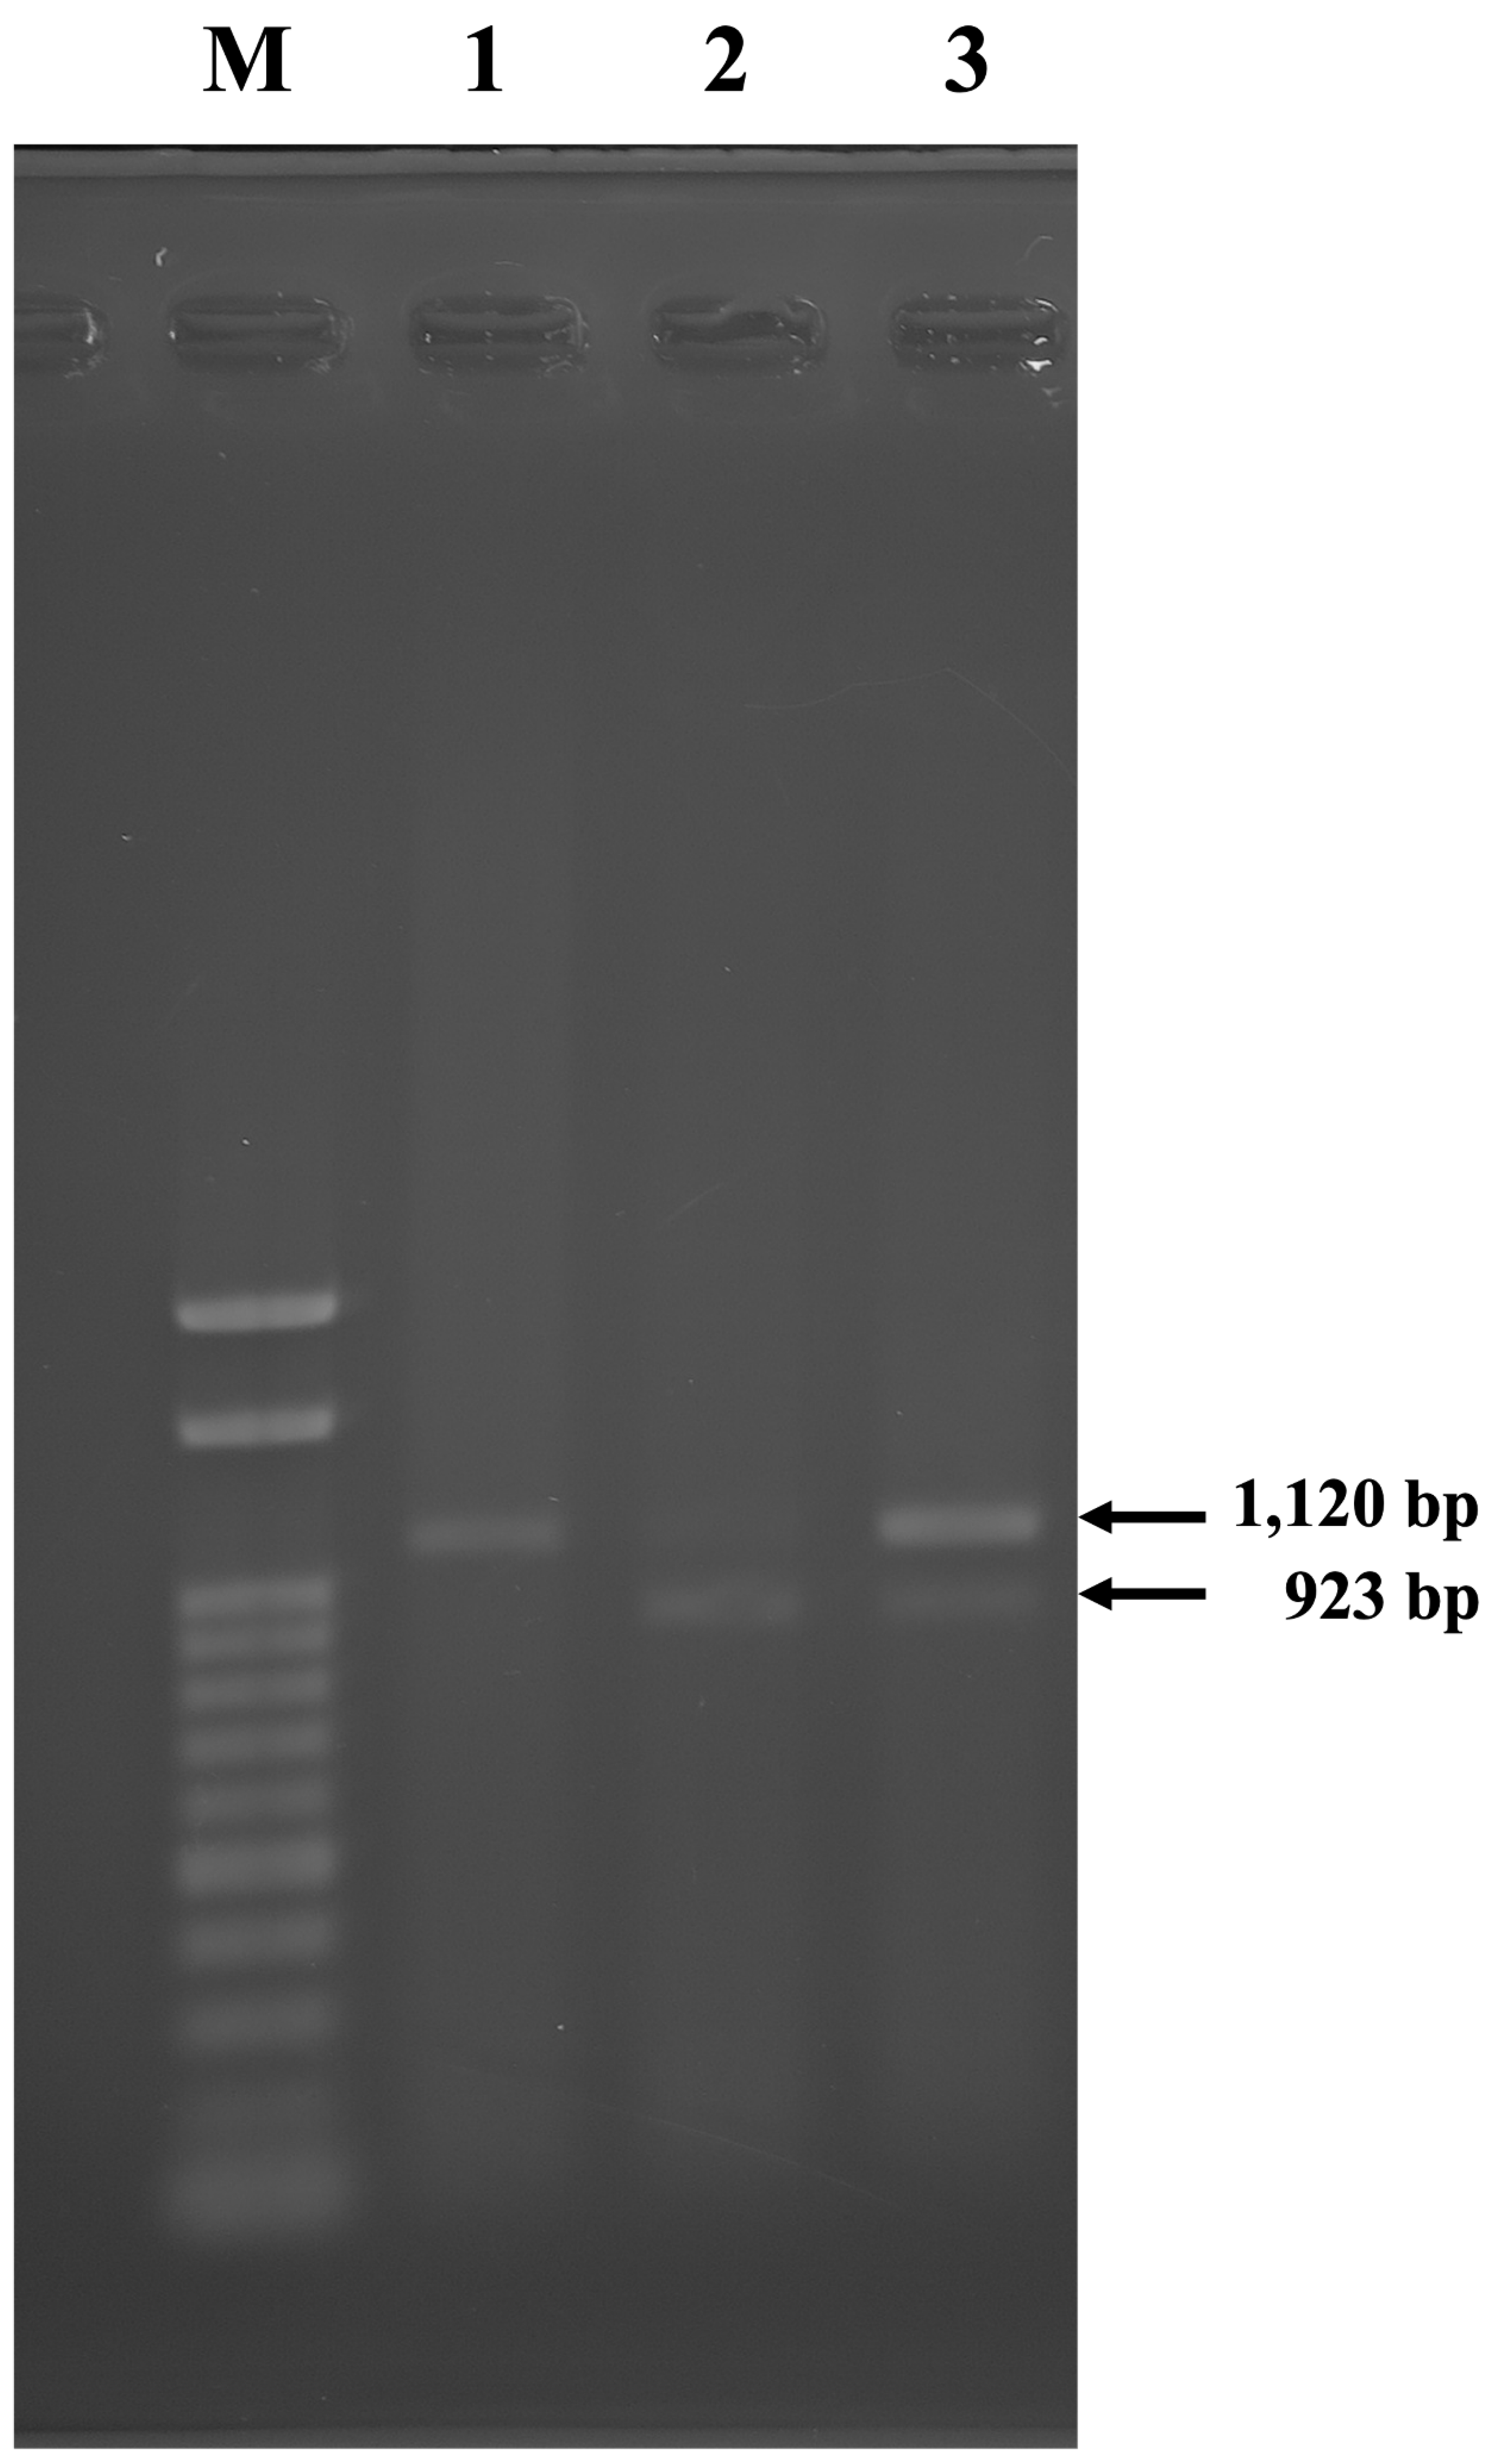
Figure 7.
Resistance segregation pattern in BC1 population (Major gene control).
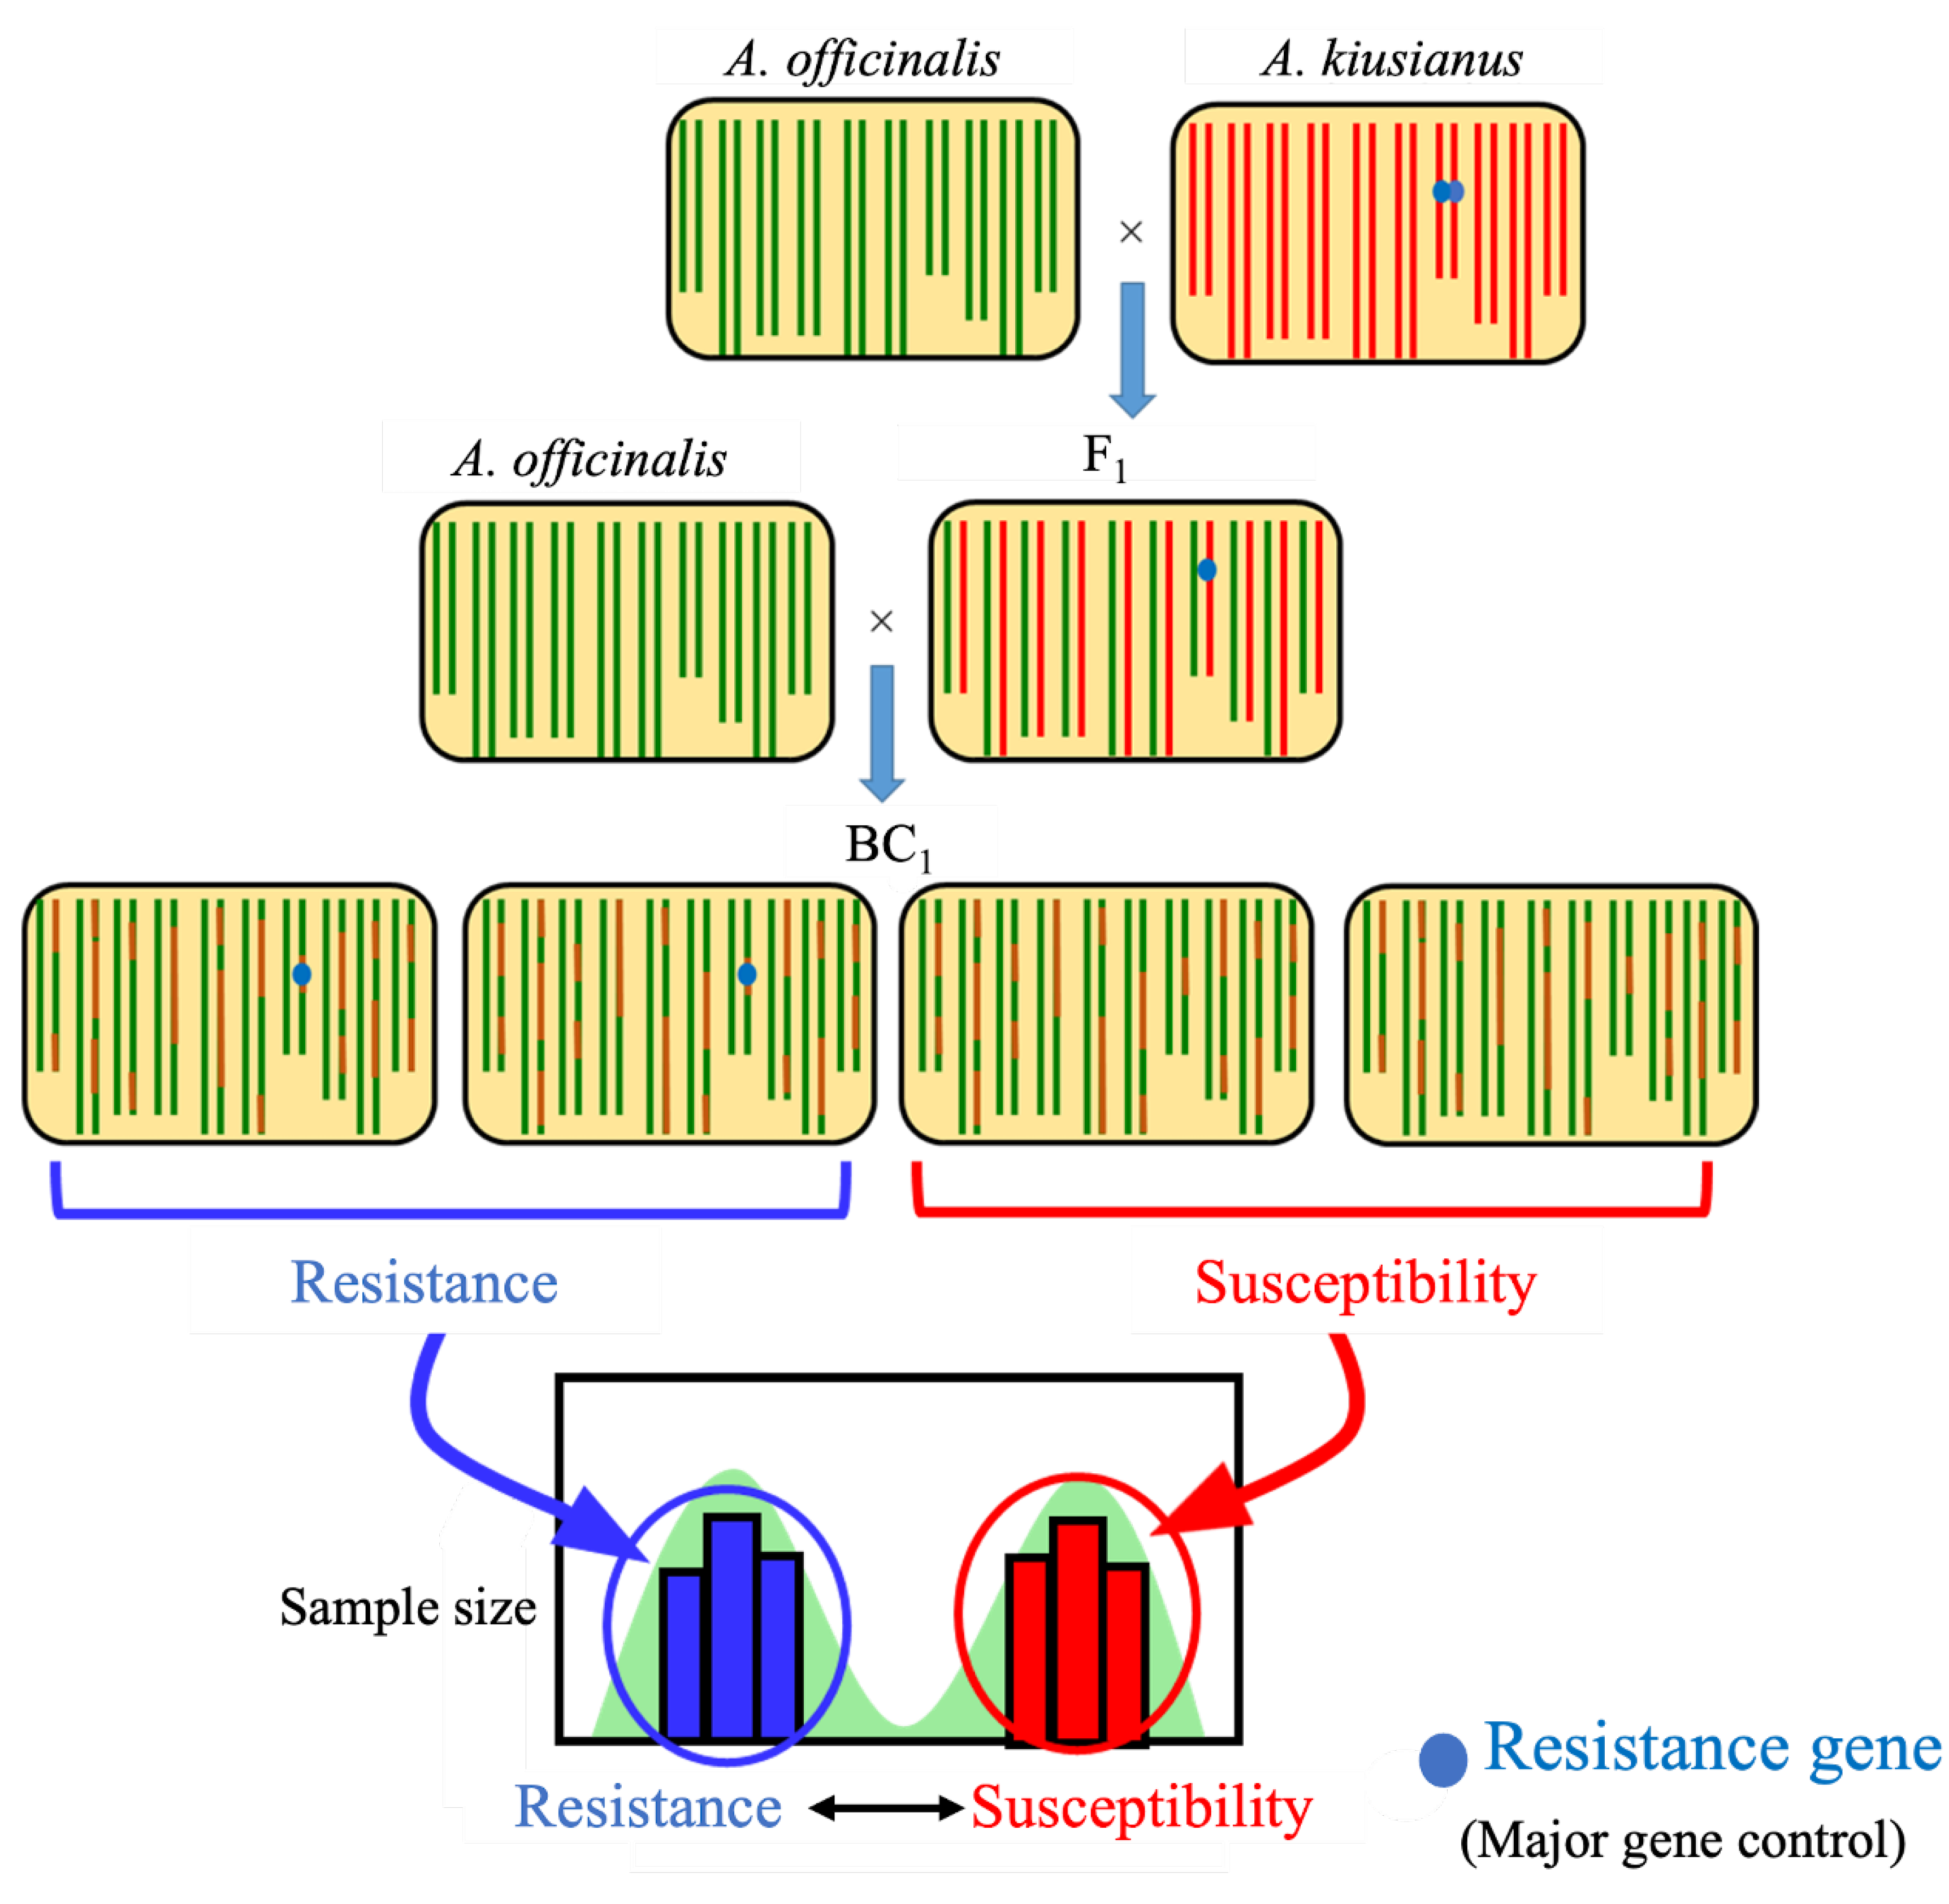
Figure 8.
Resistance segregation pattern in BC1 population (Polygenic control).
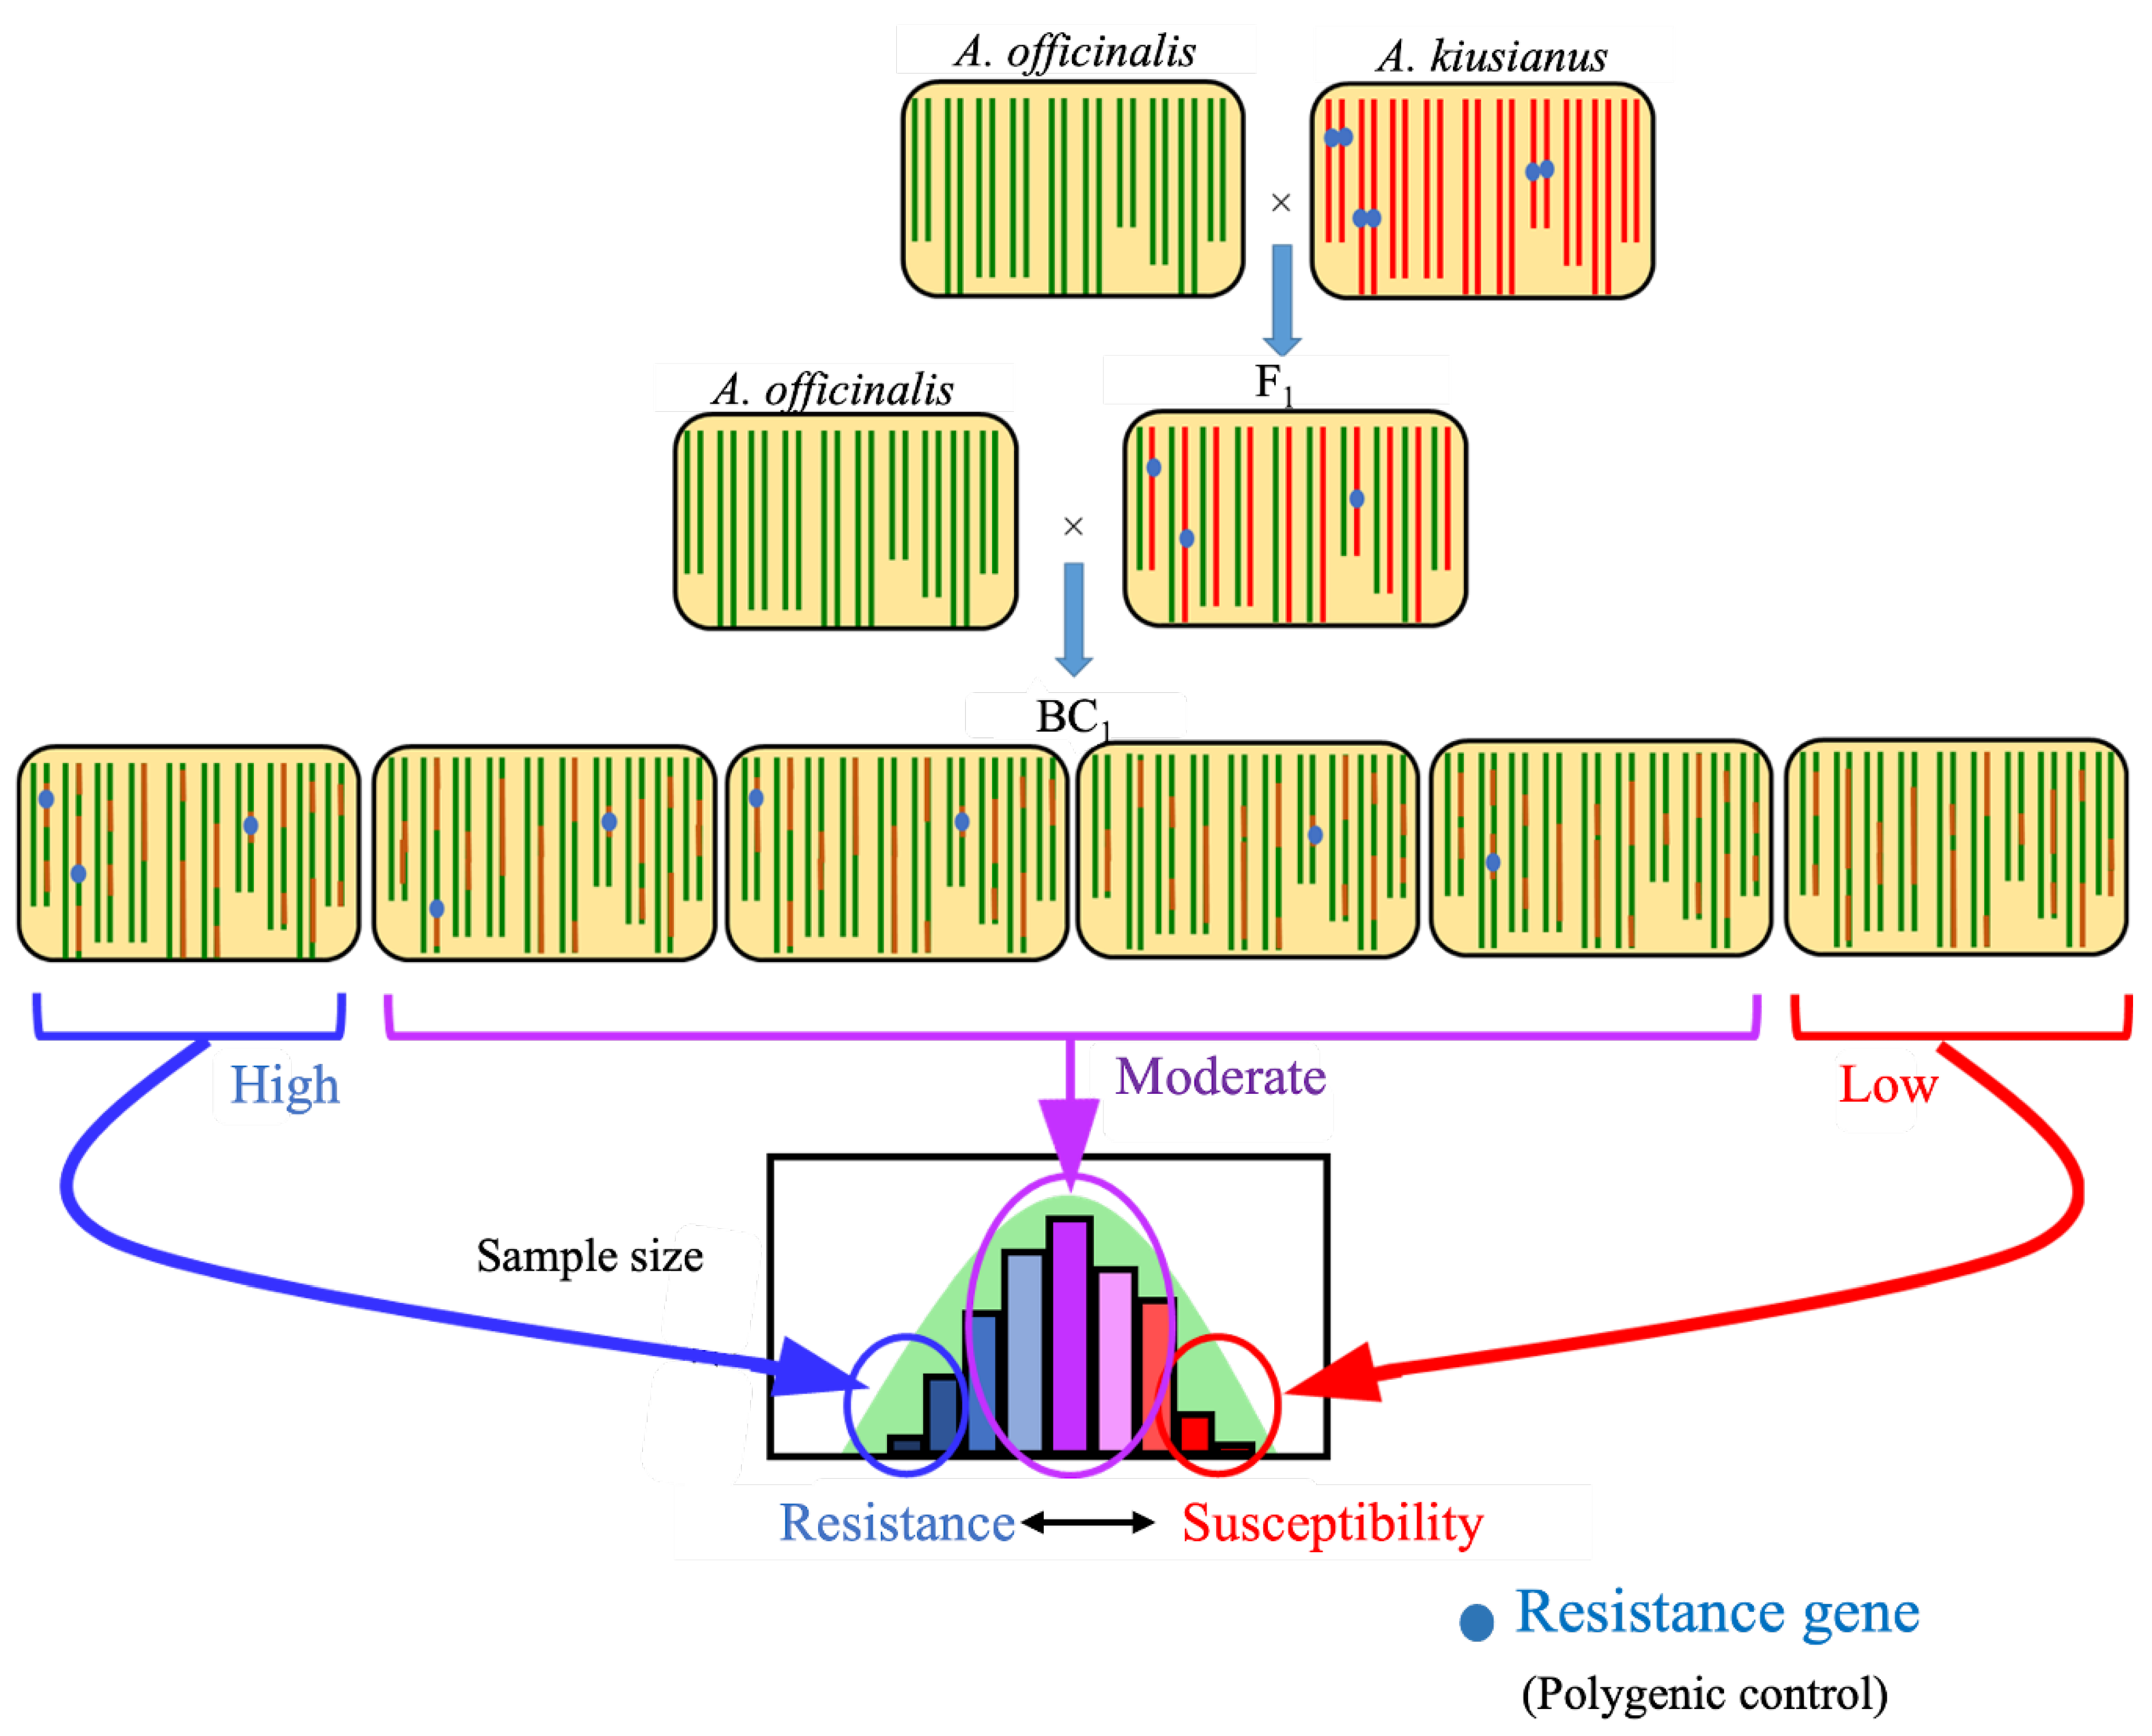
Figure 9.
Resistance segregation patterns in the BC₁ populations. (A) WC-9f × OK014. (B) WC-9f × OK007. (C) WC2 × WCK3. (D) OK011 × KAG WC No.28. The x-axis indicates disease severity grade, and the y-axis indicates the number of BC₁ individuals. Disease severity grades 0-2 were classified as resistant, whereas grades 3-4 were classified as susceptible.
Figure 9.
Resistance segregation patterns in the BC₁ populations. (A) WC-9f × OK014. (B) WC-9f × OK007. (C) WC2 × WCK3. (D) OK011 × KAG WC No.28. The x-axis indicates disease severity grade, and the y-axis indicates the number of BC₁ individuals. Disease severity grades 0-2 were classified as resistant, whereas grades 3-4 were classified as susceptible.
Disclaimer/Publisher’s Note: The statements, opinions and data contained in all publications are solely those of the individual author(s) and contributor(s) and not of MDPI and/or the editor(s). MDPI and/or the editor(s) disclaim responsibility for any injury to people or property resulting from any ideas, methods, instructions or products referred to in the content. |
© 2026 by the authors. Licensee MDPI, Basel, Switzerland. This article is an open access article distributed under the terms and conditions of the Creative Commons Attribution (CC BY) license (http://creativecommons.org/licenses/by/4.0/).
Copyright: This open access article is published under a Creative Commons CC BY 4.0 license, which permit the free download, distribution, and reuse, provided that the author and preprint are cited in any reuse.