
Submitted:
09 July 2026
Posted:
10 July 2026
You are already at the latest version
Abstract
Medical ultrasound transducers require acoustic impedance matching layers to bridge the gap between piezoelectric ceramics (~30–38 MRayl) and biological tissue (~1.5–1.7 MRayl). Existing solutions—such as alumina–epoxy, anodic aluminum oxide–epoxy 1–3 composites, magnesium alloys, and gradient nanocomposites—rely on high-temperature curing, precision machining, or multi-step fabrication, which increase production costs and limit design flexibility. Viscoelastic suspensions offer a low-cost alternative, but lack process integration data. This work defines a Stage 1 pre-pilot (Technology Readiness Level 2–3) exploratory study to bound manufacturing protocols, rank formulations, and identify candidate parameters for future Quality by Design implementation. Six formulations were tested in open-cell polyurethane foam matrix: thick cornstarch–water (50:50 wt%), thin cornstarch–water (66:33 wt%), polystyrene sulfonate (50:50 wt%), polyethylene glycol–fumed silica (40:60 wt%), boric acid–simethicone, and a boric acid–cornstarch hybrid. Prototypes were 7 cm in diameter and 5 mm thick. An underwater transmission setup using a polyethylene bag fixture and consumer earbuds recorded sine tones at 50 Hz, 100 Hz, 1 kHz, 10 kHz, and 20 kHz (n = 2), and the relative insertion loss was compared against controls. At 50–1000 Hz, boric acid–simethicone exhibited the lowest attenuation (32 dB). At 10,000–20,000 Hz, polystyrene sulfonate and thin cornstarch showed the lowest attenuation (97 dB at 20 kHz). Attenuation increased with frequency; a dip between 100 and 1,000 Hz was attributed to fixture interference. No statistical analysis was performed owing to the small sample size (n = 2) and uncalibrated instrumentation. The results establish a descriptive baseline but do not demonstrate impedance matching or immediate clinical relevance; the 5 mm prototypes function as bulk composite samples rather than quarter-wavelength matching layers. Future work includes factorial or definitive screening designs, hydrophone calibration per international standards [21], Z = ρc measurements, substrate deconvolution, 0.5–1.0 mm layers for 650 kHz, phantom validation, and ISO 10993 biocompatibility screening.
Keywords:
exploratory process screening
; viscoelastic composites
; candidate process parameters
; impedance matching
; quality by design
; measurement system analysis
1. Introduction
Medical ultrasound transducer manufacturing is a high-precision segment of the medical device industry distinguished by stringent acoustic, electrical, and biocompatibility requirements. A persistent manufacturing challenge is the acoustic impedance mismatch between the piezoelectric ceramic element (e.g., PZT-5A, Z ≈ 30–38 MRayl) and biological tissue (Z ≈ 1.5–1.7 MRayl). Without an intervening matching layer, the intensity reflection coefficient R = [(Z₂ − Z₁)/(Z₂ + Z₁)]² produces substantial signal attenuation and degraded signal-to-noise ratio, directly impacting transducer yield and imaging performance.
The classical manufacturing specification for a single matching layer requires an acoustic impedance equal to the geometric mean of the two media (ZM ≈ 6.7 MRayl for PZT-to-tissue) and a thickness corresponding to one-quarter of the acoustic wavelength within the material [1,5,8]. Industrial production of these layers has historically relied on alumina–epoxy composites (Z ≈ 6.5–9.5 MRayl, c ≈ 2800–3900 m·s⁻¹) fabricated by high-pressure compression or centrifugation [9], anodic aluminum oxide–epoxy 1–3 composites (Z ≈ 9.5 MRayl) enabling 68% −6 dB bandwidth [10], and magnesium alloy layers (Z ≈ 10.3 MRayl) with exceptionally low attenuation (0.02 dB·mm⁻¹ at 7.5 MHz) [11]. However, these methods entail significant capital investments, multi-hour batch processing cycles, and precision machining steps that constrain throughput and design flexibility. Recent advances include anisotropic gradient-impedance layers (Z ≈ 8.2 to 3.2 MRayl), in which the tungsten-nanoparticle loading decreases exponentially across a 0.2 mm span to achieve > 170% bandwidth [12], and transparent SiO₂–epoxy composites (Z ≈ 7.5 MRayl, > 80% optical transparency) for dual-modal imaging [13]. These benchmarks underscore the exacting material and geometric tolerances that any new manufacturing process must satisfy.
From an industrial engineering perspective, viscoelastic suspensions and gels—including shear-thickening fluids and shear-stiffening gels—offer several theoretical manufacturing advantages: tunable rheology via particle loading and chemical composition, room-temperature processing, and compatibility with dip-coating or spin-coating deposition methods. Previous studies have established that polyurethane foams filled with shear-thickening fluids possess distinct acoustic properties. Li et al. demonstrated that a fumed-silica-based shear-thickening fluid increased the maximum acoustic absorption coefficient to 0.841 in rigid polyurethane foam composites [16], and Liu et al. showed that 3D-printed structures filled with silica-based and styrene/acrylate-based shear-thickening fluids exhibited improved sound transmission loss [17]. Nevertheless, these studies did not address the feasibility of manufacturing these viscoelastic suspensions into impedance matching layers that can operate at clinical ultrasound frequencies.
A critical process design constraint is that diagnostic ultrasound produces acoustic particle velocities on the order of mm·s⁻¹ to cm·s⁻¹, corresponding to strain rates far below the shear-thickening thresholds (generally 10²–10³ s⁻¹) observed in standard rheometric experiments. Consequently, under typical diagnostic acoustic intensities, these materials behave as ordinary viscoelastic suspensions; any acoustic benefit must therefore derive from equilibrium rheological properties rather than transient, strain-rate-induced phase changes. This characteristic has direct implications for manufacturing quality control: process specifications must target the equilibrium bulk modulus and longitudinal viscosity, not strain-rate-dependent phase transitions.
The present study is explicitly framed as a Stage 1 (pilot) exploratory scouting exercise within a Stage-Gate product development framework. Current industrial matching-layer manufacturing processes (e.g., alumina–epoxy compression molding, anodic aluminum oxide microfabrication, magnesium alloy machining) represent Technology Readiness Level (TRL) 9: fully characterized production processes with defined Critical Process Parameters (CPPs), validated Critical Quality Attributes (CQAs), and documented Measurement System Analysis (MSA). In contrast, viscoelastic fluid–foam composites reside at TRL 2–3: concept formulation and early proof-of-concept validation in a laboratory environment with unoptimized protocols and uncalibrated metrology. The objective of this work is not to demonstrate a manufacturing-capable process, but to bound the formulation design space, identify candidate process parameters, and assess the relative ranking of composite transmission as a precursor to future formal Quality by Design (QbD) studies. This distinction is essential: the results reported here are descriptive and rank-order only, intended to inform a subsequent formal Design of Experiments (DoE) rather than establish process capability or statistical control.
2. Materials and Methods
2.1. Process Design and Prototype Manufacturing
The manufacturing objective was to develop a reproducible protocol for impregnating viscoelastic fluids into open-cell polyurethane foam scaffolds and screen the resulting composites via acoustic transmission as a proxy for process quality. The target geometry for each prototype was a cylindrical disc 7 cm in diameter and 5 mm thick, selected to accommodate the mechanical constraints of the foam substrate and permit preliminary characterization of the bulk transmission properties. This thickness does not satisfy the quarter-wavelength condition for clinical ultrasound frequencies; for example, at 650 kHz, a quarter-wavelength layer in a material with c ≈ 1500 m·s⁻¹ requires an approximate thickness of 0.58 mm [5,8]. The prototypes are therefore best understood as bulk composite samples (foam core + viscoelastic fluid) rather than finished matching-layer components.
To ensure a reproducible baseline for Stage 1, a simplified flow diagram was established for the six-step process, as shown in Figure 1. The inputs and outputs of the Stage 1 exercise are shown in the Supplier-Input-Process-Output-Customer diagram in Table 1, and the Standard Operating Procedure is provided in Appendix A. Cycle time estimates were recorded for each fabrication step: mixing (5 min), soaking (10 min), drainage (2 min), bagging (1 min), yielding a cumulative manufacturing time of 18 min per prototype. Candidate process parameters annotated at each manufacturing step are summarized below; these parameters are identified for future formal CPP designation pending comprehensive Stage 2 characterization.
The uncontrolled status of the impregnation pressure, curing conditions, foam porosity, and drainage time constitutes a major source of common-cause variation, underscoring why this study is classified as an exploratory scouting exercise rather than a capable manufacturing proposal. Six experimental formulations were prepared for comparison, described as follows.
Thick Oobleck: 50:50 wt% cornstarch in de-ionized water, mixed until homogeneous. A foam disc was submerged for 10 min and stored in a polyethylene bag.
Thin Oobleck: 66:33 wt% de-ionized water to cornstarch, prepared identically.
Polystyrene Sulfonate: 50:50 wt% polystyrene sulfonate in de-ionized water; foam impregnated for 10 min.
Polyethylene Glycol–Fumed Silica: Polyethylene glycol 200 mixed with 60 wt% fumed silica particles, sonicated for 30 min, diluted with ethanol for foam impregnation, soaked for 10 min, and allowed to dry under ambient conditions for 24 h to evaporate residual ethanol before bagging.
Boric Acid–Simethicone Liquid: Boric acid (H₃BO₃) was dehydrated and mixed with simethicone (a poly(dimethylsiloxane)–silica mixture) at elevated temperature. Boric acid reacts with hydroxyl-terminated polydimethylsiloxanes to form Si–O–B linkages, producing polyborosiloxane networks [19,20]. The resulting viscoelastic liquid was used to impregnate foam for 10 min.
Boric Acid–Cornstarch Hybrid: The baseline boric acid–simethicone mixture was combined with cornstarch to confer additional particulate loading.
Three control conditions were included: an empty polyethylene bag (representing the open air path), a polyethylene bag containing an unimpregnated foam disc (foam-only control), and a dense cardboard disc sealed in a polyethylene bag (high-attenuation control).
2.2. Candidate Process Parameters for Future QbD Implementation
Consistent with industrial process development practice, candidate process parameters were recorded to inform future formal QbD implementation. Under International Council for Harmonisation Q8(R2) guidelines, formal QbD workflows require prior knowledge derived from feasibility studies before officially designating CQAs and CPPs. The present study serves as a precursor to that formal framework; it identifies candidate parameters whose variability must be managed in future iterations but does not designate them as “critical” because the relationships between process inputs and quality outputs remain uncharacterized. Table 2 lists the candidate process parameters and their bounding levels observed in this pilot study. These parameters are expected to influence acoustic transmission and layer uniformity, but their effect sizes and interactions are unknown.
Figure 2 presents an Ishikawa diagram, a candidate parameter–quality attribute cause-and-effect matrix illustrating the hypothesized relationships between process inputs and measurable properties. For example, particle loading (CPP-1) is hypothesized to influence acoustic impedance through the density–sound-speed relationship Z = ρc, while foam porosity (CPP-4) may affect thickness uniformity via capillary uptake variability. These hypotheses require empirical validation in Stage 2. Table 3 presents a preliminary qualitative Process Failure Mode and Effects Analysis for the impregnation protocol, identifying high-risk steps and recommended controls to inform Stage 2 protocol development.
2.3. Experimental Design and Statistical Considerations
The experimental design for this pilot study follows a one-factor-at-a-time screening logic in which the formulation (particle type and loading) is treated as the single varied factor, while all other process inputs are held constant at their current mean levels. This approach was selected because of resource constraints and the need to eliminate non-viable candidates before committing to a full factorial design. However, this design is fundamentally inefficient and does not capture factor interactions, which are likely present between particle loading and foam porosity. The small sample size (n = 2) and the use of an uncontrolled foam substrate introduce an unquantifiable risk of Type II error: a formulation with favorable intrinsic acoustic properties may appear poor owing to incomplete impregnation or localized void formation. Consequently, the rankings reported here are descriptive and subject to confirmation in Stage 2. No inferential statistical testing (e.g., ANOVA, t-tests), process capability analysis, or statistical process control charting was performed.
Given n = 2, the range between replicates provides only a qualitative indication of measurement repeatability and does not support hypothesis testing or the computation of meaningful confidence intervals. Accordingly, no error bars or standard deviations are reported; instead, the absolute range between the two replicates is noted in instances where it exceeds 3 dB.
To conduct a measurement, the tank was filled with de-ionized water, and the three-bag assembly was submerged and secured. The transmitter and receiver were aligned coaxially, separated by the composite bag while maintaining the 2.54 cm spacing. Pure sine tones were generated at 50 Hz, 100 Hz, 1,000 Hz, 10,000 Hz, and 20,000 Hz at maximum volume. Each tone was recorded in Audacity for 10 s, after which the software’s Frequency Analysis tool was used to extract the peak sound pressure level (dB) at the target frequency. Two independent recordings were obtained for each material–frequency combination to assess short-term measurement repeatability.
2.4. Comparative Ranking Apparatus and Measurement Limitations
The underwater transmission apparatus served as a comparative ranking tool rather than a calibrated metrology system. The setup consisted of a water-filled tank in which three polyethylene bags were clamped in series: an outer bag containing a sound-generation earbud (transmitter), a central bag holding the composite prototype, and an opposing outer bag containing a sound-reception earbud (receiver). The bags were separated by 2.54 cm (1 inch) to maintain a consistent acoustic path length. The receiver was connected to a laptop running Audacity audio recording software, while the transmitter was driven by an external tone generator producing pure sine waves. The transmitter and receiver earbuds were positioned inside their respective polyethylene bags to ensure stable water coupling, and the entire bag assembly was fully submerged in the water bath.
It must be explicitly stated that this apparatus employed audible-frequency sound (50 Hz–20 kHz) rather than clinical ultrasound frequencies (> 20 kHz), a limitation imposed by the available laboratory equipment. Furthermore, the apparatus employed consumer-grade earbuds as the transmitter and receiver. These devices were not calibrated as acoustic transducers; their frequency response, sensitivity, and directivity were not characterized against primary acoustic standards. The standardized characterization of ultrasonic fields requires calibrated hydrophones with a known free-field voltage sensitivity, typically verified by optical interferometry or three-transducer reciprocity [21,22]. The present apparatus does not meet these metrological requirements, and the results are therefore not traceable to absolute acoustic pressure, intensity, or power. From an industrial engineering perspective, this constitutes a measurement capability gap: the system exhibits unknown bias, linearity, and stability, precluding the computation of Gage Repeatability and Reproducibility (R&R) or process capability indices (Cp, Cpk). A formal MSA study would require bias, linearity, and stability studies against a calibrated reference standard (e.g., a NIST-traceable hydrophone), followed by a Gage R&R study yielding %Study Variation (%SV) and %Tolerance metrics [21,22]. None of these analyses were performed in this pilot study.
The polyethylene bag assembly introduces six additional water–polyethylene interfaces (two per bag) into the acoustic path. The characteristic acoustic impedance of low-density polyethylene is approximately 2.4 MRayl, yielding an intensity reflection coefficient of approximately 4% at each water–polyethylene boundary. While these reflections are modest at normal incidence, bag flexure and slight axial misalignment can introduce mode conversion and standing-wave artifacts that are not accounted for in the present analysis.
In viscoelastic suspensions and polymer networks, attenuation α follows a frequency power law, α ∝ fⁿ, where the exponent n depends on the dominant loss mechanism—such as viscous drag, thermal dissipation, scattering, or internal relaxation—and varies across frequency regimes. Johnson et al. measured attenuation at 4–8 MHz and found it increased from near-zero in brine to 12.0 ± 1.2 dB·cm⁻¹ at 5 MHz for a 40 wt% cornstarch concentration [26]; these values are orders of magnitude higher than any audio-frequency loss reported herein. Consequently, the audio-frequency results provide a relative ranking of composite transmission at low frequencies but cannot be extrapolated quantitatively to the MHz regime, where scattering and relaxation mechanisms differ in both magnitude and scaling behavior [24,25].
2.5. Signal Metric: Relative Insertion Loss (RIL)
To evaluate the relative effectiveness of each composite, the RIL was computed from the recorded power spectra using Equation (1):
where Preference is the power spectral density at the transmitted frequency f₀ measured through the water-only path with the empty three-bag polyethylene assembly in place, and Psample is the power spectral density at f₀ measured with the composite sample inserted in the central bag. Thus, the reference measurement includes bag attenuation and interface reflections, ensuring that relative differences are attributable to the composite insertion rather than the fixture alone. Higher RIL values indicate greater attenuation and poorer transmission performance.
RIL (dB) = 10 · log₁₀(Preference / Psample) (1)
Equation (1) assumes that the reference and sample measurements share identical systematic errors. This assumption may fail if the bag assembly is repositioned between measurements, if earbud frequency response drifts, or if standing-wave patterns shift because of temperature or water-level changes. Hence, the RIL values reported here serve as relative comparators among the tested composites under consistent but uncontrolled measurement conditions, not absolute measures of acoustic transmission efficiency. It is acknowledged that this metric differs from standard ultrasound transducer signal-to-noise ratio characterization, which typically employs calibrated hydrophones and time-domain signal power versus integrated noise power within the transducer’s −6 dB bandwidth.
2.6. Device Characteristics and Wavelength Analysis
The spacing between the transmitter, composite sample, and receiver was fixed at 2.54 cm to ensure path length consistency. The earbud microphones sampled at 48 kHz, permitting faithful recording up to the Nyquist frequency of 24 kHz. Consequently, the upper testing limit of 20 kHz was selected to avoid aliasing artifacts. The 5 mm prototype thickness corresponds to approximately 0.067λ at 20 kHz in water (λ ≈ 7.5 cm) and 0.00033λ at 50 Hz (λ ≈ 1500 cm). At the clinical target of 650 kHz, a quarter-wavelength matching layer in a material with c ≈ 1500 m·s⁻¹ would require a thickness of approximately 0.58 mm [5,8]. The 5 mm prototypes are therefore not quarter-wavelength layers at any tested or clinically relevant frequency; they function as bulk attenuating slabs rather than impedance matching elements. The non-monotonic attenuation behavior observed between 100 and 1,000 Hz likely reflects frequency-dependent transmission variations within the multi-layer bag–foam–fluid composite, not quarter-wavelength resonance. This hypothesis requires validation via transfer-matrix modeling [27], which was beyond the scope of this pilot study.
2.7. Process Limitations and Capability Summary
The following limitations explicitly constrain the interpretive scope of this exploratory study.
Uncalibrated Instrumentation. The consumer-grade earbuds employed as transmitter and receiver elements were not characterized for free-field voltage sensitivity, frequency response, or directivity patterns [21,22]. Without calibration to primary standards, the decibel values are not traceable to absolute acoustic pressure or intensity.
No Impedance or Wave Speed Data. Acoustic impedance (Z = ρc) was not measured because neither density (ρ) nor longitudinal sound speed (c) was determined for any formulation. Without these CQAs, quantitative assessment of the impedance matching or process capability is not possible.
Bulk Geometry, Not Quarter-Wavelength Matching. The 5 mm thickness places the prototypes in the multi-wavelength bulk-attenuation regime across all tested and clinically relevant frequencies. The Krimholtz–Leedom–Matthaei transmission-line model demonstrates that a matching layer must satisfy both the impedance condition (ZM = √(Z_PZT · Ztissue)) and the quarter-wave thickness condition (d = λ/4) to achieve broadband energy transfer [5,8]. The present geometry satisfies neither condition.
Foam Substrate Confounding. The open-cell polyurethane foam scaffold is not acoustically transparent. Polyurethane foams exhibit substantial flow resistivity and sound absorption coefficients that vary with frequency and core density. Because the fluid is impregnated directly into the foam, the measured signal reflects the combined system (foam core + fluid phase + bag interfaces + diffraction paths), and the intrinsic fluid properties are inaccessible without a deconvolution or transfer-matrix analysis [27].
Insufficient Sample Size for Statistical Process Control. With n = 2 recordings per condition, inferential statistics, Gage R&R studies, and process capability indices are precluded. The results are presented strictly as descriptive rankings, and no confidence intervals or hypothesis tests are reported.
3. Results
Acoustic transmission data were collected for three controls and six prototypes across five discrete frequencies. All controls and prototypes exhibited a general trend of increasing RIL with increasing frequency, consistent with viscous attenuation mechanisms typical of dense suspensions and polymer networks. A notable deviation occurred between 100 and 1,000 Hz, where insertion loss transiently decreased relative to the 50 Hz baseline before rising again at higher frequencies. This non-monotonic behavior is attributed to frequency-dependent transmission variations within the multi-layer bag–foam–fluid composite, which functions as a deeply sub-wavelength structure at these frequencies rather than inducing resonant quarter-wavelength absorption.
At 50 Hz, all prototypes exhibited similar acoustic shielding performance, with RIL values clustering near 50 dB. In the 100–1,000 Hz range, the boric acid–simethicone liquid exhibited the lowest RIL (32 dB), closely followed by thin oobleck and commercial ultrasound gel. Conversely, the thick cornstarch–water suspension and the cardboard control showed higher RIL values in this range (64 dB), suggesting that elevated particle loadings in dense cornstarch suspensions increase viscous dissipation at lower frequencies. At 10,000 Hz, the boric acid–simethicone liquid again demonstrated the lowest RIL, followed by polystyrene sulfonate. At 20,000 Hz, polystyrene sulfonate and thin oobleck showed less high-frequency screening than the other candidate materials, both recording an RIL of 97 dB, whereas the boric acid liquid exhibited the highest RIL at this frequency. These results suggest a frequency-dependent performance ranking for bulk composite transmission: low-viscosity, low-particle-density fluids (e.g., boric acid–simethicone) minimize low-frequency viscous losses, whereas moderate-concentration suspensions (e.g., thin oobleck, polystyrene sulfonate) provide relatively lower high-frequency insertion loss through the foam composite structure, possibly owing to their intermediate bulk moduli and improved mechanical coupling with the aqueous medium. These interpretations remain speculative because the intrinsic sound speeds and mechanical moduli of the fluids were not measured.
Values in Table 4 represent individual observations, considering the small sample size (n = 2), which hindered the ability to calculate central tendency or dispersion statistics. The absolute ranges between replicates were ≤ 3 dB for all entries except the boric acid–simethicone formulation at 20,000 Hz (range = 6 dB) and the cardboard control at 20,000 Hz (range = 4 dB). Standard deviations or confidence intervals are omitted because n = 2 is insufficient for robust variance estimation.
4. Discussion
4.1. Stage-Gate Assessment and Technology Readiness Level
This study occupies TRL 2–3 within a Stage-Gate product development framework. At TRL 2, technology concepts are formulated, and at TRL 3, analytical and early experimental proof-of-concept validation is established in a laboratory environment. The present work demonstrates that viscoelastic fluids can be impregnated into open-cell foam scaffolds and that the resulting composites exhibit measurable, formulation-dependent acoustic transmission differences at audio frequencies. However, the manufacturing protocol lacks the precise process control, comprehensive material characterization, and metrological traceability required for TRL 4 (bench-scale component validation) or TRL 5–6 (relevant environment validation). Thus, no design history file, regulatory strategy, or component specification has been initiated at this stage.
4.2. Future DoE and Pre-QbD Roadmap
Under a future QbD framework, the primary manufacturing objective will be to establish a formalized design space—defined as a multidimensional region of CPPs within which the process can safely operate while assuring CQA conformity. This pilot study identifies particle loading as a candidate parameter for acoustic transmission, but its interaction with foam porosity and impregnation pressure remains uncharacterized. The thick oobleck formulation (50:50) showed higher RIL than the thin oobleck formulation (66:33), suggesting a concentration-dependent attenuation trend that aligns with the findings reported by Johnson et al. [26]; however, because the void-filling efficiency of the foam varies with fluid viscosity, the observed screening performance may be confounded by incomplete impregnation rather than driven solely by intrinsic fluid attenuation.
Future Stage 2 work must map the design space using a structured DoE strategy. A 12-run Plackett–Burman design is proposed to screen the five candidate parameters detailed in Table 2, alongside two noise factors (i.e., batch-to-batch cornstarch moisture content, foam supplier lot), to elucidate their main effects on RIL at 650 kHz. Assuming σ ≈ 3 dB from pilot repeatability and a minimum detectable effect Δ = 5 dB, a power analysis (α = 0.05, β = 0.10) indicates that 12 runs with two center points are sufficient for screening. Significant factors identified during this screening phase will subsequently advance to a face-centered Central Composite Design or Definitive Screening Design to resolve curvature and two-factor interactions, yielding a predictive response surface model for the design space. This sequential strategy aligns with standard industrial practices for moving from exploratory screening to formal process characterization. Process capability can only be meaningfully assessed after establishing a design space with quantified factor effects.
4.3. Measurement System Limitations and Future MSA Protocol
From an industrial quality engineering perspective, the most significant limitation of this study is the lack of a calibrated measurement system. The consumer-grade earbuds employed as transmitter and receiver elements represent an uncalibrated comparator with unknown bias, linearity, and repeatability. A standardized MSA for acoustic transducer production requires calibrated hydrophones traceable to primary standards via optical interferometry or three-transducer reciprocity [21,22]. Future Stage 2 MSA must satisfy the following multi-step protocol.
Bias and linearity: The consumer-grade earbud receiver will be systematically evaluated against a calibrated reference hydrophone (compliant with IEC 62127-1) across the 50 Hz–20 kHz band and at the clinical frequency of 650 kHz [21,22].
Gage R&R: A crossed Gage study with three operators, ten prototype parts, and three replicates per part will be conducted to quantify %SV (ideal, < 10%; marginally acceptable, < 30%) and the number of distinct categories (ndc, must be ≥ 5).
Stability: An X̄-R control chart will be tracked for the water-only reference path at the beginning and termination of each test day to detect transmitter drift or environmental temperature shifts.
Uncertainty propagation: Because the signal metric is calculated as RIL = 10·log₁₀(Pref/Psample), the combined standard uncertainty u(RIL) will be derived from the variances of the reference and sample power spectra.
Without establishing a capable measurement system (%SV < 10%, ndc ≥ 5), no specification limits, control charts, or process capability indices (Cp, Cpk) can be computed.
4.4. Composite System Ranking and Attenuation Mechanisms
The observed frequency-dependent transmission profiles reflect the macroscale performance of the coupled fluid–foam–bag composite system rather than the intrinsic fluid behavior alone. In dense particulate suspensions, such as cornstarch–water mixtures, acoustic attenuation arises from viscous dissipation at the particle–fluid boundary, wave scattering from impedance heterogeneities, and internal relaxation within the starch granules. Johnson et al. demonstrated that cornstarch suspensions exhibit attenuation coefficients increasing from near-zero in pure brine to 12.0 ± 1.2 dB·cm⁻¹ at 5 MHz for 40 wt% cornstarch [26]. The present finding that thick oobleck (50:50 wt%) showed higher RIL than thin oobleck (66:33 wt%) aligns with this concentration-dependent attenuation trend: higher particle loadings may increase viscous drag and scattering losses, particularly at higher frequencies. However, because the fluid-impregnated foam core represents the dominant acoustic path, the observed differences are amplified or attenuated by the foam–fluid interactions and cannot be attributed solely to the fluid formulations.
The comparatively low RIL recorded for the boric acid–simethicone liquid at lower frequencies likely reflects its lower particulate content and lower static viscosity, which minimize viscous absorption within the composite. Conversely, its relatively high RIL response at higher frequencies suggests that the material lacks the structural rigidity needed to propagate high-frequency compressional waves efficiently—a phenomenon analogous to the low bulk modulus of silicone-based materials. In contrast, polystyrene sulfonate and thin oobleck, which contain moderate solid-phase fractions, may achieve higher effective bulk moduli within the foam scaffold, potentially improving their high-frequency transmission through the composite. These underlying material interpretations remain speculative because the intrinsic sound speeds and moduli of the fluids were not measured.
The non-monotonic attenuation dip observed between 100 and 1,000 Hz is best explained by frequency-dependent transmission variations within the multi-layer bag–foam–fluid composite. At these frequencies, the 5 mm composite thickness represents a small proportion of the acoustic wavelength in water (λ ≈ 15 cm at 1,000 Hz), but the multi-layered structure (polyethylene bag, open-cell foam, fluid, foam, bag) creates partial reflections at each interface. Constructive and destructive interference among these partial reflections can produce frequency-dependent transmission maxima and minima independent of the quarter-wavelength resonance. This phenomenon is well documented in multi-layer acoustic structures [27] and underscores why the present geometry cannot be interpreted as a functional impedance matching layer. Alternative explanations involving structural resonances of the foam skeleton or viscoelastic relaxation of the polymer matrix are possible but require experimental validation.
4.5. Poroelastic Context and Foam Substrate Confounding
The fluid–foam system represents a poroelastic composite in which a viscoelastic fluid saturates the pores of an elastic skeletal frame. Biot established the governing equations for wave propagation in such media, demonstrating that two compressional waves propagate simultaneously: a fast wave dominated by the frame modulus and a slow wave dominated by the fluid bulk modulus, with the latter being highly attenuated owing to pore-scale viscous drag forces [28,29]. In the rigid-frame limit applicable to stiff polyurethane foams, the Johnson–Champoux–Allard equivalent-fluid model simplifies the problem to a single wave type characterized by five non-acoustic parameters: open porosity (φ), static airflow resistivity (σ), high-frequency tortuosity (α∞), viscous characteristic length (Λ), and thermal characteristic length (Λ′) [30,31]. Alba et al. have successfully applied this model with transfer-matrix methods to predict the acoustic response and sound absorption metrics of rebonded polyurethane foams [33,34,35,36].
The present study did not measure any of these five parameters for either the bare foam substrate or the fluid-impregnated composites. Consequently, the observed differences between formulations cannot be deconvolved into intrinsic fluid properties and foam-mediated effects. For example, a high-viscosity fluid that fills interstitial voids more completely will increase the effective density and reduce porosity, thereby altering the baseline parameters and changing the composite’s absorption coefficient in a manner that may mimic improved “transmission” in the present apparatus. Future optimization studies should measure the non-acoustic parameters of the bare foam and the impregnated composites via impedance-tube methods (ISO 10534-2) to enable predictive transfer-matrix modeling of the multi-layer transmission path and facilitate systematic isolation of the fluid-phase contribution [33].
4.6. Frequency Regime and Clinical Translation: Reality Check
The audio-frequency results reported here provide a relative ranking of composite performance but cannot be extrapolated quantitatively to the MHz regime. The frequency exponent (n) in the baseline attenuation power law (α ∝ fⁿ) differs between the audio and MHz regimes because the dominant loss mechanisms change [24,25]. In viscoelastic materials, multiple relaxation functions over a wide range of characteristic times govern the frequency dependence, requiring fractional-derivative models to capture the transition between regimes. At audio frequencies, because cornstarch granules (~10–20 μm diameter) are deeply sub-wavelength (ka ≪ 1) relative to the acoustic wave, scattering is negligible and viscous dissipation dominates. At MHz frequencies, the granule size becomes comparable to the wavelength, and scattering contributes significantly to attenuation.
Furthermore, the 5 mm prototype thickness places the composites in the multi-wavelength bulk-attenuation regime across all tested and clinically relevant frequencies. Therefore, the prototypes do not represent viable candidate matching layers in their current form. Direct characterization at clinical ultrasound frequencies (≥ 650 kHz) is essential before making any assessment of their matching-layer suitability. Such characterization requires calibrated piezoelectric transducers, specialized hydrophones, and acoustic tissue-mimicking phantoms.
4.7. Comparison with Industrial Benchmarks
Table 5 contextualizes the present composites against established and emerging matching-layer materials from a manufacturing and value-engineering perspective. Conventional alumina–epoxy composites fabricated by high-pressure compression or centrifugation achieve acoustic impedances of 6.5–9.5 MRayl with longitudinal velocities of 2800–3900 m·s⁻¹ and attenuation as low as 1.26 dB·mm⁻¹ at 40 MHz [9]. Anodic aluminum oxide–epoxy 1–3 composites demonstrate impedances of ~9.5 MRayl, enabling PZT-5A transducers to achieve −6 dB bandwidths of 68% and two-way insertion losses of −22.7 dB at 11.6 MHz [10]. Magnesium alloy matching layers achieve 10.3 MRayl with exceptionally low attenuation (0.02 dB·mm⁻¹ at 7.5 MHz) and have enabled PZT-5H transducers to reach 79% bandwidth at 5 MHz [11]. These materials satisfy the quarter-wavelength condition precisely and possess fully characterized, stable acoustic properties (i.e., density, longitudinal sound speed, acoustic impedance, and volumetric attenuation).
Modern advances have further extended matching-layer performance beyond classical single-layer designs. Zhu et al. demonstrated an anisotropic gradient-impedance matching layer in which the tungsten-nanoparticle loading in epoxy decreases exponentially along the thickness direction, achieving a continuous impedance transition from 8.2 to 3.2 MRayl across 0.2 mm [12]. When paired with PMN-PT single crystals, this gradient layer produced −6 dB bandwidths exceeding 170%, with an insertion loss of only −20.3 dB. Cho et al. developed a transparent SiO₂–epoxy composite matching layer with an acoustic impedance of 7.5 MRayl and a backing impedance of 4–6 MRayl, yielding a 63% bandwidth at a single resonance frequency with > 80% optical transparency—critical for dual-modal ultrasound and photoacoustic imaging [13]. Similarly, Li et al. fabricated a cone-structured acoustic metamaterial matching layer from etched silica optical fibers embedded in epoxy, providing a broadband transmission window that yielded > 100% −6 dB bandwidth by eliminating the sharp spectral dips inherent to quarter-wave resonance [14].
These state-of-the-art solutions underscore the acoustic and geometric precision required for functional matching layers: tunable impedance, sub-millimeter thickness control, minimal attenuation, and a predictable frequency response. The performance of the viscoelastic fluid–foam composites tested in this study remains far from these industrial benchmarks. The foam substrate alone exhibits substantial flow resistivity and sound absorption that would dominate any clinical-frequency measurement and likely render the unoptimized composite unusable as a matching layer. Moreover, without measured impedance values, it is impossible to determine whether the fluid formulations can be engineered to approach the 6.7 MRayl target for PZT-to-tissue matching [1,5]. The present study therefore does not demonstrate that viscoelastic suspensions are immediately viable for matching-layer materials; it establishes a descriptive ranking of bulk audio-frequency transmission that may, with additional material characterization, guide future formulation development.
4.8. Regulatory, Scale-Up, and Lean Manufacturing
Regulatory and Quality Management Systems. Before any viscoelastic matching layer can transition from prototype to patient-contact medical device, regulatory compliance must be addressed. Biocompatibility testing under ISO 10993 standards is mandatory for all materials intended for human contact [35]. The formulations evaluated herein—including cornstarch, polystyrene sulfonate, boric acid, and simethicone—would require rigorous cytotoxicity, sensitization, and irritation testing to satisfy the “Big Three” biocompatibility endpoints [35]. Transitioning to a patient-contact medical device also requires compliance with ISO 13485:2016 and ISO 14971:2019. A Design History File must be compiled and maintained, containing the process validation protocol, installation qualification, operational qualification, and performance qualification data for the core coating process. Figure 3 presents the proposed document hierarchy: Process Flow Diagram → Process Failure Mode and Effects Analysis → Control Plan → Standard Operating Procedure → Batch Manufacturing Record. This structure ensures traceability from patient-risk analysis to shop-floor execution and satisfies regulatory audit requirements.
Process Scale-Up and Lean Manufacturing. From a lean manufacturing perspective, the current manual impregnation process (requiring a 10 min soak inside sealed polyethylene bags) is unsuitable for high-volume transducer production; automated dip-coating, spin-coating, or micro-extrusion methods would be necessary for scale-up. For mixing, the laboratory-scale spatula and sonicator approach must be replaced by a high-shear batch mixer or inline rotor-stator; power draw scales with mixer geometry and speed, necessitating geometric similarity and Reynolds-number matching to maintain dispersion quality. For coating, a weighted decision matrix was constructed: dip-coating offers low capital investment and batch flexibility but poor thickness control, spin-coating achieves superior uniformity for flat substrates but requires dedicated chucks, and micro-extrusion enables continuous processing but demands the highest capital outlay. Based on the target thickness specification of 0.5–1.0 mm, spin-coating or precision micro-extrusion is recommended for Stage 3.
Although the raw material costs for cornstarch and polystyrene sulfonate suspensions are lower than those for alumina or magnesium alloy feedstocks, this economic advantage is currently offset by the lack of process control and the need for extensive downstream characterization. Reproducible, scalable protocols must be developed for manufacturing viscoelastic suspensions with consistent properties. Many of the formulations prepared in this study failed to exhibit robust shear thickening, likely owing to insufficient particle loading, inadequate dispersion, or particle aggregation during hydration. High-shear mixing and a controlled particle size distribution (D10, D50, and D90 verified per ASTM B822 or an equivalent light-scattering standard) may be necessary to improve batch-to-batch consistency.
4.9. Future Work
Several critical validation milestones must be achieved before a formal assessment of the manufacturing feasibility can be conducted.
First, future research must adopt a formal QbD framework and execute the structured DoE outlined in Section 4.2—beginning with a Definitive Screening Design or Plackett–Burman design to identify active CPPs, followed by a Response Surface Methodology stage to optimize factor levels. Process capability can only be examined after establishing a design space with quantified factor effects.
Second, a comprehensive MSA must be completed following the criteria established in Section 4.3. This includes Gage R&R, bias, linearity, and stability studies using hydrophones calibrated to IEC 62127-1 or NIST-traceable standards [21,22]. Without a capable measurement system providing %SV < 10% and ndc ≥ 5, no process capability indices (Cp, Cpk) can be computed, and no specification limits can be established.
Third, the intrinsic acoustic properties of each fluid formulation must be empirically determined. This includes measuring the bulk density (ρ) via the Archimedes principle, longitudinal sound speed (c) via time-of-flight or pulse-echo methods, and the resulting acoustic impedance via Z = ρc. The acoustic impedance must be tuned toward the theoretical optimum of ~6.7 MRayl for PZT-to-tissue interfaces, or toward the multi-layer values prescribed by the Krimholtz–Leedom–Matthaei transmission-line model [5,8]. Moreover, the shear wave speed should be measured because the viscoelastic nature of these dense suspensions dictates that shear properties influence the effective longitudinal behavior in bounded media.
Fourth, direct characterization at clinical ultrasound frequencies (≥ 650 kHz) is essential. The audio-frequency results reported here provide a relative ranking of composite performance but cannot be extrapolated to the MHz regime, where attenuation follows a fundamentally different power-law scaling behavior [24,25,26]. Pulse-echo characterization using a calibrated hydrophone and a tissue-mimicking phantom is needed to extract the true insertion loss, −6 dB bandwidth, and pulse duration metrics required for transducer engineering. Crucially, the foam substrate must either be eliminated or its acoustic contribution deconvolved via transfer-matrix modeling to isolate the true fluid-phase properties [27].
Fifth, the matching layer thickness must be optimized to satisfy the quarter-wavelength condition at the target operating frequency. For a 650 kHz transducer, this implies layer thicknesses of 0.5–1.0 mm, depending on the longitudinal wave velocity of the final fluid formulation. Microfabrication techniques, such as spin-coating or dip-coating, may be necessary to achieve uniform, sub-millimeter layers on curved transducer faces, especially considering that the present 5 mm prototypes are unsuitable for quarter-wavelength matching at any clinically relevant frequency [5,8].
Sixth, the viscoelastic hypothesis must be framed correctly for manufacturing process design. Diagnostic ultrasound produces acoustic particle velocities on the order of mm·s⁻¹ to cm·s⁻¹, corresponding to strain rates far below the shear-thickening thresholds (10²–10³ s⁻¹) generally observed in rheometric experiments. Therefore, shear-thickening transitions are unlikely to activate under typical diagnostic acoustic intensities. Any impedance matching benefit must derive from the equilibrium viscoelastic properties of the suspension—specifically, its equilibrium bulk modulus and longitudinal viscosity—which can be tuned via particle loading, matrix chemistry, and crosslink density. Future work should characterize these equilibrium properties rather than invoking strain-rate-dependent phase transitions.
Seventh, the poroelastic nature of the foam–fluid composite must be quantified for process control. The Johnson–Champoux–Allard parameters (i.e., porosity, flow resistivity, tortuosity, and viscous and thermal characteristic lengths) should be measured for both bare and impregnated foams using impedance-tube methods (ISO 10534-2) [33]. Transfer-matrix modeling or finite-element simulation (COMSOL Multiphysics with the Poroelastic Waves or Pressure Acoustics modules) should then be employed to predict the composite transmission and isolate the intrinsic fluid contribution from the foam-mediated path [27].
Eighth, reproducible, scalable protocols for synthesizing viscoelastic suspensions with consistent properties must be developed. Many of the formulations prepared in this study failed to exhibit robust shear thickening, likely because of insufficient particle loading, inadequate dispersion, or particle aggregation during hydration. High-shear mixing and controlled particle size distribution should improve batch consistency. Once reproducible formulations are achieved, biocompatibility testing under ISO 10993 standards is mandatory before any patient-contact application [35].
In summary, viscoelastic suspensions and gels represent a nascent and theoretically interesting class of raw materials for acoustic applications in medical ultrasound transducer manufacturing. The present pilot study establishes only that certain formulations (boric acid–simethicone liquid at low frequencies, and polystyrene sulfonate and thin cornstarch suspensions at high frequencies) transmit audio-frequency sound through a porous foam composite with relatively lower insertion loss than the evaluated alternatives. These findings do not demonstrate impedance matching, do not validate shear-thickening activation under acoustic excitation, and cannot be extrapolated to clinical ultrasound frequencies. With further refinement in formulation, direct measurement of the intrinsic acoustic impedance and sound speed, precise fabrication of quarter-wavelength layers, high-frequency validation using calibrated instrumentation, the application of poroelastic deconvolution models, and formal biocompatibility testing, viscoelastic materials may eventually contribute to the next generation of high-fidelity ultrasound imaging and neuromodulation devices. Until these development milestones are completed, the manufacturing feasibility of viscoelastic fluid-based matching layers remains entirely speculative.
5. Conclusions
This study provides a descriptive, pre-pilot characterization of audio-frequency acoustic transmission through viscoelastic fluid–foam composites. The experimental findings establish a material-dependent ranking of bulk composite transmission across the 50 Hz–20 kHz band: low-viscosity fluids (e.g., boric acid–simethicone) showed lower RIL at lower frequencies, whereas moderate-concentration suspensions (e.g., polystyrene sulfonate, thin cornstarch) exhibited lower RIL at higher frequencies. However, these baseline results do not demonstrate functional impedance matching, do not isolate intrinsic fluid properties from the foam substrate, and do not extrapolate to clinical ultrasound frequencies. This study is classified at TRL 2–3, characterized by uncalibrated metrology, uncontrolled process parameters, and an insufficient sample size for statistical inference. Formal DoE mapping, calibrated metrology, intrinsic property measurement, quarter-wavelength layer fabrication, high-frequency validation, and biocompatibility screening are required before the manufacturing feasibility of viscoelastic fluid-based matching layers can be determined.
Supplementary Materials
The data and supporting materials are available at this URL: Preprints.org [accessed 28 June 2026].
Author Contributions
Conceptualization, J.L.; methodology, E.S. and J.L.; software, J.L.; validation, J.L.; formal analysis, J.L.; investigation, J.L.; resources, J.L.; data curation, J.L.; writing—original draft preparation, E.S. and J.L.; writing—review and editing, J.L.; visualization, J.L.; supervision, J.L.; project administration, J.L.; funding acquisition, J.L. All authors have read and agreed to the published version of the manuscript.
Funding
This research received no external funding.
Data Availability Statement
The data and supporting materials are available at this URL: https://github.com/javeharron/crashPadData [accessed 28 June 2026].
Acknowledgments
The authors would like to thank The Ohio State University for their assistance.
Conflicts of Interest
The authors declare no conflicts of interest.
References
- Rathod, V.T. A review of acoustic impedance matching techniques for piezoelectric sensors and transducers. Sensors 2020, 20, 4051. [Google Scholar] [CrossRef]
- Manwar, R.; et al. Couplants in acoustic biosensing systems. Chemosensors 2022, 10, 181. [Google Scholar] [CrossRef] [PubMed]
- Altun, B.; Demirkan, I.; Ozturk Isik, E.; Kocaturk, O.; Unlu, M.B.; Garipcan, B. Acoustic impedance measurement of tissue mimicking materials by using scanning acoustic microscopy. Ultrasonics 2021, 110, 106274. [Google Scholar] [CrossRef] [PubMed]
- Hurrell, A.M.; et al. An overview of acoustic impedance measurement techniques and future prospects. Acoustics 2021, 3, 300–323. [Google Scholar] [CrossRef]
- Oakley, C.G. Calculation of ultrasonic transducer signal-to-noise ratios using the KLM model. IEEE Trans. Ultrason. Ferroelectr. Freq. Control 1997, 44, 1018–1026. [Google Scholar] [CrossRef]
- Goll, J.H.; Auld, B.A. Multilayer impedance matching schemes for broadbanding of water loaded piezoelectric transducers and high Q electric resonators. IEEE Trans. Sonics Ultrason. 1975, 22, 52–53. [Google Scholar] [CrossRef]
- Desilets, C.S.; Fraser, J.D.; Kino, G.S. The design of efficient broadband piezoelectric transducers. IEEE Trans. Sonics Ultrason. 1978, 25, 115–125. [Google Scholar] [CrossRef]
- Krimholtz, R.; Leedom, D.A.; Matthaei, G.L. New equivalent circuits for elementary piezoelectric transducers. Electron. Lett. 1970, 6, 398–399. [Google Scholar] [CrossRef]
- Wong, C.M.; et al. Tunable high acoustic impedance alumina epoxy matching layer for high frequency ultrasound transducer. Sens. Actuators A Phys. 2017, 263, 656–663. [Google Scholar] [CrossRef]
- Dai, J.Y.; et al. Anodic aluminum oxide-epoxy composite acoustic matching layer for ultrasonic transducer application. Sens. Actuators A Phys. 2016, 242, 130–136. [Google Scholar] [CrossRef]
- Wang, Y.; Tao, J.; Guo, F.; Li, S.; Huang, X.; Dong, J.; Cao, W. Magnesium alloy matching layer for high-performance transducer applications. Sensors 2018, 18, 4424. [Google Scholar] [CrossRef] [PubMed]
- Zhu, K.; Ma, J.; Qi, X.; Shen, B.; Liu, Y.; Sun, E.; Zhang, R. Enhancement of ultrasonic transducer bandwidth by acoustic impedance gradient matching layer. Sensors 2022, 22, 8025. [Google Scholar] [CrossRef] [PubMed]
- Cho, S.; Kim, M.; Ahn, J.; Kim, Y.; Lim, J.; Park, J.; Kim, H.H.; Kim, W.J.; Kim, C. An ultrasensitive and broadband transparent ultrasound transducer for ultrasound and photoacoustic imaging in-vivo. Nat. Commun. 2024, 15, 2147. [Google Scholar] [CrossRef] [PubMed]
- Li, Z.; Yang, D.Q.; Liu, S.L.; Yu, S.Y.; Lu, M.H.; Zhu, J.E.; Zhang, S.T.; Zhu, M.W.; Guo, X.S.; Wu, H.D.; Wang, X.L. Broadband gradient impedance matching using an acoustic metamaterial for ultrasonic transducers. Sci. Rep. 2017, 7, 42863. [Google Scholar] [CrossRef] [PubMed]
- Zhao, C.; Gong, X.; Wang, S.; Jiang, W.; Xuan, S. Shear stiffening gels for intelligent anti-impact applications. Cell Rep. Phys. Sci. 2020, 1, 100266. [Google Scholar] [CrossRef]
- Li, H.; Chen, Y.; Zhang, D. Mechanical, acoustic, and thermal performances of shear thickening fluid filled rigid polyurethane foam composites. J. Appl. Polym. Sci. 2019, 136, 47546. [Google Scholar] [CrossRef]
- Liu, Y.; et al. Acoustic properties and impact behavior of 3D printed structures filled with shear thickening fluid. Smart Mater. Struct. 2022, 31, 045019. [Google Scholar] [CrossRef]
- Xie, Y.; et al. Dynamic mechanical characteristics of starch-based shear thickening fluids at high strain rates. Mater. Des. 2025, 252, 113314. [Google Scholar] [CrossRef]
- Wang, W.; Xu, D.; Wang, Z. Synthesis of structure-controlled polyborosiloxanes and investigation on their viscoelastic response to molecular mass of polydimethylsiloxane triggered by both chemical and physical interactions. Ind. Eng. Chem. Res. 2016, 55, 12647–12655. [Google Scholar] [CrossRef]
- Zepeda-Velazquez, L.; Macphail, B.; Brook, M.A. Spread and set silicone–boronic acid elastomers. Polym. Chem. 2016, 7, 4458–4466. [Google Scholar] [CrossRef]
- Robinson, S.P.; et al. An international key comparison of free-field hydrophone calibrations in the frequency range 1 to 500 kHz. J. Acoust. Soc. Am. 2006, 120, 1366–1373. [Google Scholar] [CrossRef]
- Hurrell, A.M. The practicalities of obtaining and using hydrophone calibration data to derive pressure waveforms. IEEE Trans. Ultrason. Ferroelectr. Freq. Control 2017, 64, 126–137. [Google Scholar] [CrossRef] [PubMed]
- Shaw, A. Calibration and measurement issues for therapeutic ultrasound. Ultrasonics 2008, 48, 234–252. [Google Scholar] [CrossRef] [PubMed]
- Parker, K.J.; et al. Power laws prevail in ultrasound-tissue interactions. Phys. Med. Biol. 2022, 67, 115003. [Google Scholar] [CrossRef]
- Waters, K.R.; Hughes, M.S.; Mobley, J.; Brandenburger, G.H.; Miller, J.G. On the applicability of Kramers–Krönig relations for ultrasonic attenuation obeying a frequency power law. J. Acoust. Soc. Am. 2000, 108, 556–563. [Google Scholar] [CrossRef] [PubMed]
- Johnson, B.L.; Holland, M.R.; Miller, J.G.; Katz, J.I. Ultrasonic attenuation and speed of sound of cornstarch suspensions. J. Acoust. Soc. Am. 2013, 133, 3219–3226. [Google Scholar] [CrossRef] [PubMed]
- Adler, L. Matrix methods applied to acoustic waves in multilayered media. J. Acoust. Soc. Am. 1990, 87, 1376–1380. [Google Scholar] [CrossRef]
- Biot, M.A. Theory of propagation of elastic waves in a fluid-saturated porous solid. I. Low-frequency range. J. Acoust. Soc. Am. 1956, 28, 168–178. [Google Scholar] [CrossRef]
- Biot, M.A. Theory of propagation of elastic waves in a fluid-saturated porous solid. II. Higher frequency range. J. Acoust. Soc. Am. 1956, 28, 179–191. [Google Scholar] [CrossRef]
- Johnson, D.L.; Koplik, J.; Dashen, R. Theory of dynamic permeability and tortuosity in fluid-saturated porous media. J. Fluid Mech. 1987, 176, 379–402. [Google Scholar] [CrossRef]
- Champoux, Y.; Allard, J.F. Dynamic tortuosity and bulk modulus in air-saturated porous media. J. Appl. Phys. 1991, 70, 1975–1979. [Google Scholar] [CrossRef]
- Allard, J.F.; Champoux, Y. New empirical equations for sound propagation in rigid frame fibrous materials. J. Acoust. Soc. Am. 1992, 91, 3346–3353. [Google Scholar] [CrossRef]
- Alba, J.; Piscoya, R.A.; Vélez, F. Experimental and numerical investigation of sound absorption characteristics of rebonded polyurethane foam. Appl. Sci. 2022, 12, 12936. [Google Scholar] [CrossRef]
- Krishnappa, G.; Levy, G.G.; Mavilay, G.A. NAE Report LTR-AL-32; Sound absorption tests on polyurethane and liquid soap foams for anechoic enclosures. National Aeronautical Establishment: Ottawa, ON, Canada, 1968.
- Kandarova, H.; Letasiova, S. The 'Big Three' in biocompatibility testing of medical devices. Front. Bioeng. Biotechnol. 2024, 12, 1350031. [Google Scholar] [CrossRef]
- Leedom, D.A.; Krimholtz, R.; Matthaei, G.L. Equivalent circuits for transducers having arbitrary even- or odd-symmetry piezoelectric excitation. IEEE Trans. Sonics Ultrason. 1971, 18, 128–141. [Google Scholar] [CrossRef]
Figure 1.
Simplified flow diagram for the six-step process: (1) raw-material weighing and mixing under ambient conditions; (2) degassing (if applicable); (3) foam scaffold impregnation via static soaking; (4) excess fluid drainage; (5) prototype bagging; and (6) acoustic testing.
Figure 1.
Simplified flow diagram for the six-step process: (1) raw-material weighing and mixing under ambient conditions; (2) degassing (if applicable); (3) foam scaffold impregnation via static soaking; (4) excess fluid drainage; (5) prototype bagging; and (6) acoustic testing.
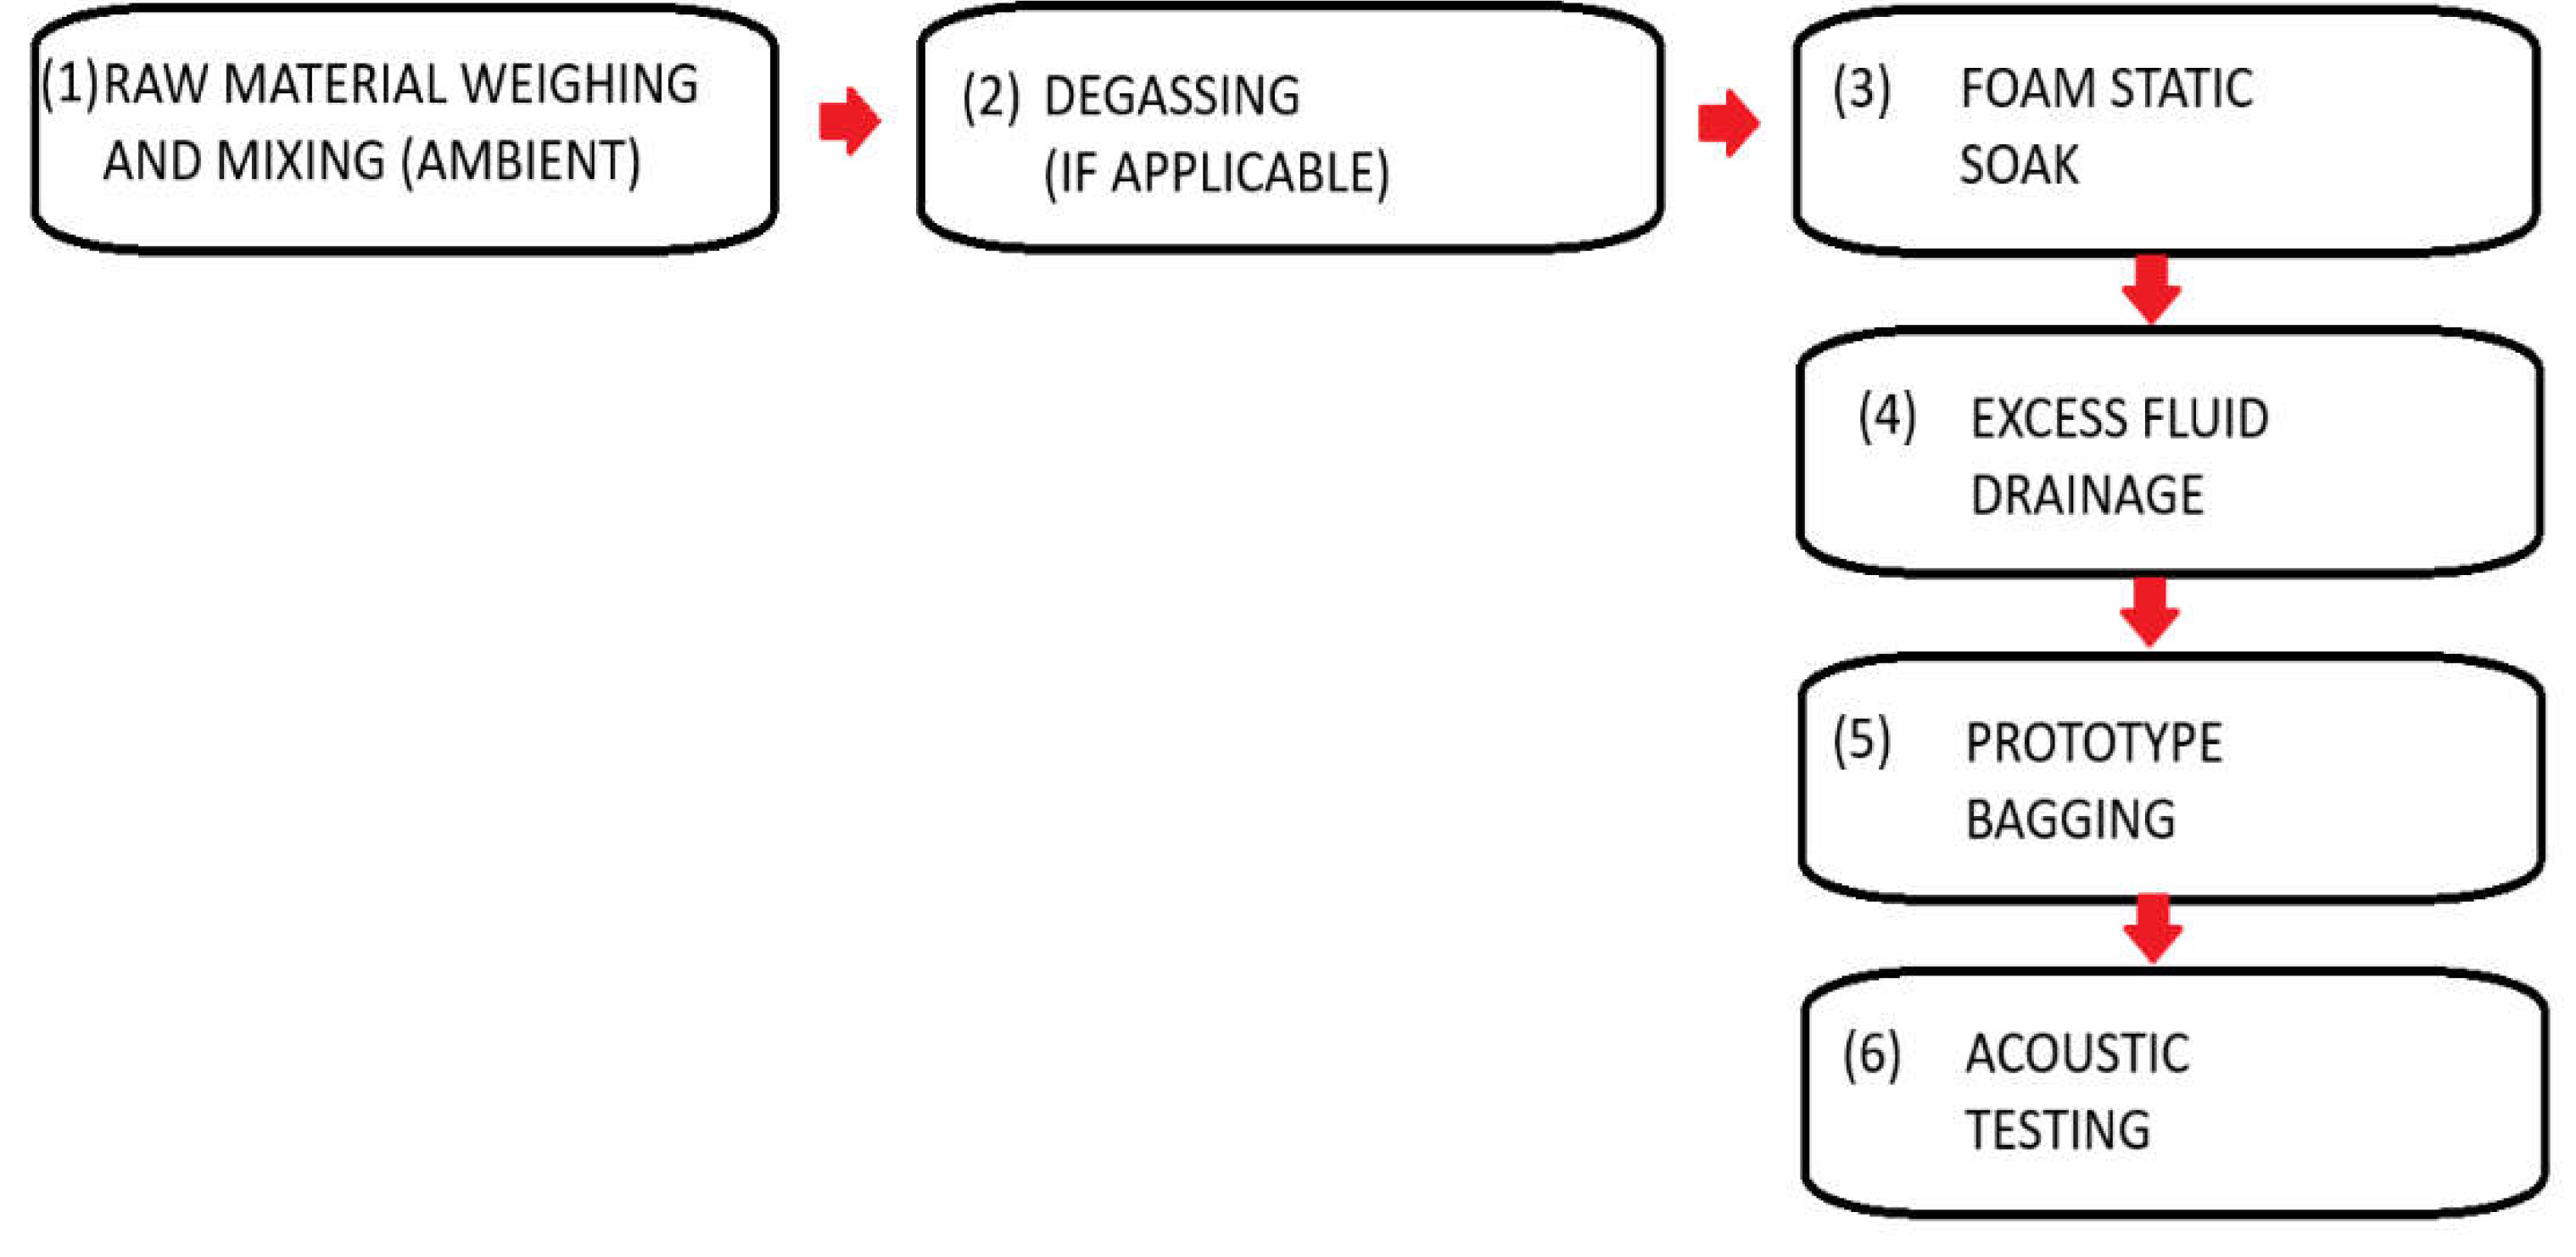
Figure 2.
Ishikawa diagram illustrating hypothesized relationships between process inputs and measurable properties.
Figure 2.
Ishikawa diagram illustrating hypothesized relationships between process inputs and measurable properties.
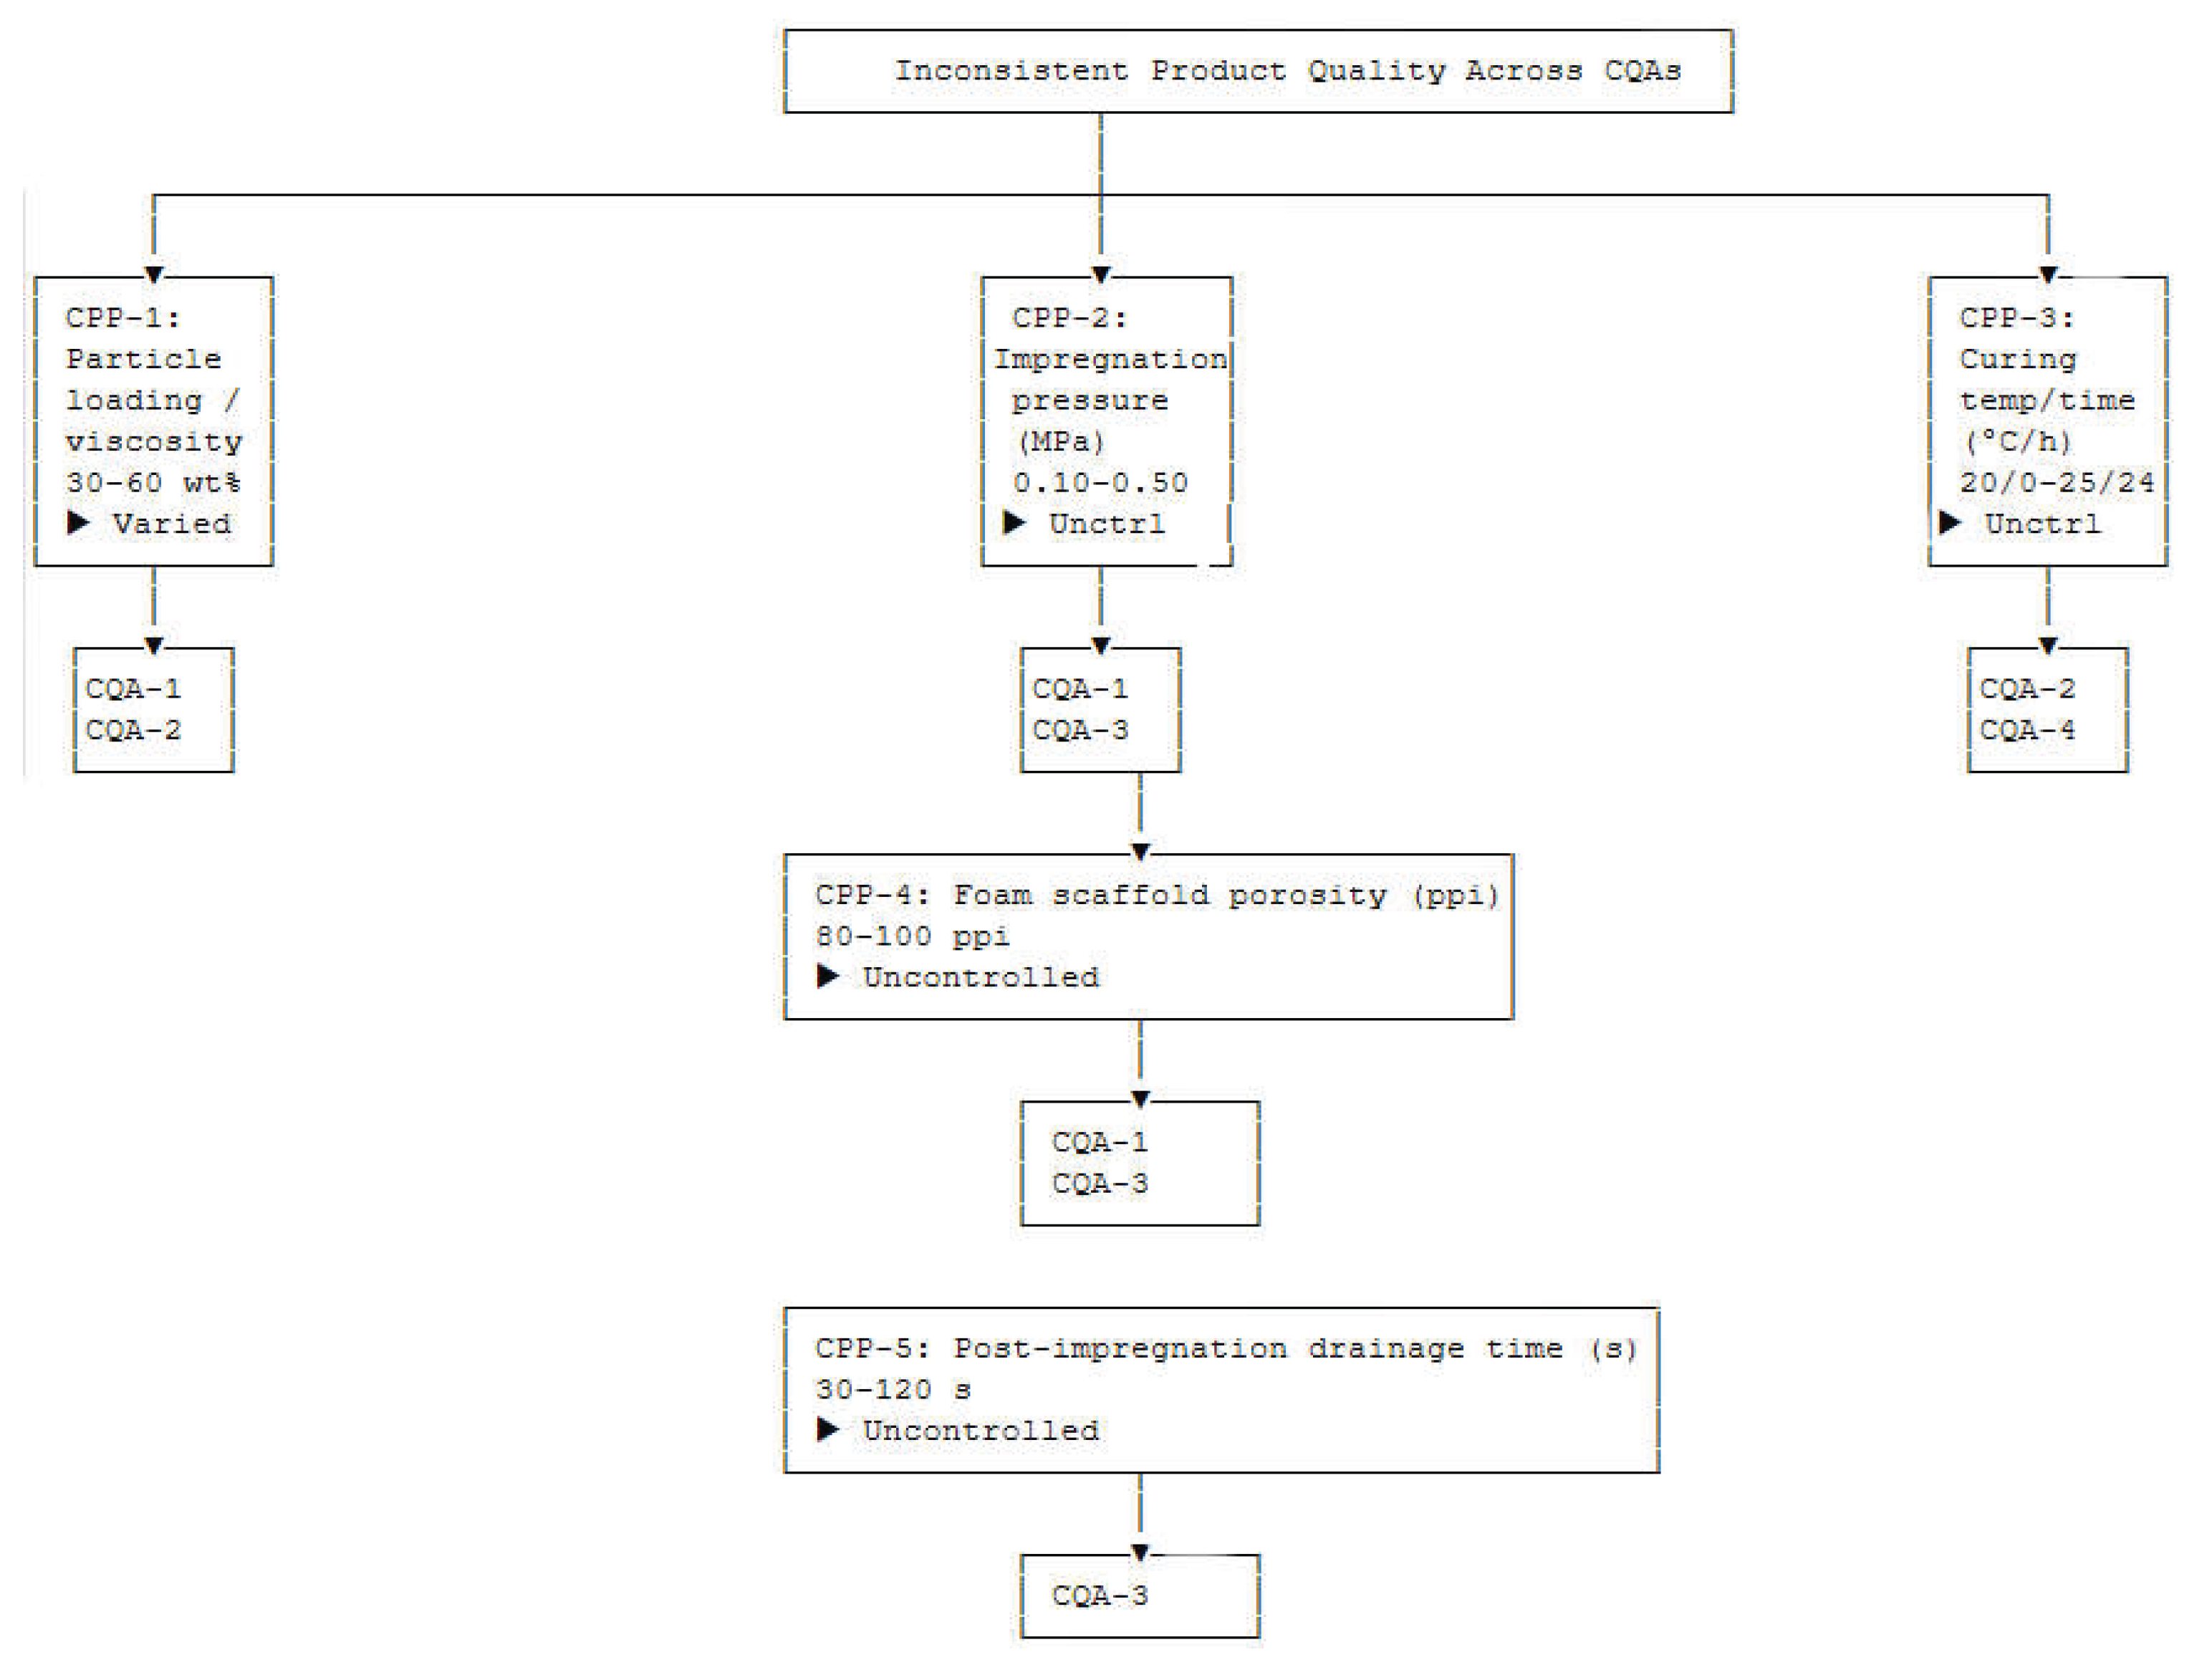

Table 1.
Supplier-Input-Process-Output-Customer chart for Stage 1.
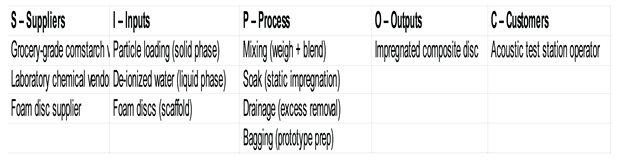 |
Table 2.
CPPs and Bounding Levels for the Stage 1 Pilot Study.
| CPP ID | Parameter | Lower Bound | Upper Bound | Control Status | CQA Linkage |
|---|---|---|---|---|---|
| CPP-1 | Particle loading / fluid viscosity (wt%) | 30 | 60 | Varied (6 levels) | CQA-1, CQA-2 |
| CPP-2 | Impregnation pressure (MPa) | 0.10 (static soak) | 0.50 (vacuum-assisted) | Uncontrolled | CQA-1, CQA-3 |
| CPP-3 | Curing temperature (°C) / time (h) | 20 / 0 | 25 / 24 | Uncontrolled | CQA-2, CQA-4 |
| CPP-4 | Foam scaffold porosity (ppi) | 80 | 100 | Uncontrolled | CQA-1, CQA-3 |
| CPP-5 | Post-impregnation drainage time (s) | 30 | 120 | Uncontrolled | CQA-3 |
Abbreviations: CPP, Critical Process Parameter; CQA, Critical Quality Attribute.
Table 3.
Preliminary Process Failure Mode and Effects Analysis for the Foam Impregnation Protocol.
| Process Step | Potential Failure Mode | Potential Effect | CQA Affected | S | O | D | RPN | AP* | Current Controls | Recommended Actions |
|---|---|---|---|---|---|---|---|---|---|---|
| Mix | Inadequate dispersion | Variable viscosity, poor impregnation | CQA-1, CQA-2 | 7 | 5 | 3 (60% visual) | 105 | Medium | Visual inspection | High-shear mixing protocol; particle size control per ASTM B822 |
| Degas | Incomplete bubble removal | Void formation, attenuation variability | CQA-1, CQA-3 | 6 | 4 | 4 (40% ambient settle) | 96 | Medium | Ambient settle | Vacuum degas; time limit |
| Impregnate | Uneven soak | Thickness / density variation | CQA-1, CQA-3 | 8 | 6 | 3 (50% static soak) | 144 | High | Static soak 10 min | Vacuum-assisted impregnation; pressure control |
| Drain | Excess fluid retention | Non-uniform layer thickness | CQA-3 | 7 | 5 | 4 (30% manual squeeze) | 140 | High | Manual squeeze | Controlled centrifugation or wiper blade |
| Bag | Air entrapment | Spurious reflection artifacts | CQA-1 | 5 | 6 | 5 (20% manual press) | 150 | High | Manual press | Vacuum bagging fixture; alignment jig |
*AP is assigned according to the AIAG/VDA Process Failure Mode and Effects Analysis methodology: high priority is triggered for any step with S ≥ 8 or an RPN > 100. Abbreviations: CQA, Critical Quality Attribute; S, Severity; O, Occurrence; D, Detection; RPN, Risk Priority Number; AP, Action Priority.
Table 4.
RIL (dB) of the Prototype Formulations and Controls across Five Test Frequencies.
| Formulation / Control | 50 Hz | 100 Hz | 1,000 Hz | 10,000 Hz | 20,000 Hz |
|---|---|---|---|---|---|
| Empty bag (air path) | — | — | — | — | — |
| Unimpregnated foam | ~50 | ~45 | ~38 | ~85 | ~95 |
| Cardboard disc | ~65 | ~64 | ~62 | ~98 | ~105 |
| Thick oobleck (50:50) | ~50 | ~55 | ~48 | ~92 | ~102 |
| Thin oobleck (66:33) | ~50 | ~42 | ~35 | ~88 | ~97 |
| Polystyrene sulfonate | ~50 | ~40 | ~36 | ~86 | ~97 |
| PEG–fumed silica | ~50 | ~48 | ~40 | ~90 | ~100 |
| Boric acid–simethicone | ~50 | ~35 | ~32 | ~84 | ~110 |
| Boric acid–cornstarch | ~50 | ~52 | ~45 | ~94 | ~108 |
Table 5.
Industrial Benchmark Comparison of Matching-Layer Materials.
| Material | Z (MRayl) | c (m·s⁻¹) | Attenuation | Fabrication Method | Ref. |
|---|---|---|---|---|---|
| Alumina–epoxy | 6.5–9.5 | 2800–3900 | 1.26 dB·mm⁻¹ @ 40 MHz | High-pressure compression | [9] |
| Anodic aluminum oxide–epoxy 1–3 | ~9.5 | — | — | Microfabrication, anodization | [10] |
| Magnesium alloy | ~10.3 | — | 0.02 dB·mm⁻¹ @ 7.5 MHz | Precision machining | [11] |
| Gradient W-nano/epoxy | 8.2→3.2 | — | — | Exponential loading, molding | [12] |
| SiO₂–epoxy | ~7.5 | — | — | Casting | [13] |
| Metamaterial (fiber/epoxy) | — | — | Broadband | Etched fiber embedding | [14] |
Disclaimer/Publisher’s Note: The statements, opinions and data contained in all publications are solely those of the individual author(s) and contributor(s) and not of MDPI and/or the editor(s). MDPI and/or the editor(s) disclaim responsibility for any injury to people or property resulting from any ideas, methods, instructions or products referred to in the content. |
© 2026 by the authors. Licensee MDPI, Basel, Switzerland. This article is an open access article distributed under the terms and conditions of the Creative Commons Attribution (CC BY) license (http://creativecommons.org/licenses/by/4.0/).
Copyright: This open access article is published under a Creative Commons CC BY 4.0 license, which permit the free download, distribution, and reuse, provided that the author and preprint are cited in any reuse.


