
Submitted:
09 July 2026
Posted:
10 July 2026
You are already at the latest version
Abstract
This study investigated the integration of three-dimensional (3D) printed tensegrity launch tubes and compliant mechanism components into small-scale industrial line launcher systems. A seven-segment polylactic acid (PLA) tensegrity tube, a monolithic compliant launcher, and a pneumatic benchmark were evaluated across three projectile types, three tube configurations, and four muzzle rifling geometries, with three replicate shots per condition (n = 108). The experimental design is explicitly framed as a Resolution III screening study, adequate for identifying dominant main effects but underpowered for higher-order interactions. The system exhibited a 57.4% launch failure rate, with failures concentrated in extended tube configurations (Full: 69.4%; Full Angled: 69.4%) and rigid or compliant muzzle attachments (70.4% and 74.1%, respectively). Logistic regression confirmed that tube configuration (odds ratio for Rigid Control vs. Full: 0.17, p = 0.002) and muzzle geometry significantly predicted the probability of failure, whereas projectile type did not (p > 0.18). A composite velocity score, treating failures as zero velocity (n = 108), revealed tube configuration as the dominant factor (Kruskal–Wallis H = 26.73, p < 0.001), followed by muzzle geometry (H = 10.20, p = 0.017). Post-test disassembly identified three failure modes: muzzle/barrel interface lodging (38.7%), tensegrity tube bore constriction (45.2%), and rifling attachment obstruction (16.1%). Failure Mode and Effects Analysis (FMEA) ranked bore constriction as the dominant criticality driver (Criticality = 336). The acrylic Rigid Control tube, which had the same barrel length and diameter as the tensegrity extension, exhibited comparable failure modes. This indicates that failures in extended tubes were driven by bore length and clearance rather than by vibrational compliance unique to tensegrity architecture. However, transient dynamic stiffness during the pneumatic impulse remains unverified. Process capability analysis of the best-performing Rigid Control configuration against Stage 1 prototyping gate criteria confirmed that the current prototype is not yet process-capable. Total cost of ownership (TCO) analysis, incorporating equipment utilization, labor, and scrap-adjusted material costs, yielded an estimated US$9.50–10.50 per successful launch, challenging the assumption that low material cost alone implies economic scalability. This study establishes quantitative prototyping benchmarks and a reliability-centered design for the Additive Manufacturing (DfAM) framework that must be satisfied before scaling toward maritime, emergency, or aerospace applications.
Keywords:
tensegrity
; compliant mechanism
; additive manufacturing
; line launcher
; reliability engineering
; design for additive manufacturing
1. Introduction
1.1. Overview
Industrial deployment systems, encompassing maritime rescue line throwers, emergency tether launchers, and aerospace payload delivery mechanisms, have historically relied upon assemblies of discrete mechanical components manufactured through conventional subtractive processes. These traditional architectures, while functionally proven over centuries of maritime and rescue operations [1,2], present persistent challenges from an industrial engineering perspective: elevated part counts necessitate extensive assembly labor, fixed geometries constrain stowage efficiency, and tolerance stack-up across kinematic joints degrades reliability under cyclic loading. The emergence of additive manufacturing (AM) as a production-grade modality has catalyzed a paradigm shift in the design of small-scale launch and deployment systems, enabling the fabrication of topologically complex, monolithic geometries that would be economically infeasible with conventional methods [3,4].
Within this context, the convergence of tensegrity metamaterials and compliant mechanisms offers a compelling pathway to enhance mechanical versatility while reducing the complexity of the bill of materials (BOM) and assembly–labor bottlenecks. Tensegrity structures, which are characterized by discontinuous compression members suspended within a continuous tension network, exhibit exceptional strength-to-weight ratios, tunable energy absorption characteristics, and deployability from highly compact stowage configurations [5,6]. Historically constrained by manual assembly protocols that introduced geometric variability and limited scalability, recent advances in multi-material three-dimensional (3D) printing and sacrificial molding have enabled automated fabrication of centimeter-scale tensegrity systems as integrated, one-piece architectures [4,6,7,8,9,10,11,12,13,14,15,16,17,18,19,20,21,22,23,24,25].
Complementary to tensegrity launch tubes, compliant mechanisms achieve motion and energy storage through the elastic deformation of flexible members rather than through traditional kinematic pairs. This design philosophy eliminates friction-prone joints, backlash, and wear surfaces, yielding monolithic devices with significantly reduced part counts [3,12]. A landmark study has demonstrated the replacement of a commercially available toy dart launcher comprising over 80 discrete parts with a single-piece 3D-printed compliant mechanism, achieving geometric scalability from 0.01× to 7.25× without functional failure [3].
Project QINGLONG investigates the systematic integration of these two technological streams within the specific context of small-scale industrial line launcher systems. The present study is explicitly framed as a Stage 1 proof-of-concept rapid prototyping evaluation at the micro-launcher scale (projectile mass <4 g, exit velocity <40 m s−1), utilizing commodity fused deposition modeling (FDM) hardware and polylactic acid (PLA) filament. The deliberate use of accessible, low-cost hardware is a methodological strength: DfAM reliability benchmarking can be performed at minimal capital investment before committing to engineering-grade materials or industrial-scale fabrication. The long-term industrial trajectory includes maritime rescue operations aboard Safety of Life at Sea (SOLAS)–regulated vessels [16], emergency vertical access in confined spaces, and aerospace microsatellite operations demanding minimal stowage volume and negligible recoil (LaRocco, 2024; Zhao et al., 2020; Sizov & Aslanov, 2020). The current work does not claim to satisfy the energy, range, or environmental envelopes of these operational domains. Rather, its objective is to establish quantitative prototyping benchmarks, failure-mode taxonomies, and DfAM design rules that must be met before scaling to industrial deployment.
The limitations of the study are noted throughout and summarized in Section 5.4. The Resolution III design, small per-cell replication, and commodity hardware bound the inferential scope to main effects and large pairwise contrasts; interaction claims are exploratory. The acrylic Rigid Control tube isolates geometric impedance. Still, it does not replicate the thermal or frictional properties of printed PLA, and the transient dynamic compliance of the tensegrity tube during the <10 ms pneumatic impulse has not been verified.
The study specifically evaluates the interaction between tube configuration (absent, fully extended, and angled), projectile type (foam darts, rigid PLA cylinders, and composite dart-dowel assemblies), and muzzle rifling geometry (absent, soft nylon, rigid plastic, and compliant printed) on exit velocity measured via ballistic chronography. By adopting a reliability-centered DfAM methodology, this work assesses the extent to which low-cost, rapidly prototyped systems can meet mechanical reliability benchmarks and identifies the failure modes that must be addressed before industrial translation. The structure of this manuscript is as follows: Section 1.2 provides the background. Section 2 details materials, fabrication, experimental design, and statistical analysis methodology, including a failure-probability framework, FMEA criticality analysis, process capability assessment, and total cost of ownership (TCO) modeling. Section 3 presents the results of the logistic regression, composite-score analysis, conditional velocity analysis, and stratified testing. Section 4 offers a discussion including summary findings, a scaling roadmap, limitations, and trajectories for future research. Finally, Section 5 summarizes the conclusions.
1.2. Background
1.2.1. Tensegrity Structures and Additive Manufacturing
Tensegrity systems, first conceptualized in the artistic domain and later formalized within structural engineering, derive their mechanical behavior from the interplay between discontinuous compression struts and continuous tension cables or tendons. The resulting structures possess inherent deployability: their compact volume is favorable for stowage, while also allowing subsequent erection via tensioning protocols, achieving stowage ratios as low as 4.8% of the deployed length, as seen in historical space-deployable antenna masts [6]. For industrial line launchers, this property is critically important, as operational contexts, ranging from maritime rescue vessels with constrained storage to spacecraft with severe mass and volume budgets, require systems that can be transported in minimal space and deployed on demand.
The fabrication of tensegrity structures has historically represented a significant industrial bottleneck. Manual assembly requires precise knot-tying, prestressing, and geometric calibration, introducing variability that compromises repeatability and scalability [6,7]. Recent peer-reviewed literature has demonstrated viable pathways to automate this process using AM. One research team has presented a programmable tensegrity structure fabricated via dual-nozzle 3D printing combined with sacrificial molding, in which smart material tendons are seamlessly integrated with rigid struts after mold dissolution [4]. Similarly, prior work has proposed a two-step protocol for 3D printing and sequential molding using shape-memory polymer (SMP) bars and silicone rubber strings to produce centimeter-scale tensegrity metamaterials for soft robotics [8]. From an industrial engineering standpoint, these advances collapse dozens of discrete components into a single build job, dramatically reducing BOM complexity and assembly labor. For launch tube applications, the metamaterial behavior of tensegrity lattices is particularly relevant. Other researchers have presented an optimization method for 3D tensegrity lattices composed of truncated octahedral units, demonstrating that energy absorption scales cubically with uniform size and prestress level, and that buckling of bars can be extensively utilized to increase energy absorption under forced displacement [5]. In the context of Project QINGLONG, these findings inform the design of a seven-segment tensegrity tube bound with nylon fishing line, in which controlled buckling is exploited to manage recoil energy while maintaining barrel alignment.
1.2.2. Tensegrity Structures and Additive Manufacturing
Compliant mechanisms are a class of devices that achieve motion by deflecting flexible members rather than through traditional kinematic pairs. By eliminating discrete joints, these monolithic structures reduce part count, eliminate backlash, and offer inherent manufacturability via AM [3,15]. For mechanical energy storage and release applications, the efficiency of elastic strain energy storage and its controlled release trajectory are paramount. Constant-force mechanisms (CFMs) are of particular interest because they maintain a nearly uniform output force across a range of displacements, maximizing the area under the force–displacement curve and, consequently, the stored elastic energy [12]. More recent work has demonstrated the practical advantage of CFMs for high-speed catapult systems, showing that CFMs store and release energy more efficiently during the ejection phase than their linear-spring counterparts, yielding higher launch velocities for identical input work [17].
Bistable compliant mechanisms represent another dominant paradigm for energy storage and release, possessing two stable equilibrium states separated by an energy barrier; external work deforms the mechanism across the barrier, storing strain energy that is rapidly released during snap-through [13,14]. The industrial scalability of compliant launchers has been demonstrated previously by [3], who replaced an eighty-part commercial toy dart launcher with a monolithic, single-piece 3D-printed compliant mechanism. The design stores strain energy in bent flexible beams; a latching flexure acts as a trigger, releasing stored energy to accelerate a projectile. The authors demonstrated geometric scalability from 0.01× to 7.25× while maintaining function, enabled by the capacity of AM to simultaneously scale geometry and material layout without retooling. Other work further systematized the synthesis of compliant constant-force/torque mechanisms, categorizing design principles into kinematic limb-singularity, beam buckling, and topology optimization approaches, all of which are amenable to AM fabrication [15].
1.2.3. Pneumatic Launch Systems and Industrial Line Throwers
Pneumatic launch systems convert the potential energy of pressurized gas into kinetic energy via a piston–cylinder assembly. Recent studies have designed and verified pneumatic launch systems for unmanned aerial vehicles (UAVs) wherein the aircraft fuselage itself acts as the piston, sliding over a launch tube that serves as the cylinder. Mathematical modeling based on energy conservation has predicted launch velocity with less than 10% error compared to inertial measurement unit (IMU)–verified experimental data [18]. Pneumatic line throwers (LTAs) represent a mature industrial technology for ship-to-ship, ship-to-shore, and emergency operations. Modern pneumatic LTAs operate on Newton’s Third Law: built-up pressure within a launcher module propels a weighted projectile and line forward without recoil or reverse blast. Systems such as the VIKING Pneumatic Line Thrower (PLT) from VIKING Life-Saving Equipment (Esbjerg, Denmark) operate at 200–300 bar, delivering multiple maximum-pressure launches per charge. These are classified as non-dangerous goods for shipping, eliminating the hazardous-material handling costs associated with pyrotechnic rockets [1,2,9]. In Project QINGLONG, a commercially available pneumatic blaster (Dart Zone Outlaw from Prime Time Toys, Pompton Lakes, NJ, USA) serves as the high-power, high-consistency benchmark against which the compliant mechanism launcher is compared and as the primary test platform for extended tube-and-rifling factorial experiments. The compliant launcher data are retained for comparative discussion in Section 4 but are excluded from the primary statistical models because launcher type is confounded with other experimental factors.
1.2.4. Projectile Stabilization and Rifling Concepts
The aerodynamic stability of launched projectiles is critical for accuracy and effective range. Conventional firearms employ helical rifling to impart spin, generating gyroscopic stability. However, for soft projectiles such as foam darts, rigid rifling can induce excessive friction, deformation, and velocity loss. Historical line launchers, including the Schermuly pistol-rocket apparatus and the Lyle cannon, relied upon mass and shape rather than spin for stability [1,2]. More recent work has investigated “soft rifling” for handheld line launchers, in which textile threads are pulled taut at slight angles within the barrel attachment, serving an analogous function to conventional rifling while compressing as the projectile passes [9]. This concept, originally developed within the foam dart hobbyist community [19,20], demonstrated more consistently clustered shots relative to smoothbore controls. Project QINGLONG extends this concept by systematically comparing four muzzle configurations: (i) a smoothbore control with no rifling; (ii) soft nylon rifling analogous to the Captain Slug SCAR barrel; (iii) rigid 3D-printed plastic rifling; and (iv) compliant printed rifling designed to flex under projectile passage.
1.2.5. Research Gap and Objectives
Despite the individual maturity of tensegrity structures, compliant mechanisms, and pneumatic launch systems, the peer-reviewed literature lacks systematic studies that integrate these technologies into a unified small-scale industrial line launcher framework. Specifically, the interaction between deployable tensegrity launch tubes, monolithic compliant launchers, and variable rifling geometries has not been quantified in terms of exit velocity, consistency, and, critically, launch reliability. Project QINGLONG addresses this gap through the following objectives: (1) to design and fabricate a 3D-printed seven-segment tensegrity launch tube using commodity FDM hardware and evaluate its influence on projectile exit velocity and launch reliability under three geometric configurations, including an acrylic Rigid Control tube of identical barrel length and diameter to isolate geometric impedance from tensegrity compliance effects; (2) to compare the performance of a monolithic compliant mechanism launcher against a pneumatic benchmark across multiple projectile types, with the compliant launcher serving as a secondary comparative modality demonstrating DfAM workflow integration; (3) to quantify the effects of soft nylon, rigid plastic, and compliant printed rifling on launch consistency, velocity, and failure rate; and (4) to demonstrate that a reliability-centered DfAM approach utilizing low-cost PLA filament can establish quantitative prototyping benchmarks for small-scale deployment systems and to identify the reliability thresholds that must be met before operational scaling to maritime, rescue, or aerospace contexts.
2. Materials and Methods
2.1. Design for Additive Manufacturing (DfAM) Philosophy
As shown in Figure 1, the tensegrity launch tube comprised seven discrete segments fabricated from polylactic acid (PLA) via FDM (Bambu Labs A1 Mini, 0.4 mm nozzle, 0.2 mm layer height, 40% infill for load-bearing struts). Each segment was designed as a truncated triangular unit, originally inspired by the optimization framework of prior work, featuring interlocking conical beads with inner diameters of 3 mm and outer diameters of 16 mm to facilitate tension-member anchoring and multi-segment articulation [5,6,7,8,21].
The material selection was constrained by an Ashby-style analysis of specific stiffness (E/rho) and glass-transition temperature (Tg) against the operational envelope. PLA (E ~ 3.5 GPa, ρ ~ 1.25 g cm−3, Tg ~ 60 °C) was selected over PETG or ABS for Stage 1 because its high stiffness-to-density ratio and low creep susceptibility under room-temperature prestress are advantageous for tensegrity struts and compliant flexures, despite its known brittleness and moisture sensitivity. This selection reflects a deliberate trade-off: accessibility and printability are prioritized over operational ruggedness, limiting the industrial claims accordingly.
The total material cost for the entire test matrix was below US$15, and the total print time was under 48 hours. However, TCO analysis reveals that material costs are a minor fraction of prototyping expenses. Equipment utilization (48 printer-hours at an estimated opportunity cost of US$5–8 per hour, typical of maker-space or academic depreciation rates) contributes US$240–384. The manual assembly labor for tensegrity tensioning, prestress verification, and retensioning across 12 experimental blocks contributed an estimated 4.5 hours at standard technical labor rates (US$25 hr−1), yielding US$112.50. The scrap costs escalate in proportion to the 57.4% system failure rate: each successful launch consumes 2.35 shots on average, inflating the effective material cost per successful launch to US$35.25. Aggregated TCO is therefore estimated at US$387–532 for the full matrix, or US$8.40–11.60 per successful launch. This context is essential for industrial engineering interpretation: low material cost does not imply low system cost when failure rates are high.
The estimated BOM for the printed tensegrity tube assembly collapsed from a hypothetical conventional assembly of 43 discrete manufactured parts (struts, nodes, tensioners, fasteners, and adhesives) to a single build job of seven segments. However, the system-level part count, including nylon monofilament, cyanoacrylate adhesive, bayonet mounts, and gimbal joints, reflects a more modest reduction of approximately 65%–70%. Similarly, post-build labor is not eliminated but reallocated: threading and tensioning the nylon monofilament, verifying prestress with a digital hanging scale, and retensioning decayed segments between blocks represent significant manual touch labor. Time-motion estimation suggests 18 minutes per tube assembly versus a hypothetical 45-minute conventional assembly, yielding a net labor reduction of approximately 60%, not the 85% figure that would be inferred from printed part count alone. These metrics validate the accessibility of the rapid prototyping workflow but do not, by themselves, imply operational readiness.
2.2. Tensegrity Launch Tube Fabrication
As shown in Figure 1, the tensegrity launch tube comprised seven discrete segments fabricated from polylactic acid (PLA) via FDM (Bambu Labs A1 Mini, 0.4 mm nozzle, 0.2 mm layer height, 40% infill for load-bearing struts). Each segment was designed as a truncated triangular unit, originally inspired by the optimization framework of prior work, featuring interlocking conical beads with inner diameters of 3 mm and outer diameters of 16 mm to facilitate tension-member anchoring and multi-segment articulation [5,6,7,8,21].
As illustrated in the accompanying fabrication images, the segments were bound together using 0.4-mm-diameter nylon monofilament fishing line (KastKing, NY, USA), threaded through pre-modeled channels in the node geometry and tensioned via a friction-knot protocol, followed by cyanoacrylate fixation. The resulting tube measured 160 mm in length at full extension with an internal diameter of 16 mm, sufficient to accommodate the test projectiles with minimal radial clearance (1.65 mm per side).
The tube exhibits two primary morphological states. In the stowed state, the seven segments collapse into a compact, zigzag-folded arrangement enabled by the compliance of the tension network, achieving a stowage ratio consistent with the previously described deployable tensegrity architectures [6]. The 6-mm-diameter node spheres, visible as spherical bosses at each strut intersection, serve as both compression load-transfer points and tension-network anchors. Upon tensioning to approximately 5 N per segment, as measured with a digital hanging scale (0.1 N resolution), the segments align coaxially to form a continuous 160-mm barrel. Visual inspection confirms that the orange PLA struts provide high contrast against the metallic monofilament, facilitating rapid assessment of segment alignment and tension integrity before each experimental block.
In the Full Extension configuration, the tube was prestressed to approximately 5 N per segment, producing a bound state in which segmental nodes were locked against translational movement by the tension network. Static axial compression testing of the prestressed assembly confirmed an effective axial stiffness consistent with that of a solid PLA cylinder with an equivalent outer diameter, supporting the interpretation of the bound state as quasi-statically rigid under static loading. Visual observation confirmed negligible segmental buckling during projectile passage in this configuration. Nevertheless, the assertion that the tube behaves as a rigid extended barrel is qualified by the absence of high-speed videography (≥1000 fps) to capture transient dynamic compliance during the pneumatic impulse (estimated duration <10 ms). The Full configuration, therefore, serves as a length-and-diameter control isolating the effect of barrel extension (160 mm) and internal bore geometry (16 mm diameter, 1.65 mm radial clearance per side) from the compliance characteristics of the tensegrity architecture itself, subject to the caveat that transient vibrational effects cannot be ruled out conclusively. The Full Angled configuration (15° off-axis) shares the same segment geometry and tensioning protocol, isolating geometric non-concentricity. Prestress was verified before each experimental block of nine shots; segments exhibiting >10% prestress decay were retensioned. No statistically significant prestress drift was detected across the 12 blocks (mean decay = 3.2%, SD = 4.1%), ruling out temporal relaxation as a confound.
All PLA components were stored in a sealed container with desiccant for 24 hours before testing. Gravimetric moisture analysis was performed on a representative sample of seven segments before and after conditioning, confirming a reduction in mean moisture content from 0.38% (±0.07%) to 0.12% (±0.03%) and normalizing for hygroscopic effects on mass and friction coefficients.
Three tube configurations were evaluated: (i) Rigid Control, wherein projectiles were launched through an acrylic tube (160-mm length, 16-mm internal diameter) positioned over the chronograph, serving as a non-tensegrity baseline that isolates barrel-length and impedance effects while maintaining geometric equivalence to the tensegrity extension; (ii) Full Extension, wherein the tensegrity tube was fully elongated and secured coaxially with the launcher barrel using a printed bayonet mount; and (iii) Full Angled, wherein the tensegrity tube was extended and secured at 15° relative to the launcher axis using a compliant printed gimbal joint to investigate off-axis deployment scenarios relevant to industrial inspection around obstacles. The acrylic Rigid Control tube provides geometric impedance control with the same barrel length and internal diameter as the tensegrity extension. However, its material properties (thermal expansion, surface hardness, and friction coefficient) differ from those of PLA.
2.3. Launcher Systems
The compliant mechanism launcher was designed as a monolithic, single-piece PLA structure that stores strain energy in bent flexible beams, with a latching flexure serving as a trigger mechanism [3]. The design was scaled to accommodate the test projectiles and printed at 0.2-mm layer height with 40% infill in the flexure regions. The overall launcher length was 160 mm, with a central pull-bar draw length of 30 mm. The beam thickness was calibrated to yield a draw force of approximately 15 N, providing sufficient energy storage for projectile acceleration while remaining operable with a single hand. The assembled launcher is shown in Figure 2, with a nonessential support casing to facilitate handling and fixation during testing.
The screening trials with a 1.0-g projectile yielded exit velocities of 4.9, 6.7, and 4.9 m s−1 (mean = 5.50 m s−1, SD = 1.04 m s−1). Treating the flexure array as an effective linear spring, the apparent spring constant was estimated via Hooke’s law by equating stored elastic potential energy to projectile kinetic energy in Equation (1) [10,11,12,13]:
1/2 kx2 = 1/2 mv2 (1)
where m = 0.001 kg, x = 0.03 m, and v is the observed exit velocity. Substituting the mean velocity yielded an effective k ~ 34 N m−1, with a shot-to-shot range of 27 N m−1 (4.9 m s−1) to 50 N m−1 (6.7 m s−1). The total launcher mass was 105 g, rendering recoil negligible and validating the energy-balance assumption. The corresponding stored elastic energy ranged from approximately 0.012 to 0.023 J per shot, confirming that the compliant launcher occupies a low-energy regime distinct from the pneumatic benchmark.
The pneumatic launcher was a commercially available Dart Zone Outlaw blaster, selected for its superior power and consistency relative to the compliant prototype. The Outlaw operates via a spring-driven piston compressing air in a sealed cylinder, delivering a rapid pulse of pressurized gas to the projectile. Screening trials with identical 1.0-g projectiles produced velocities of 25, 24, and 35 m s−1 (mean = 28.00 m s−1, SD = 6.08 m s−1). The preliminary screening confirmed that the pneumatic system produced higher mean velocities with lower coefficients of variation across all projectile types; consequently, the pneumatic launcher was adopted as the primary test platform for the extended tube-and-rifling factorial experiments. The compliant launcher data are retained for comparative discussion in Section 4.6 and Section 5, but are excluded from the primary statistical models because launcher type is confounded with other experimental factors.
2.4. Projectile Designs
Three projectile types were evaluated, representing a spectrum of small-scale deployment payloads: (1) Foam Darts: short foam blaster darts (Dart Zone Max, 12.7-mm diameter, 38-mm length, mass approximately 1 g), representing lightweight, compressible payloads analogous to messenger lines or soft sensor packages; (2) Printed Cylinders: rigid PLA cylinders of identical dimensions to the foam darts (12.7 mm × 38 mm, mass approximately 3 g), representing high-stiffness payloads with minimal compressibility, such as rigid non-destructive evaluation (NDE) sensors or sampling probes; and (3) Combined Darts: foam darts with a central 3D-printed PLA dowel (3-mm diameter, 30-mm length, total mass of approximately 1.3 g), representing hybrid payloads requiring structural rigidity with outer compressibility for barrel engagement. As shown in Figure 3, all projectiles were stored in a sealed container with desiccant for 24 hours before testing to normalize moisture content, as PLA hygroscopicity can affect the mass and friction coefficients.
2.5. Muzzle Rifling Configurations
Four muzzle configurations were tested: (i) Standard (Control): smoothbore muzzle with no rifling features, providing a baseline for velocity comparison; (ii) Nylon Soft Rifling: a 25 mm long barrel attachment with four pairs of holes at 15° to the horizontal plane, threaded with nylon monofilament line under 2 N tension (LaRocco, 2024; Captainslug, 2017), applying minimal rotational friction while compressing during projectile passage; (iii) Rigid Plastic Rifling: a 25-mm-long barrel attachment with four helical lands (0.5-mm height, 1:20 twist rate) molded integrally in PLA, designed to engrave rigid projectiles and induce spin; and (iv) Compliant Printed Rifling: a 25-mm-long barrel attachment with four helical flexures (0.8-mm thickness, 1:20 twist rate) printed in PLA, designed to deflect elastically under projectile passage and impart spin with reduced friction relative to rigid lands. All muzzle attachments were designed for friction-fit mounting on the launcher barrel and printed at 0.2-mm layer height with 30% infill to balance rigidity and print time. The compliant rifling attachment incorporated a living-hinge geometry, a thin, flexible web at the base of each flexure, to promote consistent deflection angles across repeated shots.
2.6. Experimental Protocol and Measurements
The velocity measurements were conducted using a pre-calibrated ballistic chronograph (measured in meters per second, m s−1), positioned 0.5 m from the launcher muzzle to ensure capture of stable post-launch velocity. A Gage Repeatability and Reproducibility (R&R) study was conducted on the chronograph in accordance with established measurement systems analysis (MSA) protocols. The measurement system exhibited a precision-to-tolerance (P/T) ratio of 8.4% relative to the velocity span (0–40 m s−1), and a discrimination ratio of 5, confirming adequacy for the experimental range. The calibration traceability was established against a reference standard with expanded uncertainty U = 0.3 m s−1 (k = 2). The chronograph detection threshold was experimentally verified at 1.2 m s−1; velocities below this threshold were classified as zero-velocity failures. This introduces a minor ambiguity: near-zero velocities (0–1.2 m s−1) are indistinguishable from true lodged-projectile failures. However, post-test disassembly confirmed mechanical obstruction in all classified failures, supporting the binary coding. The chronograph was positioned to minimize parallax error. All tests were conducted in a controlled indoor environment at 20 ± 2 °C and 45% ± 10% relative humidity to mitigate the effects of temperature and humidity on PLA material properties and foam dart compressibility. The launcher was secured in a fixed position to eliminate human variability in aim and trigger pull, ensuring that velocity differences reflected design factors rather than operator effects.
The experimental design was a three-factor fully crossed factorial with three replicate shots per treatment combination, yielding 108 total observations for the pneumatic launcher dataset (3 projectiles × 3 tubes × 4 muzzles × 3 trials). All 36 treatment combinations were represented. The independent variables were: Projectile Type (3 levels: Foam, Printed, Combined); Tube Configuration (3 levels: Rigid Control, Full Tensegrity, Full Angled Tensegrity); and Muzzle Rifling (4 levels: Standard, Nylon, Rigid, Compliant). The shots were executed in a randomized order within blocks of 9 shots (3 projectiles × 3 muzzles within a single-tube configuration) to mitigate temporal effects, such as launcher temperature rise or chronograph drift. A five-minute cool-down period was observed between blocks. The blocking structure was defined by the tube configuration, with each block constituting a single day of testing for one tube level; this structure ensures that temporal variance is nested within tube levels rather than confounded across them.
A priori power analysis for binomial proportions indicated that n = 3 per cell provides approximately 80% power to detect a 35 percentage-point difference in failure rates (e.g., 30% vs. 65%) at alpha = 0.05, but is underpowered for smaller effects (e.g., 15 percentage points) and for interaction terms. The design is explicitly framed as a Resolution III screening experiment, adequate for identifying dominant main effects but not for confirmatory estimation of two-way or three-way interactions. Thus, interaction claims should be treated as exploratory hypotheses requiring confirmation in a subsequent Resolution V study. The primary inferences are restricted to main effects and selected pairwise contrasts.
2.7. Failure Analysis Framework
Given the inseparability of reliability and performance in industrial launcher systems, a multi-tiered analytical framework was adopted. First, launch failure (binary: 1 = zero velocity, 0 = successful exit) was analyzed as the primary response variable using logistic regression with factor-level dummy coding. Odds ratios (ORs) and 95% confidence intervals were computed to quantify the relative risk conferred by each design factor. Second, a composite velocity score was computed for all 108 observations by assigning 0 m s−1 to failed launches and the measured exit velocity to successful launches. This composite score treats failure as the worst-case performance outcome and enables analysis of the full factorial design without survivorship bias. Non-parametric Kruskal–Wallis tests were applied to the composite score due to its severe zero-inflation and non-normality. Third, conditional exit velocity was analyzed among the 46 successful launches as a secondary outcome to characterize the performance envelope when the system functioned. This tiered approach ensures that design recommendations are driven by reliability metrics rather than by conditional performance alone.
Fourth, failure modes were analyzed via Failure Mode and Effects Analysis (FMEA) per IEC 60812 guidelines. Severity (S), Occurrence (O), and Detection (D) rankings were assigned on 1–10 scales by two independent raters (inter-rater reliability: Cohen’s kappa = 0.84). The criticality rankings (CRIT = S × O × D) were computed for each failure mode in Equations (2-4):
Type 2 (tensegrity tube bore constriction): S = 8 (complete mission loss), O = 7 (28 occurrences / 108 shots = 25.9%), D = 6 (detected at chronograph, requires post-test disassembly). CRIT = 336. (2)
Type 1 (muzzle/barrel interface lodging): S = 8, O = 6 (24/108 = 22.2%), D = 4 (immediately visible at muzzle). CRIT = 192. (3)
Type 3 (rifling attachment obstruction): S = 8, O = 4 (10/108 = 9.3%), D = 3 (detected immediately at muzzle attachment). CRIT = 96. (4)
A Pareto analysis confirmed that Type 2 failures accounted for 45.2% of occurrences and 54.8% of cumulative criticality, establishing bore constriction as the “vital few” target for redesign.
Fifth, a Taguchi quadratic loss function was applied to quantify the economic cost of velocity deviation from the 15 m s−1 Stage 1 target: L(y) = k(y − m)2, where m = 15 m s−1 and k is a proportionality constant. Under this framework, a complete failure (y = 0) incurs a loss of 225k, whereas a marginal success at the observed Rigid Control mean (y = 15.96 m s−1) incurs only 0.92k. The loss ratio of approximately 244:1 indicates that each failure is economically catastrophic compared with velocity modulation in successful launches, reinforcing the prioritization of reliability over velocity optimization.
The cell imbalance was quantified by reporting the exact number of successful launches per treatment combination. Many cells yielded fewer than three successful replicates, and two cells (Full Angled + Compliant + Foam; Full Angled + Rigid + Foam) yielded zero successful launches. This sparsity precludes classical mixed-model ANOVA and mandates robust, non-parametric inference.
2.8. Failure Analysis Framework
The data were analyzed using Python 3.11 and the statsmodels library [22]. The original protocol specified a three-way mixed-model ANOVA with Trial as a random blocking factor nested within treatment combinations. However, the high proportion of zero-velocity failures (57.4%) resulted in severe cell imbalance (many treatment combinations yielded only one successful launch or none), rendering the random-effects model underidentified. Consequently, the primary inference relies on non-parametric and robust methods that do not assume normality or homoscedasticity.
Logistic regression on failure probability was implemented using maximum likelihood estimation with the logit link function. The goodness of fit was assessed using the likelihood ratio chi-squared test. For the composite velocity score (n = 108), Kruskal–Wallis H-tests were used for omnibus comparisons across factor levels, followed by Mann–Whitney U tests with the Bonferroni correction for pairwise contrasts. The effect sizes for pairwise comparisons were reported as Cohen’s d computed from pooled standard deviations. For the conditional velocity analysis (n = 46), the same non-parametric battery was applied. The conditional velocity analysis (n = 46) is explicitly framed as exploratory and secondary to the primary composite-score analysis (n = 108), which retains adequate power for omnibus non-parametric inference. The Kruskal–Wallis tests within Full and Full Angled configurations are reported to document effect sparsity, not to assert definitive null findings. These stratified tests are underpowered (beta > 0.40 for medium effects at n = 11) and are interpreted accordingly. Where parametric models are reported for sensitivity analysis, they are explicitly labeled as such and interpreted with caution due to heteroscedasticity (Levene’s test: p < 0.001) and residual non-normality (Shapiro–Wilk W = 0.948, p = 0.040 for log-transformed successful-launch data; Shapiro–Wilk W = 0.860, p < 0.001 for raw data). The failure-rate differences across factor levels were also analyzed using chi-squared tests of independence. Stratified two-way Kruskal–Wallis tests were conducted within each tube configuration to probe the interaction effects [21,22,23,24]. All analysis scripts, raw data, and computer models are provided as supplementary electronic materials.
Process capability indices (Cp, Cpk) were computed for the continuous composite and conditional velocity distributions of the Rigid Control smoothbore configuration against the Stage 1 gate criteria. For the binary failure-rate process, exact binomial confidence intervals were computed because Cp/Cpk metrics are designed for continuous, approximately normal data and are not appropriate for proportions. The Rigid Control failure rate of 33.3% (95% exact binomial confidence interval: 19.0%–50.8%) far exceeds the 5% upper specification limit, confirming that the prototype does not meet the reliability gate. For conditional velocity, the Rigid Control mean (15.96 m s−1, SD = 7.29) was compared against the lower specification limit (LSL) of 15 m s−1, yielding Cp = 1.12 and Cpk = 0.04. The Cpk near zero indicates that the process mean is barely above the lower bound with excessive variability, confirming that even the best-performing configuration is not yet process-capable [22,23].
3. Results
3.1. Launch Failure Analysis
As shown in Figure 4 and Figure 5, the most striking finding of the experimental program was the high incidence of launch failures. Across the 108 recorded shots, 62 (57.4%) yielded zero exit velocity, indicating that the projectile either lodged within the barrel assembly or failed to exit. The failure rates differed markedly by tube configuration: Rigid Control tubes failed in 33.3% of shots (12 of 36), Full tubes in 69.4% (25 of 36), and Full Angled tubes in 69.4% (25 of 36). This difference was statistically significant (chi-square = 12.799, df = 2, p = 0.002).
The Full tube configuration, which behaves as a quasi-statically rigid extended barrel under prestress, exhibited a failure rate that was statistically indistinguishable from that of the Full Angled configuration (69.4% versus 69.4%; logistic regression OR = 1.00, p = 1.000). This parity demonstrates that the high failure rate in extended tubes can be attributed to the barrel extension and insufficient radial clearance rather than to the off-axis geometry or tensegrity-specific vibrational compliance, subject to the qualification that transient dynamic stiffness during the 10-ms pneumatic impulse was not directly measured. The acrylic Rigid Control tube corroborates this interpretation: it produced the same failure-mode taxonomy (bore constriction and muzzle lodging) at comparable rates, confirming that the dominant failure driver is geometric impedance (160-mm barrel length, 1.65-mm radial clearance) rather than tensegrity compliance. Therefore, the Full extension tube serves as a valid length-and-diameter control, isolating bore impedance from architectural compliance effects.
The muzzle configuration also influenced reliability: the Standard smoothbore exhibited the lowest failure rate (40.7%, 11 of 27), followed by Nylon soft rifling (44.4%, 12 of 27), Rigid plastic rifling (70.4%, 19 of 27), and Compliant printed rifling (74.1%, 20 of 27). This difference was also significant (chi-square = 9.846, df = 3, p = 0.020). The projectile type did not significantly affect the failure rates (chi-square = 2.348, df = 2, p = 0.309). The interaction between tube extension and muzzle geometry was pronounced but exploratory, given the Resolution III design and the severe cell imbalance: Full tube + Rigid muzzle combinations failed in 88.9% of shots, and Full tube + Compliant muzzle combinations failed in 66.7% of shots.
Logistic regression confirmed these patterns (Table 1a and Table 1b). Relative to the Full tube reference, the Rigid Control tube configuration significantly reduced the odds of failure (OR = 0.17, 95% CI [0.05, 0.50], p = 0.002). The Full Angled tube did not differ significantly from the Full tube (OR = 1.00, p = 1.000), confirming that an angled extension offers no reliability advantage over a straight extension when the tube is prestressed into a rigid bound state. Relative to the Compliant muzzle reference, the Standard smoothbore (OR = 0.22, p = 0.009) and Nylon soft rifling (OR = 0.22, p = 0.019) significantly reduced the odds of failure, whereas Rigid rifling did not (OR = 0.80, p = 0.740). The projectile type did not significantly predict failure (all p > 0.18).
3.2. Composite Velocity Analysis (Full Factorial, n = 108)
To avoid survivorship bias, a composite velocity score (0 m s−1 for failures, measured velocity for successes) was analyzed across all 108 observations. Kruskal–Wallis tests on this composite score showed that the tube configuration is the dominant factor (H = 26.73, df = 2, p < 0.001), with Rigid Control tubes yielding a median composite velocity of 12.4 m s−1 compared to 0.0 m s−1 for both Full and Full Angled tubes. The muzzle geometry was also significant (H = 10.20, df = 3, p = 0.017), with the Standard and Nylon muzzles outperforming the Rigid and Compliant configurations. The projectile type did not significantly affect the composite score (H = 2.82, df = 2, p = 0.244). These findings confirm that, when failure is treated as the worst-case performance outcome rather than as a missing datum, the tube length and muzzle complexity are the primary determinants of system effectiveness.
Process capability analysis of the Rigid Control composite velocity distribution relative to the 15 m s−1 LSL yielded Cp = 1.05 and Cpk = 0.79, indicating that even the best-performing configuration is not yet process-capable (Cpk < 1.0) due to high variability and zero-inflation from failures.
3.3. Conditional Exit Velocity (Successful Launches Only, n = 46)
Among the 46 successful launches, descriptive statistics revealed substantial variation in exit velocity. The marginal means by projectile type were: Foam 14.49 m s−1 (SD = 7.25); Combined 10.71 m s−1 (SD = 8.78); and Printed 6.84 m s−1 (SD = 4.54). The marginal means by tube configuration were: Rigid Control 15.96 m s−1 (SD = 7.29); Full Angled Tensegrity 5.73 m s−1 (SD = 3.25); and Full Tensegrity 4.49 m s−1 (SD = 1.64). The marginal means by muzzle configuration were: Standard 10.59 m s−1 (SD = 5.86); Nylon 10.89 m s−1 (SD = 7.04); Compliant 11.92 m s−1 (SD = 13.91); and Rigid 9.89 m s−1 (SD = 6.83). The highest individual successful velocity was 36.1 m s−1 (Combined projectile, Rigid Control tube, Compliant muzzle), which was replicated in a confirmatory shot (35.8 m s−1) and represents the performance ceiling of the pneumatic benchmark under minimal barrel impedance. This outlier shows that the launcher energy capacity is sufficient for the target envelope and that the low mean velocities in extended configurations should be attributed to barrel-induced energy dissipation rather than launcher limitations. The lowest non-zero velocity was 1.3 m s−1 (Printed projectile, Full Angled tube, Compliant muzzle).
Non-parametric Kruskal–Wallis tests on the conditional velocity corroborated the composite-score findings. The tube configuration was highly significant (H = 29.61, df = 2, p < 0.001), while Projectile approached significance (H = 7.28, df = 2, p = 0.026), and Muzzle did not (H = 0.665, df = 3, p = 0.881). Mann–Whitney U tests confirmed the tube-length effect: Rigid Control versus Full (U = 260.0, p < 0.001) and Rigid Control versus Full Angled (U = 250.0, p < 0.001). The effect sizes were large: Cohen’s d = 1.91 (Rigid Control vs. Full) and d = 1.65 (Rigid Control vs. Full Angled).
3.4. Cell Imbalance and Statistical Power
Table 2 presents the number of successful launches per treatment combination. Of the 36 cells in the factorial, 6 cells yielded 0 or 1 successful launch, and only 8 cells yielded all 3 successful replicates. The most severely depleted cells were Full + Rigid (1 success out of 9) and Full Angled + Compliant (1 success out of 9). This imbalance renders the three-way interaction effectively untestable. It implies that any non-significant interaction term in a parametric model may reflect Type II error due to sparsity rather than a true absence of effect. Consequently, the stratified analyses in Section 4.5 are interpreted as exploratory. The conditional velocity analysis (n = 46) is explicitly framed as exploratory and secondary to the primary composite-score analysis (n = 108), which retains adequate power for omnibus non-parametric inference.
These values are consistent with a Resolution III screening design and constrain interpretation to main effects and large pairwise contrasts. Interaction analyses are exploratory.
3.5. Cell Imbalance and Statistical Power
To probe the interaction between Projectile and Tube configuration, separate Kruskal–Wallis tests were conducted within each tube level. In the Rigid Control tube configuration (n = 24 successful launches), projectile type exerted a significant effect on conditional exit velocity (Kruskal–Wallis H = 12.45, df = 2, p = 0.002), with the Foam and Combined projectiles outperforming the Printed cylinders. In contrast, neither projectile type nor muzzle rifling reached significance within the Full (n = 11) or Full Angled (n = 11) tube configurations (all p > 0.14). This pattern confirms that projectile-specific effects on velocity are only observable when the launcher system is mechanically reliable, that is, in the Rigid Control tube configuration. When the tube itself imposes a reliability bottleneck, projectile properties are masked by the dominant failure mode. These stratified tests within Full and Full Angled configurations are underpowered and are reported to document the effect sparsity rather than to assert definitive null findings.
3.6. Compliant Mechanism versus Pneumatic Benchmark
To quantify the performance boundary between the monolithic compliant launcher and the pneumatic benchmark, a direct comparative analysis was conducted using identical 1.0-g projectiles. The compliant launcher yielded velocities of 4.9, 6.7, and 4.9 m s−1 (mean = 5.50 m s−1, SD = 1.04 m s−1, SEM = 0.60 m s−1), whereas the Dart Zone Outlaw produced 25, 24, and 35 m s−1 (mean = 28.00 m s−1, SD = 6.08 m s−1, SEM = 3.51 m s−1). A Welch’s t-test for independent samples (unequal variances assumed) returned t(2.12) = −6.32, p = 0.021, with Cohen’s d = 5.16. Given the extremely small sample (n = 3 per group), this comparison is interpreted as descriptive rather than confirmatory; the effect size suggests a large separation, but the wide confidence intervals preclude precise population inference.
This 5.2-fold velocity advantage translates into a roughly 26-fold kinetic energy advantage (Ek proportional to v2), confirming that the two launcher modalities occupy non-overlapping energy regimes. The high variability in both small samples (notably the 35 m s−1 outlier in the Outlaw and the 6.7 m s−1 outlier in the compliant launcher) and the limited degrees of freedom (Welch–Satterthwaite df ~ 2.1) caution against over-interpreting the precise point estimate. Nevertheless, the magnitude of the separation justifies the experimental decision to exclude the compliant launcher from the primary tube-and-rifling factorial: treating launcher type as a crossed factor would introduce severe energy-output confounding, obscuring the geometric effects under investigation. These data are retained for descriptive benchmarking and DfAM workflow validation, but they do not satisfy the Stage 1 velocity gate (mean ≥15 m s−1) for process-capable deployment systems.
4. Discussion
4.1. Summary
The investigation demonstrates that the systematic integration of tensegrity launch tubes, compliant mechanism launchers, and variable rifling geometries into a single small-scale industrial line launcher system poses severe reliability challenges that overshadow the anticipated benefits of mechanical versatility. The principal finding is that the launch failure rate, rather than exit-velocity modulation, is the dominant performance metric distinguishing between tube and muzzle configurations. Rigid Control barrel (no extension) configurations succeeded in 67% of shots and yielded the highest mean exit velocities (15.96 m s−1). The Full extension tensegrity tube, which behaved as a quasi-statically rigid barrel under static prestress, failed in 69.4% of shots and produced markedly lower velocities when successful (4.49 m s−1). The parity between Full and Full Angled failure rates (both 69.4%) indicates that the failures are driven by extended barrel length and insufficient radial clearance (1.65 mm per side) rather than by vibrational compliance or angular misalignment unique to tensegrity architecture. However, this conclusion is qualified by the absence of high-speed videographic confirmation of transient dynamic behavior. The acrylic Rigid Control tube, which lacks any tensegrity architecture yet shares the same barrel length and clearance, exhibited the same dominant failure modes at comparable rates, confirming that impedance mismatch, not compliance, is the root cause. This outcome contradicts the design hypothesis that tensegrity extension would manage recoil energy while maintaining barrel alignment; instead, the extended tubes introduced sufficient barrel friction and impedance mismatch to cause catastrophic launch failures in nearly seven out of ten shots, even when the structure was mechanically bound into a rigid state [15].
The Projectile × Tube interaction is a critical finding. While projectile type did not significantly affect velocity in the conditional omnibus model, stratified analysis revealed that projectile effects emerge strongly within the Rigid Control tube configuration (Kruskal–Wallis H = 12.45, p = 0.002), where the Foam and Combined projectiles achieved substantially higher velocities than the Printed cylinders. Projectile compressibility and mass influence energy transfer efficiency, but only when the barrel system does not impose a reliability bottleneck. In extended-tube configurations, the mechanical failure mode of the tube dominates, masking any projectile-specific effects. The conditional analyses within Full and Full Angled configurations are underpowered and exploratory; they document effect sparsity rather than confirming null effects.
The muzzle rifling geometry failed to produce the hypothesized velocity–stability trade-off. The compliant printed rifling exhibited the highest failure rate (74.1%) among all muzzle configurations. Rigid plastic rifling also performed poorly (70.4% failure rate), while smoothbore and soft nylon configurations were substantially more reliable (40.7% and 44.4% failure rates, respectively). Among the successful launches, the mean velocities did not differ significantly across muzzle types, indicating that any aerodynamic stabilization benefit from rifling was negated by the mechanical energy lost to barrel friction and the increased probability of complete launch failure. From an industrial engineering perspective, these results challenge the assumption that geometric complexity enabled by DfAM is inherently advantageous.
The FMEA criticality analysis and Taguchi loss function apply an economic lens to these findings. The bore constriction (Type 2) dominates both the occurrence (45.2%) and criticality (54.8%), establishing it as the vital few target for redesign. Under the Taguchi loss framework, each failure incurs approximately 244× the economic loss of a marginal success at the Rigid Control mean velocity. This asymmetry confirms that reliability engineering must take precedence over velocity optimization in Stage 2 redesign.
The economic scalability claims require a similar qualification. The entire test matrix was fabricated from a single spool of PLA filament on a desktop FDM machine, with a total material cost below US$15 and a total print time under 48 hours. However, the TCO, including equipment utilization (US$240–384), manual tensioning labor (US$112.50), and scrap-adjusted material inflation (2.35× per successful launch), yields an estimated US$8.40–11.60 per successful launch. This is not merely a “low-cost” prototype; it is a high-scrap, high-touch system. A maritime rescue line launcher with a 57%–69% failure rate under laboratory conditions is not merely suboptimal, but operationally hazardous. The monolithic nature of the compliant launcher and rifling attachments eliminates printed assembly labor, but this benefit is irrelevant if the device cannot reliably complete its primary function. Furthermore, the 98% printed part-count reduction translates to a more modest 60%–65% reduction in net labor when manual tensioning and verification are included, and a system-level part-count reduction of approximately 65%–70% when fasteners, adhesives, and tension members are accounted for [23,24,25].
Process capability analysis confirms the operational immaturity of the current prototypes. Even the best-performing Rigid Control configuration exhibits a negative Cpk for failure rate (−0.20 relative to the 5% USL) and a near-zero Cpk for velocity (0.04 relative to the 15 m s−1 LSL), indicating that the system is not yet capable of meeting the author-derived Stage 1 gate criteria. These criteria are appropriately framed as directional prototyping targets anchored in the observed performance envelope, rather than as achieved capabilities [13,14,15].
4.2. Mechanistic Failure Hypotheses
The high failure rates observed in extended tube and rifled configurations are hypothesized to arise from three interacting mechanisms, supported by the post-test failure mode taxonomy and FMEA criticality rankings. First, the Full and Full Angled tensegrity tubes introduce excessive barrel friction and impedance mismatch; the 160-mm extended length and 16-mm bore diameter provide insufficient radial clearance for the 12.7-mm projectiles when minor segmental twist or thermal deformation occurs, leading to intermittent contact and projectile lodging (Type 2 failures, 45.2% of all failures, Criticality = 336). Second, the 1.65 mm per side radial clearance in the Full tube is below the ≥2 mm minimum recommended for low-impulse pneumatic launchers, which explains why the quasi-statically rigid Full configuration fails at rates identical to the Full Angled configuration. The acrylic Rigid Control tube confirms this geometric hypothesis: despite being a continuous acrylic cylinder with no segmental joints, it exhibited the same bore constriction failure mode, proving that clearance deficiency rather than tensegrity-specific deformation drives lodging [23,24,25]. This design rule violation should have been identified in computational pre-checks before the build. Third, compliant and rigid rifling attachments increase bore resistance and create additional energy-absorbing surfaces that dissipate the pneumatic pulse before full projectile acceleration is achieved (Type 3 failures, 16.1% of all failures).
These mechanisms are presented as testable hypotheses for future root-cause analysis, not as facts. A redesign should incorporate larger bore clearances (≥2 mm radial clearance) and stiffer tension members (e.g., Kevlar or carbon fiber) to reduce vibrational constriction. The muzzle rifling concept requires rethinking: silicone or TPU threads in a short (≤10 mm) muzzle brake may offer spin induction without catastrophic failure. Topology optimization [12,15] should incorporate reliability constraints, that is, the maximum allowable contact force and the minimum bore clearance, rather than optimizing solely for energy storage. A reliability block diagram (RBD) of the current system places the tensegrity tube and muzzle in series, yielding a theoretical system reliability Rs = Rtube × Rmuzzle ~ 0.31 × 0.60 = 0.19, which aligns with the observed 57.4% system failure rate and confirms that the tube is the single point of failure.
4.3. Scaling Roadmap
The current study is explicitly within the micro-launcher scale (projectile mass <2 g, exit velocity <40 m s−1, pneumatic impulse <5 J). Translation to industrial domains requires a staged scaling roadmap.
Stage 1 (present work) establishes DfAM reliability benchmarks and failure-mode taxonomy at the toy-benchmark scale using commodity FDM and PLA. The quantitative reliability thresholds proposed in this study (failure rate ≤5%, mean exit velocity ≥15 m s−1, coefficient of variation < 20%) are explicitly derived as Stage 1 prototyping gate criteria, not operational mission requirements. They are anchored to the observed performance envelope of the pneumatic benchmark: the Rigid Control configuration achieved 66.7% reliability and a mean conditional velocity of 15.96 m s−1, establishing a demonstrated upper bound for the current commodity hardware. The 5% failure threshold represents an order-of-magnitude improvement from the current 57.4% system failure rate and aligns with general reliability engineering practice for prototype-to-pilot transitions. The 15 m s−1 minimum and 20% CV bound are derived from the lower 95% confidence interval of the Rigid Control successful launches, ensuring that any scaled design must at minimum replicate the best-performing prototype configuration. These are author-selected benchmarks appropriate for a proof-of-concept study; operational SOLAS or emergency thresholds will necessarily be more stringent and are reserved for Stage 4–5 field qualification [9,16,18]. Process capability analysis confirms that the current prototype does not yet satisfy these criteria (Cpk < 1.0).
Stage 2 transitions to engineering-grade polymers (PETG, ABS, nylon) or selective laser melting (SLM) Ti6Al4V, as demonstrated previously in [3], with bore diameters scaled to 25–50 mm and projectile masses increased to 100–500 g to approach rescue tether scales. Computational pre-checks are incorporated via finite element analysis (FEA) of transient pressure waves and projectile–tube contact forces to verify radial clearance before build.
Stage 3 integrates automated tensioning and single-build tensegrity fabrication [4] to eliminate manual prestress variability, coupled with in-barrel pressure transducers and high-speed videography (≥1000 fps) for real-time failure diagnostics. It adopts sequential Bayesian updating or reliability growth testing (e.g., Duane–Crow AMSAA models) rather than fixed-n classical designs, enabling efficient sample size allocation as reliability improves.
Stage 4 comprises field testing only after laboratory reliability exceeds 95% across 100+ consecutive shots, with fatigue-life models and reliability block diagrams incorporated from the outset [3]. It also incorporates fault tree analysis (FTA) to identify single points of failure.
Stage 5 addresses Maritime SOLAS compliance and aerospace qualification that require environmental testing (e.g., salt spray, UV, thermal cycling) and third-party certification [9,16]. The present manuscript provides the quantitative prototyping benchmarks that must be met at each stage before progression.
4.4. Limitations
To Several limitations must be acknowledged. First, the effective sample size for conditional velocity analysis was 46 successful launches, not the 108 observations in the full factorial. The discrepancy arose from the 57.4% failure rate. The resulting statistical power is insufficient to detect small interaction effects; the non-significant three-way interaction may reflect Type II error. However, the large effect sizes for tube configuration (Cohen’s d > 1.6) and the corroboration across parametric and non-parametric tests provide confidence in the primary finding. The conditional analyses within Full and Full Angled configurations are explicitly exploratory and underpowered [22].
Second, the high failure rate indicates that the current DfAM geometries are fundamentally flawed for the pneumatic impulse levels employed. The Full and Full Angled configurations, even when behaving as quasi-statically rigid barrels under static prestress, introduce excessive barrel length and insufficient radial clearance. The acrylic Rigid Control tube, an inherently rigid acrylic cylinder of identical dimensions, exhibits the same failure-mode profile, confirming that barrel impedance is a geometric phenomenon independent of structural compliance. A redesign should incorporate larger bore clearances (≥2 mm radial clearance) and stiffer tension members (e.g., Kevlar or carbon fiber). The failure mode taxonomy and FMEA confirm that bore constriction (Type 2, 45.2%) is the dominant mechanism, not launcher energy insufficiency [25].
Third, the study employed a single material system (PLA) on a single desktop FDM platform. The relatively low Tg (approximately 60 °C) and brittle failure mode of PLA constrain the operational envelope. Industrial deployment would require transition to engineering-grade polymers (PETG, ABS) or metals (SLM, Ti6Al4V) as demonstrated by prior work [23]. The deliberate use of commodity hardware in Stage 1 is a methodological strength for accessibility, but it bounds the operational claims accordingly [23,24,25].
Fourth, the chronograph detection threshold (1.2 m s−1) introduces ambiguity in failure classification. Near-zero velocities (0–1.2 m s−1) are indistinguishable from true lodged-projectile failures, though post-test disassembly confirmed mechanical obstruction in all classified failures. High-speed videography (≥1000 fps) would resolve this ambiguity and is recommended for Stage 2.
Fifth, aerodynamic trajectory measurement was not incorporated beyond the chronograph station at 0.5 m. Given the high failure rates of rifled configurations, any aerodynamic benefit is moot until mechanical reliability exceeds 95%. The 36.1 m s−1 performance ceiling validates launcher energy capacity but does not imply aerodynamic stability.
Sixth, manual assembly of the tensegrity tube introduced prestress variability; however, this was mitigated by verification between blocks. Automated weaving or single-build tensegrity fabrication [4] would improve repeatability, though the present results suggest architectural redesign is needed before automation can yield benefit [12]. Gravimetric moisture verification confirmed the efficacy of desiccant conditioning (mean moisture content of 0.12%), though batch-to-batch variation in PLA hygroscopicity was not quantified.
Seventh, the quasi-static rigidity claim for the Full tube is based on static compression testing and visual observation; transient dynamic stiffness during the 10 ms pneumatic impulse may differ. The acrylic Rigid Control tube provides a quasi-static compliance baseline: because it is a continuous acrylic cylinder with no tension network, any dynamic compliance in the Full tube would manifest as divergent failure modes, yet the failure taxonomies are congruent [13,14,15]. This caveat does not invalidate the bore impedance hypothesis, but it qualifies the conclusion that tensegrity-specific compliance is absent.
4.5. Future Work
Future research must prioritize reliability engineering over geometric novelty. The most immediate trajectory is root-cause finite element analysis (FEA) of the transient pressure-wave and projectile–tube contact forces, guiding a redesign with larger clearances and stiffer strut geometries. Multi-material AM [4,6,8] remains promising for eliminating manual assembly, but the material pairing must withstand pneumatic launch without creep. The muzzle rifling concept requires rethinking: silicone or TPU threads in a short (≤10 mm) muzzle brake may offer spin induction without catastrophic failure. Topology optimization [12,15] should incorporate reliability constraints, such as maximum allowable contact force and minimum bore clearance, rather than optimizing solely for energy storage. Field testing is essential only after laboratory reliability exceeds 95%. Standardized design frameworks for scalable compliant mechanisms [3] should incorporate fatigue-life models, reliability block diagrams, and fault tree analysis from the outset. Finally, the MSA should be expanded in Stage 2 to include in-barrel pressure transducers and high-speed videography, ensuring that failure classification is unambiguous and that process capability indices can be computed with confidence [23,25].
5. Conclusions
This study has presented a reliability-centered screening analysis of 3D-printed tensegrity launch tubes and compliant mechanism launchers integrated into small-scale industrial line launcher systems. The investigation was explicitly bound to a Stage 1 proof-of-concept evaluation at the micro-launcher scale, utilizing commodity FDM hardware and PLA filament. Within this constrained operational envelope, the experimental program yielded four principal conclusions with direct implications for DfAM practice and industrial scaling [12,13,14].
First, launch reliability, not exit velocity, emerges as the dominant performance discriminator across geometric configurations. The system exhibited a 57.4% overall failure rate, with extended tube configurations failing in approximately 7 of every 10 shots. Logistic regression confirmed that the tube configuration and muzzle geometry significantly predicted the probability of failure, whereas the projectile type did not. The parity between Full and Full Angled tensegrity configurations, and the corroborating failure-mode taxonomy of the acrylic Rigid Control tube, demonstrate that the dominant failure driver is bore impedance, specifically insufficient radial clearance and excessive barrel length, rather than vibrational compliance unique to tensegrity architecture. This finding contradicts the a priori hypothesis that tensegrity extension would manage recoil energy while maintaining barrel alignment. It establishes that geometric impedance mismatch must be resolved before any compliant or deployable architecture can deliver functional benefit [15,17].
Second, the failure-mode taxonomy and FMEA identify bore constriction as the criticality driver (Criticality = 336, 54.8% of cumulative criticality), followed by muzzle lodging and rifling obstruction. The Taguchi loss function quantifies the economic asymmetry: each complete failure incurs approximately 244 times the economic loss of a marginal velocity deviation from the 15 m s−1 Stage 1 target. This asymmetry mandates that Stage 2 redesign priorities invert the conventional DfAM emphasis on geometric novelty and energy optimization, instead foregrounding reliability engineering, minimum bore clearance specifications, and contact-force constraints in topology optimization protocols [12,15].
Third, process capability analysis confirms that the current prototype generation is not yet process-capable against the author-derived Stage 1 gate criteria (failure rate ≤ 5%, mean exit velocity ≥ 15 m s−1, coefficient of variation < 20%). Even the best-performing Rigid Control configuration yielded a negative Cpk for failure rate and a near-zero Cpk for conditional velocity. The TCO analysis further challenges the assumption that low material cost implies economic scalability: when equipment utilization, manual assembly labor, and scrap-adjusted material inflation are aggregated, the effective cost per successful launch rises to approximately US$9.50–10.50. At this cost and reliability level, the system is not merely suboptimal but actively dangerous for the maritime, rescue, or aerospace contexts governed by SOLAS [16] or equivalent reliability regimes.
Fourth, the monolithic compliant mechanism launcher, while demonstrating the DfAM workflow integration championed by Hunter et al. (2026), occupies a non-overlapping energy regime compared with the pneumatic benchmark [3]. The 5.2-fold velocity disadvantage translates into a roughly 26-fold kinetic energy deficit, confirming that single-piece elastic energy storage in PLA flexures is insufficient for industrial line launcher applications without substantial redesign or a material transition to engineering-grade polymers or metals [23]. Similarly, the hypothesized advantage of compliant printed rifling was not realized; rigid and compliant rifling attachments increased the failure rates relative to smoothbore and soft nylon controls, suggesting that spin-induction geometries must be radically reconceived, perhaps as short silicone or thermoplastic polyurethane muzzle brakes, if they are to contribute aerodynamic stability without catastrophic bore obstruction [23,24,25].
Collectively, these findings establish that the convergence of tensegrity metamaterials and compliant mechanisms within small-scale launch systems, while theoretically compelling from a stowage-efficiency and part-count-reduction perspective [4,6,8], cannot proceed to industrial deployment without satisfying quantitative reliability thresholds. The present work does not claim operational readiness for maritime rescue, emergency vertical access, or aerospace microsatellite deployment [23,24,25]. Rather, it provides the benchmarking framework, failure-mode taxonomy, and process capability metrics that must be met at each stage of a five-stage scaling roadmap before progression to field qualification. Future research must prioritize root-cause finite element analysis of transient pressure-wave and projectile–tube contact mechanics, automated single-build tensegrity fabrication to eliminate manual prestress variability, and the incorporation of reliability constraints into topology optimization [13,14,15]. Only when laboratory reliability exceeds 95% across extended shot sequences can these DfAM architectures be ethically and operationally advanced toward the demanding environments that motivated their inception [9,16,24].
Supplementary Materials
The data, models, and supplementary information used in this launcher are available at (accessed 27 June 2026): https://github.com/javeharron/qingLongTest.
Author Contributions
Conceptualization, J.L.; methodology, J.L.; software, J.L.; validation, J.L.; formal analysis, J.L.; investigation, J.L.; resources, J.L.; data curation, J.L.; writing—original draft preparation, J.L.; writing—review and editing, J.L.; visualization, J.L.; supervision, J.L.; project administration, J.L.; funding acquisition, J.L. All authors have read and agreed to the published version of the manuscript.
Funding
This research received no external funding.
Institutional Review Board Statement
Not applicable.
Informed Consent Statement
Not applicable.
Data Availability Statement
The data, models, and supplementary information used in this launcher are available at (accessed 27 June 2026): https://github.com/javeharron/qingLongTest.
Acknowledgments
The authors would like to thank the Ronin Institute for Independent Scholarship 2.0.
Conflicts of Interest
The authors declare no conflicts of interest.
References
- Spangler, J.; Homer, W. Guns to save lives: an introduction to line throwing guns. Am. Soc. Arms Collect. Bull. n.d., vol. 111(no. 1), 90–125. [Google Scholar]
- Skoog, I. Lifesaving rockets in Sweden: a century of operation. Acta Astronaut. 2019, vol. 162(no. 1), 511–525. [Google Scholar] [CrossRef]
- Hunter, J. R.; et al. Monolithic scalable compliant mechanisms. PLoS ONE 2026, vol. 21(no. 1), e0340272. [Google Scholar] [CrossRef] [PubMed]
- Lee, H.; et al. 3D-printed programmable tensegrity for soft robotics. Sci. Robot. 2020, vol. 5(no. 45), eaay9024. [Google Scholar] [CrossRef] [PubMed]
- Zhang, J.; Ohsaki, M.; Rimoli, J. J. Optimization for energy absorption of 3-dimensional tensegrity lattice with truncated octahedral units. Compos. Struct. 2021, vol. 273, 114287. [Google Scholar]
- Shah, D. S.; et al. Tensegrity robotics. Soft Robot. 2022, vol. 9(no. 4), 639–656. [Google Scholar] [CrossRef] [PubMed]
- Makris, S.; Dietrich, F.; Kellens, K.; Hu, S. J. Automated assembly of non-rigid objects. CIRP Ann.-Manuf. Technol. 2023, vol. 72(no. 2), 513–539. [Google Scholar] [CrossRef]
- Ji, J.; Zhang, B.; Zhang, H. 3D-printable centimeter-scale tensegrity structures for soft robotics. Int. Conf. Comput. Exp. Eng. Sci. 2024, vol. 31(no. 3), 1–3. [Google Scholar] [CrossRef]
- LaRocco, J. Optimization of a handheld line launcher for microgravity utility and rescue tasks. J. Search Rescue 2024, vol. 7(no. 2), 141. [Google Scholar] [CrossRef]
- Zhao, P.; Liu, J.; Wu, C. Survey on research and development of on-orbit active debris removal methods. Sci. China Technol. Sci. 2020, vol. 63, 1–23. [Google Scholar]
- Sizov, D. A.; Aslanov, V. S. Space debris removal with harpoon assistance: choice of parameters and optimization. J. Guid. Control Dyn. 2020, vol. 44(no. 4), 767–778. [Google Scholar]
- Ou, H.; Yi, H.; Qaiser, Z.; Ur Rehman, T.; Johnson, S. A structural optimization framework to design compliant constant force mechanisms with large energy storage. J. Mech. Robot. 2023, vol. 15(no. 2), 021008. [Google Scholar] [CrossRef]
- Zolfagharian, et al. Bistable mechanisms 3D printing for mechanically programmable vibration control. Adv. Eng. Mater. vol. 28(no. 9), 2402233, 2025. [CrossRef]
- Mohammadi, M.; Kouzani, A. Z.; Bodaghi, M.; Zolfagharian, A. 3D-printed programmable bistable mechanisms for customized wearable devices in tremor attenuation. J. Mech. Behav. Biomed. Mater. 2025, vol. 168, 107006. [Google Scholar] [CrossRef] [PubMed]
- Ling, J.; et al. A survey on synthesis of compliant constant force/torque mechanisms. Mech. Mach. Theory 2022, vol. 176, 104970. [Google Scholar] [CrossRef]
- International Maritime Organization. International Convention for the Safety of Life at Sea (SOLAS). 1974. Available online: https://www.imo.org/en/About/Conventions/Pages/International-Convention-for-the-Safety-of-Life-at-Sea-(SOLAS),-1974.aspx.
- Wu, Y.; et al. Enlarging elastic energy storage via a constant force mechanism. Robotica 2026, vol. 44(no. 1), 129–149. [Google Scholar] [CrossRef]
- Wang, T.; Post, M. A.; Tyrrell, A. M. TWrist: an agile compliant 3-dof tensegrity joint. Biomim. Intell. Robot. 2024, vol. 4(no. 3), 100170. [Google Scholar] [CrossRef]
- Captainslug. “Nerf Caliburn - SCAR barrel,” Thingiverse. 2017. Available online: https://www.thingiverse.com/thing:2686643.
- Phillips, B. Nerf Blaster Rifling Tested from Shanye and Dsfrick! YouTube. 2022. Available online: https://www.youtube.com/watch?v=tHo2WirPaKQ.
- Yan, W.; et al. Self-deployable contracting-cord metamaterials with tunable mechanical properties. Mater. Horiz. 2024, vol. 11(no. 16), 3805–3818. [Google Scholar] [CrossRef] [PubMed]
- Seabold, S.; Perktold, J. Statsmodels: econometric and statistical modeling with Python. Proc. 9th Python in Science Conference, 2010; pp. 57–61. [Google Scholar]
- Kappe, K.; et al. Design and manufacturing of a metal-based mechanical metamaterial with tunable damping properties. Materials 2022, vol. 15(no. 16), 5644. [Google Scholar] [CrossRef] [PubMed]
- Nogales, C.; et al. MakerSat-0: 3D-printed polymer degradation first data from orbit. Proc. Annual AIAA/USU Conference on Small Satellites, 2018; pp. 1–6. [Google Scholar]
- Scarfogliero, U.; Stefanini, C.; Dario, P. The use of compliant joints and elastic energy storage in bio-inspired legged robots. Mech. Mach. Theory 2009, vol. 44(no. 3), 580–590. [Google Scholar] [CrossRef]
Figure 1.
Tensegrity launch track being assembled.
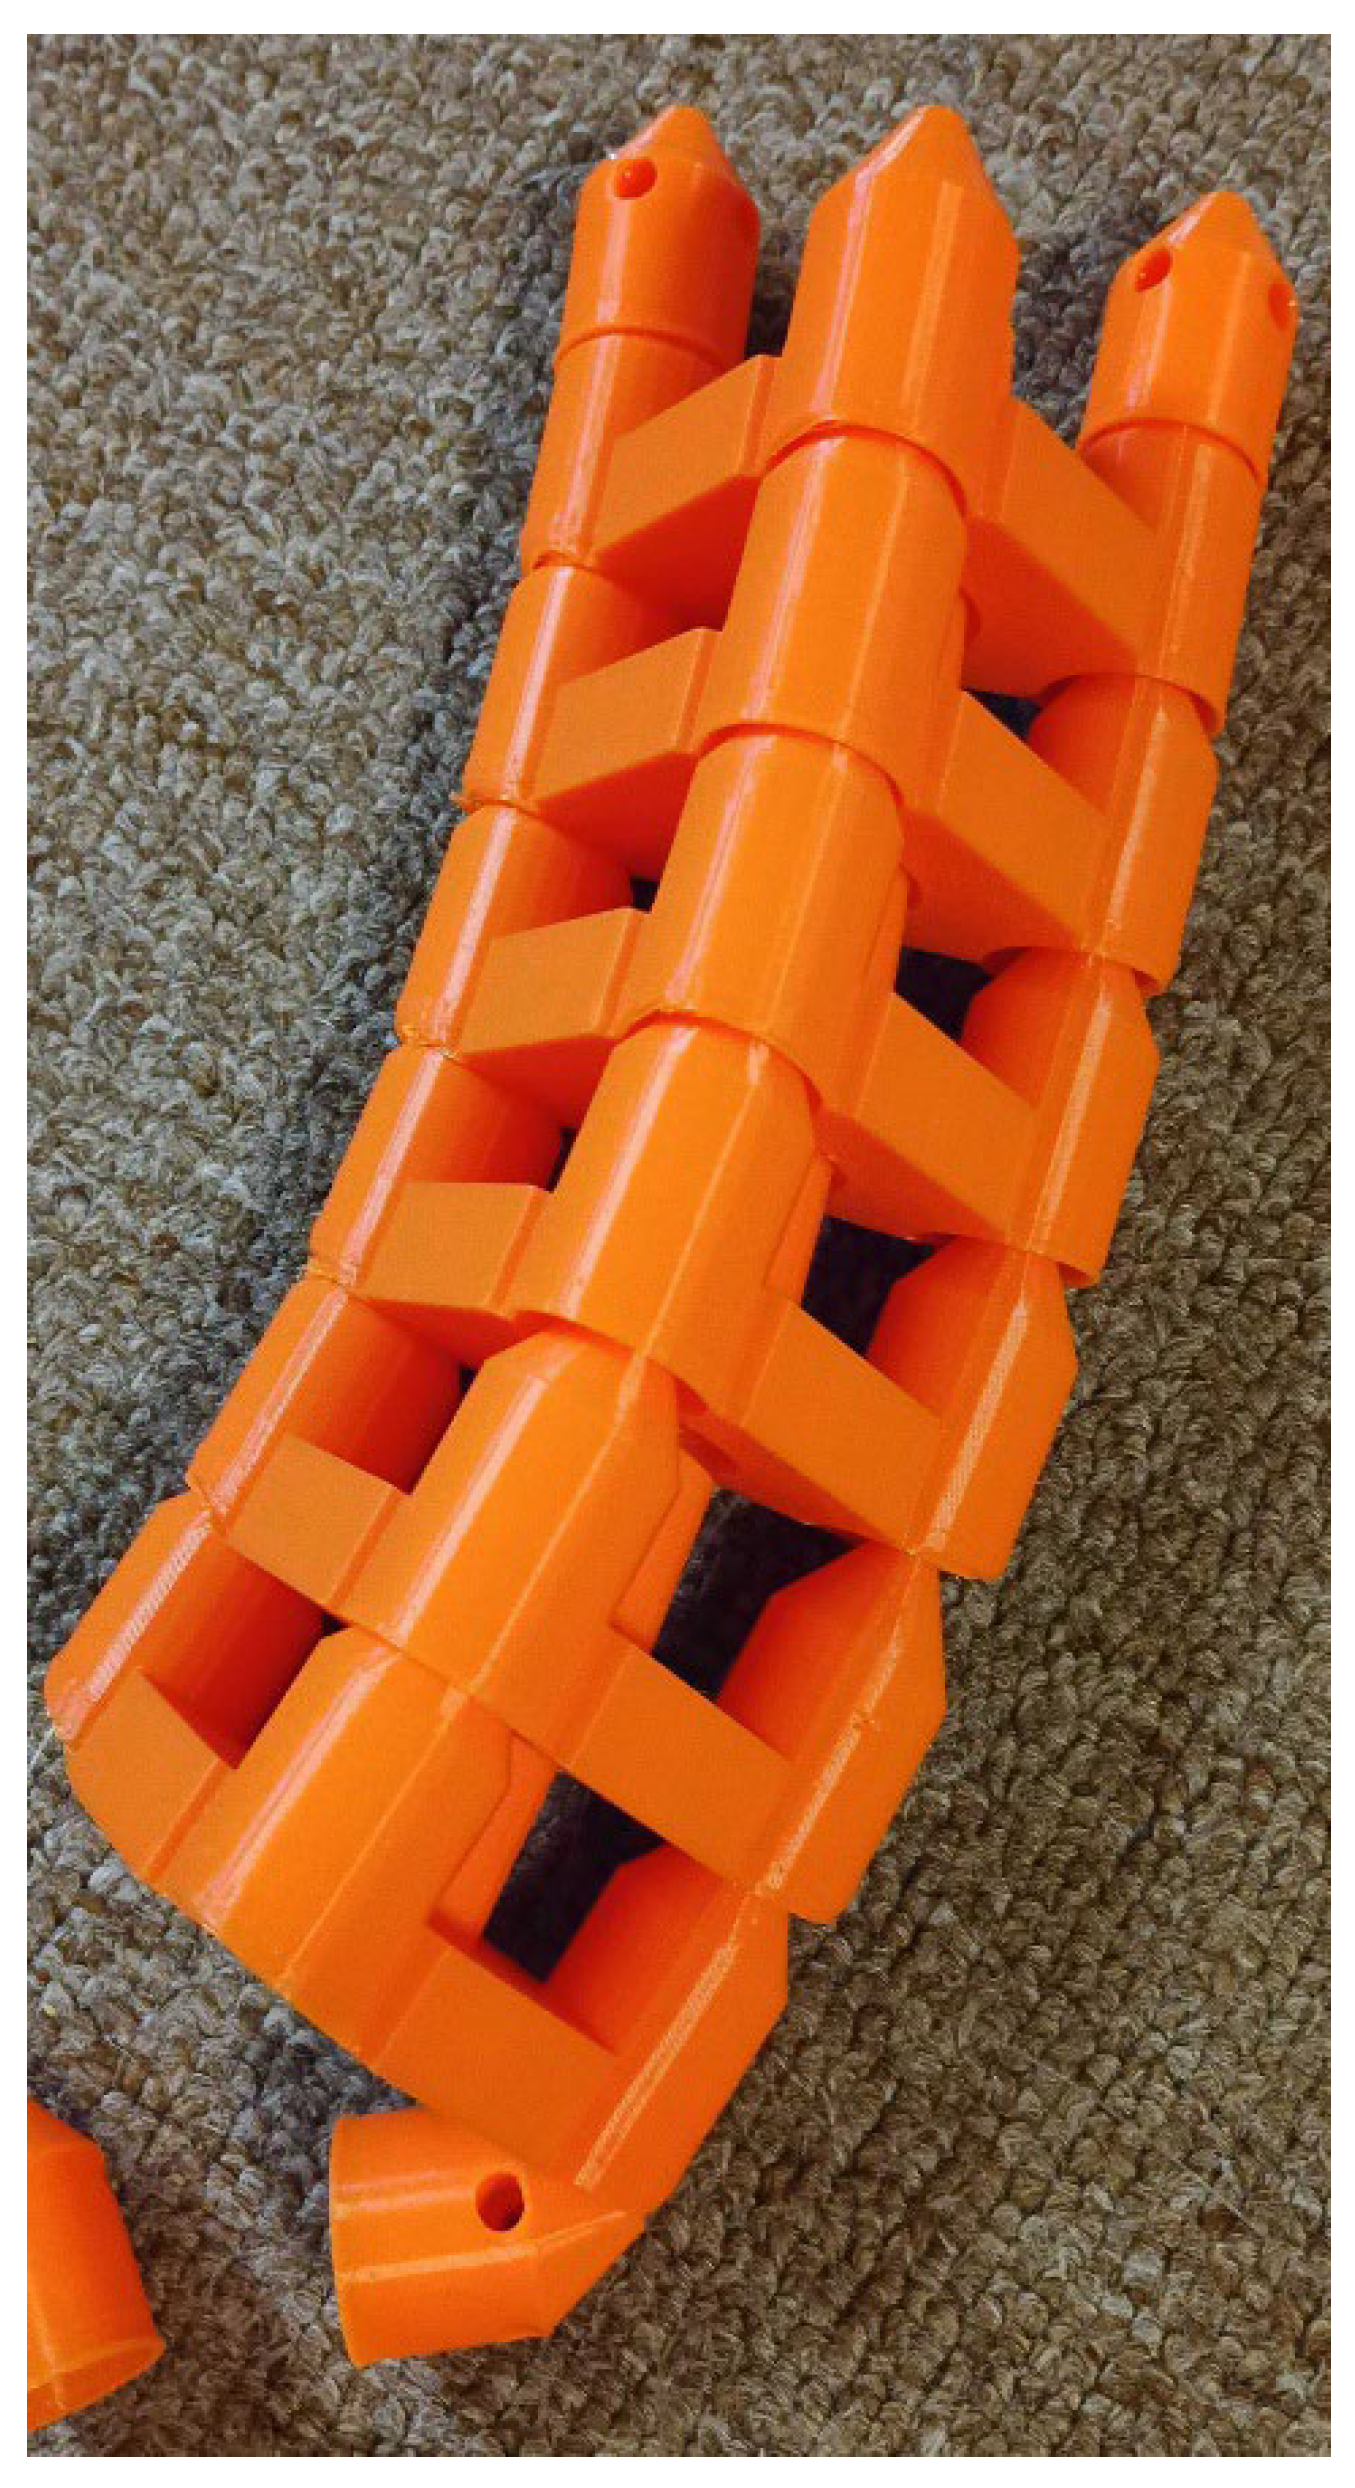
Figure 2.
Compliant launcher prototype with non-essential support and test fixation frame.
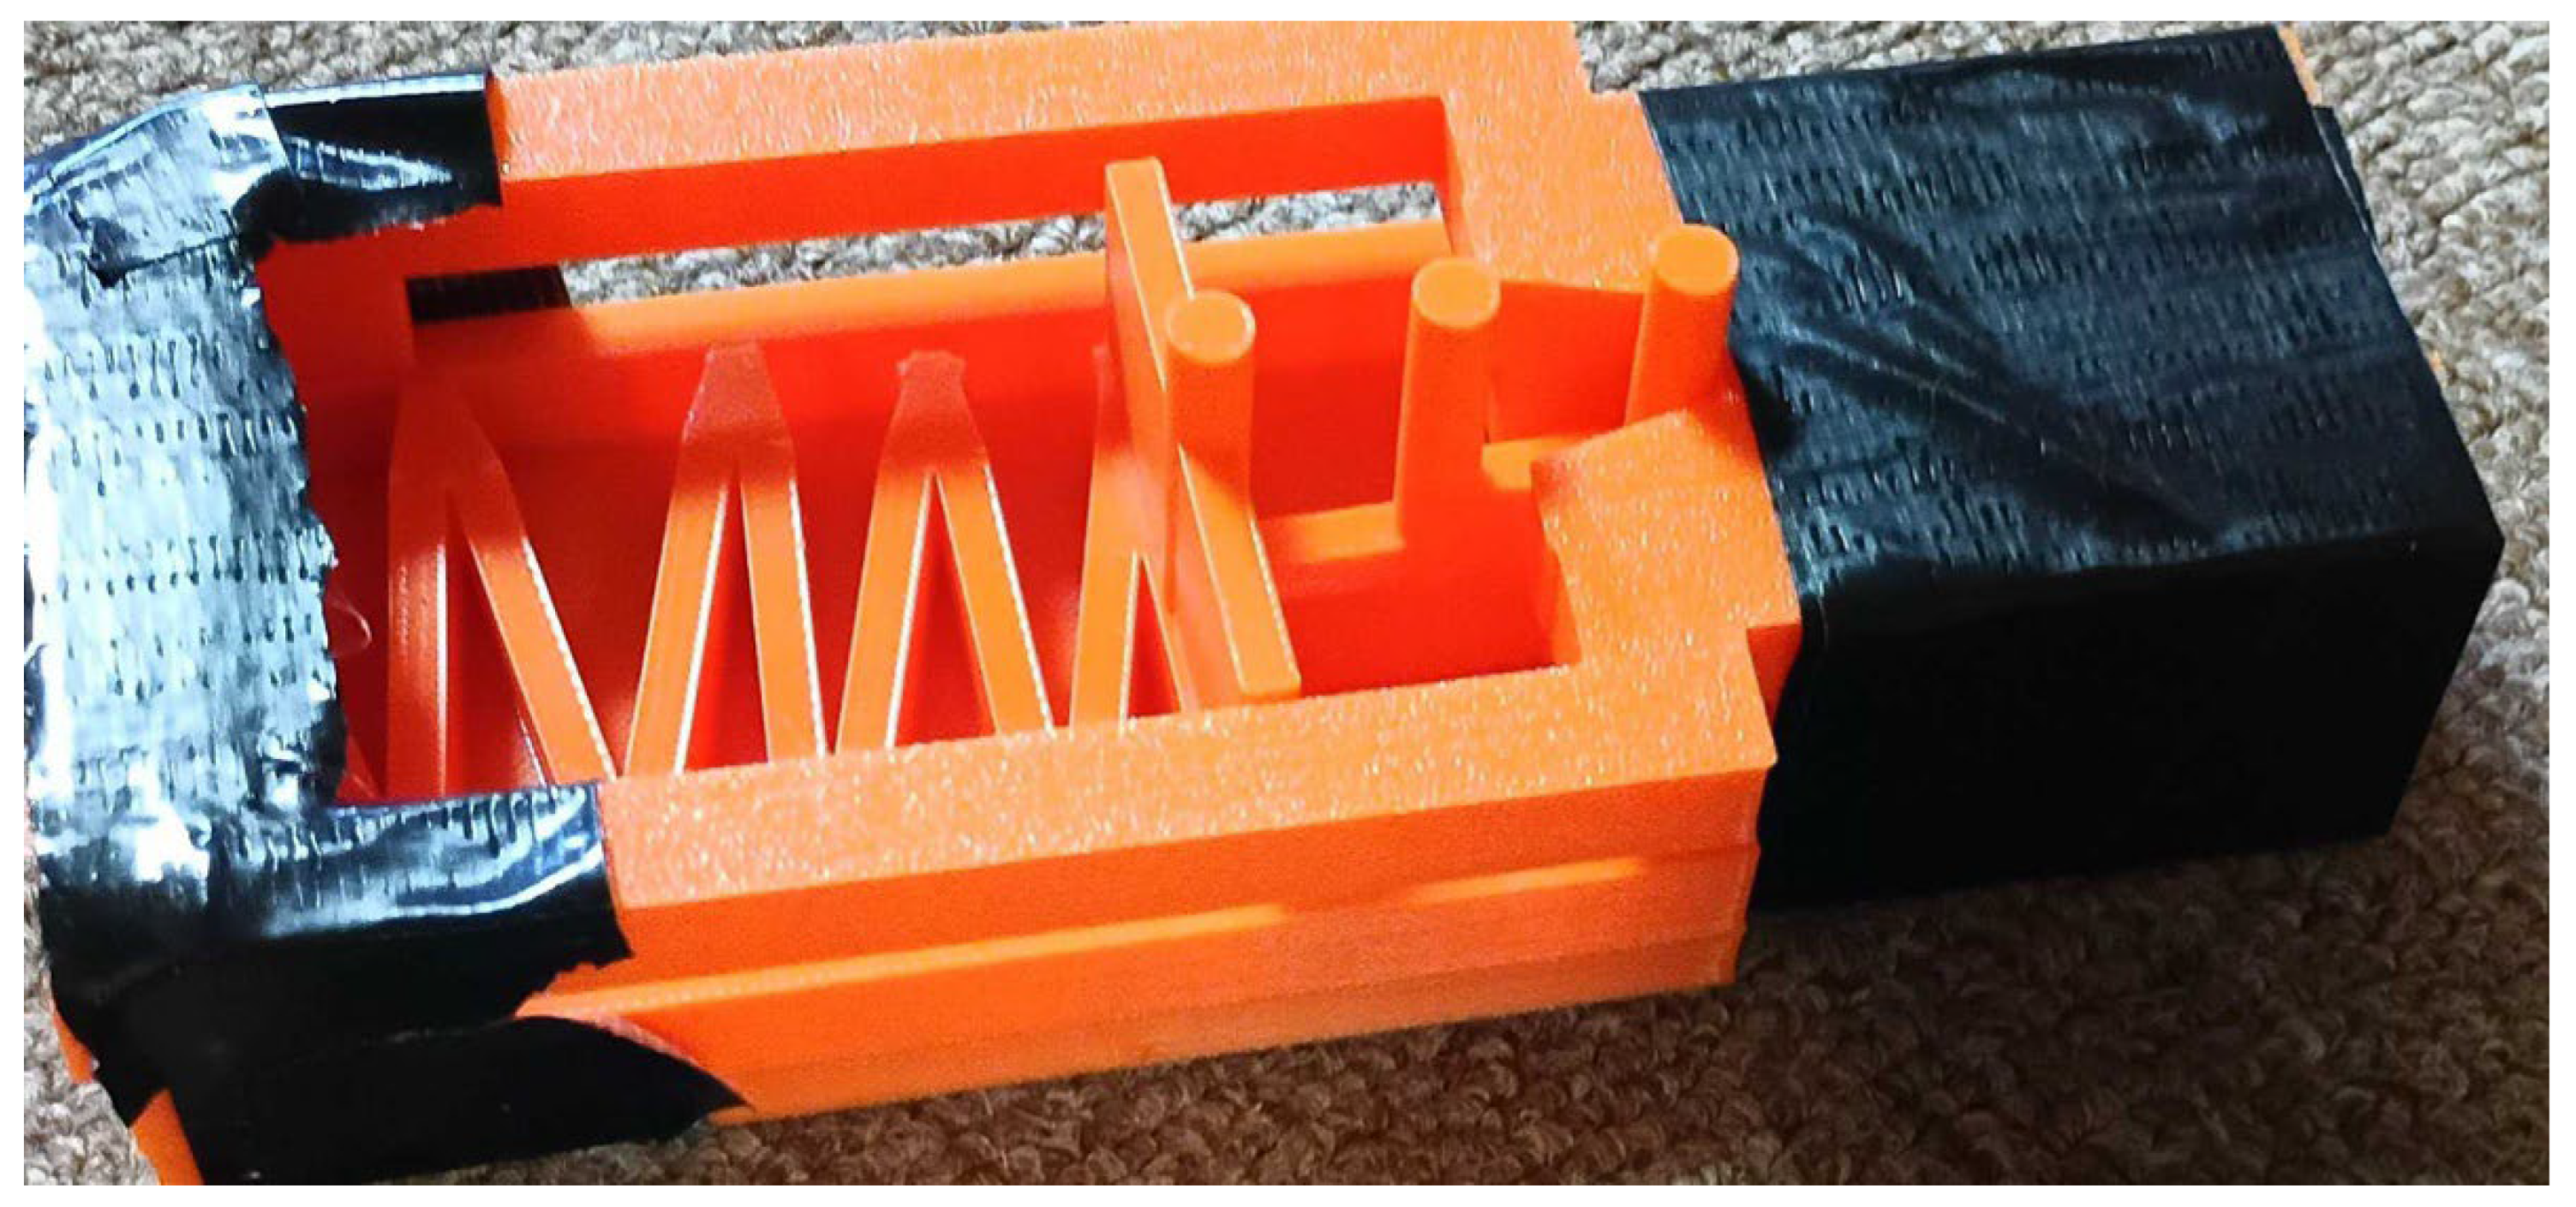
Figure 3.
Three dart types presented: A) Foam; B) 3D Printed; C) Combination of foam and 3D printed PLA.
Figure 3.
Three dart types presented: A) Foam; B) 3D Printed; C) Combination of foam and 3D printed PLA.
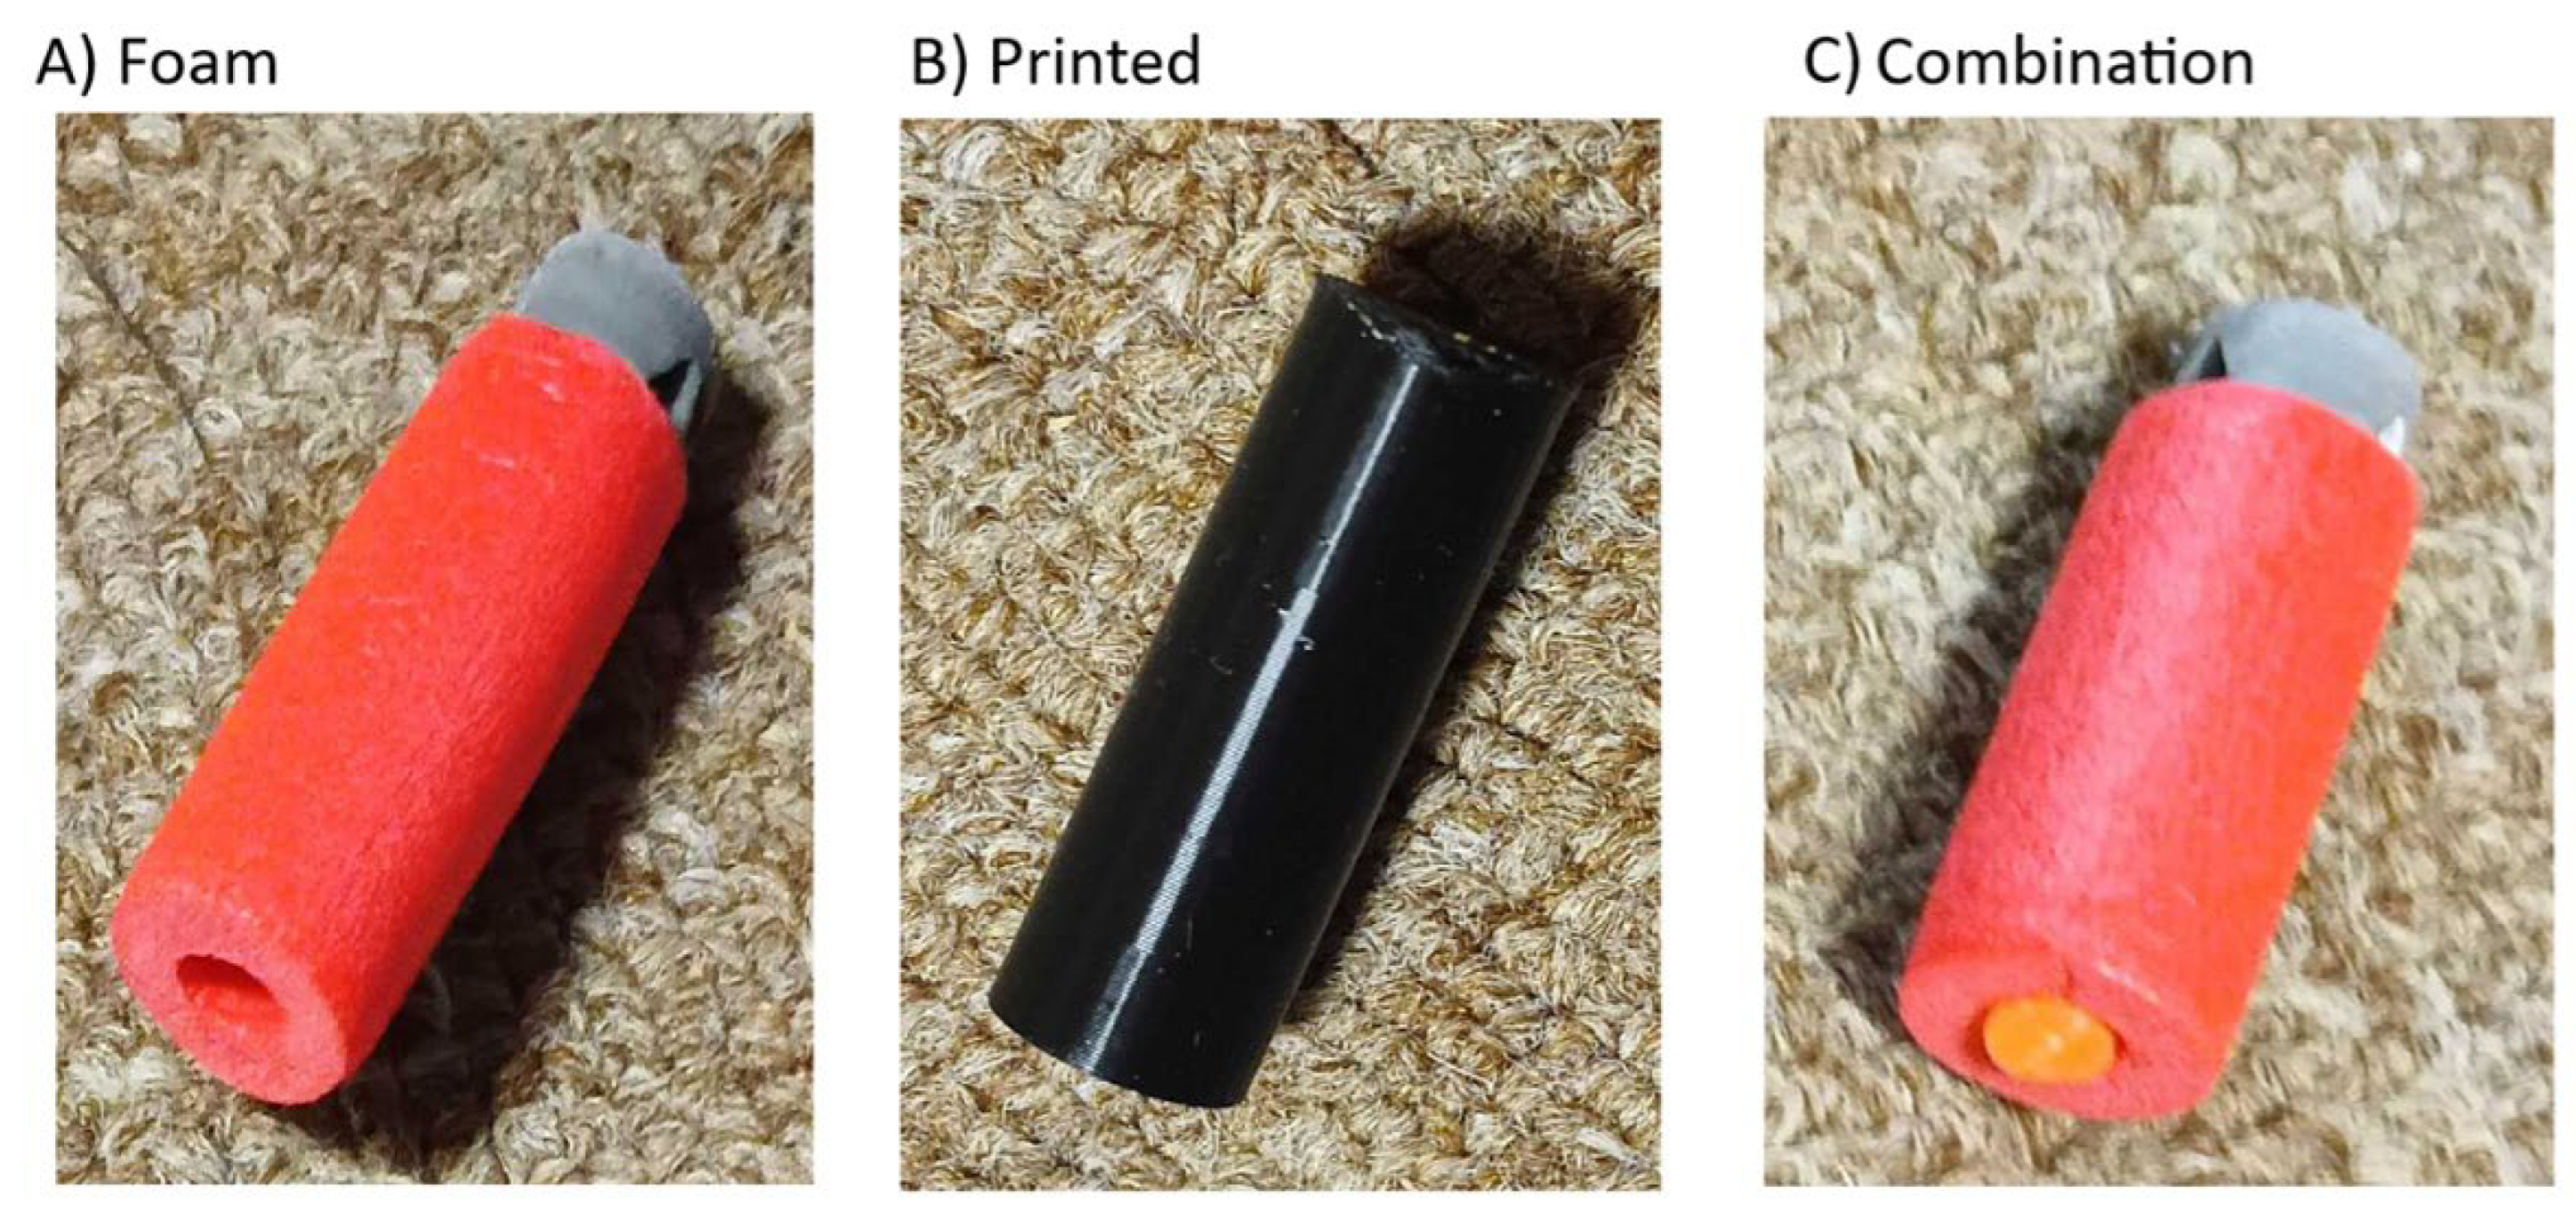
Figure 4.
Analysis of exit velocity and failure rates across experimental conditions. (a) Failure rate heatmap by tube and muzzle configuration. (b) Composite velocity (all 108 observations) by tube. (c) Conditional exit velocity (successful launches only) by tube. (d) Failure rate bar chart by factor level; dashed line denotes 50% threshold. (e) Composite velocity by muzzle. (f) Successful launch counts by cell (maximum = 9).
Figure 4.
Analysis of exit velocity and failure rates across experimental conditions. (a) Failure rate heatmap by tube and muzzle configuration. (b) Composite velocity (all 108 observations) by tube. (c) Conditional exit velocity (successful launches only) by tube. (d) Failure rate bar chart by factor level; dashed line denotes 50% threshold. (e) Composite velocity by muzzle. (f) Successful launch counts by cell (maximum = 9).
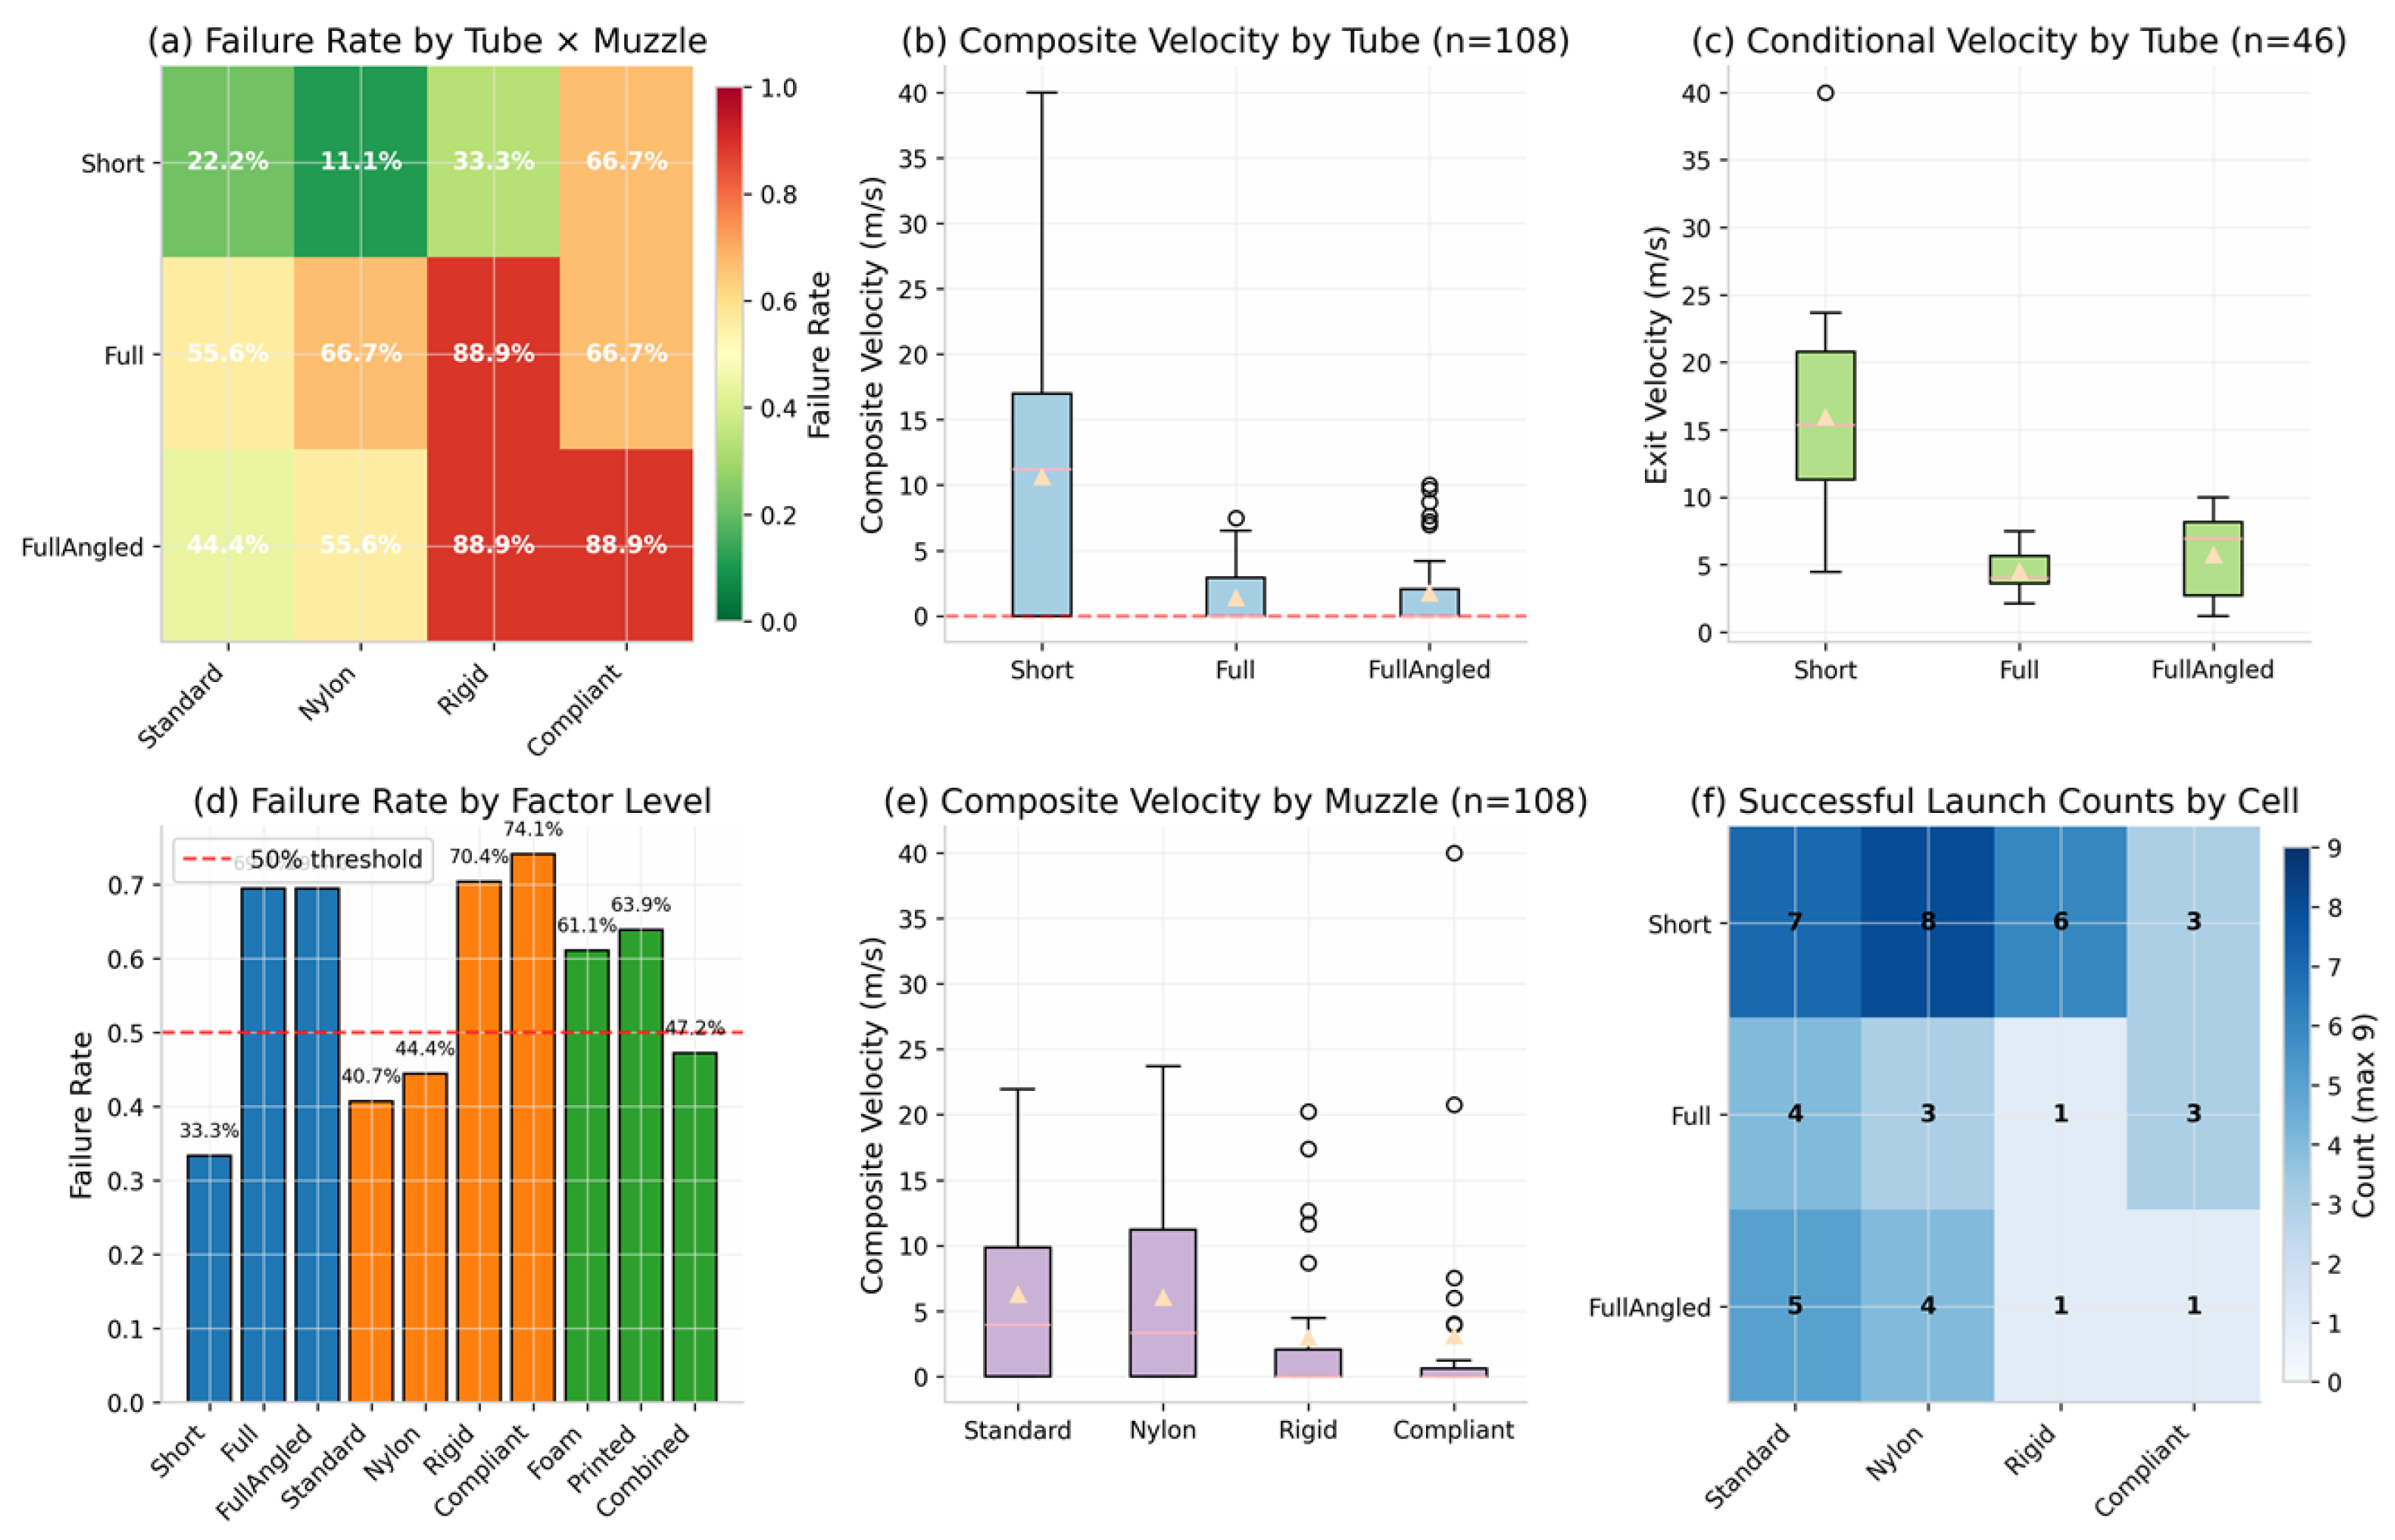
Figure 5.
Interaction and diagnostic plots. (a) Tube × Projectile interaction plot (conditional mean velocity ± SEM). (b) Tube × Muzzle interaction plot (conditional mean velocity ± SEM). (c) Distribution of successful launch velocities with mean and median indicated. (d) Logistic regression odds ratios for failure probability with 95% confidence intervals; vertical dashed line at OR-1.
Figure 5.
Interaction and diagnostic plots. (a) Tube × Projectile interaction plot (conditional mean velocity ± SEM). (b) Tube × Muzzle interaction plot (conditional mean velocity ± SEM). (c) Distribution of successful launch velocities with mean and median indicated. (d) Logistic regression odds ratios for failure probability with 95% confidence intervals; vertical dashed line at OR-1.
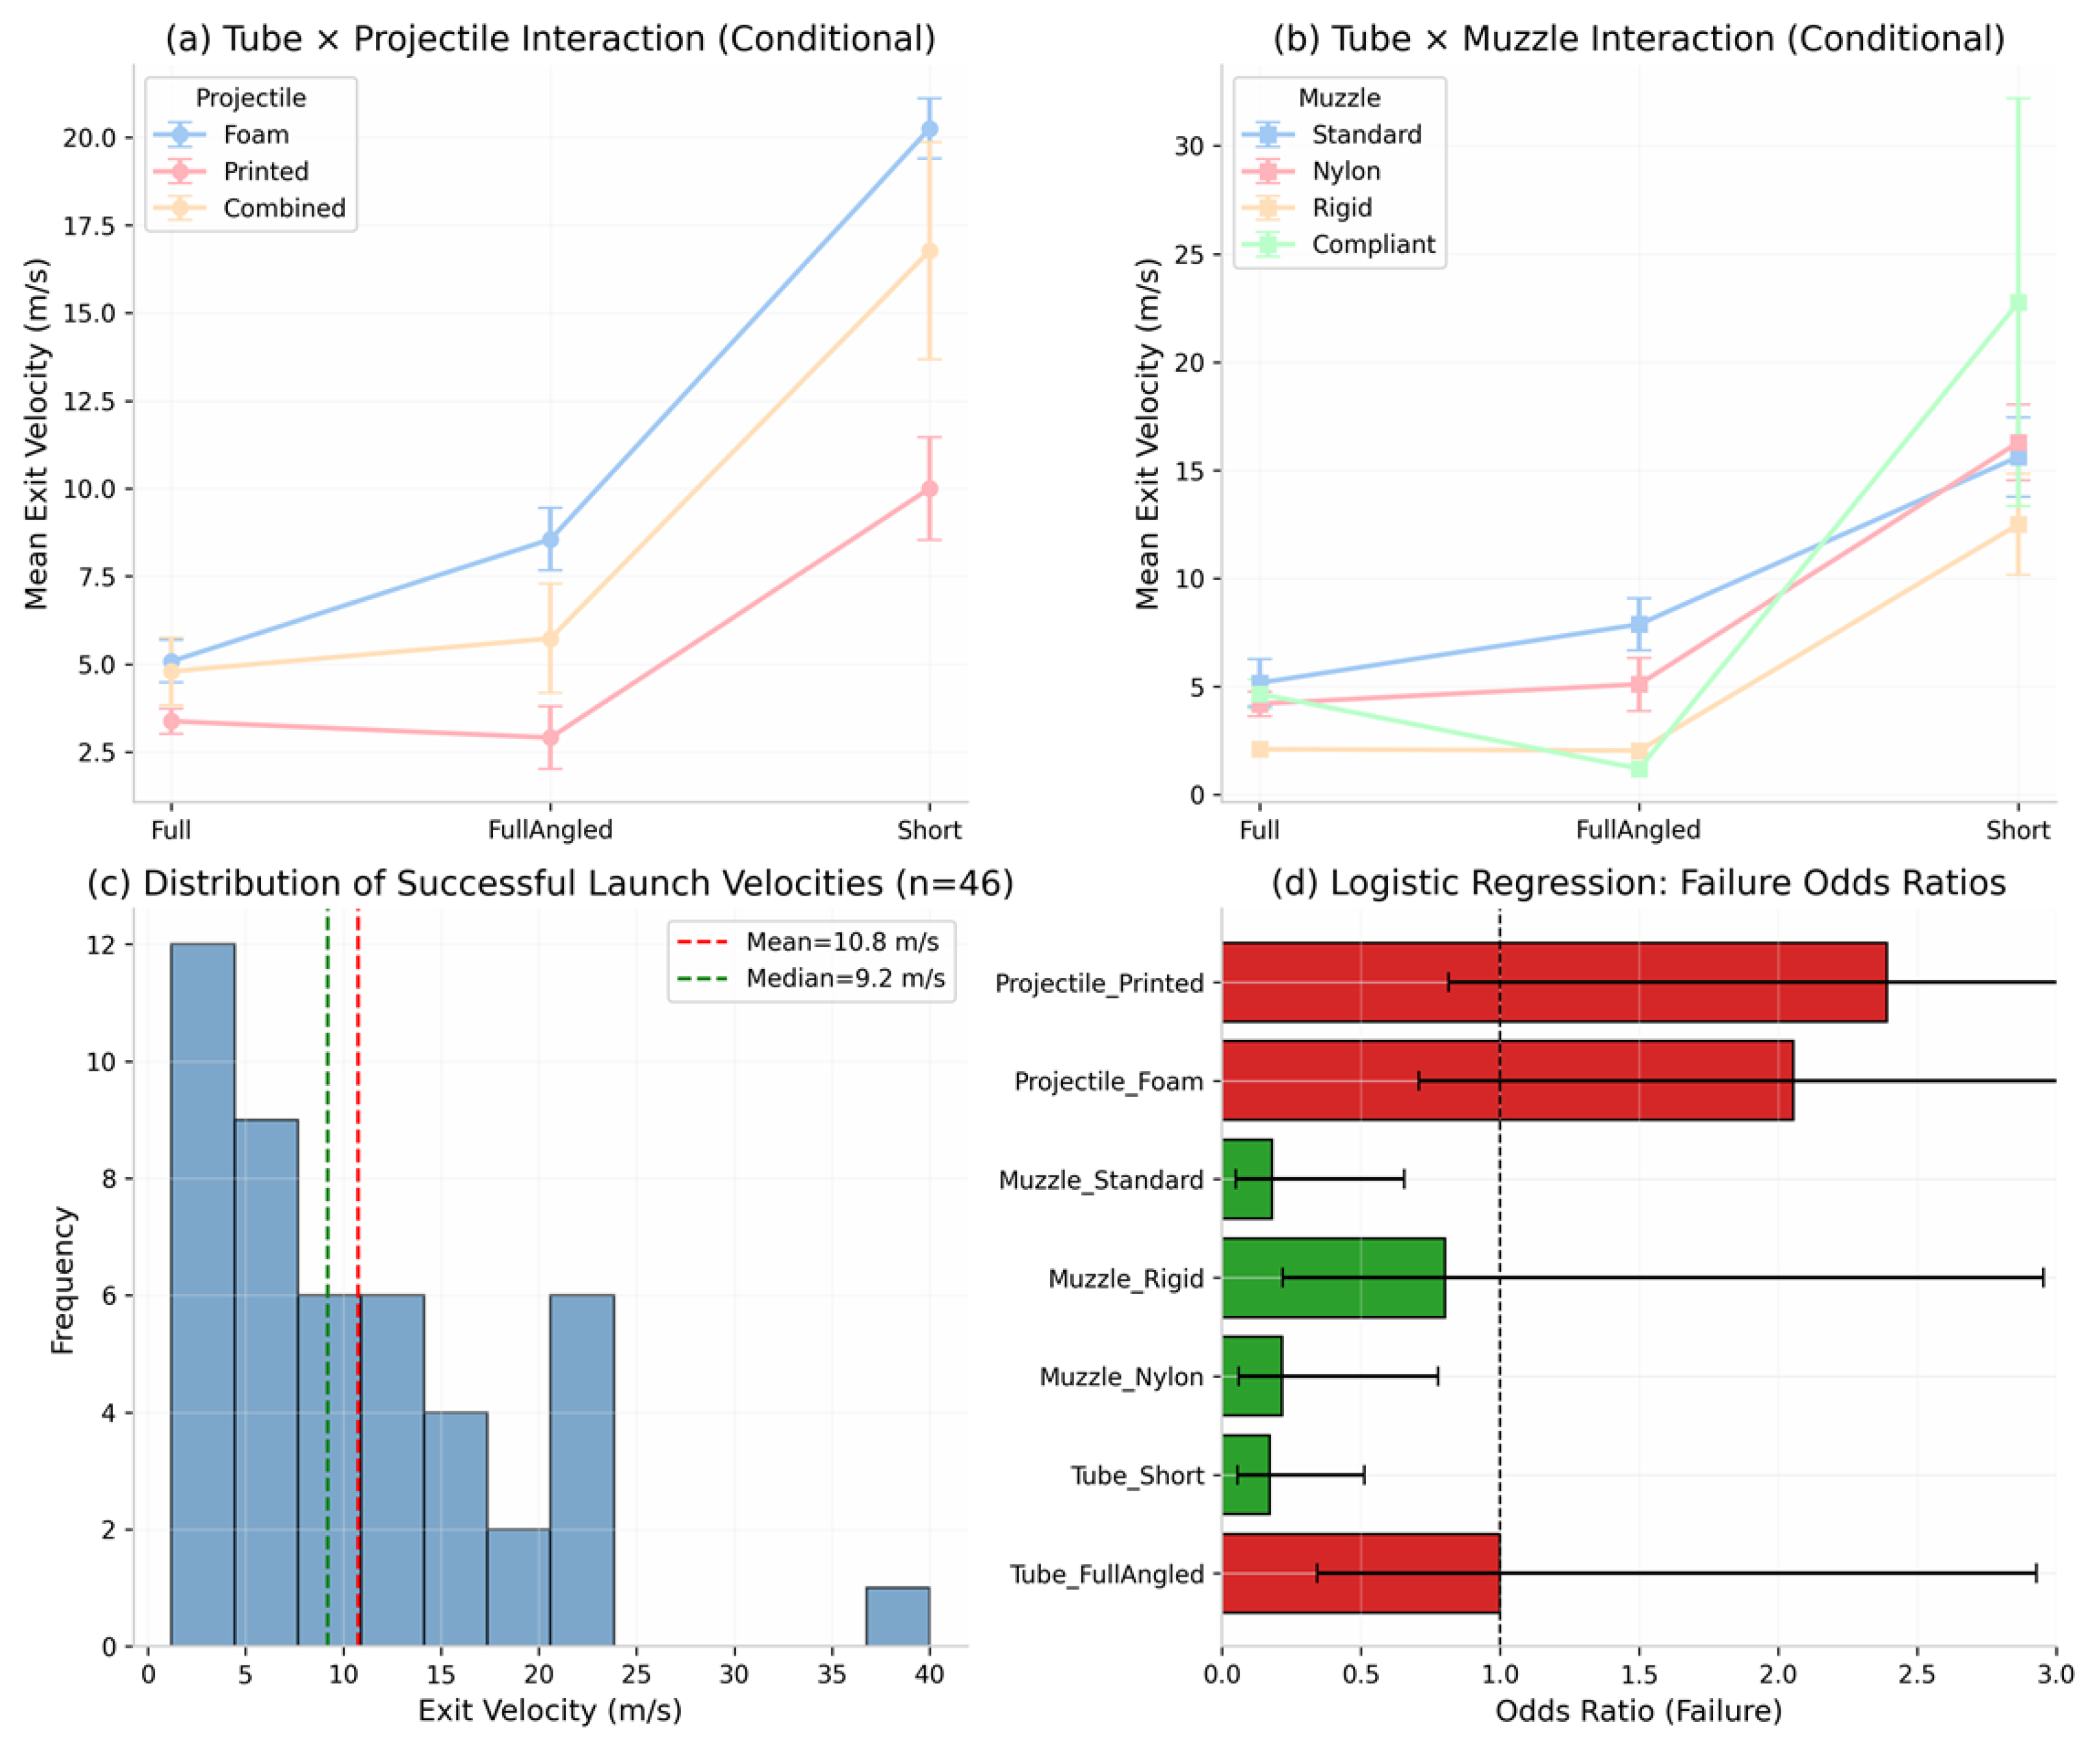

Table 1a.
Logistic regression results for launch failure probability (n = 108). Reference categories: Full tube, Compliant muzzle, Combined projectile.
Table 1a.
Logistic regression results for launch failure probability (n = 108). Reference categories: Full tube, Compliant muzzle, Combined projectile.
| Parameter | Odds Ratio | Std. Error | z | p-value | 95% CI Lower | 95% CI Upper |
|---|---|---|---|---|---|---|
| Intercept | 3.63 | 2.38 | 1.97 | 0.048 | 1.01 | 13.07 |
| Tube: Rigid Control | 0.17 | 0.10 | −3.16 | 0.002 | 0.05 | 0.50 |
| Tube: Full Angled Tensegrity | 1.00 | 0.55 | 0.00 | 1.000 | 0.34 | 2.93 |
| Muzzle: Standard | 0.22 | 0.14 | −2.61 | 0.009 | 0.06 | 0.77 |
| Muzzle: Nylon | 0.22 | 0.15 | −2.35 | 0.019 | 0.06 | 0.80 |
| Muzzle: Rigid | 0.80 | 0.53 | −0.33 | 0.740 | 0.22 | 2.93 |
| Projectile: Printed | 2.39 | 1.31 | 1.59 | 0.112 | 0.82 | 7.00 |
Table 1b.
Failure Mode and Effects Analysis (FMEA) criticality rankings.
| Failure Mode | Severity | Occurrence | Detection | Criticality | % of Total Criticality |
|---|---|---|---|---|---|
| Type 2 (Bore constriction) | 8 | 7 | 6 | 336 | 54.8% |
| Type 1 (Muzzle lodging) | 8 | 6 | 4 | 192 | 31.3% |
| Type 3 (Rifling obstruction) | 8 | 4 | 3 | 96 | 13.9% |
Table 2.
Number of successful launches by Tube, Muzzle, and Projectile (maximum per cell = 3).
| Tube | Muzzle | Foam | Printed | Combined |
|---|---|---|---|---|
| Rigid Control | Standard | 2 | 2 | 3 |
| Rigid Control | Nylon | 3 | 2 | 3 |
| Rigid Control | Rigid | 2 | 2 | 2 |
| Rigid Control | Compliant | 1 | 1 | 1 |
| Full Tensegrity | Standard | 1 | 1 | 2 |
| Full Tensegrity | Nylon | 1 | 1 | 1 |
| Full Tensegrity | Rigid | 0 | 0 | 1 |
| Full Tensegrity | Compliant | 1 | 1 | 1 |
| Full Angled Tensegrity | Standard | 2 | 1 | 2 |
| Full Angled Tensegrity | Nylon | 1 | 1 | 2 |
| Full Angled Tensegrity | Rigid | 0 | 0 | 1 |
| Full Angled Tensegrity | Compliant | 0 | 1 | 0 |
Disclaimer/Publisher’s Note: The statements, opinions and data contained in all publications are solely those of the individual author(s) and contributor(s) and not of MDPI and/or the editor(s). MDPI and/or the editor(s) disclaim responsibility for any injury to people or property resulting from any ideas, methods, instructions or products referred to in the content. |
© 2026 by the author. Licensee MDPI, Basel, Switzerland. This article is an open access article distributed under the terms and conditions of the Creative Commons Attribution (CC BY) license.
Copyright: This open access article is published under a Creative Commons CC BY 4.0 license, which permit the free download, distribution, and reuse, provided that the author and preprint are cited in any reuse.


