

Submitted:
08 July 2026
Posted:
09 July 2026
You are already at the latest version
Abstract
Background: Childhood obesity is a growing health concern and added sugar intake has been associated with increased obesity risk. Emerging evidence suggests that miR-143-5p and miR-223-3p are involved in metabolic regulation. Therefore, this study evaluated their plasma expression according to added sugar intake and their association with cardiometabolic risk parameters. Methods: In this cross-sectional study, 91 children aged 6 to 12 years were included (44 normal weight and 47 with overweight/obesity). Anthropometric, and clinical parameters, and dietary added sugar consumption were analyzed. RT-qPCR was performed to assess the expression of miR-143-5p and miR-223-3p in plasma. Results: Compared with low added sugar intake, high added sugar intake was associated with lower plasma miR-143-5p expression and higher miR-223-3p expression. Both miR-143-5p and miR-223-3p expression levels were higher in children with overweight/obesity and insulin resistance than in their respective counterparts. In adjusted analyses, neither miRNA was associated with cardiometabolic risk parameters. However, added sugar intake was positively associated with miR-223-3p expression (β = 0.188, 95% CI: 0.022, 0.354) and glucose levels (β = 1.944, 95% CI: 0.133, 3.755). Conclusions: High added sugar intake was associated with lower miR-143-5p expression, higher miR-223-3p expression, and increased fasting glucose concentrations in school-aged children, suggesting early alterations in metabolic regulation.
Keywords:
added sugar
; circulating microRNAs
; childhood obesity
; cardiometabolic factors
; insulin resistance
; miR-143-5p
; miR-223-3p
1. Introduction
Childhood obesity represents a growing global health challenge, given that overweight and obesity during childhood frequently persist into adulthood [1]. Epidemiological evidence has shown a marked worldwide rise in the number of children living with overweight and obesity. In particular, the prevalence of obesity among children aged 5 to 14 years increased more than threefold globally, from 2.0% in 1990 to 6.8% in 2021, and projections indicate that it could reach 15.6% by 2050 [2]. In addition, in Mexico, obesity has been reported in 18.8% of children between 5 and 11 years of age [3]. Childhood obesity is linked to the early development of cardiovascular risk factors, including hypertension, dyslipidemia, insulin resistance, and glucose intolerance [4].
Among the dietary factors associated with this condition, higher added sugar intake has been linked to weight gain and an increased risk of obesity in children [5,6,7]. In Mexico, the 2020-2022 National Health and Nutrition Survey (ENSANUT) [8] reported that added sugar intake among children aged 5 to 11 years was approximately 50 g/day, representing 12% of total energy intake. In addition, 66.9% of school-aged children consumed more than 10% of their daily energy intake from added sugar [8]. In this context, the World Health Organization (WHO) recommends reducing free sugar intake to less than 10% of total energy intake.
Emerging studies suggest that epigenetic factors such as microRNAs (miRNAs) play a role in metabolic regulation. MiRNAs are small, endogenous, single-stranded non-coding RNAs that play an important role in the post-transcriptional regulation of gene expression through their interaction with the 3′ untranslated region (3′UTR) of target messenger RNAs (mRNAs) [9]. miRNAs are released from cells into the circulation [10], where extracellular circulating miRNAs contribute to the regulation of whole-body metabolism through intercellular communication [11]. Circulating miRNAs have gained attention as novel biomarkers of obesity and related metabolic disorders [11,12].
Several studies have highlighted the important role of miR-143-5p in lipid metabolism, adipogenesis, and IR [13]. For instance, miR-143-5p is related to the induction of IR by regulating insulin signaling [14]. Also, this miRNA promotes lipid accumulation in adipocytes [15]. miR-223-3p is implicated in the inflammatory response [16] and has been linked to metabolic alterations related to obesity [17]. Moreover, experimental studies have reported that these miRNAs may be regulated by high-carbohydrate diets [18,19]. In this context, assessing the expression of these miRNAs in plasma is a minimally invasive strategy to investigate molecular alterations associated with dietary factors and obesity in children. Thus, the present study aimed to evaluate the association between added sugar intake and plasma expression of miR-143-5p and miR-223-3p in children, and whether the expression of these miRNAs was associated with cardiometabolic risk parameters.
2. Materials and Methods
Participants in the Study
The study population consisted of 91 unrelated children from Mexico City, aged 6 to 12 [44 normal weight (NW) and 47 with overweight and obesity (Ow/Ob)]. Participants were recruited at Family Medicine Unit No. 23 of the Instituto Mexicano del Seguro Social in Mexico City. The study was conducted to evaluate the association of added sugar intake with miRNA expression, obesity, and cardiometabolic risk factors. Children presenting with acute infections, chronic diseases, participation in a weight loss program, or fasting plasma glucose levels exceeding 126 mg/dL were excluded from the study.
Ethics Statement
The study was approved by the Ethics Committee of the Instituto Mexicano del Seguro Social (CONBIO-ETICA-09-CEI-009-20160601; approval number: R-2024-785-061) on 23 October 2024 and was conducted in accordance with the Declaration of Helsinki. Written informed consent was obtained from the parents or legal guardians of all participants, and assent was obtained from the participating children.
Anthropometric Assessment
According to standardized protocol, the following anthropometric measurements were performed to ensure accuracy, consistency, and data reliability. The procedure was performed by trained personnel with expertise in anthropometric techniques, using calibrated instruments under controlled conditions.
Each child participant underwent measurement of body weight, height, waist circumference, and hip circumference in a single session at the beginning of the study. Body weight was measured using a digital scale with a precision of 100 g (Seca, Hamburg, Germany). Children were weighed wearing light clothing and no shoes, standing upright in the center of the scale platform, maintaining a straight posture, and remaining still during the reading. For height measurement, a portable device with 0.1 cm resolution was utilized (Seca 225, Hamburg, Germany). The child stood barefoot, heels together, back straight, and head aligned in the horizontal plane (Frankfurt plane), ensuring contact between the heels, buttocks, scapulae, and head with the vertical surface. Waist circumference was measured using a 0.1 cm precision flexible tape measure, resistant to stretching, placed around the abdomen just above the upper edge of the iliac crest, and recorded at the end of a gentle expiration. The child stood upright in a relaxed posture, with arms hanging loosely at the sides and feet slightly apart. Hip circumference was measured with the same type of tape, placed horizontally around the most prominent part of the buttocks, ensuring the tape was level and did not compress the soft tissue. As with other measurements, the child stood still and relaxed throughout the procedure. Each measurement was recorded immediately on an individual data collection sheet and double-checked to ensure accuracy. Body mass index (BMI) was calculated as weight (kg) divided by height squared (m2). BMI values were converted into age- and sex-specific percentiles. The data were then processed using the WHO Anthro Plus software and evaluated according to the World Health Organization (WHO) growth standards [20]. Children were classified according to the WHO BMI-for-age reference for children and adolescents aged 5 to 19 years using BMI-for-age z-scores. Participants were categorized as having normal weight when their BMI-for-age z-score was ≥ −2 and ≤ +1 ZSD, overweight/obesity when it was > +1 Z [20].
Biochemical Assessment
In the morning, after an 8 h fast, venous blood samples were collected to determine the levels of glucose, insulin, low-density lipoprotein cholesterol (LDL-C), high-density lipoprotein cholesterol (HDL-C), total cholesterol (Total CHO), and triglycerides (TG). Serum concentrations of glucose, LDL-C, HDL-C, Total CHO, and TG were measured using an enzymatic colorimetric method on the ILab 350 Clinical Chemistry System (Instrumentation Laboratory IL, Barcelona, Spain). Fasting insulin levels were measured using the Elecsys Insulin Assay on the Cobas e411 immunoassay analyzer (Roche Diagnostics GmbH, Mannheim, Germany). Fasting glucose and insulin concentrations were used to calculate the homeostasis model assessment of IR (HOMA-IR) using the following formula: fasting insulin (µU/mL) × fasting glucose (mg/dL) / 405. IR was defined as HOMA-IR ≥3.16, based on a cutoff previously proposed for children and adolescents with obesity [21,22].
Assessment of Added Sugar Intake
A semi-quantitative food frequency questionnaire (FFQ) was used to assess dietary added sugar intake over the past month [23]. The FFQ was designed based on the Mexican ENSANUT for school-aged children, developed by the National Institute of Public Health, as a reference. Additionally, for some newly incorporated foods considered relevant to this population and study, reference portion sizes were estimated from 24-hour dietary recalls obtained from ENSANUT for school-aged children, and all portions were expressed using household measures. For the estimation of added sugars, an algorithm adapted from the methodological approach proposed by Louie et al. [24], as modified by our research group*, was applied using information from the Mexican Food Composition Database (BAM) [25]. The FFQ was analyzed following the same methodological criteria used in the analysis of grams and nutrients in the ENSANUT FFQ [26]. Children were classified as having high added sugar intake when consumption was ≥50 g/day and low added sugar intake when consumption was <50 g/day. This cutoff was defined based on a 2,000 kcal diet, which corresponded approximately to the average total energy intake of the study population.
miRNA Expression in Plasma
RNA extraction from plasma was performed using the miRNeasy Serum/Plasma Kit (Qiagen, Waltham, Hilden, Germany), according to the manufacturer’s instructions. During the RNA purification step, the same amount of cel-miR-39 spike-in control (Qiagen, Hilden, Germany) was added according to the provider’s recommendations and a previous publication [27]. The miRNA isolated from plasma was immediately converted to cDNA, as described below.
miRNAs were determined using two-step RT-qPCR with RT-primer specific assay in combination with TaqMan probes: hsa-miR-143-5p (Assay ID: 002146) and hsa-miR-223-3p (Assay ID: 002295) (Applied Biosystems; CA, USA). Each RT-reaction used 1.5 µL from the 14 µL eluted miRNA using the TaqMan MicroRNA Reverse Transcription Kit (Applied Biosystems; CA, USA). The RT-reaction program consisted of 30 minutes at 16 °C, 30 minutes at 42 °C, and 5 minutes at 85 °C.
The 1 μL of RT reaction was amplified in 10 μL reactions. PCR cycling conditions were initial denaturation at 95 °C for 10 min, followed by 45 cycles at 95 °C for 15 s, at 60 °C for 60 s, and at 72 °C for 1 s. PCR was performed using a 7900HT Fast Real-Time PCR System (Applied Biosystems, Foster City, CA, USA) with the Maxima Probe/ROX qPCR Master Mix (Thermo Scientific, Waltham, MA, USA). Relative miRNA expression levels were normalized with Ct values of cel-miR-39, and values were calculated using the 2−ΔΔCt formula. All Ct values for cel-miR-39 ranged from 20 to 22 cycles for total plasma miRNA isolations.
Statistical Analysis
Differences in population characteristics were evaluated using Student’s t-test for normally distributed variables and the Mann–Whitney U test for non-normally distributed variables. Categorical variables were compared using Pearson’s chi-squared test. The distribution of continuous variables was assessed using the Shapiro–Wilk test.
Exploratory associations between miRNAs expression, added sugar intake, and cardiometabolic risk parameters were examined using Spearman’s correlation coefficients, as well as Student’s t-test.
Linear regression models were subsequently used to examine adjusted associations. Models adjusted for sex, age, BMI and total energy intake assessed associations between (i) miRNA expression (dependent variable) and cardiometabolic parameters, as well as (ii) between added sugar intake (independent variable) and miRNA expression or cardiometabolic outcomes. To facilitate interpretation, added sugar intake was modeled as a continuous variable, with effect estimates expressed per 25 g/day increment in intake. For all analyses, a two-tailed p-value < 0.05 was considered statistically significant. All analyses were conducted using Stata software (version 19.5; StataCorp LLC, College Station, TX, USA).
3. Results
Study Population Characteristics
Table 1 shows the children’s general characteristics and health outcome variables. The mean age was 9.197 ± 1.802 years. Males comprised 52% of the sample, with a higher proportion among children with overweight/obesity (~62%). BMI, BMI Z-score, waist and hip circumferences, insulin, HOMA-IR, total CHO, and TG levels were significantly higher in children with overweight/obesity compared with those with normal weight (P < 0.05), whereas HDL-C levels were lower in children with overweight/obesity (P <0.001). No differences were observed in the participant’s age, glucose levels, LDL-C, and total energy or added sugar intake (P >0.05).
Expression of miRNAs miR-143-5p and miR-223-3p in Children with High and Low Added Sugar Intake
High added sugar intake was associated with altered plasma miRNA expression in children. As shown in Figure 1A, miR-143-5p expression levels (1.000 ± 0.218 vs 0.775 ± 0.2228; P < 0.001) were lower in children with high added sugar intake compared to those with low intake, whereas miR-223-3p expression levels (1.000 ± 0.142 vs 1.106 ± 0.162; P = 0.002) were higher in children with high added sugar intake than in those with low intake.
Among children with NW, those with high added sugar intake showed higher expression levels of miR-143-5p (1.000 ± 0.072 vs 2.823 ± 0.079; P < 0.001) (Figure 1B) and miR-223-3p (1.000 ± 0.064 vs 1.084 ± 0.072; P < 0.001) (Figure 1B) than those with low added sugar intake. Among children with Ow/Ob, miR-143-5p expression levels (1.000 ± 0.112 vs 0.845 ± 0.124; P < 0.001) were lower in children with high added sugar intake, whereas miR-223-3p expression levels (1.000 ± 0.088 vs 1.184 ± 0.084; P < 0.001) were higher (Figure 1C).
Subsequently, we evaluated miRNA expression levels in children according to nutritional status. Both miR-143-5p (1.000 ± 0.076 vs 5.354 ± 0.118; P < 0.001) and miR-223-3p expression (1.000 ± 0.069 vs 1.280 ± 0.086; P < 0.001) were higher in children with Ow/Ob compared with children with NW (Figure 2A and 2B).
We further examined whether miRNA expression differed by sex and nutritional status. As shown in Figure 3A, among children with NW, miR-143-5p expression was higher in girls than in boys (1.000 ± 0.075 vs 1.273 ± 0.107; P < 0.001), whereas miR-223-3p expression showed no significant differences (1.000 ± 0.075 vs 0.981 ± 0.076; P = 0.453). Conversely, among children with Ow/Ob, miR-223-3p expression (1.000 ± 0.086 vs 1.203 ± 0.091; P < 0.001) was higher in girls than in boys (Figure 3B), while miR-143-5p did not differ significantly among the groups (1.000 ± 0.106 vs 0.958 ± 0.139; P = 0.290) (Figure 3B).
Finally, we evaluated plasma miRNA expression according to IR status. Based on the established cutoff, 52.75% of the children were classified as having IR. As shown in Figure 4A, children with IR showed higher miR-143-5p expression levels than those without IR (1.000 ± 0.180 vs 4.371 ± 0.153; P < 0.001). Similarly, miR-223-3p expression levels were higher in children with IR (1.000 ± 0.118 vs 1.329 ± 0.111; P < 0.001) (Figure 4B)
Associations Between Plasma miR-143-5p and miR-223-3p Expression and Cardiometabolic Risk Parameters
Exploratory Spearman’s correlations between plasma miR-143-5p and miR-223-3p expression and clinical and cardiometabolic risk parameters are presented in Supplementary Table S1. In these analyses, miR-143-5p expression was negatively correlated with BMI, BMI Z-score, waist circumference, and hip circumference (P < 0.05), and positively correlated with HDL-C levels (P < 0.05). Similarly, miR-223-3p expression was negatively correlated with hip circumference and positively correlated with added sugar intake (P < 0.05) (Supplementary Table S1).
However, as shown in Table 2, no significant associations were found between miR-143-5p or miR-223-3p expression and the evaluated cardiometabolic parameters (P > 0.05).
Associations Between Added Sugar Intake and miRNA expression and Cardiometabolic Risk Parameters
Exploratory Spearman’s correlations between added sugar intake and cardiometabolic risk parameters are shown in Supplementary Table S2. According to these analyses, added sugar intake was positively correlated with miR-223-3p expression (P = 0.009) and glucose levels (P = 0.022). In the adjusted models, added sugar intake was positively associated with miR-223-3p expression (β = 0.188; 95% CI: 0.022 – 0.354; P = 0.027) and with glucose levels (β= 1.944; 95% CI: 0.133 – 3.755; P= 0.036) (Table 3). No significant associations were found for the remaining variables.
4. Discussion
The findings of this study suggest that added sugar intake is associated with alterations in circulating miRNA expression in children. Specifically, children with high added sugar intake exhibited lower plasma miR-143-5p expression and higher miR-223-3p expression compared with those with lower intakes. In addition, both miR-143-5p and miR-223-3p expression levels were higher in children with overweight/obesity and in those with insulin resistance. However, after adjustment, only added sugar intake remained positively associated with miR-223-3p expression and fasting glucose concentrations, whereas neither miRNA was associated with cardiometabolic risk parameters. Together, these findings suggest that added sugar intake may be related to specific circulating miRNAs involved in metabolic regulation, highlighting potential epigenetic pathways through which added sugars may affect metabolic health.
Childhood obesity is an emerging global health concern, as overweight and obesity during childhood have been shown to persist into adulthood [1], and higher added sugar intake has been associated with weight gain and an increased risk of obesity in children [5,6]. miRNAs are important regulators of metabolic balance [28]. Among these miRNAs, miR-143-5p and miR-223-3p have been implicated in metabolic regulation. miR-143 is conserved between humans and rats, and several studies have shown its important role in lipid metabolism, adipogenesis, and IR [13]. miR-223-3p has also been implicated in metabolic regulation and IR [29]. In our study, children with normal weight and high added sugar intake showed higher plasma miR-143-5p expression, whereas lower expression was observed in children with overweight/obesity. In the case of miR-223-3p, children with normal weight and overweight/obesity and high added sugar intake showed higher plasma miR-223-3p expression. A previous study showed that high-fructose intake increased miR-143-5p expression and reduced miR-223-3p expression in extracellular vesicles from plasma in murine models [19]. Conversely, high sucrose intake did not alter plasma levels [18].
After adjusting for sex, age, BMI, and total energy intake, added sugar intake in our study was positively associated with plasma miR-223-3p expression levels in children. Specifically, each 25 g/day increase in added sugar intake was associated with a 0.188-unit increase in plasma miR-223-3p expression, corresponding to an approximately 18.8% relative increase and suggesting a modest but potentially biologically relevant effect. In addition, each 25 g/day increase in added sugar intake was associated with an average 1.944 mg/dL increase in fasting glucose concentrations, supporting the relationship between higher added sugar consumption and early metabolic alterations in children. Taken together, these findings suggest a potential relationship between chronic added sugar intake and circulating miRNA expression. These results suggest that miR-223-3p may be particularly responsive to dietary sugars.
Additionally, plasma miR-143-5p expression was upregulated in children with overweight/obesity. This miRNA was negatively correlated with BMI, waist circumference, hip circumference and positively correlated with HDL-C levels. Similar results were found for serum miR-143-5p in children, adolescents, and adults with obesity [30,31]. In experimental models of high-fat diet-induced obesity, miR-143-5p expression was associated with body weight gain, mesenteric adipose tissue gain, and key adipogenesis markers [32]. Moreover, miR-143-5p promotes adipogenesis through the MAP2K5-ERK5 regulatory pathway [33]. Its inhibition decreases the expression of adipocyte-specific genes, such as PPAR-γ, aP2, and GLUT-4, as well as triglyceride levels. However, these associations were not maintained after adjustment.
miR-223-3p plasma expression was upregulated in children with overweight/obesity and negatively correlated with hip circumference. A study reported that plasma miR-223-3p expression was upregulated in children and adolescents with obesity and was inversely associated with obesity [34], suggesting that higher levels of this miRNA may be related to a lower probability of obesity. However, opposite results were observed in adults with obesity [31] and in patients with T2D [35]. In addition, miR-223-3p expression was upregulated in human omental adipose tissue from patients with obesity [36]. Functionally, miR-223-3p suppresses the pro-inflammatory activation of macrophages [37] and regulates NLRP3 and IL-1β production in mouse adipose tissue [38]. In vitro studies showed that TNF-α-stimulated preadipocytes, mimicking the inflammatory environment present in obesity, exhibited reduced secretion of this miRNA and increased intracellular accumulation, impairing glucose and lipid metabolism [35]. Moreover, studies have demonstrated that miR-223-3p promotes adipogenesis in mesenchymal stem cells [39] and human adipocytes [40]. Therefore, the altered expression of miR-143-5p and miR-223-3p in children with overweight/obesity may reflect adipose tissue dysfunction. However, neither miRNA was associated with cardiometabolic risk parameters in adjusted analyses.
No overall differences in plasma miR-143-5p and miR-223-3p expression were observed between boys and girls. However, when children were stratified by nutritional status, plasma miR-143-5p expression was upregulated in girls with normal weight, consistent with previous findings reported in boys and girls with normal weight [41]. Although the underlying mechanisms are not fully understood, this finding may be related to sex-specific differences in hormonal regulation, body composition, and pubertal development, which could modulate circulating miRNA profiles. Moreover, plasma miR-223-3p expression was upregulated in girls with overweight/obesity. Although sex-specific evidence for miR-223-3p in children is limited, altered circulating miR-223-3p levels have been reported in pediatric obesity [34], and sex-related differences in miRNA profiles have been described in adolescents with obesity [42]. Therefore, these findings suggest that the influence of sex on circulating miRNA expression may depend on nutritional and metabolic status. Nevertheless, these results should be interpreted cautiously, as sex-related differences in circulating miRNAs appear to be miRNA-specific and may vary according to population characteristics, age, metabolic status, and the biological matrix analyzed [43,44].
On the other hand, our study showed higher plasma miR-143-5p expression in children with IR. Previous in vitro studies demonstrated that FFAs, leptin, and resistin, key components of the obesogenic inflammatory microenvironment involved in IR, inhibited miR-143 expression in human adipocytes [45]. In addition, bone marrow macrophage-derived exosomal miR-143-5p has been shown to induce IR in hepatocytes by repressing MKP5 [46]. In our study, the expression levels of miR-223-3p were increased in children with IR. Similar findings have been reported in serum from adolescents with obesity and IR [47]. In contrast, a study conducted in adults with IR found that plasma miR-223-3p expression levels were lower and negatively correlated with the adipose tissue IR index [35]. In vitro studies have shown that the upregulation of miR-223-3p leads to the downregulation of GLUT4 in human adipocytes [48]. Moreover, miR-223-3p reduced the expression levels of NLRP3 mRNA, Bax and NLRP3 protein, thereby inhibiting apoptosis in endothelial cells [49]. Although both miR-143-5p and miR-223-3p were expressed at higher levels in children with IR, neither miRNA was associated with insulin, HOMA-IR, or glucose concentrations after adjustment for age, sex, BMI, and total energy intake. Therefore, these findings should be interpreted cautiously and may indicate that the roles of miR-143-5p and miR-223-3p in obesity-related IR are complex and may vary across tissues, cell types, and biological compartments analyzed.
Authors should discuss the results and how they can be interpreted from the perspective of previous studies and of the working hypotheses. The findings and their implications should be discussed in the broadest context possible. Future research directions may also be highlighted.
5. Conclusions
High added sugar intake was associated with altered plasma miRNA expression in children, characterized by lower miR-143-5p expression and higher miR-223-3p expression. In addition, both miR-143-5p and miR-223-3p expression levels were higher in children with overweight/obesity and in those with insulin resistance. After adjustment, added sugar intake was positively associated with miR-223-3p expression and fasting glucose concentrations, whereas neither miRNA was associated with cardiometabolic risk parameters. These findings suggest that added sugar intake may be related to specific circulating miRNAs involved in metabolic regulation, highlighting potential epigenetic pathways and early molecular alterations through which added sugars may affect metabolic health.
Supplementary Materials
The following supporting information can be downloaded at the website of this paper posted on Preprints.org.
Author Contributions
Conceptualization, A.H.-D.; methodology, A.C.-L., M.F.V.-R., L.J.-A., M.F.P.-H., J.J.P.-R., C.I.R.-S., A.R.-A., F.H., F.S.-M., and A.H.-D.; validation, M.C., and A.H.-D.; formal analysis, A.C.-L., M.F.V.-R., J.J.P-R., C.I.R.-S., F.H., M.C., and A.H.-D.; investigation, A.C.-L., M.F.V.-R., L.J.-A., M.F.P.-H., J.J.P.-R., C.I.R.-S., A.R.-A., F.H., F.S.-M., and A.H.-D.; resources, A.H.-D..; data curation, A.C.-L., M.F.V.-R., S.B.-V., C.I.R.-S., M.C., and A.H.-D.; writing—original draft preparation, A.C.-L, M.F.V.-R., and A.H.-D.; writing—review and editing, A.C.-L., M.F.V.-R., L.J-A., M.F.P.-H., J.J.P-R., S.B-V., C.I.R.-S., A.R.-A., F.H., F.S.-M., and A.H.-D.; visualization, A.H.-D.; supervision, A.H.-D.; project administration, L.J.-A., C.I.R.-S., A.R.-A., F.H., M.C., and A.H.-D., funding acquisition, A.H.-D. All authors have read and agreed to the published version of the manuscript.
Funding
This research received no external funding.
Institutional Review Board Statement
The study was conducted in accordance with the Declaration of Helsinki and approved by the Ethics Committee of the Instituto Mexicano del Seguro Social (CONBIO-ETICA-09-CEI-009-20160601; approval number: R-2024-785-061).
Informed Consent Statement
Informed consent was obtained from all subjects involved in the study.
Data Availability Statement
The raw data supporting the conclusions of this article will be made available by the authors on request due to ethical restrictions and the need to protect participant confidentiality in accordance with institutional guidelines.
Acknowledgments
We gratefully acknowledge Araceli Pérez Bautista and the staff of the clinical laboratory service for their essential contributions and dedicated support throughout this study.
Conflicts of Interest
The authors declare no conflicts of interest.
Abbreviations
The following abbreviations are used in this manuscript:
| 3′UTR | 3′ untranslated region |
| BMI | Body mass index |
| BMI Z-score | Body mass index Z-score |
| cDNA | Complementary DNA |
| CHO | Cholesterol |
| ENSANUT | National Health and Nutrition Survey |
| FFAs | Free fatty acids |
| FFQ | Food frequency questionnaire |
| GLUT-4 | Glucose transporter type 4 |
| HDL-C | High-density lipoprotein cholesterol |
| HOMA-IR | Homeostatic model assessment of insulin resistance |
| IL-1β | Interleukin-1 beta |
| IR | Insulin resistance |
| LDL-C | Low-density lipoprotein cholesterol |
| MAP2K5-ERK5 | Mitogen-activated protein kinase kinase 5–extracellular signal-regulated kinase 5 |
| miR-143-5p | microRNA-143-5p |
| miR-223-3p | microRNA-223-3p |
| miRNA | microRNA |
| mRNA | Messenger RNA |
| NLRP3 | NOD-like receptor family pyrin domain containing 3 |
| NW | Normal weight |
| Ow/Ob | Overweight/obesity |
| PPAR-γ | Peroxisome proliferator-activated receptor gamma |
| RNA | Ribonucleic acid |
| T2D | Type 2 diabetes |
| TG | Triglycerides |
| TNF-α | Tumor necrosis factor alpha |
| WHO | World Health Organization |
References
- Zhang, X.; Liu, J.; Ni, Y.; Yi, C.; Fang, Y.; Ning, Q.; Shen, B.; Zhang, K.; Liu, Y.; Yang, L.; et al. Global Prevalence of Overweight and Obesity in Children and Adolescents: A Systematic Review and Meta-Analysis. JAMA Pediatr. 2024, 178, 800–813. [Google Scholar] [CrossRef] [PubMed]
- Kerr, J.A.; Patton, G.C.; Cini, K.I.; Abate, Y.H.; Abbas, N.; Abd Al Magied, A.H.A.; Abd ElHafeez, S.; Abd-Elsalam, S.; Abdollahi, A.; Abdoun, M.; et al. Global, Regional, and National Prevalence of Child and Adolescent Overweight and Obesity, 1990–2021, with Forecasts to 2050: A Forecasting Study for the Global Burden of Disease Study 2021. The Lancet 2025, 405, 785–812. [Google Scholar] [CrossRef] [PubMed]
- Shamah-Levy, T.; Gaona-Pineda, E.B.; Cuevas-Nasu, L.; Morales-Ruan, C.; Valenzuela-Bravo, D.G.; Humarán, I.M.G.; Ávila-Arcos, M.A. Prevalencias de Sobrepeso y Obesidad En Población Escolar y Adolescente de México. Ensanut Continua 2020-2022. Salud Publica Mex. 2023, 65, s218–s224. [Google Scholar] [CrossRef] [PubMed]
- Grundy, S.M.; Bryan Brewer, H.; Cleeman, J.I.; Smith, S.C.; Lenfant, C.; Iii, A.; Bonow, R.O.; Eckel, R.H.; Einhorn, D.; Haffner, S.M.; et al. Definition of Metabolic Syndrome. Circulation 2004, 109, 433–438. [Google Scholar] [CrossRef] [PubMed]
- Magriplis, E.; Michas, G.; Petridi, E.; Chrousos, G.P.; Roma, E.; Benetou, V.; Cholopoulos, N.; Micha, R.; Panagiotakos, D.; Zampelas, A. Dietary Sugar Intake and Its Association with Obesity in Children and Adolescents. Children 2021, 8, 676. [Google Scholar] [CrossRef]
- Calcaterra, V.; Cena, H.; Magenes, V.C.; Vincenti, A.; Comola, G.; Beretta, A.; Di Napoli, I.; Zuccotti, G. Sugar-Sweetened Beverages and Metabolic Risk in Children and Adolescents with Obesity: A Narrative Review. Nutrients 2023, Vol. 15 15, 702. [Google Scholar] [CrossRef] [PubMed]
- Hernández-DíazCouder, A.; Paz-González, P.J.; Valdez-Garcia, M.; Ramírez-Silva, C.I.; Avila-Soto, K.I.; Pérez-Bautista, A.; Vazquez-Moreno, M.; Nava-Cabrera, A.; Romero-Nava, R.; Huang, F.; et al. Altered Expression of the MEG3, FTO, ATF4, and Lipogenic Genes in PBMCs from Children with Obesity and Its Associations with Added Sugar Intake. Nutrients 2025, 17, 2546. [Google Scholar] [CrossRef]
- Shamah-Levy, T.; Gaona-Pineda, E.B.; Rodríguez-Ramírez, S.; Morales-Ruan, C.; Cuevas-Nasu, L.; Méndez-Gómez-Humarán, I.; Valenzuela-Bravo, D.G.; Ávila-Arcos, M.A. Sobrepeso, Obesidad y Consumo de Azúcares En Población Escolar y Adolescente de México. Ensanut 2020-2022. Salud Publica Mex. 2023, 65, 570–580. [Google Scholar] [CrossRef] [PubMed]
- Vishnoi, A.; Rani, S. MiRNA Biogenesis and Regulation of Diseases: An Overview. Methods Mol. Biol. 2017, 1509, 1–10. [Google Scholar] [CrossRef] [PubMed]
- Valadi, H.; Ekström, K.; Bossios, A.; Sjöstrand, M.; Lee, J.J.; Lötvall, J.O. Exosome-Mediated Transfer of MRNAs and MicroRNAs Is a Novel Mechanism of Genetic Exchange between Cells. Nat. Cell Biol. 2007, 9 9, 654–659. [Google Scholar] [CrossRef] [PubMed]
- Huang-Doran, I.; Zhang, C.Y.; Vidal-Puig, A. Extracellular Vesicles: Novel Mediators of Cell Communication In Metabolic Disease. Trends Endocrinol. Metab. 2017, 28, 3–18. [Google Scholar] [CrossRef] [PubMed]
- Mori, M.A.; Ludwig, R.G.; Garcia-Martin, R.; Brandão, B.B.; Kahn, C.R. Extracellular MiRNAs: From Biomarkers to Mediators of Physiology and Disease. Cell Metab. 2019, 30, 656–673. [Google Scholar] [CrossRef] [PubMed]
- Liu, J.; Wang, H.; Zeng, D.; Xiong, J.; Luo, J.; Chen, X.; Chen, T.; Xi, Q.; Sun, J.; Ren, X.; et al. The Novel Importance of MiR-143 in Obesity Regulation. Int. J. Obes. (Lond) . 2023, 47, 100–108. [Google Scholar] [CrossRef] [PubMed]
- Jordan, S.D.; Krüger, M.; Willmes, D.M.; Redemann, N.; Wunderlich, F.T.; Brönneke, H.S.; Merkwirth, C.; Kashkar, H.; Olkkonen, V.M.; Böttger, T.; et al. Obesity-Induced Overexpression of MiRNA-143 Inhibits Insulin-Stimulated AKT Activation and Impairs Glucose Metabolism. Nat. Cell Biol. 2011, 13, 434–448. [Google Scholar] [CrossRef] [PubMed]
- Wang, T.; Li, M.; Guan, J.; Li, P.; Wang, H.; Guo, Y.; Shuai, S.; Li, X. MicroRNAs MiR-27a and MiR-143 Regulate Porcine Adipocyte Lipid Metabolism. Int. J. Mol. Sci. 2011, 12, 7950–7959. [Google Scholar] [CrossRef] [PubMed]
- Li, T.; Morgan, M.J.; Choksi, S.; Zhang, Y.; Kim, Y.-S.; Liu, Z. MicroRNAs Modulate the Noncanonical Transcription Factor NF-ΚB Pathway by Regulating Expression of the Kinase IKKα during Macrophage Differentiation. Nat. Immunol. 2010, 11, 799–805. [Google Scholar] [CrossRef] [PubMed]
- Sud, N.; Zhang, H.; Pan, K.; Cheng, X.; Cui, J.; Su, Q. Aberrant Expression of MicroRNA Induced by High-Fructose Diet: Implications in the Pathogenesis of Hyperlipidemia and Hepatic Insulin Resistance. J. Nutr. Biochem. 2017, 43, 125–131. [Google Scholar] [CrossRef] [PubMed]
- Yerlikaya, F.H.; Öz, M. Aberrant Expression of MiRNA Profiles in High-Fat and High-Sucrose Fed Rats. Clin. Nutr. Exp. 2019, 27, 1–8. [Google Scholar] [CrossRef]
- Hernández-Díazcouder, A.; González-Ramírez, J.; Giacoman-Martínez, A.; Cardoso-Saldaña, G.; Martínez-Martínez, E.; Osorio-Alonso, H.; Márquez-Velasco, R.; Sánchez-Gloria, J.L.; Juárez-Vicuña, Y.; Gonzaga, G.; et al. High Fructose Exposure Modifies the Amount of Adipocyte-Secreted MicroRNAs into Extracellular Vesicles in Supernatants and Plasma. PeerJ 2021, 9, e11305. [Google Scholar] [CrossRef] [PubMed]
- World Health Organization Application Tools. Available online: https://www.who.int/tools/growth-reference-data-for-5to19-years/application-tools (accessed on 20 July 2025).
- Keskin, M.; Kurtoglu, S.; Kendirci, M.; Atabek, M.E.; Yazici, C. Homeostasis Model Assessment Is More Reliable than the Fasting Glucose/Insulin Ratio and Quantitative Insulin Sensitivity Check Index for Assessing Insulin Resistance among Obese Children and Adolescents. Pediatrics 2005, 115. [Google Scholar] [CrossRef] [PubMed]
- García Cuartero, B.; García Lacalle, C.; Jiménez Lobo, C.; González Vergaz, A.; Calvo Rey, C.; Alcázar Villar, M.J.; Díaz Martínez, E. Índice HOMA y QUICKI, Insulina y Péptido C En Niños Sanos. Puntos de Corte de Riesgo Cardiovascular. An. Pediatr. (Engl. Ed) . 2007, 66, 481–490. [Google Scholar] [CrossRef] [PubMed]
- Gaona-Pineda, E.B.; Mejía-Rodríguez, F.; Cuevas-Nasu, L.; Gómez-Acosta, L.M.; Rangel-Baltazar, E.; Flores-Aldana, M.E. Dietary Intake and Adequacy of Energy and Nutrients in Mexican Adolescents: Results from Ensanut 2012. Salud Publica Mex. 2018, 60, 404–413. [Google Scholar] [CrossRef] [PubMed]
- Louie, J.C.Y.; Moshtaghian, H.; Boylan, S.; Flood, V.M.; Rangan, A.M.; Barclay, A.W.; Brand-Miller, J.C.; Gill, T.P. A Systematic Methodology to Estimate Added Sugar Content of Foods. Eur. J. Clin. Nutr. 2015, 69, 154–161. [Google Scholar] [CrossRef] [PubMed]
- Ramírez-Silva, I.; Barragán-Vázquez, S.; Mongue-Urrea, A.; Mejía-Rodríguez, F.; Rodríguez-Ramírez, S.; Rivera-Dommarco, J. Base de Alimentos de México 2012 (BAM): Compilación de La Composición de Los Alimentos Frecuentemente Consumidos En El País. Versión 18.1.2 2023. Available online: https://insp.mx/informacion-relevante/bam-bienvenida (accessed on 31 January 2024).
- Ramírez-Silva, I.; Jiménez-Aguilar, A.; Valenzuela-Bravo, D.; Martinez-Tapia, B.; Rodríguez-Ramírez, S.; Gaona-Pineda, E.B.; Angulo-Estrada, S.; Shamah-Levy, T. Methodology for Estimating Dietary Data from the Semi-Quantitative Food Frequency Questionnaire of the Mexican National Health and Nutrition Survey 2012. Salud Publica Mex. 2016, 58, 629. [Google Scholar] [CrossRef] [PubMed]
- Enderle, D.; Spiel, A.; Coticchia, C.M.; Berghoff, E.; Mueller, R.; Schlumpberger, M.; Sprenger-Haussels, M.; Shaffer, J.M.; Lader, E.; Skog, J.; et al. Characterization of RNA from Exosomes and Other Extracellular Vesicles Isolated by a Novel Spin Column-Based Method. PLoS ONE 2015, 10, e0136133. [Google Scholar] [CrossRef] [PubMed]
- Agbu, P.; Carthew, R.W. MicroRNA-Mediated Regulation of Glucose and Lipid Metabolism. Nat. Rev. Mol. Cell Biol. 2021 22:6 2021, 22, 425–438. [Google Scholar] [CrossRef] [PubMed]
- Ye, D.; Zhang, T.; Lou, G.; Liu, Y. Role of MiR-223 in the Pathophysiology of Liver Diseases. Exp. Mol. Med. 2018, 50 50, 1–12. [Google Scholar] [CrossRef] [PubMed]
- Can, U.; Buyukinan, M.; Yerlikaya, F.H. The Investigation of Circulating MicroRNAs Associated with Lipid Metabolism in Childhood Obesity. Pediatr. Obes. 2016, 11, 228–234. [Google Scholar] [CrossRef] [PubMed]
- Kilic, I.D.; Dodurga, Y.; Uludag, B.; Alihanoglu, Y.I.; Yildiz, B.S.; Enli, Y.; Secme, M.; Bostanci, H.E. MicroRNA -143 and -223 in Obesity. Gene 2015, 560, 140–142. [Google Scholar] [CrossRef] [PubMed]
- Takanabe, R.; Ono, K.; Abe, Y.; Takaya, T.; Horie, T.; Wada, H.; Kita, T.; Satoh, N.; Shimatsu, A.; Hasegawa, K. Up-Regulated Expression of MicroRNA-143 in Association with Obesity in Adipose Tissue of Mice Fed High-Fat Diet. Biochem. Biophys. Res. Commun. 2008, 376, 728–732. [Google Scholar] [CrossRef] [PubMed]
- Esau, C.; Kang, X.; Peralta, E.; Hanson, E.; Marcusson, E.G.; Ravichandran, L. V.; Sun, Y.; Koo, S.; Perera, R.J.; Jain, R.; et al. MicroRNA-143 Regulates Adipocyte Differentiation. J. Biol. Chem. 2004, 279, 52361–52365. [Google Scholar] [CrossRef] [PubMed]
- Ma, F.; Cao, D.; Liu, Z.; Li, Y.; Ouyang, S.; Wu, J. Identification of Novel Circulating MiRNAs Biomarkers for Healthy Obese and Lean Children. BMC Endocr. Disord. 2023, 23, 238. [Google Scholar] [CrossRef]
- Sánchez-Ceinos, J.; Rangel-Zuñiga, O.A.; Clemente-Postigo, M.; Podadera-Herreros, A.; Camargo, A.; Alcalá-Diaz, J.F.; Guzmán-Ruiz, R.; López-Miranda, J.; Malagón, M.M. MiR-223-3p as a Potential Biomarker and Player for Adipose Tissue Dysfunction Preceding Type 2 Diabetes Onset. Mol. Ther. Nucleic Acids 2021. [Google Scholar] [CrossRef] [PubMed]
- Deiuliis, J.A.; Syed, R.; Duggineni, D.; Rutsky, J.; Rengasamy, P.; Zhang, J.; Huang, K.; Needleman, B.; Mikami, D.; Perry, K.; et al. Visceral Adipose MicroRNA 223 Is Upregulated in Human and Murine Obesity and Modulates the Inflammatory Phenotype of Macrophages. PLoS ONE 2016, 11, e0165962. [Google Scholar] [CrossRef] [PubMed]
- Zhuang, G.; Meng, C.; Guo, X.; Cheruku, P.S.; Shi, L.; Xu, H.; Li, H.; Wang, G.; Evans, A.R.; Safe, S.; et al. A Novel Regulator of Macrophage Activation: MiR-223 in Obesity-Associated Adipose Tissue Inflammation. Circulation 2012, 125, 2892–2903. [Google Scholar] [CrossRef] [PubMed]
- Bauernfeind, F.; Rieger, A.; Schildberg, F.A.; Knolle, P.A.; Schmid-Burgk, J.L.; Hornung, V. NLRP3 Inflammasome Activity Is Negatively Controlled by MiR-223. J. Immunol. 2012, 189, 4175–4181. [Google Scholar] [CrossRef] [PubMed]
- Guan, X.; Gao, Y.; Zhou, J.; Wang, J.; Zheng, F.; Guo, F.; Chang, A.; Li, X.; Wang, B. MiR-223 Regulates Adipogenic and Osteogenic Differentiation of Mesenchymal Stem Cells Through a C/EBPs/MiR-223/FGFR2 Regulatory Feedback Loop. Stem Cells 2015, 33, 1589–1600. [Google Scholar] [CrossRef] [PubMed]
- Guglielmi, V.; D’Adamo, M.; Menghini, R.; Cardellini, M.; Gentileschi, P.; Federici, M.; Sbraccia, P. MicroRNA 21 Is Up-Regulated in Adipose Tissue of Obese Diabetic Subjects. Nutr. Healthy Aging 2017, 4, 141–145. [Google Scholar] [CrossRef] [PubMed]
- Can, U.; Buyukinan, M.; Yerlikaya, F.H. The Investigation of Circulating MicroRNAs Associated with Lipid Metabolism in Childhood Obesity. Pediatr. Obes. 2016, 11, 228–234. [Google Scholar] [CrossRef] [PubMed]
- Karere, G.M.; Cox, L.A.; Bishop, A.C.; South, A.M.; Shaltout, H.A.; Mercado-Deane, M.G.; Cuda, S. Sex Differences in MicroRNA Expression and Cardiometabolic Risk Factors in Hispanic Adolescents with Obesity. J. Pediatr. 2021, 235, 138–143.e5. [Google Scholar] [CrossRef] [PubMed]
- Karere, G.M.; Cox, L.A.; Bishop, A.C.; South, A.M.; Shaltout, H.A.; Mercado-Deane, M.G.; Cuda, S. Sex Differences in MicroRNA Expression and Cardiometabolic Risk Factors in Hispanic Adolescents with Obesity. J. Pediatr. 2021, 235, 138–143.e5. [Google Scholar] [CrossRef] [PubMed]
- Oses, M.; Sanchez, J.M.; Portillo, M.P.; Aguilera, C.M.; Labayen, I. Circulating MiRNAs as Biomarkers of Obesity and Obesity-Associated Comorbidities in Children and Adolescents: A Systematic Review. Nutrients 2019, 11. [Google Scholar] [CrossRef] [PubMed]
- Zhu, L.; Shi, C.; Ji, C.; Xu, G.; Chen, L.; Yang, L.; Fu, Z.; Cui, X.; Lu, Y.; Guo, X. FFAs and Adipokine-Mediated Regulation of Hsa-MiR-143 Expression in Human Adipocytes. Mol. Biol. Rep. 2013, 40, 5669–5675. [Google Scholar] [CrossRef]
- Li, L.; Zuo, H.; Huang, X.; Shen, T.; Tang, W.; Zhang, X.; An, T.; Dou, L.; Li, J. Bone Marrow Macrophage-Derived Exosomal MiR-143-5p Contributes to Insulin Resistance in Hepatocytes by Repressing MKP5. Cell Prolif. 2021, 54, e13140. [Google Scholar] [CrossRef] [PubMed]
- Lin, H.; Tas, E.; Børsheim, E.; Mercer, K.E. Circulating Mirna Signatures Associated with Insulin Resistance in Adolescents with Obesity. Diabetes Metab. Syndr. Obes. 2020, 13, 4929–4939. [Google Scholar] [CrossRef] [PubMed]
- Chuang, T.Y.; Wu, H.L.; Chen, C.C.; Gamboa, G.M.; Layman, L.C.; Diamond, M.P.; Azziz, R.; Chen, Y.H. MicroRNA-223 Expression Is Upregulated in Insulin Resistant Human Adipose Tissue. J. Diabetes Res. 2015, 2015, 2–10. [Google Scholar] [CrossRef] [PubMed]
- Deng, B.; Hu, Y.; Sheng, X.; Zeng, H.; Huo, Y. MiR-223-3p Reduces High Glucose and High Fat-induced Endothelial Cell Injury in Diabetic Mice by Regulating NLRP3 Expression. Exp. Ther. Med. 2020, 20, 1514–1520. [Google Scholar] [CrossRef] [PubMed]
Figure 1.
Plasma miRNA expression in children with NW and Ow/Ob stratified by low and high added sugar intake. (A) miR-143-5p and miR-223-3p expression in total children (green bars), (B) miR-143-5p and miR-223-3p expression in children with NW (blue bars), and (C) miR-143-5p and miR-223-3p expression in children with Ow/Ob (red bars). miRNA expression was measured by RT-qPCR using cel-miR-39 as the reference for the 2-ΔΔCt method. Differences were tested using the unpaired t-test. Results are presented as mean ± SD.
Figure 1.
Plasma miRNA expression in children with NW and Ow/Ob stratified by low and high added sugar intake. (A) miR-143-5p and miR-223-3p expression in total children (green bars), (B) miR-143-5p and miR-223-3p expression in children with NW (blue bars), and (C) miR-143-5p and miR-223-3p expression in children with Ow/Ob (red bars). miRNA expression was measured by RT-qPCR using cel-miR-39 as the reference for the 2-ΔΔCt method. Differences were tested using the unpaired t-test. Results are presented as mean ± SD.
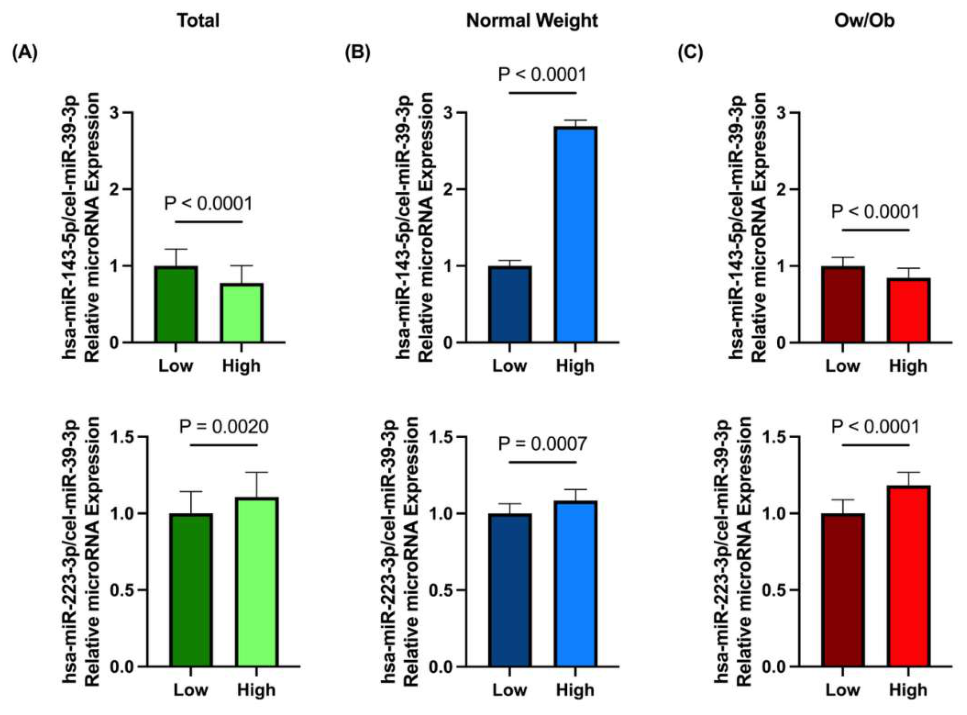
Figure 2.
The plasma miRNA expression in children with NW and with Ow/Ob. (A) miR-143-5p expression and (B) miR-223-3p expression. miRNA expression was measured by RT-qPCR using cel-miR-39 as a reference for the 2-ΔΔCt method. Differences were tested by an unpaired t-test. Results are presented as mean ± SD. NW: normal weight; Ow/Ob: Overweight/Obesity.
Figure 2.
The plasma miRNA expression in children with NW and with Ow/Ob. (A) miR-143-5p expression and (B) miR-223-3p expression. miRNA expression was measured by RT-qPCR using cel-miR-39 as a reference for the 2-ΔΔCt method. Differences were tested by an unpaired t-test. Results are presented as mean ± SD. NW: normal weight; Ow/Ob: Overweight/Obesity.
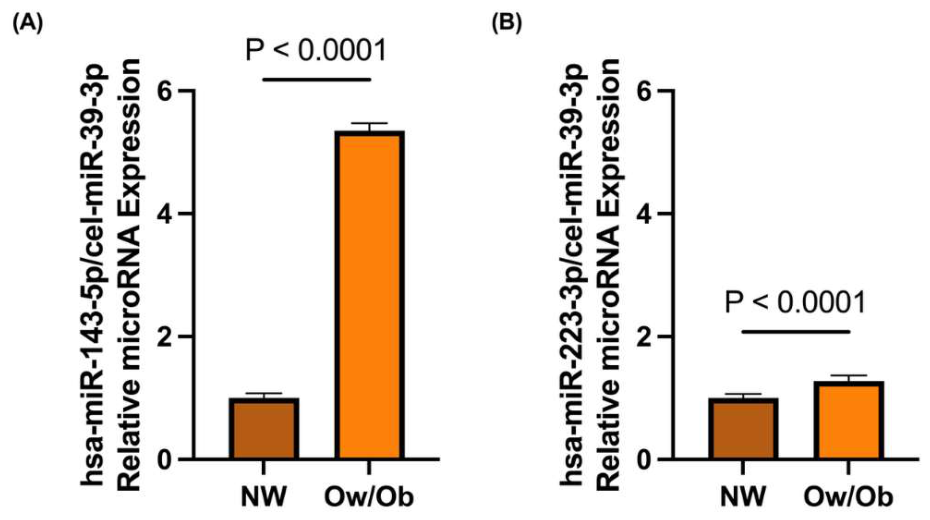
Figure 3.
Plasma miRNA expression in boys and girls with NW and with Ow/Ob. (A) miR-143-5p expression and (B) miR-223-3p expression. miRNA expression was measured by RT-qPCR using cel-miR-39 as the reference for the 2-ΔΔCt method. Differences were tested by an unpaired t-test. Results are presented as mean ± SD. NW: normal weight; Ow/Ob: Overweight/Obesity.
Figure 3.
Plasma miRNA expression in boys and girls with NW and with Ow/Ob. (A) miR-143-5p expression and (B) miR-223-3p expression. miRNA expression was measured by RT-qPCR using cel-miR-39 as the reference for the 2-ΔΔCt method. Differences were tested by an unpaired t-test. Results are presented as mean ± SD. NW: normal weight; Ow/Ob: Overweight/Obesity.
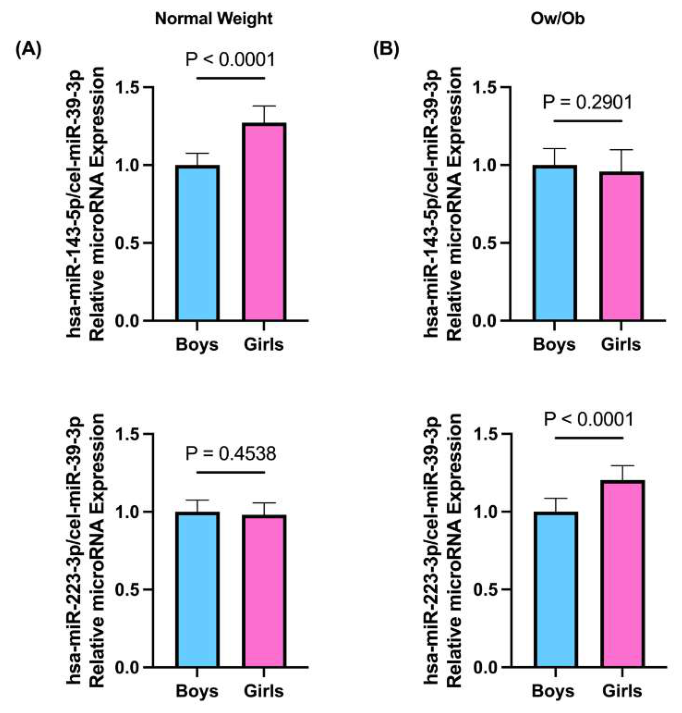
Figure 4.
The plasma miRNA expression in children with and without insulin resistance. (A) miR-143-5p expression and (B) miR-223-3p expression. miRNA expression was measured by RT-qPCR using cel-miR-39 as a reference for the 2-ΔΔCt method. Differences were tested by an unpaired t-test. Results are presented as mean ± SD. IR: Insulin resistance.
Figure 4.
The plasma miRNA expression in children with and without insulin resistance. (A) miR-143-5p expression and (B) miR-223-3p expression. miRNA expression was measured by RT-qPCR using cel-miR-39 as a reference for the 2-ΔΔCt method. Differences were tested by an unpaired t-test. Results are presented as mean ± SD. IR: Insulin resistance.
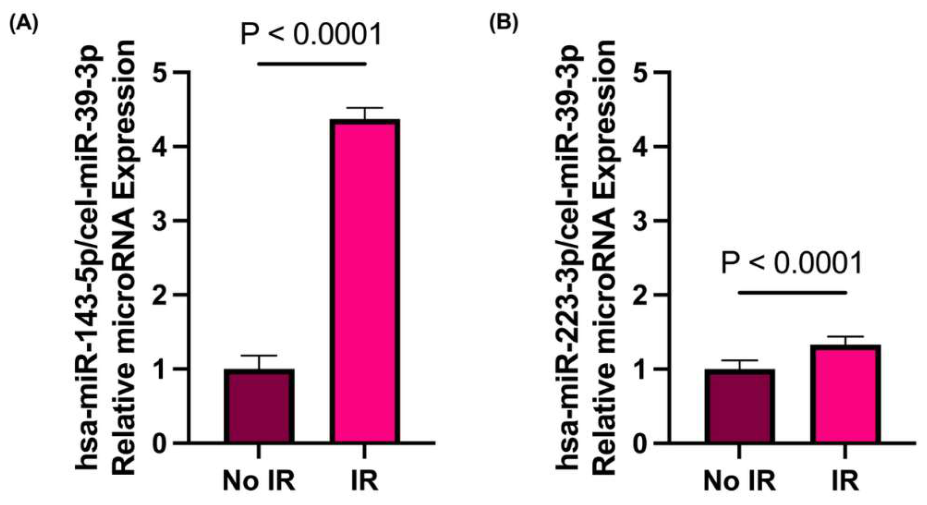

Table 1.
Demographic, clinical, and cardiometabolic parameters.
| Total (n =91) | NW (n = 44) | Ow/Ob (n = 47) | P-value | |
|---|---|---|---|---|
| Age (years) | 9.197 ± 1.802 | 8.931 ± 1.822 | 9.446 ± 1.766 | 0.174a |
| Sex, n(%) | ||||
| Male vs Female | 47 (51.650) | 18 (40.910) | 29 (61.700) | 0.047b |
| BMI (kg/m2) | 18.653 (16.005, 25.716) | 16.105 (15.422, 17.400) | 25.414 (23.804, 28.268) | <0.001c |
| BMI Z-score | 1.160 (0.140, 2.160) | 0.125 (-0.270, 0.475) | 2.160 (1.930, 2.370) | <0.001c |
| Waist (cm) | 70 (59, 85) | 60 (55, 63) | 85 (79, 92) | <0.001c |
| Hip (cm) | 81 (70, 93) | 70 (65, 77) | 93 (84, 100) | <0.001c |
| CHO (mg/dL) | 156.875 ± 27.853 | 150.047 ± 20.807 | 163.268 ± 32.044 | 0.022ª |
| HDL-C (mg/dL) | 45.240 ± 9.723 | 51.325 ± 8.669 | 39.544 ± 6.794 | <0.001a |
| LDL-C (mg/dL) | 80.657 ± 27.454 | 75.061± 22.872 | 85.895 ± 30.458 | 0.059a |
| TG (mg/dL) | 145.500 (84.600, 221.700) | 91.500 (69.800, 145.400) | 196.900 (144.800, 240.500) | <0.001c |
| Glucose (mg/dL) | 87.973 ± 8.703 | 87.629 ± 7.811 | 88.295 ± 9.536 | 0.717a |
| Insulin (μU/mL) | 13.300 (8.010, 24.800) | 8.69 (6.450, 11.615) | 23.890 (15.770, 32.920) | <0.001c |
| HOMA-IR | 3.066 (1.770, 5.253) | 1.820 (1.407, 2.398) | 5.006 (3.461, 6.872) | <0.001c |
| ≥3.16, n(%) | 48 (52.750) | 9 (20.450) | 39 (82.980) | <0.001b |
| Total energy intake (Kcal) | 2542.183 ± 799.027 | 2641.665 ± 857.360 | 2449.051 ± 737.342 | 0.252a |
| Added sugar intake (g) | 65.103 (39.137, 90.733) | 67.566 (45.432, 88.746) | 63.282 (37.540, 86.427) | 0.356c |
| ≥50 g, n(%) | 54 (59.340) | 29 (65.910) | 25 (53.190) | 0.217b |
BMI: Body mass index; CHO: Cholesterol; HDL-C: High-density lipoprotein cholesterol; LDL-C: Low-density lipoprotein cholesterol; TG: Triglycerides; HOMA-IR: Homeostatic model assessment of IR. Results are expressed as mean ± standard deviation for parametric data or as median (interquartile range) for non-parametric data. a Student’s t test; b Chi-square test; c Mann–Whitney test. P values < 0.05 were considered statistically significant.
Table 2.
Association of miRNA expression and cardiometabolic risk parameters.
| miR-143-5p | miR-223-3p | |||||
|---|---|---|---|---|---|---|
| β | 95% CI | P-value | β | 95% CI | P-value | |
| CHO (mg/dL) | 0.002 | -0.004, 0.008 | 0.470 | 0.000 | -0.006, 0.006 | 0.923 |
| HDL-C (mg/dL) | 0.009 | -0.015, 0.034 | 0.439 | -0.000 | -0.025, 0.023 | 0.958 |
| LDL-C (mg/dL) | -0.001 | - 0.007, 0.005 | 0.709 | -0.001 | -0.008, 0.004 | 0.564 |
| TG (mg/dL) | 0.002 | - 0.000, 0.004 | 0.089 | 0.001 | -0.000, 0.004 | 0.194 |
| Glucose (mg/dL) | 0.010 | - 0.009, 0.029 | 0.302 | 0.002 | -0.017, 0.022 | 0.792 |
| Insulin (μU/mL) | 0.007 | - 0.005, 0.020 | 0.271 | 0.010 | -0.003, 0.023 | 0.146 |
| HOMA-IR | 0.035 | - 0.022, 0.093 | 0.226 | 0.044 | -0.015, 0.104 | 0.141 |
BMI: Body mass index; CHO: Cholesterol; HDL-C: High-density lipoprotein cholesterol; LDL-C: Low-density lipoprotein cholesterol; TG: Triglycerides; HOMA-IR: Homeostatic model assessment of insulin resistance. β values represent unstandardized coefficients derived from linear regression models with miRNA expression as dependent variables, adjusted for sex, age, BMI and total energy intake. P values < 0.05 were considered statistically significant.
Table 3.
Association of the added sugar intake with miRNA expression and cardiometabolic risk parameters.
Table 3.
Association of the added sugar intake with miRNA expression and cardiometabolic risk parameters.
| Added sugar (g) | |||
|---|---|---|---|
| β | 95% CI | P-value | |
| miR-143-5p | 0.109 | -0.056, 0.275 | 0.194 |
| miR-223-3p | 0.188 | 0.022, 0.354 | 0.027 |
| CHO (mg/dL) | -3.125 | -8.783, 2.533 | 0.275 |
| HDL-C (mg/dL) | 0.516 | -0.991, 2.025 | 0.497 |
| LDL-C (mg/dL) | -4.235 | -9.796, 1.325 | 0.134 |
| TG (mg/dL) | 2.966 | -12.038, 17.971 | 0.695 |
| Glucose (mg/dL) | 1.944 | 0.133, 3.755 | 0.036 |
| Insulin (μU/mL) | 1.481 | -1.172, 4.135 | 0.270 |
| HOMA-IR | 0.443 | -0.158, 1.045 | 0.146 |
BMI: Body mass index; CHO: Cholesterol; HDL-C: High-density lipoprotein cholesterol; LDL-C: Low-density lipoprotein cholesterol; TG: Triglycerides; HOMA-IR: Homeostatic model assessment of IR. β values represent unstandardized coefficients derived from linear regression models with added sugar intake as the independent variable, adjusted for sex, age, BMI, and total energy intake. Results are presented as β and 95% CI. P values < 0.05 were considered statistically significant.
Disclaimer/Publisher’s Note: The statements, opinions and data contained in all publications are solely those of the individual author(s) and contributor(s) and not of MDPI and/or the editor(s). MDPI and/or the editor(s) disclaim responsibility for any injury to people or property resulting from any ideas, methods, instructions or products referred to in the content. |
© 2026 by the authors. Licensee MDPI, Basel, Switzerland. This article is an open access article distributed under the terms and conditions of the Creative Commons Attribution (CC BY) license (http://creativecommons.org/licenses/by/4.0/).
Copyright: This open access article is published under a Creative Commons CC BY 4.0 license, which permit the free download, distribution, and reuse, provided that the author and preprint are cited in any reuse.


