

Submitted:
08 July 2026
Posted:
09 July 2026
You are already at the latest version
Abstract
Diet and lifestyle are modifiable determinants of oxidative balance through exposure to antioxidant and pro-oxidant factors. The oxidative balance score (OBS) is a composite index reflecting the balance between these exposures, with higher scores indicating a pre-dominance of antioxidant factors. We examined three OBSs (nutrient-, food-, and life-style-based) and their combined versions (nutrient-lifestyle and food-lifestyle) across clinical subgroups, and their associations with biomarkers of oxidative stress, inflammation and metabolic function.
A total of 44 older adults were enrolled and stratified into three subgroups (16 healthy, 14 hyperlipidemic, and 14 post–myocardial infarction). Each participant completed a ques-tionnaire, a three-day food record and a blood test. OBSs were calculated based on 15 nutrients, 9 food groups and 2 lifestyle components. Correlations and multiple linear regression analyses were performed to examine associations between OBSs and biomarkers: plasma total antioxidant capacity TEAC and FRAP, C-reactive protein (CRP), HDL-cholesterol, alanine aminotransferase (ALT), aspartate aminotransferase (AST).
The nutrient-based OBS (OBSN) was significantly associated with higher HDL-cholesterol (β = 0.033; p = 0.045), lower ALT (β = −1.53; p < 0.001), and lower AST (β = −0.85; p = 0.002). Similar associations were observed for the nutrient-lifestyle OBS (OBSN-L) (adjusted ALT β = -1.48; p < 0.001; β = -0.79; p = 0.001). No significant associations were observed for TEAC (β = 5.295 p = 0.535) and FRAP (β = -4.640, p = 0.475), nor for CRP (β = 0.046, p = 0.347). OBSF and OBSF-L were not associated with any circulating biomarkers.
Higher nutrient-based OBSs (with and without lifestyle integration) were independently associated with higher HDL cholesterol and lower liver transaminase levels in older adults at high cardiovascular risk. OBSs may help capture dietary and lifestyle patterns associated with cardiometabolic health.
Keywords:
cardiovascular risk
; oxidative balance score
; HDL-cholesterol
; liver transaminases
; older adults
1. Introduction
Cardiovascular diseases (CVDs) remain the leading cause of morbidity and mortality worldwide [1]. Oxidative stress plays a central role in the pathophysiology of atherosclerotic cardiovascular diseases (ASCVDs), including coronary artery disease, stroke, and peripheral artery disease. It was defined by Sies as “an imbalance between oxidants and antioxidants in favor of oxidants, leading to disruption of redox signaling and/or molecular damage” [2]. This imbalance arises from increased production of pro-oxidants and/or impaired antioxidant defense systems [3]. Oxidative stress and inflammation are closely interconnected processes. Pro-oxidants stimulate pro-inflammatory cytokines, while inflammation further amplifies oxidative stress [4,5].
In this context, diet–one of the most important modifiable risk factors–has been shown to directly influence the incidence of ASCVDs [6], partly through its ability to modulate oxidative stress and inflammation [7]. Oxidative damage can be mitigated by endogenous and dietary antioxidants [8,9,10]. In particular, higher dietary intake of certain exogenous antioxidants–such as vitamin C, carotenoids, and α-tocopherol–have been associated with reduced risk of CVD and all-cause mortality in longitudinal studies [11]. However, intervention trials using single antioxidants or combinations thereof have yielded inconsistent results. In some cases, supplementation has even been associated with adverse outcomes [13,14].
These seemingly paradoxical findings may be explained by several factors. First, whole foods contain thousands of bioactive compounds that interact synergistically, an effect that is difficult to replicate with isolated supplements. Second, fat-soluble antioxidants–such as vitamins A and E, and b-carotene–carry a greater risk of bioaccumulation and toxicity compared with water-soluble compounds like vitamin C, due to their storage in adipose tissues [15]. Together, these observations suggest that supplementation with isolated antioxidants may fail to reproduce the complex biochemical interactions occurring with whole-food matrices [5].
Given the importance of antioxidant synergy and the multifactorial nature of oxidative stress–shaped by both antioxidant and pro-oxidant exposure–composite measures may provide a more comprehensive assessment than individual components. The Oxidative Balance Score (OBS) is a holistic index that captures cumulative exposure to factors influencing oxidative stress across dietary nutrients, and lifestyle domains [16]. A validation study with the EPIC cohort demonstrated that the OBSs integrating nutrient, food, and lifestyle components are valid tool for assessing an individual's oxidative balance [17].
Associations between OBSs and markers of oxidative stress [17,18,19], inflammation [19,20,21] and CVD risk factors–such as hypertension [22,23], circulating lipids [20,23], and metabolic syndrome [24]–have been reported in the literature. However, relatively few studies have specifically examined the relationship between OBS and biomarkers of oxidative stress in older adults. In this context, the objectives of the present study were to (1) compare baseline OBS across older adults at high risk of CVD and investigate the associations between these scores and plasma biomarkers of oxidative stress, inflammation and cardiometabolic health.
2. Materials and Methods
2.1. Study Population
In this cross-sectional study, a total of 44 participants aged 65-84 years were recruited and stratified into three groups according to cardiovascular risk: (1) healthy individuals free from clinical and subclinical manifestations of atherosclerosis (n = 16), (2) individuals with hypercholesterolemia (n = 14), and (3) post-myocardial infarction (post-MI) patients (n = 14).
Participants were recruited through advertising posters displayed in public locations, including shopping malls, clinics, hospital waiting rooms, and retirement homes. Post-MI participants were additionally recruited from the geriatrics and cardiology departments. Inclusion criteria for the healthy group included absence of family history of CVD, normal blood pressure (<130/85 mm Hg), body mass index (BMI) between 23 and 28 kg/m2, and a normal electrocardiogram. The hypercholesterolemia group consisted of newly diagnosed, untreated individuals with LDL-C levels between 3.5 and 5.0 mmol/L; individuals with familial hypercholesterolemia were excluded.
The post-MI group included patients assessed at least 3 months of the index event to allow stabilization of inflammatory processes. Exclusion criteria applied to all groups and included diabetes or prediabetes (HbA1c >6.0%), current smoking, chronic inflammatory conditions (e.g., renal failure, active cancer), gastrointestinal diseases affecting nutrient absorption, and use of antioxidant and omega-3 fatty acid supplements.
The study was conducted in accordance with the principles of the Declaration of Helsinki. The study protocol was approved by the Research Ethics Committee of the Integrated University Health and Social Services Center of Estrie – Sherbrooke University Hospital Center (protocol #: #2019-3145). All participants provided written informed consent prior to enrollment.
2.2. Measurements
2.2.1. Sociodemographic and Health Data
Sociodemographic and health data were collected using a standardized questionnaire administered by a trained study nurse. Collected variables included age, sex, occupation, education level, medical history, current medications, physical activity level, tobacco and alcohol use, adherence to specific dietary patterns, and blood pressure. Additional relevant clinical information was recorded. These data were used for participant characterization and for the OBSs calculation.
2.2.2. Anthropometric Measurements
Body weight and height were measured at baseline by a trained nurse, with participants barefoot and wearing light clothing, using a calibrated scale and stadiometer. Waist circumference (WC) was measured in centimeters using a non-stretchable, graduated tape measure according to standard procedures. Body mass index (BMI) was calculated as weight (kg) divided by height squared (m²) and classified according to World Health Organization cut-off points [25]. Although, BMI is widely used to assess overweight and obesity, WC was considered the primary indicator of adiposity in this study, given that aging is associated with a progressive decline in lean mass and a concomitant increase of fat mass [26].
2.2.3. Dietary Intake
Dietary intake was assessed using a 3-day food diary including two weekdays and one weekend day, completed at recruitment. Each diary was reviewed by the research dietitian to identify potential errors or missing entries. When necessary, participants were contacted to clarify or complete the recorded information. Dietary data were analyzed using the Nutrific® web application (version 1.1, 2010, Université Laval, Québec, Canada). The software converts average dietary intake from the 3-day food record into estimates of total energy intake (TEI, kcal/day) and nutrient composition, including macronutrients (proteins, carbohydrates, lipids), micronutrients (vitamins and minerals) and certain phytochemicals.
2.2.4. Calculation of Nutrient, Food and Lifestyle-Based Oxidative Balance Score
Using data from the food diary and the health questionnaire, three individual OBSs and two combined scores were calculated for each participant based on a priori evidence regarding their association with oxidative stress [16,17]. The nutrient-OBS (OBSN), food-OBS (OBSF), and lifestyle-OBS (OBSL) comprised 15 dietary components, 9 food components and 2 lifestyle components, respectively. Antioxidant components included vitamins A, C, E, and B9, b-carotene; lutein/zeaxanthin; lycopene; monounsaturated fatty acids; selenium; zinc; fiber; calcium; as well as food groups such as fruits, vegetables, legumes, fish, nuts, in addition to physical activity. Pro-oxidant components included iron; saturated fatty acids; polyunsaturated fatty acids; and food groups such as red and processed meats, refined grains and cereals, sweets, salty snacks, and alcohol. Physical activity was categorized according to Health Canada’s physical activity level (NAP) classifications: as inactive, moderately active or active [27]. Dietary components were adjusted for total energy intake. Two additional composite scores were derived: the lifestyle nutrient-based OBS (OBSN-L) and the lifestyle food-based OBS (OBSF-L) comprising 17 and 11 components, respectively.
All Continuous and categorical variables were categorized into tertiles based on their distribution within the study sample. For antioxidant components, which are presumed to mitigate oxidative stress, participants in the lowest tertile 1 (T1) were assigned 0 points, those in the intermediate tertile 2 (T2) 1 point, and those in the highest tertile 3 (T3) 2 points. Conversely, for pro-oxidant components, which are considered to promote oxidative stress, participants in T1 were assigned 2 points, those in T2 1 point, and those in T3 0 points. A higher OBS reflects a more favorable oxidative balance, characterized by greater exposure to antioxidant relative to pro-oxidant factors. Detailed information on score components and point allocation is provided in supplementary Table 1.
2.3. Biomarkers
Fasting blood samples were collected at baseline after a minimum of 8 hours of fasting in EDTA tubes. Samples were immediately centrifuged (4,000 rpm for 15 minutes), and plasma and serum were aliquoted and stored at –80°C until analysis. The following biomarkers were assessed: (a) oxidative stress markers, including Trolox Equivalent Antioxidant Capacity (TEAC) and Ferric Reducing Antioxidant Power (FRAP); (b) an inflammatory marker, C-reactive-protein (CRP); and (c) cardiometabolic markers, including high-density lipoprotein (HDL) cholesterol, alanine aminotransferase (ALT), and aspartate aminotransferase (AST).
TEAC and FRAP were measured in serum using commercial assay kits–TEAC assay kit (ABTS; Cell Biolabs, Inc. San Diego, CA, USA) and FRAP Assay Kit (MAK509, Sigma-Aldrich)–according to the manufacturer’s instructions. The remaining biomarkers were analyzed at the biochemistry laboratory of the Sherbrooke University Hospital Center using standardized automated methods. Plasma CRP was quantified using an immunological method based on antigen-antibody reactions. Serum HDL cholesterol, ALT, and AST concentrations were determined using enzymatic assays.
2.4. Statistical Analysis
All analyses were performed using the SPSS software (IBM Corporation, New York, NY, United States, version 29, 2025), with statistical significance set at p ≤ 0.05. Data normality was assessed using the Shapiro-Wilk test, complemented by skewness (Z-score) and kurtosis indices. Bootstrapping procedures were applied to obtain robust estimates and confidence intervals without relying on normality assumptions.
To compare the three groups, a one-way analysis of variance (ANOVA) was used for continuous variables with a normal distribution. Homogeneity of variances was assessed using Levene’s test; when this assumption was violated, Welch’s ANOVA was applied instead. When overall group differences were significant, Bonferroni post-hoc tests were conducted to identify pairwise differences. For non-normal distributed variables, the Kruskal-Wallis test was used. Categorical variables were analyzed using Fisher's exact test, as all variables included at least one expected frequency below five. When significant differences were observed, Bonferroni-adjusted post-hoc comparisons were performed. For all analyses, statistical significance was set at p < 0.05. Correlations between OBSs and biomarkers were assessed using Pearson correlation for normally distributed variables (TEAC, FRAP, HDL, AST) and Spearman correlation for non-normally distributed variables (CRP, ALT). Results were visualized using a heatmap.
To further examine association between OBSs (independent variable, X) and biomarkers (dependent variable, Y), multivariate linear regression models were constructed. Model 1 was unadjusted, whereas Model 2 was adjusted for age, sex, medication use, and waist circumference. Variables were entered simultaneously using the enter method. Regression assumptions (linearity, homoscedasticity, normality, and absence of multicollinearity) were verified. Bootstrapping was also applied to address non-normality of dependent variables (CRP and ALT).
3. Results
3.1. Characteristics of Participants by Cardiovascular Risk Group
A total of 44 older adults at high cardiovascular risk were included in the analysis, comprising 16 healthy individuals, 14 participants with hyperlipidemia, and 14 post–myocardial infarction (post-MI) participants. Demographic and clinical characteristics by subgroup are presented in Table 1.
The healthy group showed a balanced sex distribution, whereas the hyperlipidemic group had a higher proportion of women (78.6%) and the post-MI group a lower proportion (21.4%) (p = 0.008). As expected, medication use was more prevalent in post-MI (100%) and hyperlipidemic (50%) participants compared with healthy individuals (25%) (p <0.001). Regarding biochemical parameters, HDL levels were significantly lower in the post-MI group (1.19 ± 0.26) compared with the healthy (1.69 ± 0.50) and hyperlipidemic groups (2.00 ± 0.50) (p <0.001). In contrast, ALT and AST levels were significantly higher in the post-MI groups (31.15 ± 15.56 and 27.46 ± 10.18 respectively) compared to hyperlipidemic (15.45 ± 3.17 and 21.27 ± 5.71) and healthy groups (17.79 ± 5.26 and 20.64 ± 5.03) (p <0.001). Post hoc analysis revealed statistically significant differences between the post-MI group and both the hyperlipidemic and healthy groups, while no significant difference was observed between the healthy and hyperlipidemic groups.
Age, years of education, anthropometric measures, alcohol consumption, physical activity levels, and other biomarkers (TEAC, FRAP, CRP) did not differ significantly across groups (all p > 0.05).
3.2. Nutrient Intake by Cardiovascular Risk Group
Dietary intake is presented in Table 2. Total energy intake did not differ significantly between groups (p > 0.05). The macronutrient distribution (% of total energy derived from carbohydrates, fats, and proteins) was comparable across clinical subgroups. Although not statistically significant, a lower proportion of energy from monounsaturated fatty acids (MUFA) was observed in post-MI participants (12.07 ± 3.72 %) compared with hyperlipidemic (16.83 ± 6.19 %) and healthy (16.83 ± 7.07 %) participants.
Regarding micronutrient intake, differences were observed for selected antioxidant-related nutrients. Post-hoc analysis showed that vitamin A intake, expressed as a percentage of the recommended dietary allowance (RDA), was statistically significantly lower in post-MI group (80.13 ± 34.09 %) compared with the hyperlipidemic group (119.13 ± 58.11%) (p = 0.047). Similarly, zinc RDA (% RDA) was significantly lower in the post-MI group (81.82 ± 32.98%) compared with the healthy group (115.47 ± 41.03%) (p = 0.045). Other micronutrients, including vitamin C, vitamin E, and selenium did not differ significantly between groups (p > 0.05).
3.3. Food Group Consumption by Cardiovascular Risk Group
Food group consumption is summarized in Table 3. Post-hoc analysis showed that healthy participants reported significantly higher red meat intake (62.51 ± 50.39 g) than both hyperlipidemic (26.36 ± 41.02 g) and post-MI participants (11.54 ± 22.99 g; p = 0.007). Processed meat intake tended to be higher in the post–MI (25.79 ± 37.69 g) and hyperlipidemic groups (22.64 ± 26.53 g) than healthy participants (7.23 ± 9.55 g), although these differences were not statistically significant. Conversely, vegetable intake tended to be lower in the post-MI (203.04 ± 152.35 g) and hyperlipidemic groups (203.05 ± 117.08 g) compared with the healthy group (305.20 ± 188.18 g). No significant differences were observed for fats, fruits, cereals, legumes, nuts and seeds, fish/seafood, poultry, milk/dairy products, or total meat intake (p > 0.05).
3.4. Oxidative Balance Scores
Oxidative balance score differed significantly across the three clinical subgroups (p = 0.042) (Table 4). Participants with hyperlipidemia exhibited the highest OBS values, followed by healthy individuals, whereas the post-MI group had the lowest scores. Post hoc analyses indicated that OBSN was significantly lower in post-MI participants (12.50 ± 4.43) compared with hyperlipidemic individuals (18.00 ± 4.30; p = 0.005). No significant differences were observed between healthy participants and other groups. Similar patterns were observed for OBSN-L (p = 0.010). No significant differences were found for OBSF, OBSL, and OBSF-L.
3.5. Correlations Between Oxidative Balance Scores and Biomarkers
Bivariate correlations between OBSs and circulating biomarkers of oxidative stress, inflammation, cardiometabolic function are presented in Figure 1. Higher OBSN and OBSN-L were positively associated with HDL-cholesterol (r = 0.302, p = 0.046 and r = 0.305, p = 0.046, respectively). In contrast, OBSN and OBSN-L were inversely correlated with ALT (r = -0.496, p = 0.001 and r = -0.519, p <0.001, respectively) and AST (r = -0.537, p < 0.001 and r = -0.503, p = 0.001, respectively). No significant correlations were observed between OBSs and biomarkers of oxidative status or inflammation biomarkers (TEAC, FRAP, and CRP) (p > 0.05).
Heatmap color intensity represents the strength and direction of the correlation coefficients, ranging from blue (negative correlations) to red (positive correlations), with white indicating no correlation. Pearson and Spearman correlation coefficients were calculated for normally distributed and non-normally distributed variables, respectively. Correlations in bold were all statistically significant (p < 0.05). Abbreviations: TEAC, trolox equivalent antioxidant capacity; FRAP, ferric reducing antioxidant power; CRP, C-reactive protein; HDL, high-density lipoprotein; ALT, alanine aminotransferase; AST, aspartate aminotransferase.
3.6. Linear Association Between Oxidative Balance Scores and Biomarkers
Results of linear regression analyses examining the association between OBSN, OBSN-L, and OBSL and circulating biomarkers are shown in Table 5.
Higher OBSN was significantly associated with higher HDL-cholesterol and lower ALT and AST levels in both unadjusted and adjusted models. After adjustment for age, sex, medication use, and waist circumference, the associations remained statistically significant (per one-point increase in OBS: β = 0.033; p = 0.045 for HDL cholesterol; β = -1.53; p <0.001 for ALT; and β = -0.85; p =0.002 for AST), with minimal attenuation of effect size. Similarly, higher OBSN-L was significantly associated with higher HDL cholesterol and lower ALT and AST levels in unadjusted model. However, after adjustment for confounders, only the associations with ALT and AST remained statistically significant (per one-point increase in OBS-L: β = -1.48; p < 0.001, and β = -0.79; p = 0.001, respectively).
No significant associations were observed for OBSF, OBSF-L, or OBSL with any biomarkers. In addition, none of the OBS measures were significantly associated with TEAC, FRAP or CRP (data not shown).
3.7. Linear Association Between Individual Nutrient and Lifestyle Components and Biomarkers
Results of the linear regression analyses examining the association between individual OBS components and biomarkers are presented in Table 6.
Multiple regression analyses adjusted for age, sex, medication use, and waist circumference showed that several OBS components were significantly associated with AST levels. Specifically, Vitamin C, vitamin A, fiber, iron, and saturated fatty acids were associated with AST (β = -3.51, -3.58, -3.80, 3.08, -3.05, respectively; all p < 0.05).
Similarly, vitamin C, fiber, calcium, vegetable intake, physical activity, and iron were significantly associated with ALT levels (β = -5.22, -5.76, -5.51, -4.92, -5.31, and 5.08, respectively; all p < 0.05). No significant associations were observed between individual OBS components and HDL cholesterol levels.
4. Discussion
This study is among the first to demonstrate that dietary oxidative balance—particularly nutrient-based oxidative balance scores (OBSN)—is independently associated with more favorable lipid and hepatic biomarker profiles in older adults at high cardiovascular risk. Specifically, higher OBSN was associated with higher HDL-cholesterol and lower ALT and AST concentrations, and these associations persisted after adjustment for age, sex, medication use, and waist circumference. Notably, these relationships were observed despite pharmacological management in the post-MI group, suggesting that dietary oxidative balance may capture residual metabolic risk beyond lipid-lowering therapy.
Previous studies have reported similar associations between OBSs and HDL-cholesterol with potential sex-specific effects [20,23]. Specifically, participants in the highest OBS category exhibited 52% lower odds of low HDL in women but 63% higher odds in men compared with those in the lowest category. Given the role of estrogens in regulating triglyceride and cholesterol metabolism, sex-related differences in lipid metabolism may partly explain these findings [28].
Our results also suggest a potential link between oxidative balance and liver function. The persistence of associations after multivariable adjustment strengthens the biological plausibility that dietary oxidative balance, may influence not only cardiovascular risk but also hepatic metabolic stress. While Zhou et al. reported inconsistent relationships between OBS and liver enzymes [29], the strong inverse association observed between OBSN and liver transaminases in our study suggests that cumulative antioxidant exposure may influence the “liver–heart axis” [30,31].
Mechanistically, our findings are consistent with the concept of nutritional hormesis (“parahormesis”), whereby phytochemical antioxidants stimulate endogenous antioxidant defense systems [32] and activate cellular stress-response pathways [33,34], rather than acting solely as direct radical scavengers. Many dietary polyphenols reach the colon intact and are subsequently metabolized by the gut microbiota into bioactive secondary metabolites capable of modulating hepatic and systemic redox pathways [33]. In addition, metabolic liver disease and ASCVD share common pathophysiological mechanisms, including oxidative stress, systemic inflammation, gut microbiota alterations, endothelial dysfunction, and insulin resistance [30,31].
Most studies report strong inverse associations between OBS and biomarkers of oxidative stress [18,19] and inflammation [20,21,22]. In contrast, we did not observe significant associations between OBSs and circulating plasma TAC or CRP. The lack of association in our study may reflect differences in sample size, OBS construction (dietary vs biomarker-based), and population characteristics, including the inclusion of medicated post-MI patient. Importantly, it may also be explained by the limited sensitivity of TAC assays to accurately capture oxidative stress in vivo. The absence of association with TAC and CRP may reflect limited sensitivity of TAC assays and differences in study design [17]. Although plasma TAC can be useful for evaluating dietary responses when used alongside other biomarkers [36], it is not considered a reliable standalone indicator of oxidative stress status in vivo. In contrast, biomarkers such as F2-isoprostanes are regarded as more robust and specific measure of oxidative stress [37].
Our study highlights a distinct "antioxidant deficit" in post-MI patients, reflected by lower overall OBSN at baseline, despite a similar–or even a tendency toward higher–OBSF compared with healthy and hyperlipidemic patients. Although post-MI patients appeared to reduce red meat intake (a major pro-oxidant exposure), they did not achieve adequate intake of several key antioxidant nutrients, including vitamin A and zinc. In addition, post-MI participants tended to consume few vegetables and more processed meat than other groups. However, food-based OBS (OBSF) did not reproduce the associations observed with nutrient-based scores (OBSN and OBSN-L). This discrepancy underscores an important conceptual implication point: oxidative balance may depend more on cumulative nutrient exposure than on food group classification alone.
Moreover, food-based assessments fully account cannot for account for exposure to environmental contaminants (e.g. pesticides, heavy metals, preservatives, additives, and neoformed compounds) [38], as well as the large number of food contact chemicals that may influence metabolic outcomes [39]. In addition, most existing OBSs frameworks integrate both diet and lifestyle components, rather than isolating food-based contributions. Although one study reported that higher OBSF-L was associated with lower CRP levels, this relationship appeared to be driven primarily by lifestyle factors rather than dietary component [17]. Taken together, our finding highlights a clinically relevant paradox: reducing pro-oxidant foods is insufficient if antioxidant nutrient density is not simultaneously optimized. These results suggest that secondary prevention strategies should move beyond a sole focus on "what to avoid" and place equal–or greater–emphasis on "what to include" to effectively address antioxidants deficits.
Interestingly, our results showed that three nutrients were consistently and strongly associated with liver biomarkers (AST and ALT): vitamin C and fiber (antioxidant components) and iron (a pro-oxidant component). Vitamin C is widely recognized as a potent and relatively non-toxic antioxidant due to its ability to scavenge free radicals (Gulcin, 2020). In contrast, excess iron can promote the overproduction of reactive oxygen species, leading to oxidative damage, including lipid peroxidation and the progression of atherogenesis promotion [40].
A review of the literature indicates that fiber is rarely included as an individual component of OBS frameworks [16], despite its potential indirect antioxidant effects. First, dietary fiber reaches the colon, where it is fermented by the gut microbiota into short-chain fatty Acids (SCFA). These metabolites are absorbed by enterocytes and hepatocytes, enter the systemic circulation, and exert metabolic effects [41]. Notably, SCFAs can activate the activate Nrf2 pathway, enhancing endogenous antioxidant defense systems [42]. Second, fiber can act as a carrier of polyphenols, forming «antioxidant dietary fiber» complex. These complexes may exhibit greater antioxidant capacity when released from colonic fermentation compared with digestion into small intestine [41]. Additional mechanisms, such as metal chelation and improved glycemic control, may further contribute to fiber’s antioxidant role [43].
In our analysis, no single OBS component independently explained the association between OBSN and HDL cholesterol. This finding highlights the value of composite indices: by integrating multiple dietary and lifestyle factors, OBS captures synergetic interactions that may be detectable when examining individual components in isolation. Such approach provides a more comprehensive and robust representation of oxidative balance. Finally, the relatively small sample size may have limited statistical power, potentially reducing ability to detect significant association with HDL cholesterol.
A major strength of this analysis is the simultaneous evaluation of nutrient-based and food-based oxidative balance scores, including their lifestyle-integrated versions, which enable direct comparison of different score constructs. By integrating lifestyle factors alongside dietary components, we provide a more comprehensive assessment of the overall oxidative environment. Dietary intake was assessed using three-day food records rather than recall instruments, thereby reducing memory bias in this older population. In addition, inclusion of multiple circulating biomarkers allowed a multidimensional assessment of cardiometabolic health, oxidative status and inflammation. Finally, the use of bootstrap confidence intervals in linear regression models strengthened statistical inference without requiring transformation of clinically interpretable variables.
The main limitation in this pilot study is its modest sample size, which limits statistical power and generalizability. In addition, the equal weighting of OBS components does not account for differences in redox potency among antioxidants. Moreover, OBS does not capture endogenous antioxidant systems, which contribute substantially to overall plasma antioxidant capacity.
Biomarkers were measured at a single time point, precluding assessment of temporal variability. Although regression models were adjusted for several key covariates, residual confounding from unmeasured environmental or lifestyle factors cannot be excluded. Therefore, these findings should be considered exploratory and require confirmation in larger, well-powered prospective studies.
5. Conclusions
In conclusion, this study demonstrates that among different OBS constructs integrating nutrient, food, and lifestyle dimensions, nutrient-based OBSs (with and without lifestyle integration) were independently associated with more favorable lipid and liver biomarker profiles in older adults at high cardiovascular risk, after adjustment for age, sex, medication use, and waist circumference. Some of these associations appeared to be driven by specific nutrients, including fiber, vitamin C, and iron. In contrast, no associations were observed between OBSs and circulating total antioxidant capacity or CRP, suggesting that OBSs may reflect broader dietary and lifestyle patterns linked to cardiometabolic health rather than systemic oxidative status alone. Although exploratory, these findings support the potential relevance of nutrient-based OBSs as integrative tools for characterizing oxidative balance and identifying dietary patterns associated with cardiometabolic risk in aging populations. Further longitudinal studies are needed to confirm these associations and clarify the clinical utility of OBSs in cardiovascular prevention strategies.
Supplementary Materials
The following supporting information can be downloaded at the website of this paper posted on Preprints.org.
Author Contributions
Conceptualization, funding acquisition, methodology, review, and editing, A.K.; T.F. and M.N. Methodology, H.S; M.M. H.B., writing and analyzing H.S. and M.M.; original draft preparation, H.S. review, and editing (A.K; M.M. S.B.). All authors have read and agreed to the published version of the manuscript.
Funding
This research was funded by the Canadian Institutes of Health Research (grant number # PJT-162366) (A.K.).
Institutional Review Board Statement
The study was conducted in accordance with the Declaration of Helsinki, and approved by the Research Ethics Committee of the Integrated University Health and Social Services Center of Estrie – Sherbrooke University Hospital Center (protocol #: #2019-3145). All participants provided written informed consent prior to enrollment.
Data Availability Statement
The original contributions presented in this study are included in the article/supplementary material. Further inquiries can be directed to the corresponding author(s).
Conflicts of Interest
The authors declared no potential conflicts of interest regarding the research, authorship, and/or publication of this work.
References
- Zhou, M.; Zhao, G.; Zeng, Y.; Zhu, J.; Cheng, F.; Liang, W. Aging and Cardiovascular Disease: Current Status and Challenges. Rev. Cardiovasc Med. 2022, 23(4), 135. [Google Scholar] [CrossRef]
- Sies, H. Oxidative Stress: Concept and Some Practical Aspects. Antioxidants 2020, 9(9), 852. [Google Scholar] [CrossRef] [PubMed]
- Raza, M.H.; Siraj, S.; Arshad, A.; Waheed, U.; Aldakheel, F.; Alduraywish, S.; et al. ROS-modulated therapeutic approaches in cancer treatment. J. Cancer Res. Clin. Oncol. 2017, 143(9), 1789–809. [Google Scholar] [CrossRef] [PubMed]
- Seyedsadjadi, N.; Grant, R. The Potential Benefit of Monitoring Oxidative Stress and Inflammation in the Prevention of Non-Communicable Diseases (NCDs). Antioxidants 2020, 10(1), 15. [Google Scholar] [CrossRef] [PubMed]
- Fleming, E.; Luo, Y. Co-delivery of synergistic antioxidants from food sources for the prevention of oxidative stress. 2021, Vol. 3, 3. [Google Scholar]
- Murray, C.J.L.; Atkinson, C.; Bhalla, K.; Birbeck, G.; Burstein, R.; Chou, D.; et al. The state of US health, 1990-2010: burden of diseases, injuries, and risk factors. JAMA 2013, 310(6), 591–608. [Google Scholar] [CrossRef] [PubMed]
- Rychter, A.M.; Ratajczak, A.E.; Zawada, A.; Dobrowolska, A.; Krela-Kaźmierczak, I. Non-Systematic Review of Diet and Nutritional Risk Factors of Cardiovascular Disease in Obesity. Nutrients 2020, 12(3), 814. [Google Scholar] [CrossRef] [PubMed]
- Iakovou, E.; Kourti, M. A Comprehensive Overview of the Complex Role of Oxidative Stress in Aging, The Contributing Environmental Stressors and Emerging Antioxidant Therapeutic Interventions. Frontiers in Aging Neuroscience 2022. [Google Scholar] [CrossRef] [PubMed]
- Niki, E. Assessment of Antioxidant Capacity in vitro and in vivo. Free Radic. Biol. Med. 2010, 49(4), 503–15. [Google Scholar] [CrossRef] [PubMed]
- Ialongo, C. Preanalytic of total antioxidant capacity assays performed in serum, plasma, urine and saliva. Clin. Biochem. 2017, 50(6), 356–63. [Google Scholar] [CrossRef] [PubMed]
- Aune, D.; Keum, N.; Giovannucci, E.; Fadnes, L.T.; Boffetta, P.; Greenwood, D.C.; et al. Dietary intake and blood concentrations of antioxidants and the risk of cardiovascular disease, total cancer, and all-cause mortality: a systematic review and dose-response meta-analysis of prospective studies. Am. J. Clin. Nutr. 2018, 108(5), 1069–91. [Google Scholar] [CrossRef] [PubMed]
- Liguori, I.; Russo, G.; Curcio, F.; Bulli, G.; Aran, L.; Della-Morte, D.; et al. Oxidative stress, aging, and diseases. CIA 2018, Volume 13, 757–72. [Google Scholar] [CrossRef]
- Bjelakovic, G.; Nikolova, D.; Gluud, L.L.; Simonetti, R.G.; Gluud, C. Mortality in randomized trials of antioxidant supplements for primary and secondary prevention: systematic review and meta-analysis. JAMA 2007, 297(8), 842–57. [Google Scholar] [CrossRef] [PubMed]
- Bjelakovic, G.; Nikolova, D.; Gluud, L.L.; Simonetti, R.G.; Gluud, C. Antioxidant supplements for prevention of mortality in healthy participants and patients with various diseases. Cochrane Database Syst. Rev. 2012, 2012(3), CD007176. [Google Scholar] [CrossRef] [PubMed]
- Nicolov, M.; Cocora, M.; Buda, V.; Danciu, C.; Duse, A.O.; Watz, C.; et al. Hydrosoluble and Liposoluble Vitamins: New Perspectives through ADMET Analysis. Medicina 2021, 57(11), 1204. [Google Scholar] [CrossRef] [PubMed]
- Hernández-Ruiz, Á.; García-Villanova, B.; Guerra-Hernández, E.; Amiano, P.; Ruiz-Canela, M.; Molina-Montes, E. A Review of A Priori Defined Oxidative Balance Scores Relative to Their Components and Impact on Health Outcomes. Nutrients 2019, 11(4), 774. [Google Scholar] [CrossRef] [PubMed]
- Hernández-Ruiz, Á.; García-Villanova, B.; Guerra-Hernández, E.J.; Carrión-García, C.J.; Amiano, P.; Sánchez, M.J.; et al. Oxidative Balance Scores (OBSs) Integrating Nutrient, Food and Lifestyle Dimensions: Development of the NutrientL-OBS and FoodL-OBS. Antioxidants 2022, 11(2), 300. [Google Scholar] [CrossRef] [PubMed]
- Lakkur, S.; Bostick, R.M.; Roblin, D.; Ndirangu, M.; Okosun, I.; Annor, F.; et al. Oxidative balance score and oxidative stress biomarkers in a study of Whites, African Americans, and African immigrants. Biomarkers 2014, 19(6), 471–80. [Google Scholar] [CrossRef] [PubMed]
- Kong, S.Y.J.; Bostick, R.M.; Flanders, W.D.; McClellan, W.M.; Thyagarajan, B.; Gross, M.D.; et al. Oxidative Balance Score, Colorectal Adenoma, and Markers of Oxidative Stress and Inflammation. Cancer Epidemiol. Biomark. Prev. 2014, 23(3), 545–54. [Google Scholar] [CrossRef]
- Lakkur, S.; Judd, S.; Bostick, R.M.; McClellan, W.; Flanders, W.D.; Stevens, V.L.; et al. Oxidative stress, inflammation, and markers of cardiovascular health. Atherosclerosis 2015, 243(1), 38–43. [Google Scholar] [CrossRef] [PubMed]
- Nanri, H.; Hara, M.; Nishida, Y.; Shimanoe, C.; Higaki, Y.; Tanaka, K. Association between oxidative balance score and inflammatory markers in middle-aged and older Japanese people. Am. J. Hum. Biol. 2024, 36(6), e24059. [Google Scholar] [CrossRef] [PubMed]
- Annor, F.B.; Goodman, M.; Okosun, I.S.; Wilmot, D.W.; Il’yasova, D.; Ndirangu, M.; et al. Oxidative stress, oxidative balance score, and hypertension among a racially diverse population. J. Am. Soc. Hypertens. 2015, 9(8), 592–9. [Google Scholar] [CrossRef] [PubMed]
- Li, Y.; Yuan, H.; Li, Q.; Geng, S.; Chen, X.; Zhu, Y.; et al. Lifestyle-based oxidative balance score and its association with cardiometabolic health of the community-dwelling elderly: A cross-sectional secondary analysis. Front Cardiovasc Med. 2022, 9, 1000546. [Google Scholar] [CrossRef] [PubMed]
- Lee, H.S.; Park, T. Pathway-Driven Approaches of Interaction between Oxidative Balance and Genetic Polymorphism on Metabolic Syndrome. Oxid. Med. Cell Longev. 2017, 2017, 6873197. [Google Scholar] [CrossRef] [PubMed]
- World Health Organization. Waist circumference and waist-hip ratio: report of a WHO expert consultation [Internet]. Geneva; [cited 2026 Feb 17]. Geneva. Available online: https://www.who.int/publications/i/item/9789241501491.
- Shafiee, G.; Keshtkar, A.; Soltani, A.; Ahadi, Z.; Larijani, B.; Heshmat, R. Prevalence of sarcopenia in the world: a systematic review and meta- analysis of general population studies. J. Diabetes Metab. Disord. 2017, 16(1), 21. [Google Scholar] [CrossRef] [PubMed]
- Health Canada. Reference Guide to Understanding and Using the Data [Internet]. 2017 [cited 2026 Feb 17]. Available online: https://www.canada.ca/en/health-canada/services/food-nutrition/food-nutrition-surveillance/health-nutrition-surveys/canadian-community-health-survey-cchs/reference-guide-understanding-using-data-2015.html.
- Ciumărnean, L.; Milaciu, M.V.; Negrean, V.; Orășan, O.H.; Vesa, S.C.; Sălăgean, O.; et al. Cardiovascular Risk Factors and Physical Activity for the Prevention of Cardiovascular Diseases in the Elderly. Int. J. Env. Res. Public Health 2021, 19(1), 207. [Google Scholar] [CrossRef]
- Zhou, R.; Chen, F.; Zhang, L.; Sun, Y.; Jiang, H.; Hu, R.; et al. Interaction between the oxidative balance score and serum per- and poly-fluoroalkyl substances (PFASs) on liver health: analysis of the NHANES 2007–2018 dataset. Env. Health Prev. Med. 29, 51. [CrossRef]
- Capone, F.; Vacca, A.; Bidault, G.; Sarver, D.; Kaminska, D.; Strocchi, S.; et al. Decoding the Liver-Heart Axis in Cardiometabolic Diseases. Circ. Res. 2025, 136(11), 1335–62. [Google Scholar] [CrossRef] [PubMed]
- Cazac, G.D.; Lăcătușu, C.M.; Mihai, C.; Grigorescu, E.D.; Onofriescu, A.; Mihai, B.M. New Insights into Non-Alcoholic Fatty Liver Disease and Coronary Artery Disease: The Liver-Heart Axis. Life 2022, 12(8), 1189. [Google Scholar] [CrossRef] [PubMed]
- Forman, H.J.; Davies, K.J.A.; Ursini, F. How do nutritional antioxidants really work: Nucleophilic tone and para-hormesis versus free radical scavenging in vivo. Free Radic. Biol. Med. 2014, Antioxidants66, 24–35. [Google Scholar] [CrossRef]
- Alì, S.; Davinelli, S.; Accardi, G.; Aiello, A.; Caruso, C.; Duro, G.; et al. Healthy ageing and mediterranean diet: a focus on hormetic phytochemicals. Mech. Ageing Dev. 2021, 200, 111592. [Google Scholar] [CrossRef] [PubMed]
- Martucci, M.; Ostan, R.; Biondi, F.; Bellavista, E.; Fabbri, C.; Bertarelli, C.; et al. Mediterranean diet and inflammaging within the hormesis paradigm. Nutr. Rev. 2017, 75(6), 442–55. [Google Scholar] [CrossRef] [PubMed]
- Bhargava, S.; Rao, Z.; Vanholder, R.; Tacke, F.; Noels, H.; Jankowski, V.; et al. The impact of gut-liver-derived mediators on the organ crosstalk with brain, heart, and kidney: A systematic review. Mol. Metab. 2026, 103, 102295. [Google Scholar] [CrossRef] [PubMed]
- Pellegrini, N.; Vitaglione, P.; Granato, D.; Fogliano, V. Twenty-five years of total antioxidant capacity measurement of foods and biological fluids: merits and limitations. J. Sci. Food Agric. 2018, 100(14), 5064–78. [Google Scholar]
- Ilari, S.; Proietti, S.; Milani, F.; Vitiello, L.; Muscoli, C.; Russo, P.; et al. Dietary patterns, oxidative stress, and early inflammation: a systematic review and meta-analysis comparing mediterranean, vegan, and vegetarian diets. Nutrients 2025, 17(3), 548. [Google Scholar] [CrossRef] [PubMed]
- Bonaccio, M.; Iacoviello, L.; Donati, M.B.; De Gaetano, G. The tenth anniversary as a UNESCO world cultural heritage: an unmissable opportunity to get back to the cultural roots of the Mediterranean diet. Eur. J. Clin. Nutr. 2022, 76(2), 179–83. [Google Scholar] [PubMed]
- Geueke, B.; Parkinson, L.V.; Groh, K.J.; Kassotis, C.D.; Maffini, M.V.; Martin, O.V.; et al. Evidence for widespread human exposure to food contact chemicals. J. Expo. Sci. Env. Epidemiol. 2025, 35(3), 330–41. [Google Scholar]
- Vinchi, F.; Muckenthaler, M.U.; Silva, M.C.D.; Balla, G.; Balla, J.; Jeney, V. Atherogenesis and iron: from epidemiology to cellular level. Front. Pharmacol. 2014, 5, 94. [Google Scholar] [CrossRef] [PubMed]
- Wang, X.; Purcaro, G.; Fan, B.; Tong, L.T.; Liu, L.; Sun, J.; et al. Antioxidant dietary fibre: A structure-function journey. Trends Food Sci. Technol. 2024, 143, 104305. [Google Scholar] [CrossRef]
- Choe, U. Role of dietary fiber and short-chain fatty acids in preventing neurodegenerative diseases through the gut-brain axis. J. Funct. Foods 2025, 129, 106870. [Google Scholar] [CrossRef]
- Blaak, E.E.; Antoine, J.M.; Benton, D.; Björck, I.; Bozzetto, L.; Brouns, F.; et al. Impact of postprandial glycaemia on health and prevention of disease. Obes. Rev. 2012, 13(10), 923–84. [Google Scholar] [CrossRef] [PubMed]
Figure 1.
Correlation matrix between dietary scores (OBSN, OBSF, OBSL, OBSN-L and OBSF-L) and biomarkers of oxidative stress, inflammation and metabolic health in older adults at high cardiovascular risk.
Figure 1.
Correlation matrix between dietary scores (OBSN, OBSF, OBSL, OBSN-L and OBSF-L) and biomarkers of oxidative stress, inflammation and metabolic health in older adults at high cardiovascular risk.
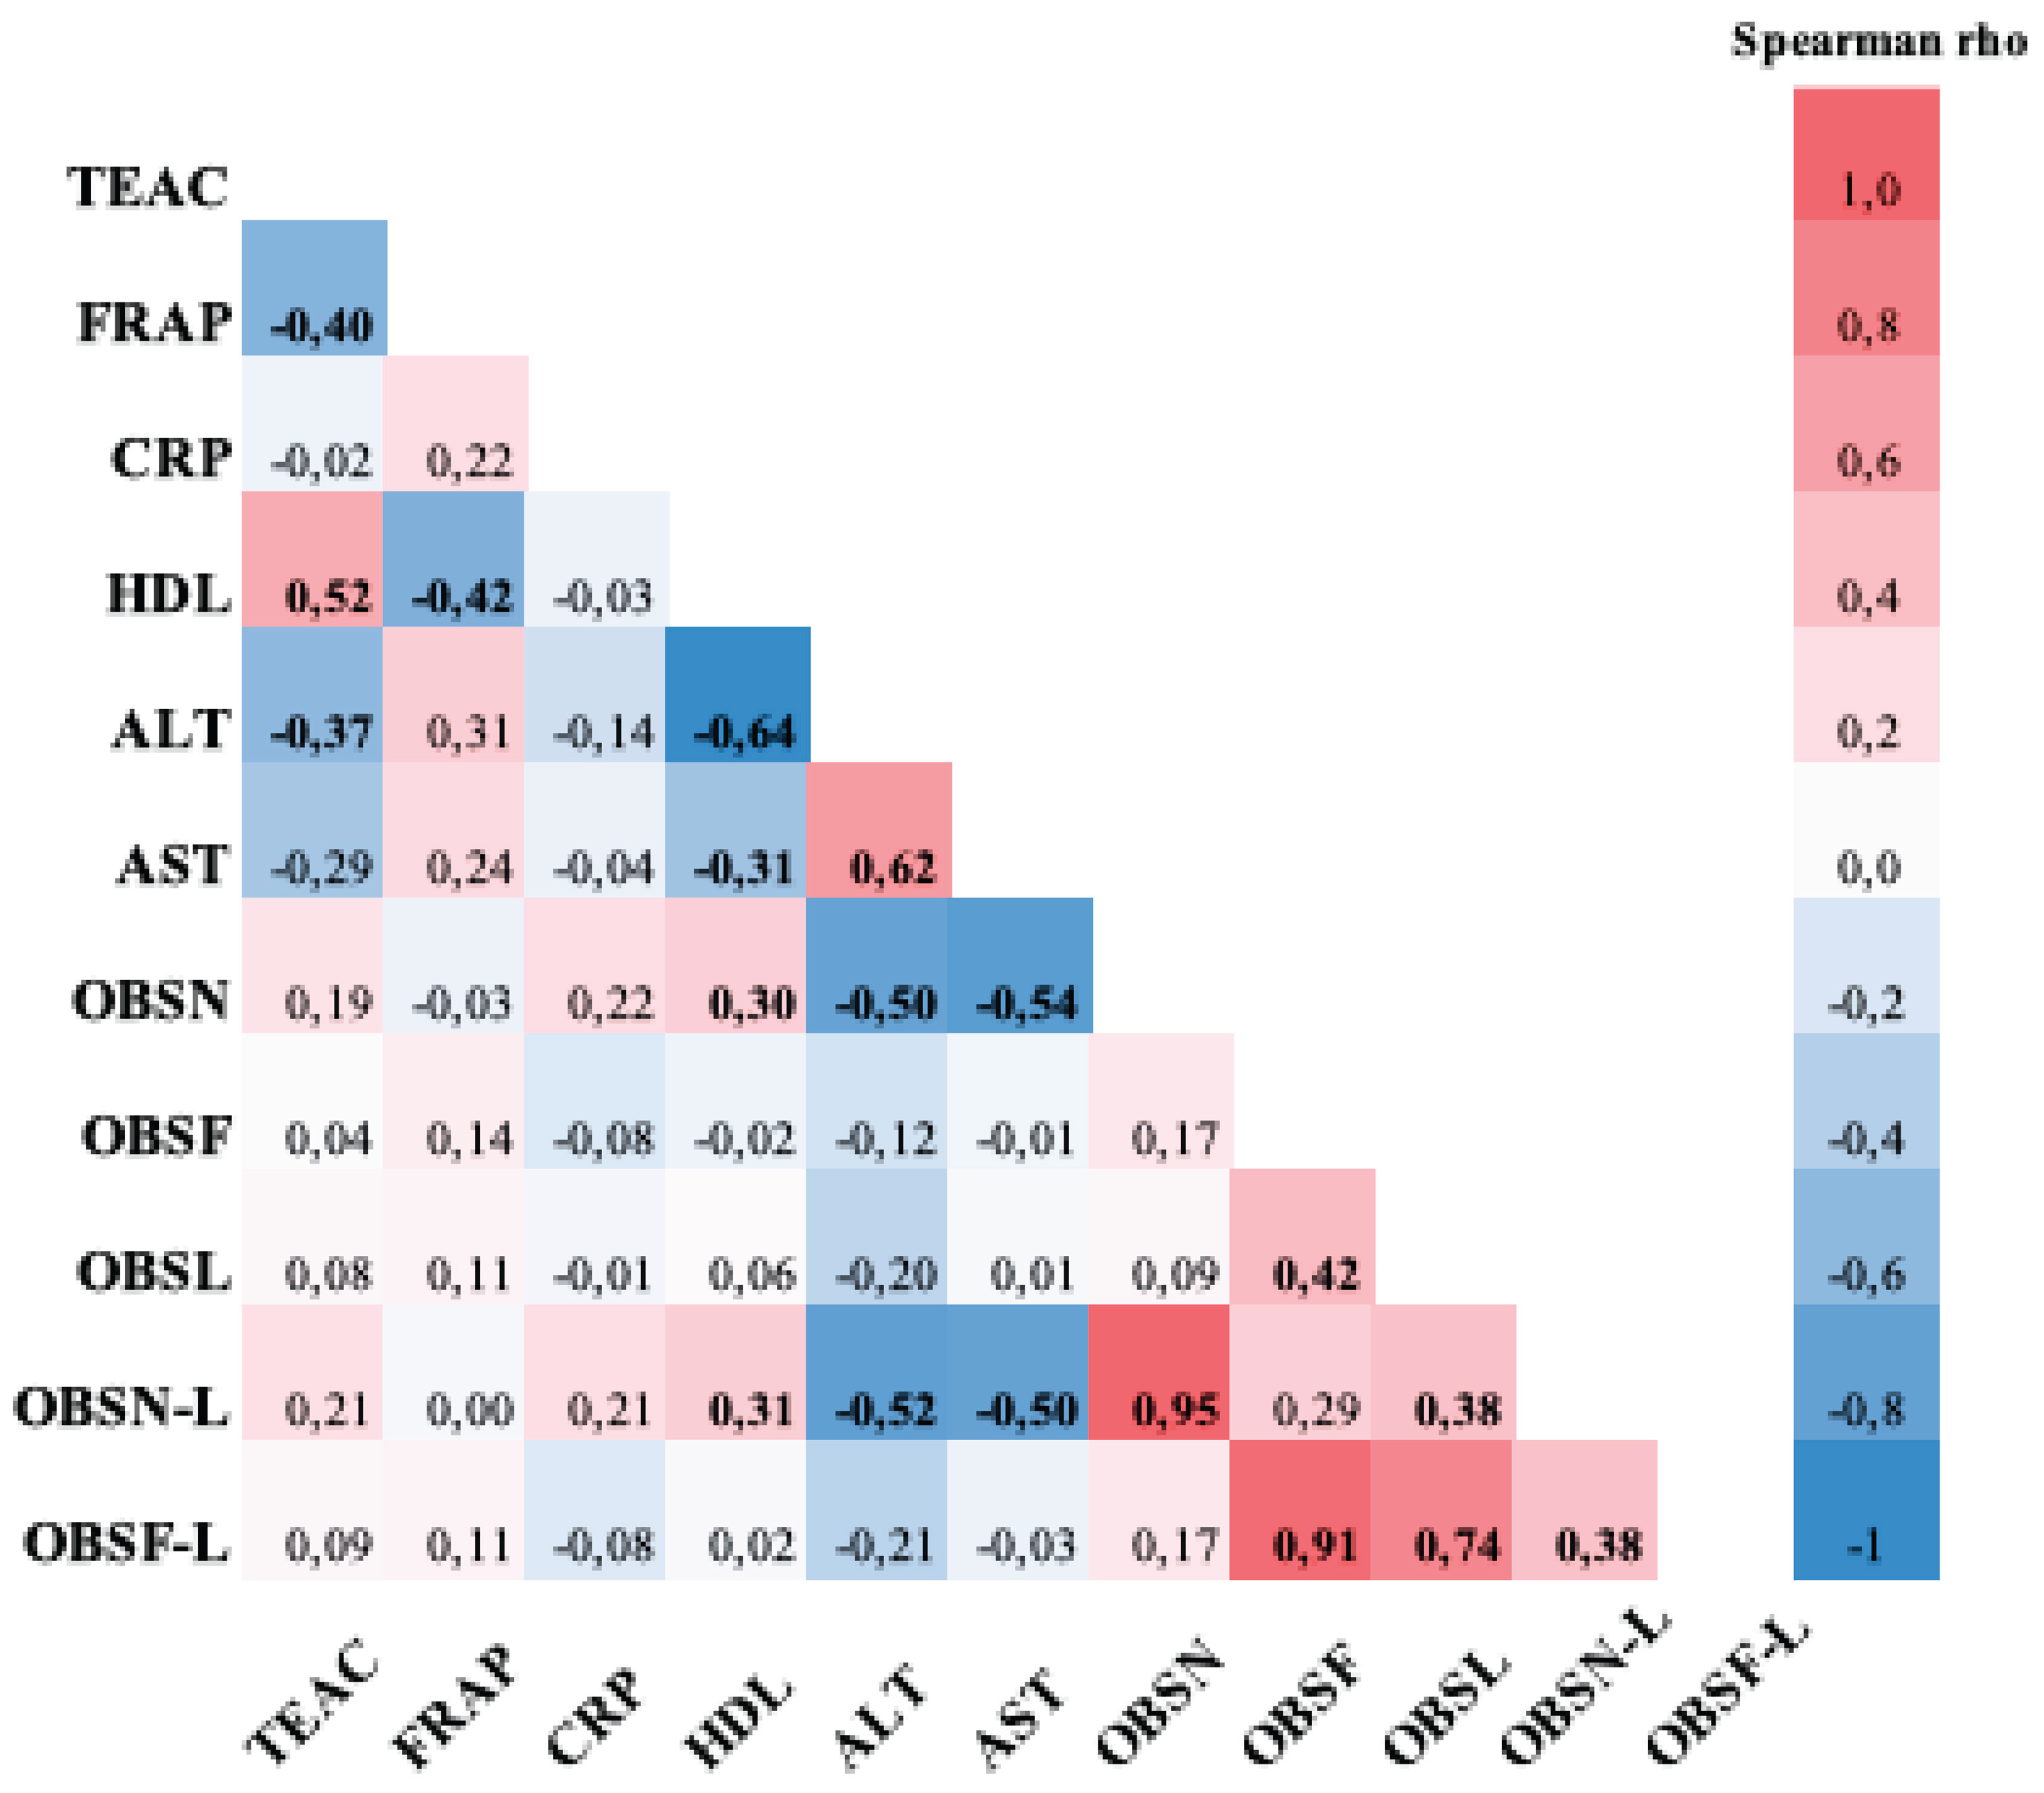

Table 1.
Descriptive characteristics of study participants.
| Characteristics |
Healthy (n=16)(a) |
Hyperlipidemic (n=14)(a) |
Post-MI (n=14)(a) |
p-Value(b) | η²(c) |
| Age (years) | 73.86 ± 5.31 | 73.50 ± 5.26 | 73.89 ± 6.17 | 0.985 | 0.001 |
| Education (years) | 15.36 ± 3.80 | 14.38 ± 2.92 | 13.56 ± 3.68 | 0.071 | 0.127 |
| Gender Females Males |
7 (43.8) 9 (56.3) |
11 (78.6) 3 (21.4) |
3 (21.4) 11 (78.6) |
0.008 |
-- |
| Weight (kg) | 73.49 ± 17.61 | 66.59 ± 12.60 | 77.36 ± 12.60 | 0.206 | 0.089 |
| Height (cm) | 166.07 ± 8.91 | 159.94 ± 8.88 | 170.11 ± 10.90 | 0.132 | 0.094 |
| BMI (kg/m2) | 27.05 ± 4.83 | 26.00 ± 3.72 | 26.96 ± 3.34 | 0.789 | 0.058 |
| Waist circumference (cm) | 106.59 ± 26.15 | 91.91 ± 11.36 | 99.07 ± 10.97 | 0.125 | 0.101 |
| Medication use Yes No |
4 (25) 12 (75) |
6 (50) 6 (50) |
14 (100) 0 (0) |
<0.001 | -- |
| Alcohol (weekly consumption) | 3.39 ± 2.81 | 7.16 ± 6.60 | 7.15 ± 9.00 | 0.249 | 0.053 |
| Physical activity (min/week) | 178.6 ± 142.4 | 207.3 ± 206.4 | 140.8 ± 163.3 | 0.632 | 0.097 |
| TEAC (µM TE) | 1510.1 ± 211.1 |
1575.2 ± 77.64 |
1486.2 ± 216.4 | 0.475 | 0.046 |
| FRAP (µM Fe2+) | 863.49 ± 153.8 | 750.69 ± 111.4 | 803.09 ± 123.0 | 0.082 | 0.145 |
| CRP (mg/L) | 1.67 ± 1.19 | 2.21 ± 1.65 | 1.28 ± 0.68 | 0.184 | 0.001 |
| HDL (mmol/L) | 1.69 ± 0.50 a |
2.00 ± 0.50 ab |
1.19 ± 0.26 c |
<0.001 | 0.359 |
| ALT (UI/L) | 17.79 ± 5.26 a |
15.45 ± 3.17 ab |
31.15 ± 15.56 c |
<0.001 | 0.333 |
| AST (UI/L) | 20.64 ± 5.03 a |
21.27 ± 5.71 ab |
27.46 ± 10.18 c |
0.034 | 0.155 |
Data are expressed as mean ± standard deviation for continuous variables and as frequency (percentage) for categorical variables. Abbreviations: BMI, body mass index; WC, waist circumference; TEAC, Trolox equivalent antioxidant capacity; CRP, C-reactive protein; OBS, oxidative balance score; HDL, high density lipoprotein; ALT, alanine aminotransferase; AST, aspartate aminotransferase. aHealthy participants (no history of CVD), hyperlipidemic participants, and participants with history of myocardial infarction. b One-way ANOVA with Bonferroni post-hoc test (continuous variables) or Fisher's exact test (categorical variables). Groups not sharing a common letter differ significantly (p < 0.05). Bold indicates statistical significance at p < 0.05. c Eta-squared (η²).
Table 2.
Dietary intake (energy, macro- and micronutrient) of study participants.
| Energy/Nutrients |
Healthy (n=16)(a) |
Hyperlipidemic (n=14)(a) |
Post-MI (n=14)(a) |
p-Value(b) | η²(c) |
| Energy (kcal/d) | 1851.9 ± 400.90 | 1988.0 ± 400.62 | 1809.60 ± 502.70 | 0.458 | 0.037 |
| %RDA | 99.44 ± 23.72 | 109.08 ± 26.41 | 93.09 ± 17.49 | 0.214 | 0.073 |
| Protein (g/d) | 84.51± 31.71 | 77.44 ± 17.23 | 74.92 ± 17.45 | 0.180 | 0.080 |
| % E | 17.96 ± 5.61 | 16.77 ± 3.43 | 15.79 ± 2.90 | 0.106 | 0.104 |
| Carbohydrates (g/d) | 221.39 ± 37.64 | 220.12 ± 53.72 | 216.64 ± 83.42 | 0.870 | 0.007 |
| % E | 43.00 ± 9.50 | 48.60 ± 15.61 | 45.47 ± 14.39 | 0.786 | 0.012 |
| Total fat (g/d) | 75.42 ± 20.31 | 84.26 ± 22.95 | 70.45 ± 24.40 | 0.289 | 0.059 |
| % E | 36.63 ± 11.66 | 41.59 ± 12.24 | 32.72 ± 7.55 | 0.123 | 0.097 |
| SFA (g/d) | 24.29 ± 7.00 | 25.83 ± 9.90 | 23.92 ± 10.13 | 0.785 | 0.012 |
| % E | 11.74 ± 3.89 | 12.62 ± 4.59 | 11.18 ± 4.32 | 0.605 | 0.024 |
| MUFA (g/d) | 34.25 ± 13.45 | 33.87 ± 10.90 | 26.15 ± 11.29 | 0.138 | 0.092 |
| % E | 16.83 ± 7.07 | 16.83 ± 6.19 | 12.07 ± 3.72 | 0.059 | 0.129 |
| PUFA (g/d) | 13.94 ± 5.68 | 16.26 ± 6.42 | 14.24 ± 5.41 | 0.696 | 0.018 |
| % E | 6.68 ± 3.5 | 8.02 ± 3.17 | 6.64 ± 1.87 | 0.472 | 0.036 |
| Trans fat (g/d) | 1.05 ± 0.53 | 1.17 ± 0.83 | 1.17 ± 1.12 | 0.889 | 0.006 |
| % E | 0.51 ± 0.28 | 0.57 ± 0.40 | 0.56 ± 0.55 | 0.900 | 0.005 |
| Fibres (g/d) | 20.04 ± 5.10 | 21.96 ± 6.90 | 21.64 ± 15.58 | 0.961 | 0.002 |
| % E | 81.10 ± 27.99 | 97.86 ± 35.37 | 76.95 ± 51.91 | 0.403 | 0.043 |
| Vitamin C (%RDA) | 169.70 ± 94.63 | 175.26 ± 107.45 | 107.20 ± 50.45 | 0.072 | 0.120 |
| Vitamin E (%RDA) | 51.47 ± 12.19 | 63.08 ± 20.18 | 45.73 ± 29.20 | 0.109 | 0.102 |
| Vitamin A (%RDA) | 85.02 ± 33.10 ab |
119.13 ± 58.11 a |
80.13 ± 34.09 b |
0.047 | 0.138 |
| Selenium (%RDA) | 241.87 ± 140.54 | 251.07 ± 196.17 | 175.84 ± 55.03 | 0.301 | 0.057 |
| Zinc (%RDA) | 115.47 ± 41.03 a |
108.70 ± 27.88 ab |
81.82 ± 32.98 b |
0.045 | 0.140 |
| β-carotene (mg/d) | 4121± 2439 | 5729 ± 3888 | 3399 ± 2902 | 0.139 | 0.047 |
| Lutein/zeaxanthin (mg/d) | 2327 ± 1932 | 2140 ± 1290 | 2101 ± 2332 | 0.941 | 0.003 |
| Lycopene (mg/d) | 3701 ± 5324 | 5394 ± 7849 | 1218 ± 1784 | 0.148 | 0.089 |
Data are expressed as mean ± standard deviation for continuous variables and frequency (percentage) for categorical variables. Abbreviations: %E, percentage of total energy intake; RDA, recommended dietary allowances; SFA, saturated fatty acid; MUFA, monounsaturated fatty acids; PUFA, polyunsaturated fatty acids. aHealthy participants (no history of CVD), hyperlipidemic participants, and participants with history of myocardial infarction. b One-way ANOVA with Bonferroni post-hoc test (continuous variables). Groups not sharing a common letter differ significantly (p < 0.05). Bold indicates statistical significance at p < 0.05. c Eta-squared (η²).
Table 3.
Food groups consumption of study participants.
| Food groups |
Healthy (n=16)(a) |
Hyperlipidemic (n=14)(a) |
Post-MI (n=14)(a) |
p-Value(b) | η²(c) |
| Fats | 20.11 ± 15.41 | 13.72 ± 13.44 | 10.36 ± 12.29 | 0.151 | 0.088 |
| Vegetables | 305.20 ± 188.18 | 203.05 ± 117.08 | 203.04 ± 152.35 | 0.134 | 0.093 |
| Fruits | 214.61 ± 115.53 | 267.31 ± 186.21 | 247.32 ± 117.80 | 0.458 | 0.037 |
| Cereals (including bread and potatoes) | 66.33 ± 57.13 | 63.72 ± 96.37 | 23.16 ± 30.69 | 0.148 | 0.089 |
| Legumes | 27.93 ± 35.25 | 15.82 ± 20.61 | 24.27 ± 39.27 | 0.650 | 0.021 |
| Nuts and seeds | 3.35 ± 7.02 | 9.87 ± 10.48 | 7.31 ± 16.66 | 0.299 | 0.057 |
| Fish and seafood | 36.43 ± 55.28 | 38.63 ± 53.51 | 57.33 ± 56.82 | 0.506 | 0.033 |
| Poultry | 31.38 ± 50.06 | 23.81 ± 25.02 | 17.48 ± 21.53 | 0.483 | 0.035 |
| Milk and dairy products | 168.73 ± 137.31 | 204.84 ± 147.16 | 207.71 ± 155.97 | 0.729 | 0.015 |
| Red Meat | 62.51 ± 50.39 a |
26.36 ± 41.02 b |
11.54 ± 22.99 b |
0.007 | 0.248 |
| Processed meat | 7.23 ± 9.55 | 22.64 ± 26.53 |
25.79 ± 37.69 | 0.119 | 0.099 |
| Meat and processed meat | 86.05 ± 80.28 | 46.45 ± 37.33 | 38.48 ± 48.22 | 0.098 | 0.107 |
| Alcohol (g/d) | 6.02 ± 7.56 | 12.06 ± 13.42 |
7.63 ± 12.42 |
0.659 | 0.002 |
Data are expressed as mean ± standard deviation for continuous variables and as frequency (percentage) for categorical variables. Abbreviations: %E, percentage of total energy intake; RDA, recommended dietary allowances; SFA, saturated fatty acid; MUFA, monounsaturated fatty acids; PUFA, polyunsaturated fatty acids. aHealthy participants (no history of CVD), hyperlipidemic participants, participants with a history of myocardial infarction. b One-way ANOVA with Bonferroni post-hoc test (continuous variables). Groups not sharing a common letter differ significantly (p < 0.05). Bold indicates statistical significance at p < 0.05. c Eta-squared (η²).
Table 4.
Oxidative balance scores of study participants.
| OBS |
Healthy (n=16)(a) |
Hyperlipidemic (n=14)(a) |
Post-MI (n=14)(a) |
p-Value(b) | η²(c) |
| OBSN | 16.25 ± 4.15 ab |
18.00 ± 4.30 a |
12.50 ± 4.43 b |
0.005 | 0.227 |
| OBSF | 8.63 ± 1.45 | 8.50 ± 3.61 | 9.79 ± 2.78 | 0.387 | 0.045 |
| OBSL | 2.13 ± 1.31 | 2.57 ± 1.83 | 2.43 ± 1.40 | 0.713 | 0.016 |
| OBSN-L | 18.34 ± 4.72 ab |
20.57 ± 4.42 a |
14.93 ± 4.97 b |
0.010 | 0.200 |
| OBSF-L | 10.75 ± 2.05 | 11.07 ± 4.80 | 12.21 ± 3.81 | 0.531 | 0.030 |
Data are expressed as mean ± standard deviation for continuous variables and as frequency (percentage) for categorical variables. aHealthy participants (no history of CVD), hyperlipidemic participants, participants with a history of myocardial infarction. b One-way ANOVA with Bonferroni post-hoc test (continuous variables). Groups not sharing a common letter differ significantly (p < 0.05). Bold indicates statistical significance at p < 0.05. c Eta-squared (η²).
Table 5.
Coefficients of multiple linear regression models examining the association between nutrient-based OBS and lifestyle nutrient-based OBS and circulating biomarkers (N = 44).
Table 5.
Coefficients of multiple linear regression models examining the association between nutrient-based OBS and lifestyle nutrient-based OBS and circulating biomarkers (N = 44).
| Model 1 | Model 2 | |||||||
| β (95% CI) |
β (SE) |
P Value | R2 | β (95% CI) |
β (SE) |
P Value | R2 | |
| OBSN | ||||||||
| HDL | 0.040 (0.011, 0.070) |
0.018 | 0.029 | 0.119 | 0.033 (-0.007, 0.069) |
0.016 | 0.045 | 0.545 |
| ALT | -1.613 (-2.646, -0.502) |
0.314 | <0.001 | 0.417 | -1.530 (-2.779, -0.329) |
0.381 |
<0.001 |
0.453 |
| AST | -0.962 (-1.432, -0.419) |
0.221 | <0.001 | 0.340 | -0.845 (-1.402, -0.218) |
0.257 | 0.002 | 0.430 |
| OBSN-L | ||||||||
| HDL | 0.038 (0.005, 0.078) |
0.017 | 0.028 | 0.121 | 0.024 (-0.010, 0.060) |
0.014 | 0.101 | 0.526 |
| ALT | -1.572 (-2.454, -0.560) |
0.288 |
<0.001 |
0.446 | -1.475 (-2.477, -0.398) |
0.325 |
<0.001 |
0.499 |
| AST | -0.855 (-1.270, -0.326) |
0.214 |
<0.001 |
0.303 | -0.791 (-1.228, -0.211) |
0.225 | 0.001 | 0.449 |
The coefficients β, the corresponding 95% confidence intervals (CI) and standard errors (SEs), and R2 are shown (representing the proportion of variance explained by the independent variables). Bold indicates statistical significance at p < 0.05. The grey-shaded rows indicate models with statistically significant associations. Abbreviations: HDL, High-density lipoprotein cholesterol; ALT, alanine aminotransferase; AST, aspartate aminotransferase. Model 1: unadjusted model; model 2 adjusted for age, sex, medication use, and waist circumference.
Table 6.
Coefficients of multiple linear regression models examining the association between individual nutrient and lifestyle components and circulating biomarkers (N = 44).
Table 6.
Coefficients of multiple linear regression models examining the association between individual nutrient and lifestyle components and circulating biomarkers (N = 44).
| AST | ALT | |||||||
| β (95% CI) |
β (SE) |
P Value | R2 |
β (95% CI) |
β (SE) |
P Value | R2 | |
| Antioxidants | ||||||||
| Vitamin E | -1.348 (-4.922, 1.596) | 1.679 | 0.428 | 0.258 | -4.960 (-10.180, -1.198) | 2.517 | 0.057 | 0.271 |
| Vitamin C | -3.514 (-6.669, -0.597) | 1.321 | 0.012 | 0.377 | -5.225 (-10.031, -1.534) | 2.097 | 0.018 | 0.315 |
| Vitamin A | -3.588 (-6.370, -0.934) | 1.377 | 0.014 | 0.372 | -4.520 (-9.502, -0.614) | 2.239 | 0.052 | 0.275 |
| Lycopene | 1.176 (-2.103, 3.925) | 1.537 | 0.450 | 0.256 | -1.002 (-4.956, 3.118) | 2.427 | 0.682 | 0.190 |
| Lutein/zeaxanthin | -2.154 (-5.959, 1.112) | 1.493 | 0.159 | 0.288 | -3.377 (-8.518, 0.242) | 2.343 | 0.159 | 0.234 |
| ß-carotene | -2.306 (-5.067, 1.190) | 1.569 | 0.151 | 0.290 | -3.212 (-8.456, 1.682) | 2.480 | 0.204 | 0.225 |
| Selenium | -2.618 (-5.996, 0.556) | 1.405 | 0.071 | 0.315 | -3.620 (-8.533, 0.332) | 2.231 | 0.114 | 0.246 |
| Zinc | 0.308 (-3.013, 3.429) | 1.518 | 0.840 | 0.244 | -2.615 (-7.864, 1.469) | 2.340 | 0.272 | 0.215 |
| Fibre | -3.801 (-7.198, -0.483) | 1.587 | 0.022 | 0.355 | -5.757 (-12.593, -0.399) | 2.506 | 0.028 | 0.298 |
| Vitamin B9 | -2.351 (-5.352, 0.162) | 1.399 | 0.102 | 0.303 | -4.305 (-8.735, -0.664) | 2.161 | 0.055 | 0.273 |
| Calcium | -2.828 (-6.180, 0.653) | 1.639 | 0.094 | 0.306 | -5.511 (-12.097, -0.118) | 2.509 | 0.035 | 0.289 |
| MUFA | 0.439 (-2.854, 3.099) | 1.566 | 0.781 | 0.245 | -2.736 (-7.550, 1.194) | 2.414 | 0.265 | 0.216 |
| Physical activity | -1.199 (-4.392, 1.694) | 1.642 | 0.470 | 0.255 | -5.310 (-10.665, -1.597) | 2.428 | 0.036 | 0.181 |
| Pro-oxidants | ||||||||
| Fer | 3.080 (0.508, 6.306) | 1.473 | 0.044 | 0.332 | 5.080 (0.225, 11.392) | 2.296 | 0.034 | 0.291 |
| SFA | -3.048 (-5.715, -0.583) | 1.396 | 0.036 | 0.238 | -1.766 (-7.186, 3.299) | 2.324 | 0.453 | 0.200 |
| PUFA | -1.737 (-6.205, 3.959) | 2.473 | 0.487 | 0.254 | 1.767 (-3.360, 10.058) | 3.898 | 0.653 | 0.191 |
| Alcohol | -1.193 (-4.091, 1.276) | 1.319 | 0.372 | 0.261 | -1.240 (-5.976, 2.732) | 2.085 | 0.556 | 0.194 |
The coefficients β, the corresponding 95% confidence intervals (CI) and standard errors (SEs), and R2 are shown (representing the proportion of variance explained by the independent variables). Bold indicates statistical significance at p < 0.05. The grey-shaded rows indicate models with statistically significant associations. Abbreviations: HDL, High-density lipoprotein cholesterol; ALT, alanine aminotransferase; AST, aspartate aminotransferase; SFA, Saturated fatty acid; MFA, Monounsaturated fatty acids; PUFA, Polyunsaturated fatty acids. Model is adjusted for age, sex, medication use, and waist circumference.
Disclaimer/Publisher’s Note: The statements, opinions and data contained in all publications are solely those of the individual author(s) and contributor(s) and not of MDPI and/or the editor(s). MDPI and/or the editor(s) disclaim responsibility for any injury to people or property resulting from any ideas, methods, instructions or products referred to in the content. |
© 2026 by the authors. Licensee MDPI, Basel, Switzerland. This article is an open access article distributed under the terms and conditions of the Creative Commons Attribution (CC BY) license (http://creativecommons.org/licenses/by/4.0/).
Copyright: This open access article is published under a Creative Commons CC BY 4.0 license, which permit the free download, distribution, and reuse, provided that the author and preprint are cited in any reuse.


