

Submitted:
07 July 2026
Posted:
09 July 2026
You are already at the latest version
Abstract
Invasive species are managed to mitigate ecosystem effects; however, unintended consequences from suppression may result. Investigating effects of management actions on lower trophic levels and nutrient dynamics can help avoid unintended consequences. Fish carcasses were deposited in the littoral zone in Yellowstone Lake, Wyoming, U.S.A. during autumn to suppress embryos of invasive trout at spawning sites. We studied the degree to which adding carcasses to the littoral spawning sites indirectly benefited invasive trout by altering food resources. We used carcasses as a natural isotopic tracer to estimate the degree to which carcasses were integrated into the food web. We compared basal resource and amphipod δ15N and δ13C signatures at reference and treatment sites. We also estimated the contribution of carcasses to amphipod diet, and the contribution of amphipods to invasive and native trout diets using stable isotope mixing models. Isotopic signatures of basal resources did not differ between treatment and reference sites. Amphipod isotopic signatures changed after treatment, but < 3% of amphipod diet was carcass. Amphipods contributed < 24% of estimated diet for invasive trout, but > 55% of estimated diet for native trout. δ13C values of amphipods and phytoplankton increased at reference and treatment sites after autumn turnover suggesting carcass material was distributed throughout the lake. Unused carcasses from gillnetting discarded in the profundal zone since 1995 appeared to influence nutrient dynamics more than those added to the littoral zone. We demonstrate that investigating food web dynamics simultaneously with suppression to prevent unintended consequences can aid in developing effective management plans that minimally alter ecosystems.
Keywords:
isotopes
; lake trout
; Yellowstone cutthroat trout
; carcass addition
; Yellowstone National Park
; control of invasive species
‡ Current address: Trout Unlimited, Laramie, WY, USA.
1. Introduction
Managing ecosystems can result in unintended consequences, where hypothesized outcomes of management actions do not align with empirical observations [1,2,3,4]. Unintended consequences can result from introducing a species to bolster ecosystem processes causing a trophic cascade [5] or from invasive species management [6,7,8]. When specifically managing invasive species, unintended consequences can include unanticipated changes resulting from the management action (e.g., poisoning of non-target species and scavengers [9,10,11,12]), failing to influence the target species [2], or discovering something that is counter to accepted knowledge (e.g., discovering trophic dynamics where the invasive species has become critical prey for endangered native predators [13]). Avoiding unintended consequences is key considering the monetary, social, and political capital often focused on invasive species suppression [14,15,16,17].
An incredible proportion of financial resources (trillions of US dollars from 1960 – 2020) are allocated to invasive species suppression or eradication [15] due to the overwhelming negative effects invasive species can have on native species and ecosystem function [18,19]. A variety of methods have been developed to suppress or eradicate invasive species through mechanical (e.g., gill nets), chemical (e.g., poisoning), and biological approaches (e.g., using lethal pathogens, engineered immunocontraception or sterilization, and sex-skewing). Great effort has also been devoted to the design and implementation of new methods and strategies to contain, control, or eradicate invasive fishes [20]. In some cases, integrated pest management (IPM [21,22]), which uses multiple suppression methods targeting numerous life stages of an invasive species, can be more effective than a single suppression method [23].
A novel IPM strategy, embryo suppression via decomposing carcass, uses carcasses from gillnetting invasive fish to induce mortality of their embryos via hypoxia from decomposition [24,25]. Fish carcasses can alter ecosystems, especially during mass mortality events. Decomposing carcasses recycle nutrients when muscle tissue (source of nitrogen; N) and bone (source of phosphorus) mineralize into forms that are readily available to primary producers. Mass fish mortality can increase secondary production through bottom-up effects where the basal trophic level is fertilized by decomposing carcasses [26,27]. For example, decomposing adult salmon carcasses can provide a critical carbon (C) and N source for juvenile salmon [28,29,30,31,32]. Furthermore, fish carcasses provide a valuable source of nutrients in the form of easily digestible lipids and proteins that facilitate efficient energy recycling within the ecosystem [33,34,35,36]. Understanding the potential unintended consequences of embryo suppression is vital so that managers can estimate the degree to which the addition of carcasses may affect the food web—especially given the effect that naturally produced carcasses can have on ecosystems (e.g., increased biomass of periphyton, macroinvertebrates, and fish, [37]).
Embryo suppression using fish carcasses could result in unintended consequences where carcasses fertilize primary producers and stimulate the food web through bottom-up effects, potentially favoring the invasive species. Native Yellowstone cutthroat trout (Oncorhynchus virginalis bouvieri) declined in Yellowstone Lake, Yellowstone National Park, Wyoming, U.S.A after the invasion of lake trout (Koel et al. 2019), causing a trophic cascade [38,39]. One year after lake trout (Salvelinus namaycush) discovery (i.e., 1995), the National Park Service initiated an aggressive mechanical removal program via gillnetting, which gillnetted >5 million lake trout by 2024 [40]. Gillnetters euthanized lake trout, punctured the swim bladders, and returned carcasses to the lake at depths >70 m since 1995. In the autumn of 2016, a portion of the lake trout carcasses were used to suppress lake trout embryos in the littoral zone and caused >97% mortality via hypoxia (experimental controls had 25 - 75% mortality [24,25]).
Here, we used carcasses as a natural tracer to estimate the degree to which embryo suppression via carcass deposition altered the food web, with the intention to avoid untended consequences from this management action. Depositing carcasses increases the availability of nutrients to primary producers and may be a novel food source for benthic invertebrates (e.g., amphipods). Amphipods are a primary food source for both native and invasive trout [41,42,43]. If amphipods consume carcass, embryo suppression via carcass deposition has the potential to confound lake trout suppression through a positive feedback loop by increasing post-hatch recruitment of surviving lake trout. Our specific questions were: 1) does carcass decomposition in the littoral zone alter basal food sources, 2) what proportion of amphipod (i.e., Gammarus) diet is composed of carcass, and 3) to what extent do invasive and native trout consume amphipods? Answers to these questions will provide context as to whether this novel suppression strategy could result in unintended consequences.
2. Materials and Methods
2.1. Study Area
Yellowstone Lake, Yellowstone National Park, Wyoming, U.S.A., is the largest high elevation (>2000 m) lake in North America with a surface area of 341 km2 and littoral zone (<20 m depth) composing 23% of the surface area [44]. The average depth of Yellowstone Lake is 42 m, but maximum depths are >100 m [45] with active volcanic vents in certain areas of the lake (West Thumb and the northeastern area [46]). Yellowstone Lake is dimictic and ice covered from late December through late May to early June annually [47]. Summer stratification generally occurs from mid-July to mid-September [38]. Average monthly water temperatures range between 9 and 18 °C during the open water season. Information on water quality and general conditions at our sites are reported by Lujan et al. [48] and Tronstad et al. [49].
Yellowstone Lake is home to two native fish species (Yellowstone cutthroat trout and longnose dace, Rhinichthys cataractae) and four introduced nonnative species including the abundant and invasive lake trout. Yellowstone cutthroat trout (cutthroat trout hereafter) reside in Yellowstone Lake during most of the year and adults migrate to numerous tributary streams where they spawn each spring. Adult cutthroat trout live in the littoral zone and juveniles are thought to live in the pelagic zone feeding on zooplankton [50], though recent surveys have sampled juveniles in the littoral zone. Unlike the native cutthroat trout, lake trout complete their entire lifecycle within Yellowstone Lake. Lake trout tend to return to spawning sites used in previous years, which allowed spawning sites to be located from gillnetting efforts and radio telemetry studies [51,52,53]. We conducted our study at two treatment sites and two reference sites across the lake in 2018 and 2019 (Figure 1). Sites were selected based on spawning habitat, substrate, productivity, and accessibility for sampling. Treatment sites were confirmed as spawning locations by observing viable embryos using SCUBA divers and remote operated vehicles and had received minimal-to-no carcass additions in the past. Wolf Point was the shallow reference site in 2018 and Elk Point was the shallow reference site in 2019. Reference sites were not confirmed spawning locations but had suitable spawning substrate [54]. Carcasses from gillnetting efforts discarded during the ice-free season in years leading up to the experiment were deposited at profundal sites in different locations around the lake (Figure 1).
2.2. Carcass Deposition
We added carcasses to treatment sites in late summer to deter spawning lake trout and autumn to increase embryo mortality. Fewer carcasses were added to our sites in 2018 compared to 2019 [49]. Snipe Point (early season site hereafter) received ~2,200 kg wet mass (WM) of lake trout carcasses in 2018 (initiated on 29 August 2018) and ~5,900 kg WM of carcasses in 2019 (initiated 10 August 2019). Olson Reef (late season site hereafter) was treated with carcasses after spawning occurred on 1 October 2018 and 2019. The late season site received ~440 kg WM in 2018 and ~400 kg WM of carcasses in 2019.
2.3. Field Sampling and Laboratory Preparations
We collected samples from all trophic levels to estimate the degree to which lake trout carcasses were incorporated into the food web. We collected basal resources (i.e., periphyton, phytoplankton, detritus, sediment), primary consumers (i.e., zooplankton, benthic invertebrates), secondary consumers (i.e., cutthroat trout, Leuciscids: lake chub, longnose dace, redside shiner) and apex predators (i.e., lake trout) to detect the fate of C and N from carcasses in the food web (Figure 2). We collected samples prior to treatment in June through August 2018 and 2019, and samples after treatment with carcasses were collected from August to October 2018 and 2019 (see carcass deposition section for dates of treatment). Periphyton on benthic cobbles was collected by SCUBA divers. Cobbles were stored in plastic bags while being transported to the laboratory where we scrubbed the surface with a brush to remove periphyton. The periphyton was filtered onto a 25 mm, type-A/E glass-fiber filters (Pall Life Sciences, Port Washington, New York) until the filter was saturated with periphyton and water could no longer penetrate. We sampled phytoplankton by collecting 3 L of water at each site and date using a beta bottle (Wildco, Yulee, Florida). We prepared two replicate samples of phytoplankton where 1.2 liters of water were filtered onto 25 mm type A/E glass fiber filters (Pall Life Sciences, Port Washington, New York). SCUBA divers retrieved fine sediments from the benthos and separated detritus from sediments by elutriating the lighter organic matter. We collected three zooplankton samples by towing a plankton net (80 µm mesh) 20 m vertically. SCUBA divers collected benthic invertebrates using a diver operated suction sampler (see Briggs et al. 2022 for more details). All samples were transported to the laboratory in a cooler of ice and processed immediately. The zooplankton and benthic invertebrates were placed in deionized water in a refrigerator overnight to clear their digestive tracts before being frozen. We separated benthic invertebrates into functional feeding groups (i.e., filterer, gatherer, predator, scraper, shredder). We analyzed the two amphipod species in the lake separately (Gammarus lacustris and Hyalella azteca) because a substantial proportion of lake trout diet is amphipods [41,43] and amphipod diets may differ between species. We froze (-18 °C) all samples until they could be dried (30 °C for at least 1 day) and encapsulated for isotope analysis. About 1 mg of invertebrate tissue was needed for isotope analysis, and the number of specimens needed per sample depended on the individual biomass of each taxon. Generally, we analyzed 3 replicate samples of each type per visit (≥4 visits before and after treatment per site). Two types of trout samples were collected lake-wide during the ice-free seasons in 2018 and 2019 for isotope analysis. We collected muscle plugs (~10 g of dorsal muscle tissue) of lake trout and cutthroat trout in different size classes to represent ontogenetic diet shifts using the same methods as Syslo et al. [41]. We also collected 20 lake trout carcasses of varying sizes in 2018 and processed them whole in a blender to represent the isotopic values of carcasses available for uptake in the food web. We tested the degree to which the isotopic signatures of whole carcasses varied from lake trout muscle plugs using generalized linear models (glm). Fish tissues were freeze dried for 18 hours by using a Labconco Freezone 1 (Labconco Corporation, Kansas City, Missouri), ground to a fine powder with a mortar and pestle, and encapsulated for isotopic analysis.
Samples were analyzed at the University of Wyoming Stable Isotope Facility using an elemental analyzer (Thermo Finnigan Delta Plus XP, Costech 4010 and Carlo Erba 1110 Elemental Analyzer, Costech Zero Blank Autosampler, and Finnigan Conflo III Interface). Stable isotope ratios were calculated using standard procedures outlined in Hershey et al. [55] and Vander Zanden & Rasmussen [56].
2.4. Detection of Isotopic Change After Carcass Addition
We measured the signatures of δ 15N and δ13C of basal resources (detritus, sediment, periphyton and phytoplankton) and amphipods to estimate the degree to which lake trout carcasses were incorporated into the littoral food web. If lake trout carcasses were assimilated into the food web, we would expect the primary producers and consumers δ15N to increase and δ13C to decrease at the treatment site after carcass addition, reflecting the isotopic signatures of lake trout. We used glm in the package lme4 [57] analyzed using a Gamma distribution to estimate differences in δ15N and δ13C stable isotope signatures. Our data were not normally distributed, so we inspected histograms and used the fitdistrplus package [58] to choose the distribution that most closely matched our data. We included whether the site had carcass deposited (reference vs. treatment), time period (pre- vs. post-carcass addition), year (2018 or 2019; sediment samples only), material (detritus, sediment, periphyton and phytoplankton) and interaction terms between treatment and time period, and material and time period as predictor variables to estimate the degree to which δ15N and δ13C values of basal resource changed (response variables). We did not include an interaction term between year and treatment because we lacked samples for all materials except sediment in 2018. We estimated differences in δ15N and δ13C among basal resources using estimated marginal means (emmeans [59]).
To estimate whether δ15N and δ13C of each amphipod species changed after adding carcasses, we estimated how isotopic values differed by taxa (Gammarus vs. Hyalella), carcasses deposited (reference vs. treatment), time period (pre- vs. post-carcass addition) and year (2018 or 2019). We also analyzed the two species of amphipods separately using the same model above (without the variable taxa) because their isotopes signatures differed. We included interaction terms between site and year, and site and time period. All analyses were conducted in Program R [60].
2.5. Estimating Diet Using Isotopes
We used stable isotope mixing models to estimate the direct consumption of carcasses by Gammarus and estimate the degree to which amphipods (Gammarus and Hyalella) contributed to the diet of lake trout and Yellowstone cutthroat trout (hereafter cutthroat trout). Corrected means and standard deviations (i.e., trophic fractionation) were consistent across all diet items for amphipods and lake trout mixing models, with values δ15N of 3.4‰ (1 SD = 1‰) and δ13C of 0.4‰ (1 SD = 1.3‰) (Post 2002). Concentration dependencies were derived from the % N and % C resulting from stable isotope analysis (Table S1). We conducted sensitivity analyses related to fractionation factors on the stability of diet output for Gammarus, lake trout, and cutthroat trout by changing the standard deviation of all diet item fractionation factors by ±2, altering the mean N fractionation by ±1, and adjusting the mean C fractionation by ±1.3 in a stepwise manner. This only changed diet estimations by ±5% for all diet items, demonstrating that our estimates were stable and insensitive to fractionation factors used in the sensitivity analysis. We only estimated the diet of Gammarus (not Hyalella) using stable isotope mixing models because we observed a change in Gammarus isotopic signatures.
We estimated proportions of different taxa contributing to Gammarus diet, including whole lake trout carcasses, using the package simmr (v 0.4.6.9000; Parnell, 2016) and uninformed priors. All stable isotope mixing models Markov Chain Monte Carlo (MCMC) runs had 10,000 iterations, 1000 burn-ins, 10 thins, and 4 MCMC chains. Potential diet items included detritus, periphyton, phytoplankton, zooplankton, macroinvertebrates (functional groups: gatherer, predator, scraper, shredder), and whole lake trout. We estimated the diet of Gammarus collected from carcass treatment sites and the reference site in 2019 after carcass addition.
We estimated the contribution of amphipods to the diet of lake trout and cutthroat trout using simmr and informed priors to assess trout diets in the lake. Both lake trout and cutthroat trout diets were categorized into total length classes: 100 – 300 mm, 301 – 475 mm, 476 – 575 mm, 575+ mm (only lake trout were in this largest length class) to account for ontogenetic diet shifts [41,43,61] and to maintain consistency with length classes used for diet analysis completed during the same years as stable isotope samples were collected [43]. Potential diet items for lake trout varied by length class (Table 1) but included zooplankton, cutthroat trout <100 mm in total length, cutthroat trout <300 mm in total length, Gammarus, Hyalella, and macroinvertebrates (filterer, gatherer, predator, scraper, shredder). Potential diet items for cutthroat trout varied by length class (Table 1) and included macroinvertebrate functional feeding groups, Gammarus, Hyalella, zooplankton, and Leuciscids (lake chub, redside shiner, longnose dace). Prior means and standard deviations were informed by diet analysis [43] (Table S2). Prior studies revealed that lake trout in the length class 100 – 300 mm did not consume cutthroat trout in the smallest length class (<100 mm total length), but the diet item was included so that a convex hull could be created around potential diet items to encapsulate the mixtures for that length class (Figure S1). The most contemporary diet analysis did not find evidence of consumption of Leuciscids [43] for cutthroat trout length classes 301 – 475 mm and 476 – 575 mm, but the diet item was detected in past diet studies [41,61] and included so that a convex hull encapsulated potential diet items for those length classes (Figures S2 and S3).
3. Results
3.1. Stable Isotope Values Among Food Web Compartments
A total of 1065 samples were analyzed for stable isotopes (Figure 3, Table 2). Periphyton (δ15N mean combining treatment and year ± SE; 0.51 ± 0.28), phytoplankton (δ15N 0.55 ± 0.71) and sediment (δ15N -0.15 ± 0.19) had the most depleted δ15N signatures, and lake trout (δ15N all length categories pooled; mean = 8.5 ± 0.07) had the most enriched δ15N values of all the material we collected (Figure 3, Table 2). All lake trout size classes (δ13C -23.1 ± 0.27), phytoplankton (δ13C -26.7 ± 0.32) and zooplankton (δ13C -28.8 ± 0.36) had the most depleted δ13C values, and Hyalella (δ13C -10.3 ± 0.28), shredding (δ13C -10.1 ± 0.47) and scraping (δ13C -11.0 ± 0.91) benthic invertebrates had the most enriched values (Figure 3). Values between muscle plugs and whole blended carcasses of lake trout did not differ for δ15N (t = 0.46, p = 0.65), but muscle plug samples (-22.1 ± 0.03) had more enriched δ13C signatures compared to whole carcasses (-27.0 ± 0.21; t = 8.9, p < 0.0001).
3.2. Basal Resource Response to Carcass Addition
Stable isotope δ15N values of pooled basal resources did not change when carcasses were added to sites (Figure 4a & b). However, detritus had the most enriched signatures compared to periphyton (t = 2.1-3.1, p = 0.003-0.03; emmeans, p = 0.016) and phytoplankton (emmeans, p = 0.03) indicating that detritus may be sourced from decaying lake trout carcasses (Figure 4a). The δ15N of basal resources in Yellowstone Lake did not differ pre- or post-carcass addition (t = 1.0, p = 0.31) or site (reference vs. treated sites; t = 1.1, p = 0.27; Figure 4b). The δ15N values of sediment were more enriched in 2019 when 2.7x more carcasses were added compared to 2018 (t = 5.1, p < 0.0001) at the site treated with carcasses. An interaction term between site and pre- or post-carcass addition indicated that δ15N signatures were marginally higher at the treated site than the reference site after carcasses were added (t = 1.8, p = 0.067); however, individual comparisons revealed no differences at the site where carcasses were added (emmeans, p = 0.36) or reference sites (emmeans, p = 0.74) pre- or post-carcass addition. Signatures of δ15N also did not vary among basal resources pre- or post-carcass additions (t = 0.1-0.4, p = 0.63-0.92; emmeans, p > 0.17).
The δ13C signatures of basal resources did not change in aggregate when carcasses were added (Figure 4c,d and S4). Phytoplankton had the most depleted δ13C values (t = 0.7-9.7, p < 0.0001-0.46; emmeans, p < 0.0001) and periphyton had the most enriched values (emmeans, p <0.0001). The δ13C signature of basal resources did not differ pre- versus post-carcass additions (t = 1.4, p = 0.15) or between treatment and reference sites (t = 0.9, p = 0.37), but sediment values were more depleted in 2019 compared to 2018 (t = 3.6, p = 0.0004). An interaction term between sites and pre- or post-carcass addition indicated that δ13C values did not differ between the treatment and reference sites pre- versus post-carcass additions (t = 0.008, p = 0.99). Phytoplankton δ13C signatures were more enriched post-carcass addition at both the reference and treatment sites (t = 0.5-1.7, p = 0.09-0.56; emmeans, p = 0.05; Figure S4), but detritus, sediment and periphyton did not differ pre- vs. post-carcass addition (emmeans, p > 0.71; Figure S4).
δ15N signatures of amphipod species responded differently to carcass additions (Figure 5). Gammarus had more enriched δ15N values than Hyalella (t = 15.2, p < 0.0001). An interaction term between site and year (t = 0.78, p = 0.44; emmeans, p < 0.0001) indicated that Gammarus had more enriched δ15N values at the treated site in 2019 than 2018. An interaction between pre- and post-carcass addition and site suggested that adding carcasses did not detectably alter δ15N signatures of Gammarus (t = 0.002, p = 0.99). Hyalella δ15N signatures were more enriched at the treatment site in 2019 compared to 2018 (interaction term between treatment and year; t = 3.3, p = 0.001; emmeans, p < 0.001; Figure 5b). Additionally, Hyalella signatures were more enriched at the treated site compared to the reference site during 2019 (emmeans, p = 0.05). An interaction between pre- and post-carcass addition and site suggested that carcass additions enriched the δ15N signatures of Hyalella at the treatment site post carcass addition compared to pre-carcasses (t = 2.3, p = 0.02; emmeans, p = 0.05; Figure 5d).
The δ13C signatures of Gammarus were more depleted than Hyalella (t = 12, p < 0.0001; Figure 5 e-h). An interaction term between year and treatment (t = 2.0, p = 0.046) indicated that Gammarus had more depleted δ13C values at the treatment site compared to the reference site in 2018 (emmeans, p = 0.0006) and 2019 (emmeans, p < 0.0001; Figure 5e). An interaction between pre- and post-carcass addition and site suggested that carcass additions did not alter δ13C signatures of Gammarus differently between sites (t = 0.80, p = 0.13). Gammarus at treated (emmeans, p < 0.0001) and reference sites (emmeans, p = 0.003) had more enriched δ13C signatures post-treatment compared to pre-treatment. Additionally, the treatment site had more depleted δ13C signatures than the reference site pre- to (emmeans, p = 0.0001) post-treatment (emmeans, p < 0.0001). The δ13C signatures of Hyalella were more depleted at the treatment site than the reference site in 2019 (t = 1.1, p = 0.29; emmeans, p = 0.03; interaction between treatment and year). The δ13C signatures of Hyalella did not differ prior to adding carcasses at the reference and treatment sites (t = 2.9, p = 0.005; emmeans, p = 0.99), or at sites pre-versus post-treatment (emmeans, p = 0.82). however, δ13C signatures were more enriched after carcasses were added to the treatment site at both the reference and treated site (emmeans, p = 0.0001).
3.3. Estimating Diet Using Isotopes
Gammarus consumed < 3% lake trout carcass at treatment and reference sites as estimated from stable isotope mixing models (Figure 6, Table 3). At the treatment site, non-lake trout sources (e.g., benthic invertebrates, algae) contributed 97.3% (91.6 – 99.6%) and lake trout carcass contributed 2.7% (0.4 – 8.4%) of Gammarus diet after carcass additions in 2019 (Figure 6, Table 3). After carcasses were added at the treatment site in 2019, Gammarus mostly consumed benthic invertebrates (gatherer, predator, scraper, shredder; 45.1%, 15.0 – 72.2%; mean, 95% credible interval), followed by phytoplankton (28.1%, 6.9 – 46.7%), periphyton (15.0%, 1.2 – 45.7%), detritus (10.0%, 0.9 – 35.9%), and lake trout carcass (2.7%, 0.5 – 8.4%). At the reference site, non-lake trout diet items contributed 97.0% (91.8 – 99.5%) and lake trout carcass contributed 3.0% (0.5 – 8.2%) of Gammarus diet
after carcass addition in 2019 (Figure 6, Table 3). Benthic invertebrates (gatherer, predator, scraper, shredder) were the dominant isotopic contribution to Gammarus diet (mean, 95% credible interval; 48.9%, 14.7 – 80%) followed by periphyton (29.2%, 1.9 – 72.6%), phytoplankton (8.0%, 1.0 – 19.1%), detritus (10.9%, 0.9 – 40.1%), and lake trout carcass (3.0%, 0.5 – 8.0%) after carcass additions in 2019 at the reference site.
Amphipods were consumed by all length classes of lake trout (proportion range 0.17– 0.24) according to stable isotope mixing models (Figure S5, Table 3). Zooplankton dominated the diet of lake trout 100 – 300 mm total length followed by benthic invertebrates, amphipods, and cutthroat trout. Cutthroat trout dominated the diet of lake trout 301 – 475 mm total length followed by zooplankton, amphipods, and benthic invertebrates. Cutthroat trout also were isotopically dominant in the diet of lake trout 476 – 575 mm total length followed by amphipods, zooplankton, and benthic invertebrates. Similarly, cutthroat trout dominated the diet of lake trout > 575 mm total length followed by amphipods, zooplankton, and benthic invertebrates.
Native cutthroat trout also consumed amphipods (proportion range 0.55 – 0.67), and the contribution of amphipods was lower in the diet of larger cutthroat trout compared to smaller cutthroat trout, according to stable isotope mixing models (Figure S6, Table 3). Amphipods dominated the diet of cutthroat trout 100 – 300 mm total length followed by zooplankton, and benthic invertebrates. Amphipods also dominated the diet of cutthroat trout 301 – 475 mm total length followed by zooplankton, macroinvertebrates, and Leuciscids. Similarly, amphipods were isotopically dominant in the diet of cutthroat trout 475 – 575 mm total length followed by zooplankton, benthic invertebrates, and Leuciscids.
4. Discussion
Suppressing invasive species costs management agencies billions of dollars annually, thus ensuring that suppression methods are effective is critical. Here, we demonstrated that adding lake trout carcasses to the littoral zone to induce mortality of lake trout embryos did not inadvertently feed amphipod populations. We were concerned that adding carcasses to shallow waters may support lake trout because the diets of invasive lake trout are composed of a high percentage of amphipods by weight [41,43]. The novel suppression method did not appear to create a positive feedback loop that could indirectly support invasive lake trout through amphipod consumption of carcass material. Furthermore, amphipods can be scavengers [62], and the δ15N signatures of amphipods collected historically on suppression gill nets with entrained lake trout were more enriched than expected for a primary consumer [41], suggesting that amphipods could consume lake trout carcasses. Our results showed that a small proportion of amphipod diets were composed of carcasses when carcass material was readily available. The amphipod Gammarus likely consumed more carcass than Hyalella, but the diets of amphipods were mostly composed of other invertebrates. The diet of invasive lake trout was estimated to be 17 – 24% amphipods and this proportion increased slightly with size class. Native cutthroat trout also fed on amphipods; 55 – 67% of their diet was estimated to be these crustaceans. Therefore, amphipods are a critical food source for recovering cutthroat trout and provide less sustenance for highly suppressed lake trout. This evidence suggests that using lake trout carcasses to suffocate eggs at spawning sites had minimal effects on lower trophic levels of the food web.
The diets of lake trout and native cutthroat trout estimated from stable isotope analysis generally aligned with diet studies conducted on the species using stomach content analysis (e.g., [43]) and provided interesting results when comparing methods for the consumption of cutthroat trout by lake trout. Both stomach contents and stable isotope analysis include inherent bias and error, therefore when considered together, the estimates can provide a more wholistic understanding of diet. For example, stomach contents provide a snapshot of diet while mussel isotopes provide a 3- to 4.5-month perspective [63]. Isotopes and stomach contents indicated that amphipods were an important prey source for cutthroat trout and increased in diet composition for lake trout as size of fish increases. Diet estimates for lake trout 301 – 475 mm differed between methods; cutthroat trout were estimated to be most isotopically dominant in the diet, while stomach contents reported dominance by amphipods [43]. This contrast provided evidence to suggest that consumption of cutthroat trout by this length class of lake trout may be higher than estimated by stomach contents alone. The soft tissue of cutthroat trout may be digested more quickly than the shell of amphipods, therefore the proportion by weight of cutthroat trout could be underrepresented in stomach contents [64,65]. This discrepancy could also be due to isotopes representing months of prey consumption [56,66] compared to stomach contents which may only represent hours to days. We used informed priors from stomach contents [43] to estimate the diets of lake trout and cutthroat trout using isotopes, and the relative contributions of prey remained constant when conducting sensitivity analyses.
Amphipod diet patterns vary from being cannibalistic, detritivores, obligate scavengers, herbivores, invertivores, or generalists [62,67,68,69,70,71,72,73,74,75,76,77]. Gammarus can have the most diverse diet of any invertebrates in aquatic ecosystems [71]. Our results showed that Gammarus in Yellowstone Lake fed on a variety of food sources. Gammarus that we collected were similar to those in Spain which fed primarily on aquatic invertebrates (e.g., adult true flies, mayfly nymphs, copepods) and to a lesser degree on diatoms and detritus [68]. The digestive tract contents may depend on the availability of food; Moore [78] suggested that the amount of algae eaten corresponded to the availability in their habitat. In Yellowstone Lake, lake trout carcasses were readily available at spawning sites yet <3% of the diet of Gammarus was carcass. Hynes [69] observed that Gammarus would not scavenge invertebrates in laboratory experiments suggesting that Gammarus may avoid scavenging. Gammarus appeared to select their preferred food sources and they did not eat diet items in the proportions they are available or they simply avoided carcasses.
We investigated how adding carcasses to spawning sites altered the food web; however, we were surprised to observe similar enrichment of δ13C at reference and treated sites. Such an observation suggested a lake-wide event enriched stable isotope signatures instead of the carcasses added to the littoral experimental sites. Specifically, we observed that the δ13C of Gammarus and Hyalella were more enriched at the reference and treated sites after adding carcasses at the treated sites. Additionally, δ13C of phytoplankton was enriched at the reference and treatment sites after adding carcasses. We also observed higher ammonium concentrations, phytoplankton biomass, and phytoplankton uptake during autumn at the reference and treated sites, indicating a lake-wide event altered nutrient dynamics [49]. Autumn turnover occurs in mid-September at the same time when carcasses were added to treatment sites. The lake trout suppression program annually harvests ~300,000 fish and deposits them in the depths (>70 m) of Yellowstone Lake. Autumn turnover transports the nutrients from lake trout carcasses in the hypolimnion to surface waters [30], resulting in higher concentrations of N and algal blooms observed at the treatment and reference sites [49].
We expected depleted δ13C values of biota after autumn turnover based on lake trout δ13C signatures, but we observed enriched values in amphipods and phytoplankton at reference and treatment sites. A variety of factors could enrich δ13C values including atmospheric deposition [79], evaporation [80], microbial activity [81], hydrothermal inputs [82], or enrichment over time [83]. We hypothesize that the enrichment of δ13C was due to microbial activity in Yellowstone Lake; other enrichment sources would occur throughout the year instead of the specific timing at autumn turnover. Similarly, δ13C values were enriched in the hypolimnion of Lake Washington compared to the epilimnion because of microbial activity mineralizing carbon which enriched surface values after turnover [81]. Thus, we postulate that microbes mineralized carbon from lake trout carcasses deposited in the profundal zone, and potentially other sources in the depths of Yellowstone Lake, enriching the δ13C signature in surface waters after autumn turnover.
5. Conclusions
Our goal was to measure the degree to which depositing carcasses in the littoral zone altered basal food sources, the magnitude to which amphipods (i.e., Gammarus) eat carcasses, and to what extent invasive and native trout consume amphipods; however, we did not directly measure lake trout recruitment. Our study showed that amphipods do not readily feed on carcasses, but nutrients from lake trout carcasses in the profundal zone were incorporated into other compartments of the food web. Yellowstone National Park has invested in substantial research to understand the effects of using carcasses for embryo suppression, which have shown minor site-level effects of carcass application. The effects of using carcasses for embryo suppression in Yellowstone Lake have been studied in relation to nitrogen dynamics [49], periphyton [48], and benthic invertebrates [84,85]. The combined knowledge of these studies provides excellent resources for managers to make informed decisions. For example, adding carcasses to the littoral zone did not increase algal biomass and ammonium uptake [49], and total invertebrate density and biomass did not respond to carcass treatment [85]. Furthermore, current research is investigating the degree to which adding 300,000 lake trout carcasses to the profundal zone of the lake may alter water quality. This body of work informs managers as to how lake trout and cutthroat trout populations change in response to novel suppression methods, which could lead to recovery of the ecosystem.
Invasive species are being introduced throughout the world, and large amounts of money are being spent to prevent invasive species introduction and suppression [86]. Programs to suppress invasive populations are ubiquitous, yet we know little about the unintended consequences of these methods. Our study demonstrates the need to investigate suppression management strategies to avoid unintended consequences such as indirectly feeding invasive species, altering the food web [39], and fertilizing lower trophic levels [48,49]. Suppression programs should be designed and carefully monitored to ensure that the invasive species are not unintentionally favored. Such unintended consequences have occurred demonstrating the need for monitoring [5]. Collecting data on eradication and suppression programs is expensive, but the public are supporting programs to reduce invasive species [87]. Additionally, unintended consequences may be more expensive in the long-term. Agencies wanting to remove or control invasive species must be willing to commit funds over long time periods to have the best chance of success [20,88], and we argue that agencies must also be willing to commit funds for research to understand the whole-ecosystem effects of suppression while developing and implementing these methods.
Supplementary Materials
The following supporting information can be downloaded at: Preprints.org, Table S1. Concentration dependencies used in stable isotope mixing models for organisms in Yellowstone Lake, Yellowstone National Park, Wyoming, U.S.A. Table S2. Priors and standard deviations for diet items used in stable isotope mixing models for species in Yellowstone Lake, Yellowstone National Park, Wyoming, USA. Proportions and standard deviations were derived from Glassic et al. [43]. Figure S1. Isospace plot of lake trout 100 – 300 mm total length collected from Yellowstone Lake, Yellowstone National Park, Wyoming, USA used for stable isotope analysis. Zooplankton are abbreviated as zoop. Mixtures are individual lake trout (LKT). Figure S2. Isospace plot of Yellowstone cutthroat trout 301 – 475 mm total length collected from Yellowstone Lake, Yellowstone National Park, Wyoming, USA used for stable isotope analysis. Zooplankton are abbreviated as zoop. Mixtures are individual cutthroat trout (YCT). Figure S3. Isospace plot of Yellowstone cutthroat trout 476 – 575 mm total length collected from Yellowstone Lake, Yellowstone National Park, Wyoming, USA used for stable isotope analysis. Zooplankton are abbreviated as zoop. Mixtures are individual cutthroat trout (YCT). Figure S4. Comparisons of stable isotope signatures for basal resources (i.e., detritus, periphyton, phyto = phytoplankton, sediment) for Carbon across reference (top) and treatment (bottom) sites pre (white) or post (gray) treatment. The horizontal line indicates the median, the boxes are the interquartile range (IQR), whiskers are the 25th and 75th percentile plus and minus 1.5*IQR, respectively. Figure S5. Lake trout diet proportions for Yellowstone Lake, Yellowstone National Park, Wyoming, USA estimated using stable isotope mixing models among different size classes (total length, mm): a) 100-300, b) 301-475, c) 476-575, d) >576. Amph= amphipods = aggregation of Gammarus and Hyalella. Inverts = macroinvertebrate aggregation of different functional feeding groups: filterer, gatherer, predator, scraper, shredder. YCT = Yellowstone cutthroat trout. Zoop = zooplankton. The horizontal line indicates the median, the boxes are the interquartile range (IQR), whiskers are the 25th and 75th percentile plus and minus 1.5*IQR, respectively, and the hollow points are the outliers. Figure S6. Yellowstone cutthroat trout diet proportions for Yellowstone Lake, Yellowstone National Park, Wyoming, USA estimated using stable isotope mixing models among different size classes (total length, mm): a) 100-300, b) 301-475, c) 476-575. Inverts = macroinvertebrate aggregation of different functional feeding groups: filterer, gatherer, predator, scraper, shredder. Amphipods = aggregation of Gammarus and Hyalella. Leuciscids were considered an aggregation of the following fishes: lake chub, longnose dace, redside shiner. The horizontal line indicates the median, the boxes are the interquartile range (IQR), whiskers are the 25th and 75th percentile plus and minus 1.5*IQR, respectively, and the hollow points are the outliers.
Author Contributions
Conceptualization, L.T., H.G., D.L., M.B. L.A., C.G and T.K.; methodology, L.T., H.G. and D.L.; formal analysis, L.T. and H.G.; investigation, D.L.; resources, T.K.; data curation, L.T. and H.G.; writing—original draft preparation, L.T. and H.G.; writing—review and editing, L.T., H.G., D.L., M.B. L.A., C.G and T.K.; visualization, L.T. and H.G.; project administration, L.T. and T.K.; funding acquisition, T.K.. All authors have read and agreed to the published version of the manuscript.
Funding
Funding was provided by Yellowstone Forever, Yellowstone National Park, and technician support was provided by the Montana Institute on Ecosystems including federal grant number P16AC00948.
Institutional Review Board Statement
This study was performed under the auspices of Institutional Animal Care and Use Protocol 2018- 72 at Montana State University.
Data Availability Statement
All data is in the supplemental material.
Acknowledgments
We thank P. Doepke, P. Bigelow, D. MacDonald, S. Poratti, J. Kasowski, and Hickey Brothers research, especially J. Milan, J. Larsen, T. Short, J. Krebs, T. Morhardt, M. Kundzins, and all captains and crews on National Park Service and Hickey Brothers boats for assisting with sampling; S. Driscoll, A. Micklewright, L. Umland, K. Furey, K. Winters, and C. Steinbach for assistance in the field and the lab analyzing or prepping diet and stable isotope data. All fieldwork and lab work were conducted under Yellowstone National Park permit 8048. This study was performed under the auspices of Institutional Animal Care and Use Protocol 2018–72 at Montana State University. Funding was provided by Yellowstone Forever, Yellowstone National Park, and technician support was provided by the Montana Institute on Ecosystems including federal grant number P16AC00948. Any use of trade, firm, or product names is for descriptive purposes only and does not imply endorsement by the U.S. Government.
Conflicts of Interest
The authors declare no conflicts of interest. This draft manuscript is distributed solely for the purposes of scientific review. Its content is deliberative and predecisional, so it must not be disclosed or released by reviewers. Because the manuscript has not yet been approved for publication by the U.S. Geological Survey (USGS), it does not represent any official USGS finding or policy.
References
- Doak, D.F.; Estes, J.A.; Halpern, B.S.; Jacob, U.; Lindberg, D.R.; Lovvorn, J.; Monson, D.H.; Tinker, M.T.; Williams, T.M.; Wootton, J.T. Understanding and predicting ecological dynamics: are major surprises inevitable. Ecology 2008, 89, 952–961. [Google Scholar] [CrossRef] [PubMed]
- Filbee-Dexter, K.; Pittman, J.; Haig, H.A.; Alexander, S.M.; Symons, C.C.; Burke, M.J. Ecological surprise: concept, synthesis, and social dimensions. Ecosphere 2017, 8, e02005. [Google Scholar] [CrossRef]
- King, A. Avoiding ecological surprise: Lessons from long-standing communities. Acad. Manag. Rev. 1995, 20, 961–985. [Google Scholar] [CrossRef]
- Lindenmayer, D.B.; Likens, G.; Krebs, C.; Hobbs, R. Improved probability of detection of ecological “surprises”. Proc. Natl. Acad. Sci. 2010, 107, 21957–21962. [Google Scholar] [CrossRef] [PubMed]
- Spencer, C.N.; McClelland, B.R.; Stanford, J.A. Shrimp stocking, salmon collapse, and eagle displacement: cascading interactions in the food web of a large aquatic ecosystem. BioScience 1991, 41, 14–21. [Google Scholar] [CrossRef]
- Caut, S.; Angulo, E.; Courchamp, F. Avoiding surprise effects on Surprise Island: alien species control in a multitrophic level perspective. Biol. Invasions 2009, 11, 1689–1703. [Google Scholar]
- Courchamp, F.; Caut, S.; Bonnaud, E.; Bourgeois, K.; Angulo, E.; Watari, Y. Eradication of alien invasive species: surprise effects and conservation successes. Isl. Invasives Erad. Manag. 2011, 285–289. [Google Scholar]
- Mack, R.N.; Lonsdale, W. Eradicating invasive plants: hard-won lessons for islands. Turn. Tide Erad. Invasive Species 2002, 164–172. [Google Scholar]
- Eason, C.; Spurr, E. Review of the toxicity and impacts of brodifacoum on non-target wildlife in New Zealand. N. Z. J. Zool. 1995, 22, 371–379. [Google Scholar] [CrossRef]
- Howald, G.; Mineau, P.; Elliott, J.; Cheng, K. Brodifacoum poisoning of avian scavengers during rat control on a seabird colony. Ecotoxicology 1999, 8, 431–447. [Google Scholar] [CrossRef]
- Jackson, T.; Van Aarde, R. Advances in vertebrate pest control: implications for the control of feral house mice on Marion Island. South Afr. J. Sci. 2003, 99, 130–136. [Google Scholar]
- Merton, D. Eradication of rabbits from Round Island, Mauritius: a conservation success story. Dodo 1987, 24, 19–43. [Google Scholar]
- Gangoso, L.; Donázar, J.A.; Scholz, S.; Palacios, C.J.; Hiraldo, F. Contradiction in conservation of island ecosystems: plants, introduced herbivores and avian scavengers in the Canary Islands. Biodivers. Conserv. 2006, 15, 2231–2248. [Google Scholar] [CrossRef]
- Bradshaw, C.J.; Leroy, B.; Bellard, C.; Roiz, D.; Albert, C.; Fournier, A.; Barbet-Massin, M.; Salles, J.-M.; Simard, F.; Courchamp, F. Massive yet grossly underestimated global costs of invasive insects. Nat. Commun. 2016, 7, 12986. [Google Scholar] [CrossRef] [PubMed]
- Fantle-Lepczyk, J.E.; Haubrock, P.J.; Kramer, A.M.; Cuthbert, R.N.; Turbelin, A.J.; Crystal-Ornelas, R.; Diagne, C.; Courchamp, F. Economic costs of biological invasions in the United States. Sci. Total Environ. 2022, 806, 151318. [Google Scholar] [CrossRef] [PubMed]
- Hoffmann, B.D.; Broadhurst, L.M. The economic cost of managing invasive species in Australia. NeoBiota 2016, 31, 1–18. [Google Scholar] [CrossRef]
- Pimentel, D.; Zuniga, R.; Morrison, D. Update on the environmental and economic costs associated with alien-invasive species in the United States. Ecol. Econ. 2005, 52, 273–288. [Google Scholar] [CrossRef]
- Clavero, M.; Garcia-Berthou, E. Invasive species are a leading cause of animal extinctions. Trends Ecol. Evol. 2005, 20, 110–110. [Google Scholar] [CrossRef] [PubMed]
- Sorte, C.J.; Ibáñez, I.; Blumenthal, D.M.; Molinari, N.A.; Miller, L.P.; Grosholz, E.D.; Diez, J.M.; D’Antonio, C.M.; Olden, J.D.; Jones, S.J. Poised to prosper? A cross-system comparison of climate change effects on native and non-native species performance. Ecol. Lett. 2013, 16, 261–270. [Google Scholar] [PubMed]
- Klein, Z.B.; Quist, M.C.; Guy, C.S. Suppression of invasive fish in the west: synthesis and suggestions for improvement. North Am. J. Fish. Manag. 2023, 43, 369–383. [Google Scholar]
- Ehler, L.E. Integrated pest management (IPM): definition, historical development and implementation, and the other IPM. 2006. [Google Scholar] [CrossRef] [PubMed]
- Lewis, W.J.; Van Lenteren, J.; Phatak, S.C.; Tumlinson, J., Iii. A total system approach to sustainable pest management. Proc. Natl. Acad. Sci. 1997, 94, 12243–12248. [Google Scholar] [CrossRef] [PubMed]
- Simberloff, D. Biological invasions: What’s worth fighting and what can be won? Ecol. Eng. 2014, 65, 112–121. [Google Scholar] [CrossRef]
- Poole, A.S.; Koel, T.M.; Thomas, N.A.; Zale, A.V. Benthic Suffocation of Invasive Lake Trout Embryos by Fish Carcasses and Sedimentation in Yellowstone Lake. North Am. J. Fish. Manag. 2020, 40, 1077–1086. [Google Scholar] [CrossRef]
- Thomas, N.A.; Guy, C.S.; Koel, T.M.; Zale, A.V. In-situ evaluation of benthic suffocation methods for suppression of invasive Lake Trout embryos in Yellowstone Lake. North Am. J. Fish. Manag. 2019, 39, 104–111. [Google Scholar] [CrossRef]
- Baxter, C.V.; Fausch, K.D.; Murakami, M.; Chapman, P.L. Fish invasion restructures stream and forest food webs by interrupting reciprocal prey subsidies. Ecology 2004, 85, 2656–2663. [Google Scholar] [CrossRef]
- Catchpole, T.; Frid, C.; Gray, T. Importance of discards from the English Nephrops norvegicus fishery in the North Sea to marine scavengers. Mar. Ecol. Prog. Ser. 2006, 313, 215–226. [Google Scholar] [CrossRef]
- Brickell, D.; Goering, J. Chemical effects of salmon decomposition on aquatic ecosystems; 1970. [Google Scholar]
- Krokhin, E. 6.2 Transport of Nutrients by Salmon Migrating from the Sea into Lakes. Coupling Land Water Syst. 1975, 10, 153. [Google Scholar]
- Bilby, R.E.; Fransen, B.R.; Bisson, P.A. Incorporation of nitrogen and carbon from spawning coho salmon into the trophic system of small streams: evidence from stable isotopes. Can. J. Fish. Aquat. Sci. 1996, 53, 164–173. [Google Scholar] [CrossRef]
- Cederholm, C.J.; Kunze, M.D.; Murota, T.; Sibatani, A. Pacific salmon carcasses: essential contributions of nutrients and energy for aquatic and terrestial ecosystems. Fisheries 1999, 24, 6–15. [Google Scholar] [CrossRef]
- Helfield, J.M.; Naiman, R.J. Effects of salmon-derived nitrogen on riparian forest growth and implications for stream productivity. Ecology 2001, 82, 2403–2409. [Google Scholar] [CrossRef]
- Donaldson, J.R. The phosphorus budget of Iliamna Lake, Alaska as related to the cyclic abundance of sockeye salmon; University of Washington, 1967. [Google Scholar]
- Parmenter, R.R.; Lamarra, V.A. Nutrient cycling in a fresh-water marsh - the decomposition of fish and waterfowl carrion. Limnol. Oceanogr. 1991, 36, 976–987. [Google Scholar] [CrossRef]
- Rask, M.; Järvinen, M.; Kuoppamäki, K.; Pöysä, H. Limnological responses to the collapse of the perch population in a small lake. In Proceedings of the Annales Zoologici Fennici, 1996; pp. 517–524. [Google Scholar]
- Stevenson, C.; Childers, D.L. Hydroperiod and seasonal effects on fish decomposition in an oligotrophic Everglades marsh. Wetlands 2004, 24, 529–537. [Google Scholar] [CrossRef]
- Benjamin, J.R.; Bellmore, J.R.; Whitney, E.; Dunham, J.B. Can nutrient additions facilitate recovery of Pacific salmon? Can. J. Fish. Aquat. Sci. 2020, 77, 1601–1611. [Google Scholar] [CrossRef]
- Koel, T.M.; Tronstad, L.M.; Arnold, J.L.; Gunther, K.A.; Smith, D.W.; Syslo, J.M.; White, P.J. Predatory fish invasion induces within and across ecosystem effects in Yellowstone National Park. Sci. Adv. 2019, 5, eaav1139. [Google Scholar] [CrossRef] [PubMed]
- Tronstad, L.M.; Hall, R.O.; Koel, T.M.; Gerow, K.G. Introduced lake trout produced a four-level trophic cascade in Yellowstone Lake. Trans. Am. Fish. Soc. 2010, 139, 1536–1550. [Google Scholar] [CrossRef]
- Koel, T.M.; Bigelow, P.E.; Briggs, M.A.; Canetta, M.J.; Ertel, B.D.; MacDonald, D.J.; Puchany, A.R.; Sadler, I.G.; Vender, C.W.; Weamer, E.P. Native Fish Conservation Program, Yellowstone National Park, Report for 2024; YCR-2025-02; National Park Service, Yellowstone Center for Resources: Yellowstone National Park, Wyoming, USA, 2025. [Google Scholar]
- Syslo, J.M.; Guy, C.S.; Koel, T.M. Feeding ecology of native and nonnative salmonids during the expansion of a nonnative apex predator in Yellowstone Lake, Yellowstone National Park. Trans. Am. Fish. Soc. 2016. [Google Scholar] [CrossRef]
- Tronstad, L.M.; Hall, R.O.; Koel, T.M. Introduced lake trout alter nitrogen cycling beyond Yellowstone Lake. Ecosphere 2015, 6. [Google Scholar] [CrossRef]
- Glassic, H.C.; Guy, C.S.; Tronstad, L.M.; Lujan, D.R.; Briggs, M.A.; Albertson, L.K.; Koel, T.M. Invasive predator diet plasticity has implications for native fish conservation and invasive species suppression. PLoS ONE 2023, 18, e0279099. [Google Scholar] [CrossRef] [PubMed]
- Benson, N.G. Limnology of Yellowstone Lake in relation to the cutthroat trout; U.S. Government Printing Office O-595956, 1961; pp. 1–33. [Google Scholar]
- Kaplinski, M.A. Geomorphology and geology of Yellowstone Lake, Yellowstone National Park, Wyoming. Master Thesis, Northern Arizona University, Flagstaff, Arizona, 1991. [Google Scholar]
- Morgan, L.; Shanks, W.; Pierce, K.L.; Iverson, N.; Schiller, C.; Brown, S.R.; Zahajska, P.; Cartier, R.; Cash, R.; Best, J. The dynamic floor of Yellowstone Lake, Wyoming, USA: The last 14 ky of hydrothermal explosions, venting, doming, and faulting. Bulletin 2023, 135, 547–574. [Google Scholar]
- Tronstad, L.M.; Oleksy, I.A.; Pomeranz, J.P.; Preston, D.L.; Gianniny, G.; Cook, K.; Holley, A.; Farnes, P.; Koel, T.M.; Hotaling, S. Despite a century of warming, increased snowfall has buffered the ice phenology of North America’s largest high-elevation lake against climate change. Environ. Res. Lett. 2024, 19, 054028. [Google Scholar] [CrossRef]
- Lujan, D.R.; Tronstad, L.M.; Briggs, M.A.; Albertson, L.K.; Glassic, H.C.; Guy, C.S.; Koel, T.M. Response of nutrient limitation to invasive fish suppression: how carcasses and analog pellets alter periphyton. J. Freshw. Sci. 2022, 41, 12. [Google Scholar] [CrossRef] [PubMed]
- Tronstad, L.M.; Lujan, D.R.; Briggs, M.A.; Albertson, L.K.; Glassic, H.C.; Guy, C.S.; Koel, T.M. Novel technique for suppressing an invasive apex predator minimally alters nitrogen dynamics in Yellowstone Lake, Wyoming, USA. Hydrobiologia 2024. [Google Scholar] [CrossRef]
- Gresswell, R.E.; Varley, J.D. Effects of a century of human influence on the cutthroat trout of Yellowstone Lake. Am. Fish. Soc. Symp. 1988, 4, 45–52. [Google Scholar]
- Gresswell, R.E.; Heredia, N.A.; Romine, J.G.; Gutowsky, L.F.; Sandstrom, P.T.; Parsley, M.J.; Bigelow, P.E.; Suski, C.; Ertel, B.D. Identifying movement patterns and spawning areas of lake trout in Yellowstone Lake. Yellowstone Sci. 2017, 25, 66–69. [Google Scholar]
- Williams, J.; Guy, C.S.; Bigelow, P.; Koel, T.M. Quantifying the spatial structure of invasive lake trout in Yellowstone Lake to improve suppression efficacy. North Am. J. Fish. Manag. 2021, 42, 50–62. [Google Scholar] [CrossRef]
- Williams, J.R.; Guy, C.S.; Koel, T.M.; Bigelow, P.E. Targeting aggregations of telemetered Lake Trout to increase gillnetting suppression efficacy. North Am. J. Fish. Manag. 2020, 40, 225–231. [Google Scholar] [CrossRef]
- Bigelow, P. Predicting areas of lake trout spawning habitat within Yellowstone Lake, Wyoming. Dissertation, University of Wyoming, Laramie, Wyoming, 2009. [Google Scholar]
- Hershey, A.E.; Northington, R.M.; Finlay, J.C.; Peterson, B.J. Stable isotopes in stream food webs. In Methods in stream ecology; Elsevier, 2017; pp. 3–20. [Google Scholar]
- Vander Zanden, M.J.; Casselman, J.M.; Rasmussen, J.B. Stable isotope evidence for the food web consequences of species invasions in lake. Nature 1999, 401, 464–467. [Google Scholar] [CrossRef]
- Bates, D.; Machler, M.; Bolker, B.; Walker, S. Fitting lienar mixed-effects models using lme4. J. Stat. Softw. 2015, 67, 1–48. [Google Scholar] [CrossRef]
- Delignette-Muller, M.; Dutang, C. fitdistrplus: an R package for fitting distributions. J. Stat. Softw. 2015, 64. [Google Scholar] [CrossRef]
- Lenth, R. emmeans: Estimated marginal means, aka least-squares means. R package version 1.7. 2. 2022. [Google Scholar]
- R Development Core Team R: A Language and Environment for Statistical Computing; R Foundation for Statistical Computing: Vienna, Austria, 2023.
- Ruzycki, J.R.; Beauchamp, D.A.; Yule, D.L. Effects of introduced lake trout on native cutthroat trout in Yellowstone Lake. Ecol. Appl. 2003, 13, 23–37. [Google Scholar] [CrossRef]
- Davenport, J.; Jessopp, M.; Harman, L.; Micaroni, V.; McAllen, R. Diurnal and nocturnal scavenger communities differ at two shallow-water depths in an Irish marine lough. Estuar. Coast. Shelf Sci. 2021, 262, 107580. [Google Scholar] [CrossRef]
- Church, M.R.; Ebersole, J.L.; Rensmeyer, K.M.; Couture, R.B.; Barrows, F.T.; Noakes, D.L.G. Mucus: a new tissue fraction for rapid determination of fish diet switching using stable isotope analysis. Can. J. Fish. Aquat. Sci. 2009, 66, 1–5. [Google Scholar] [CrossRef]
- Buckland, A.; Baker, R.; Loneragan, N.; Sheaves, M. Standardising fish stomach content analysis: The importance of prey condition. Fish. Res. 2017, 196, 126–140. [Google Scholar] [CrossRef]
- Baker, R.; Buckland, A.; Sheaves, M. Fish gut content analysis: robust measures of diet composition. Fish. Fish. 2014, 15, 170–177. [Google Scholar]
- Hobson, K.A. Tracing origins and migration of wildlife using stable isotopes: a review. Oecologia 1999, 120, 314–326. [Google Scholar] [CrossRef] [PubMed]
- Haempel, O. Über die Fortpflanzung und künstliche Zucht des gemeinen Flohkrebses (G. pulex und fluviatilis R.). Allg. Fisch.-Ztg. 1908, 33, 86–89. [Google Scholar]
- Margalef, R. Sobre el régimen alimenticio de los animales en agua dulce. Rev. Española De Fisiol. 1948, 4, 207–213. [Google Scholar]
- Hynes, H.B.N. The ecology of Gammarus duebeni Lilljeborg and its occurrence in fresh water in western Britain. J. Anim. Ecol. 1954, 23, 38–84. [Google Scholar] [CrossRef]
- Hynes, H. Imported organic matter and secondary productivity in streams. 1963. [Google Scholar] [CrossRef] [PubMed]
- Minshall, G.W. Role of allochthonous detritus in the trophic structure of a woodland springbrook community. Ecology 1967, 48, 139–149. [Google Scholar] [CrossRef]
- Minckley, W.L. The ecology of a spring stream Doe Run, Meade Country, Kentucky. Wildl. Monogr. 1963, No. 11, 124. [Google Scholar]
- Dahl, K. En studie over grundaatens eller matfloens (Gammarus pulex) biologi og utbredelse i Norge. NJFF Tidskr. 1915, 44, 1–32. [Google Scholar]
- Clemens, H.P. Life Cycle and Ecology of Gammarus fasciatus Say; Ohio State University, 1950. [Google Scholar]
- Forsman, B. Studies on Gammarus duebeni Lillj., with notes on some rockpool organisms in Sweden. Zool. Bidr. Från Upps. 1951, 29, 215–237. [Google Scholar]
- Sexton, E.W. The moulting and growth-stages of Gammarus, with descriptions of the normals and intersexes of G. chevreuxi. J. Mar. Biol. Assoc. U. K. 1924, 13, 340–401. [Google Scholar] [CrossRef]
- Willer, A. Nahrungsuntersuchungen bei niederen Wassertieren. III. Nahrungsuntersuchungen be idem Flonkrebs (G. pulex L.). Z. Fisch. 1922, 21, 187. [Google Scholar]
- Moore, J. The role of algae in the diet of Asellus aquaticus L. and Gammarus pulex L. J. Anim. Ecol. 1975, 719–730. [Google Scholar] [CrossRef]
- Preston, N.D.; Carpenter, S.R.; Cole, J.J.; Pace, M.L. Airborne carbon deposition on a remote forested lake. Aquat. Sci. 2008, 70, 213–224. [Google Scholar] [CrossRef]
- Horton, T.W.; Defliese, W.F.; Tripati, A.K.; Oze, C. Evaporation induced 18O and 13C enrichment in lake systems: A global perspective on hydrologic balance effects. Quat. Sci. Rev. 2016, 131, 365–379. [Google Scholar] [CrossRef]
- Quay, P.D.; Emerson, S.R.; Quay, B.M.; Devol, A.H. The carbon cycle for Lake Washington—A stable isotope study1. Limnol. Oceanogr. 1986, 31, 596–611. [Google Scholar] [CrossRef]
- Barnes, T. Barnes, T. Exploration of Dissolved Inorganic Carbon and Dissolved Organic Carbon in Hot Springs Within Yellowstone National Park. M.S., Arizona State University, United States -- Arizona, 2023.
- Brenner, M.; Whitmore, T.J.; Curtis, J.H.; Hodell, D.A.; Schelske, C.L. Stable isotope (δ13C and δ15N) signatures of sedimented organic matter as indicators of historic lake trophic state. J. Paleolimnol. 1999, 22, 205–221. [Google Scholar] [CrossRef]
- Briggs, M.A.; Albertson, L.K.; Lujan, D.R.; Tronstad, L.M.; Glassic, H.C.; Guy, C.S.; Koel, T.M. Carcass deposition to suppress invasive lake trout causes differential mortality of two common benthic invertebrates in Yellowstone Lake. Fundam. Appl. Limnol. 2021, 194, 285–295. [Google Scholar] [CrossRef]
- Briggs, M.; Albertson, L.K.; Lujan, D.R.; Tronstad, L.; Glassic, H.; Guy, C.; Koel, T.M. Fish carcass deposition to suppress invasive lake trout through hypoxia causes limited, non-target effects on benthic invertebrates in Yellowstone Lake. Aquac. Fish. Fish. 2022, 2, 470–483. [Google Scholar] [CrossRef]
- Lovell, S.; Stone, S. The economic impacts of aquatic invasive species: a review of the literature. 2005. [Google Scholar] [CrossRef] [PubMed]
- Levers, L.R.; Pradhananga, A.K. Recreationist willingness to pay for aquatic invasive species management. PLoS ONE 2021, 16. [Google Scholar] [CrossRef] [PubMed]
- Norton, D.A. Species Invasions and the Limits to Restoration: Learning from the New Zealand Experience. Science 2009, 325, 569–571. [Google Scholar] [CrossRef] [PubMed]
Figure 1.
Yellowstone Lake, Yellowstone National Park, Wyoming, U.S.A. with treatment and reference sites for carcass deposition. We measured how carcasses deposited to suppress lake trout embryos were assimilated into the food web at two confirmed lake trout spawning sites that received carcass treatment and two reference sites. We moved our shallow reference site in 2019 because the proximity and frequent gillnetting at the original site may have altered our results. Carcasses were added to Snipe Point beginning in mid-August as a potential deterrent method for spawning lake trout and to have a longer time frame to measure effects. Carcasses were added to the Olson Reef beginning 1 October after lake trout spawned. Profundal carcass sites had discarded carcasses from gillnetting deposited during the summer ice-free season (Late May – October).
Figure 1.
Yellowstone Lake, Yellowstone National Park, Wyoming, U.S.A. with treatment and reference sites for carcass deposition. We measured how carcasses deposited to suppress lake trout embryos were assimilated into the food web at two confirmed lake trout spawning sites that received carcass treatment and two reference sites. We moved our shallow reference site in 2019 because the proximity and frequent gillnetting at the original site may have altered our results. Carcasses were added to Snipe Point beginning in mid-August as a potential deterrent method for spawning lake trout and to have a longer time frame to measure effects. Carcasses were added to the Olson Reef beginning 1 October after lake trout spawned. Profundal carcass sites had discarded carcasses from gillnetting deposited during the summer ice-free season (Late May – October).
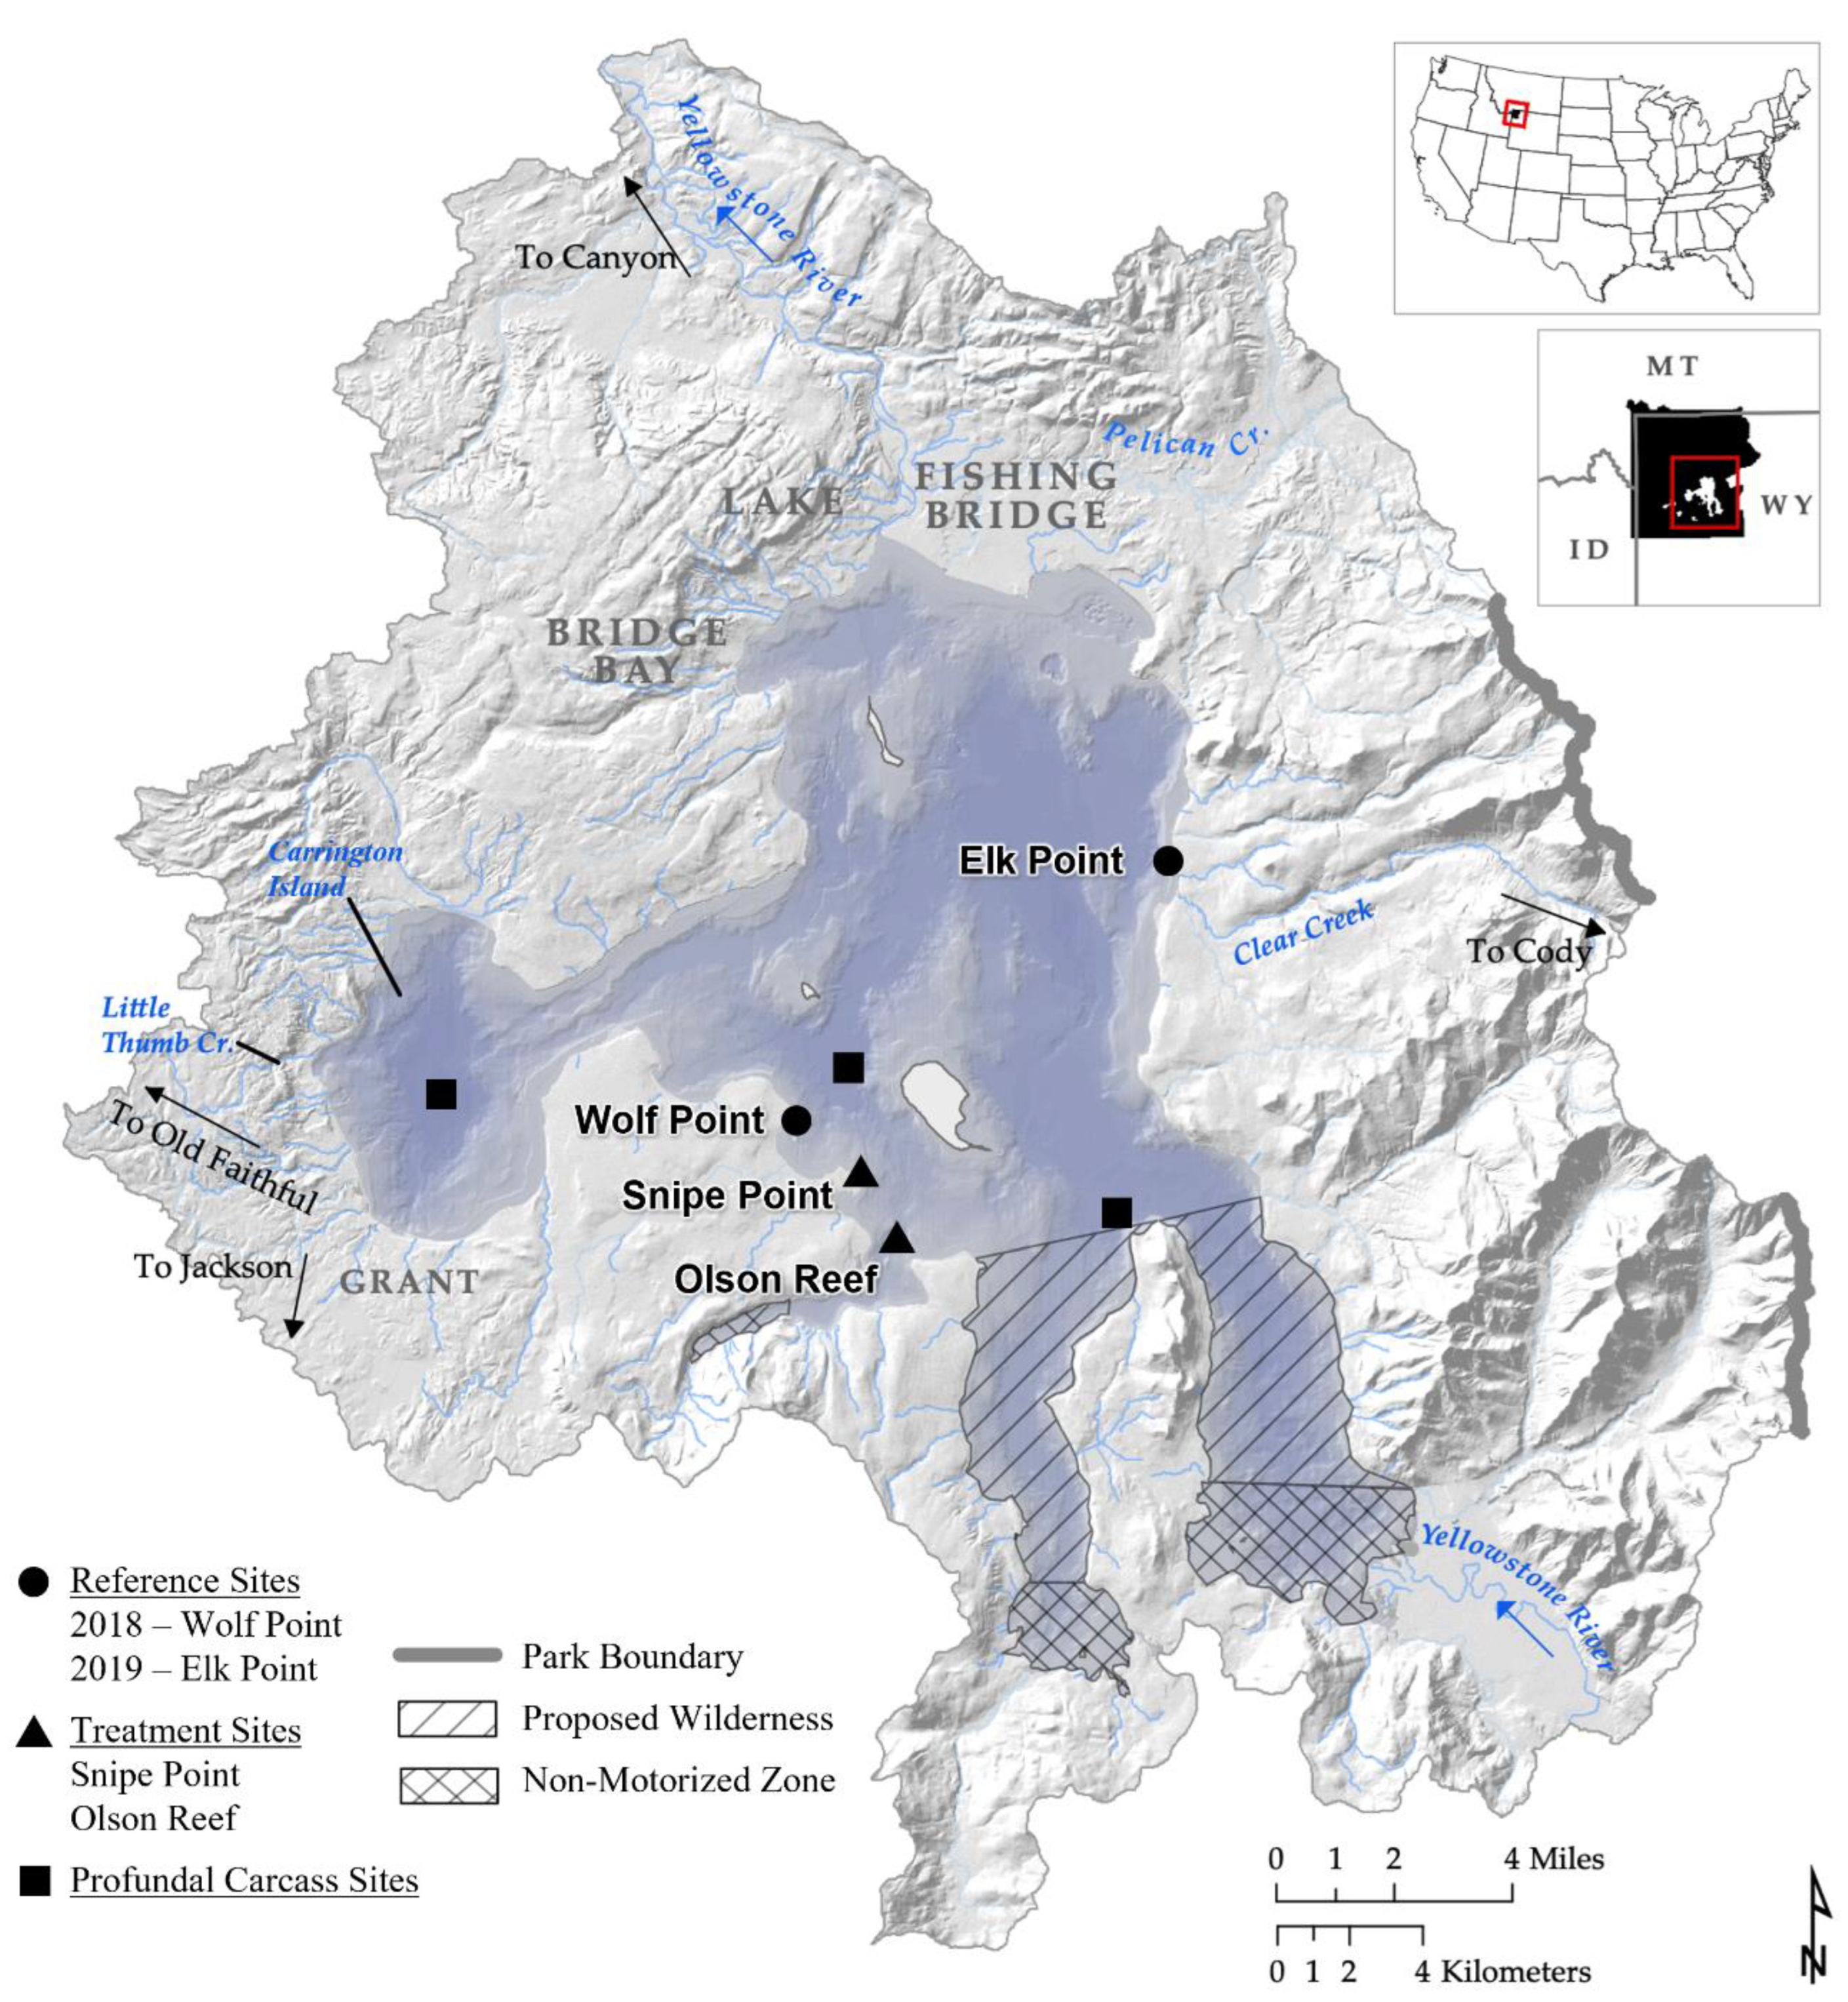
Figure 2.
Hypothesized, simplified food web with arrows showing integration of carcass and diet of organisms of interest in Yellowstone Lake, Yellowstone National Park, Wyoming, U.S.A. Lake trout carcasses are deposited in littoral lake trout spawning grounds to for lake trout embryo suppression in Yellowstone Lake. Organism size is not to scale.
Figure 2.
Hypothesized, simplified food web with arrows showing integration of carcass and diet of organisms of interest in Yellowstone Lake, Yellowstone National Park, Wyoming, U.S.A. Lake trout carcasses are deposited in littoral lake trout spawning grounds to for lake trout embryo suppression in Yellowstone Lake. Organism size is not to scale.
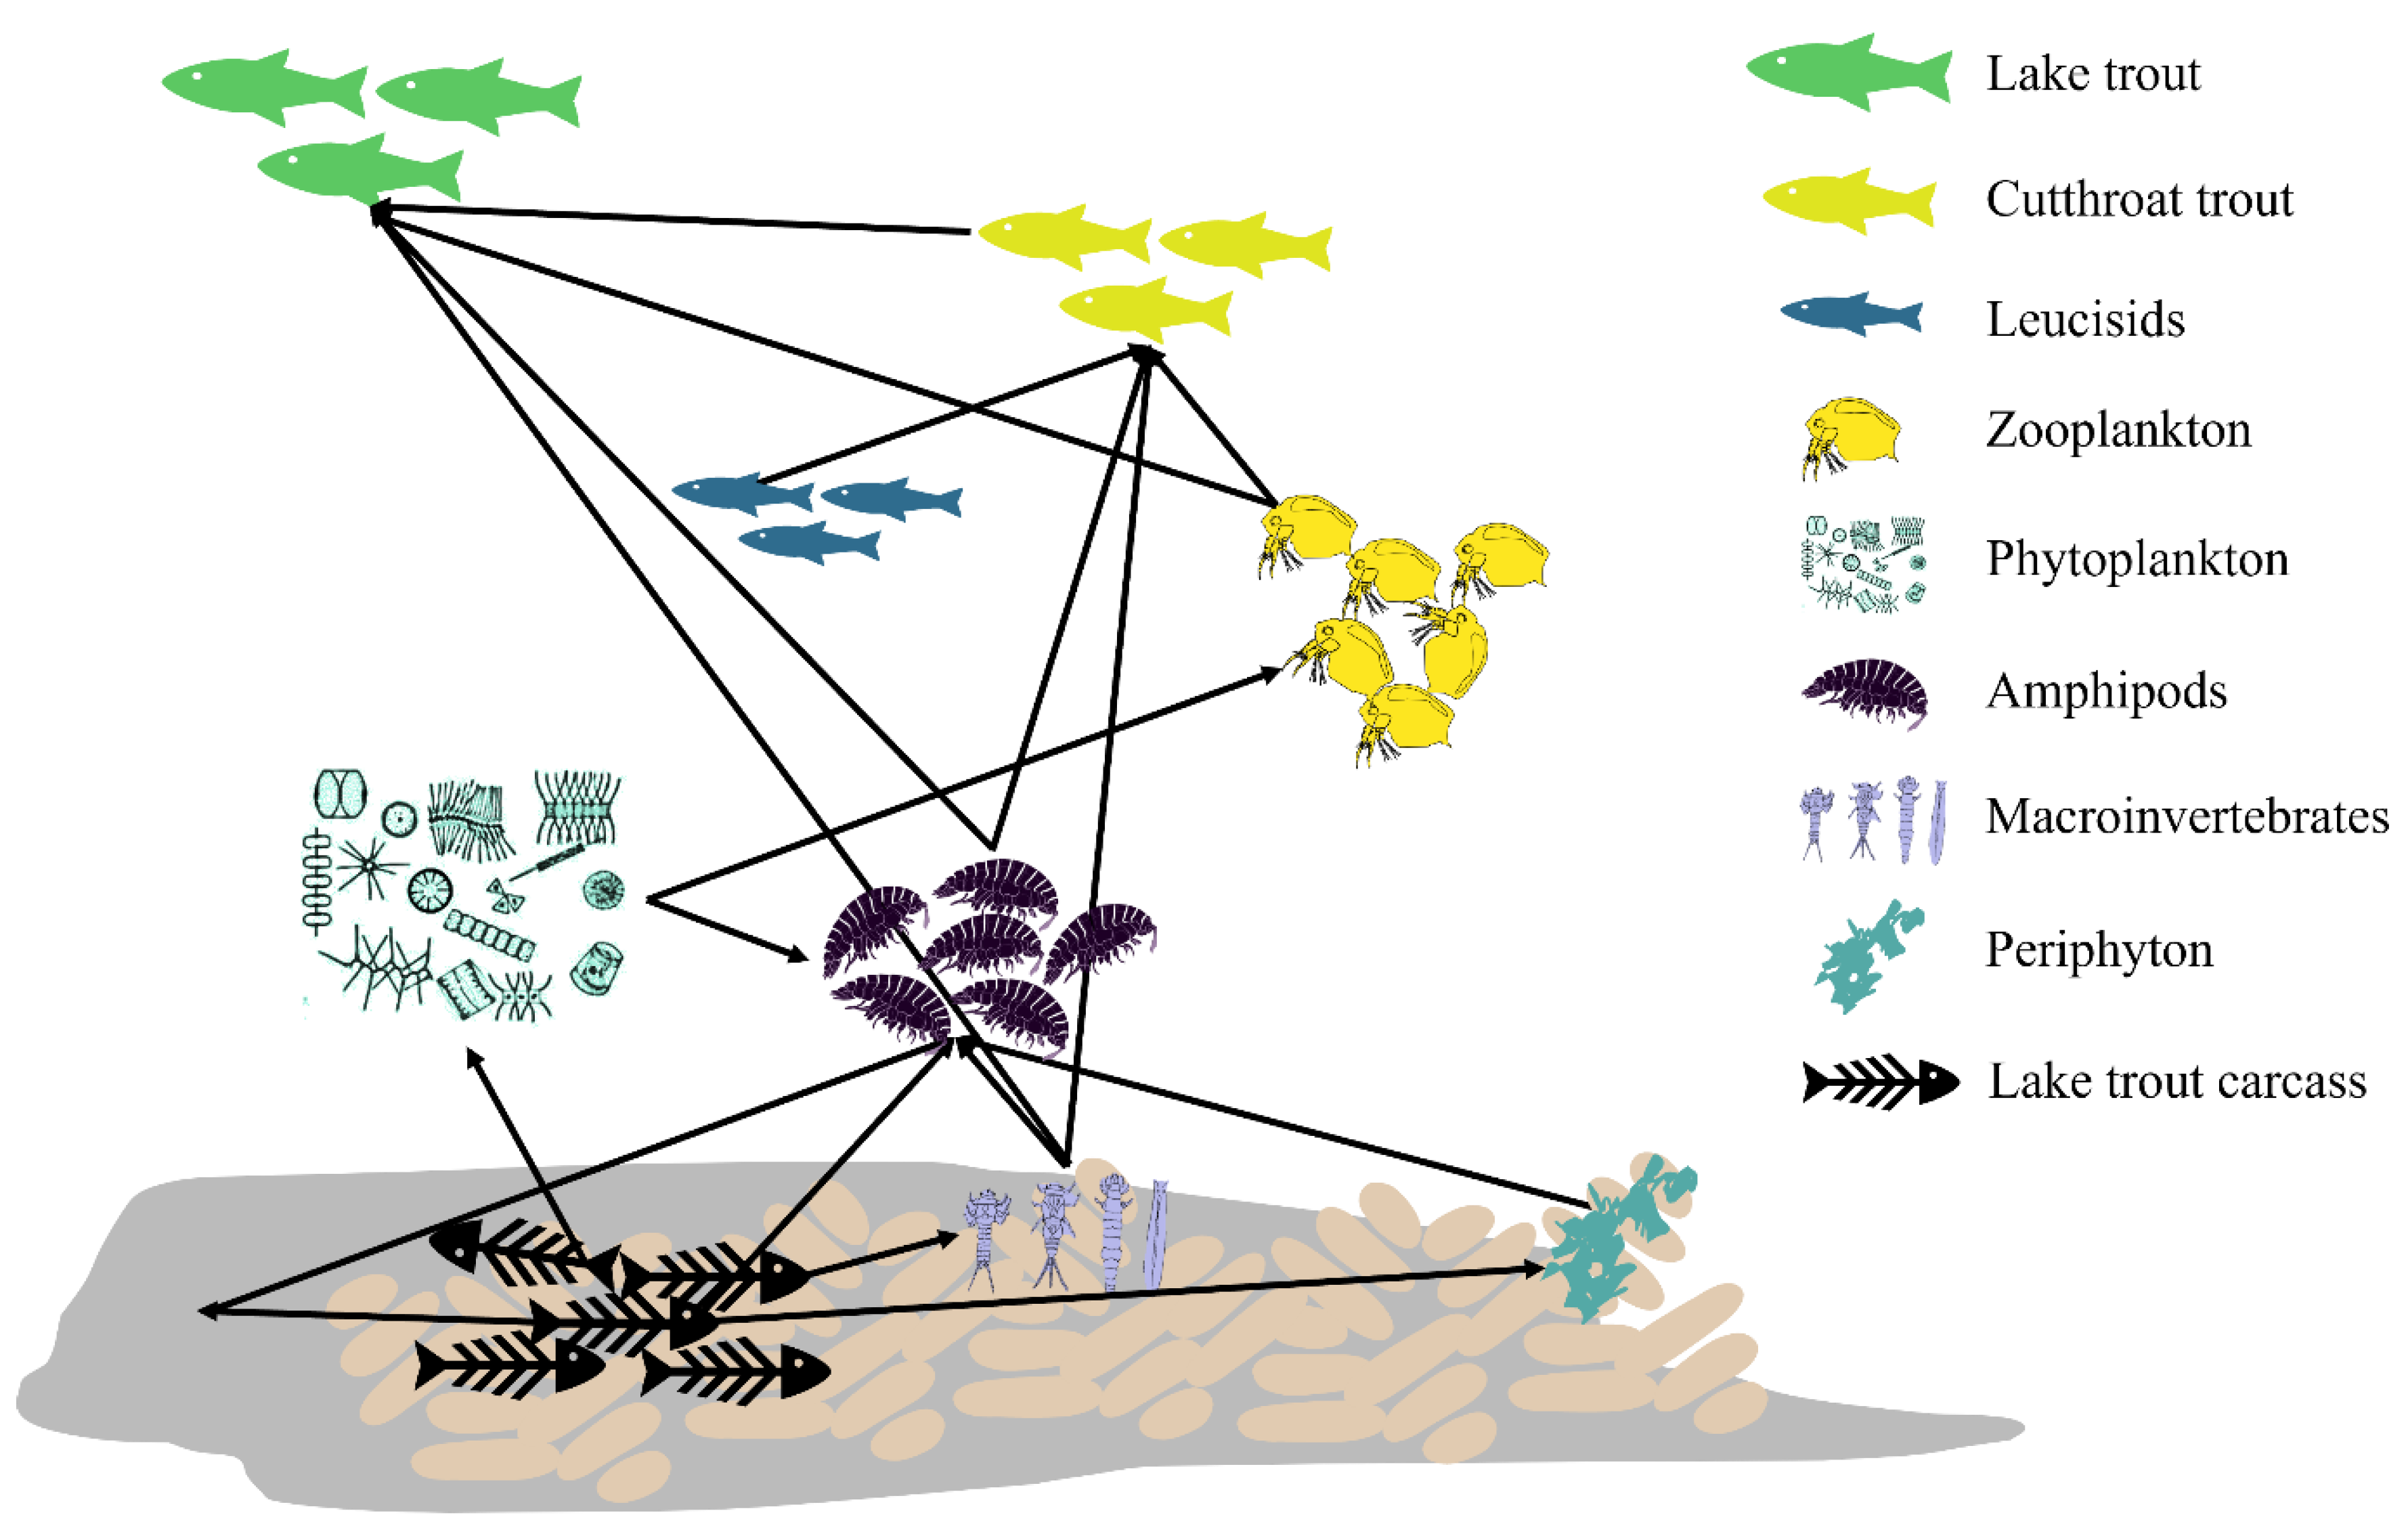
Figure 3.
Organisms and materials from treatment and reference sites in isospace used to understand whether using carcasses to suppress invasive lake trout affected the food web of Yellowstone Lake, Yellowstone National Park, Wyoming, USA. Points are mean values from all samples, bars are ± standard deviation. Lake trout and Yellowstone cutthroat trout were subsampled into ontogenetic size classes established by Ruzycki et al. (2003). Blended lake trout were used for the carcass stable isotope material; where only muscle plugs were used for the other fish materials analyzed.
Figure 3.
Organisms and materials from treatment and reference sites in isospace used to understand whether using carcasses to suppress invasive lake trout affected the food web of Yellowstone Lake, Yellowstone National Park, Wyoming, USA. Points are mean values from all samples, bars are ± standard deviation. Lake trout and Yellowstone cutthroat trout were subsampled into ontogenetic size classes established by Ruzycki et al. (2003). Blended lake trout were used for the carcass stable isotope material; where only muscle plugs were used for the other fish materials analyzed.
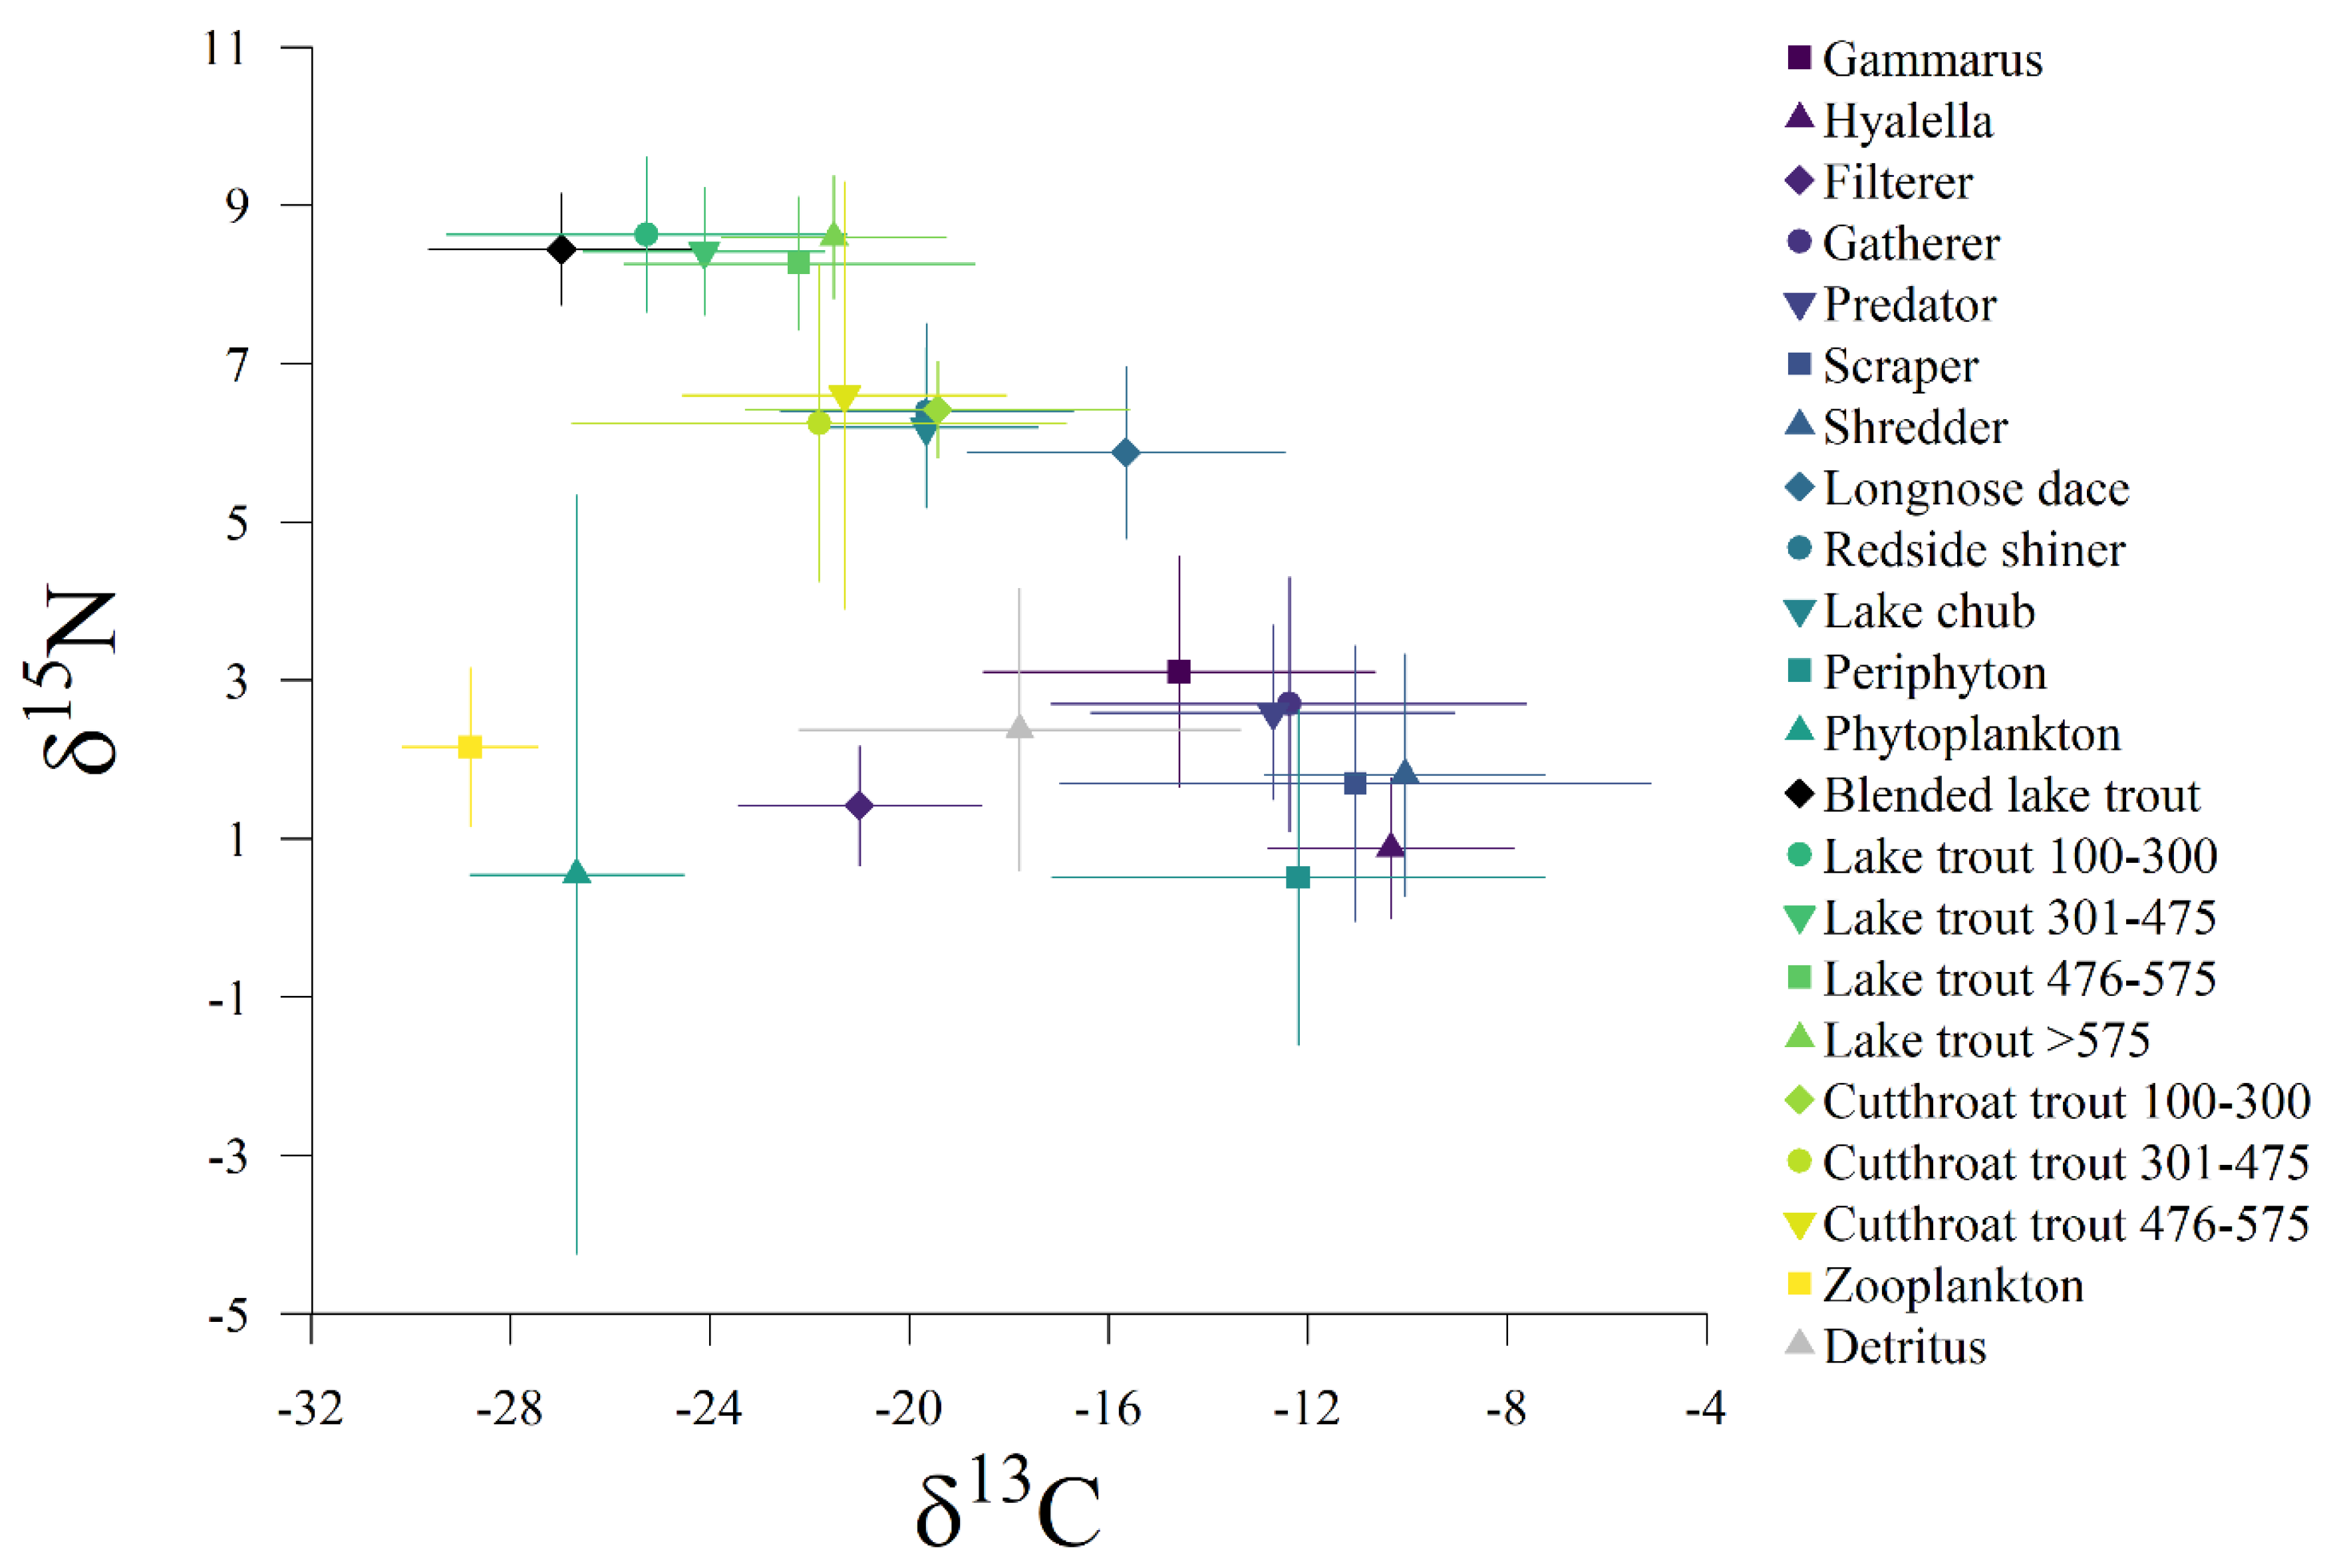
Figure 4.
Comparisons of stable isotope signatures for basal resources (i.e., detritus, periphyton, phyto = phytoplankton, sediment) for Nitrogen across a) reference and treatment sites and b) pre or post treatment, and for Carbon across c) reference and treatment sites and d) pre or post treatment. The horizontal line indicates the median, the boxes are the interquartile range (IQR), whiskers are the 25th and 75th percentile plus and minus 1.5*IQR, respectively, hollow points are outliers, and the solid points are the mean.
Figure 4.
Comparisons of stable isotope signatures for basal resources (i.e., detritus, periphyton, phyto = phytoplankton, sediment) for Nitrogen across a) reference and treatment sites and b) pre or post treatment, and for Carbon across c) reference and treatment sites and d) pre or post treatment. The horizontal line indicates the median, the boxes are the interquartile range (IQR), whiskers are the 25th and 75th percentile plus and minus 1.5*IQR, respectively, hollow points are outliers, and the solid points are the mean.
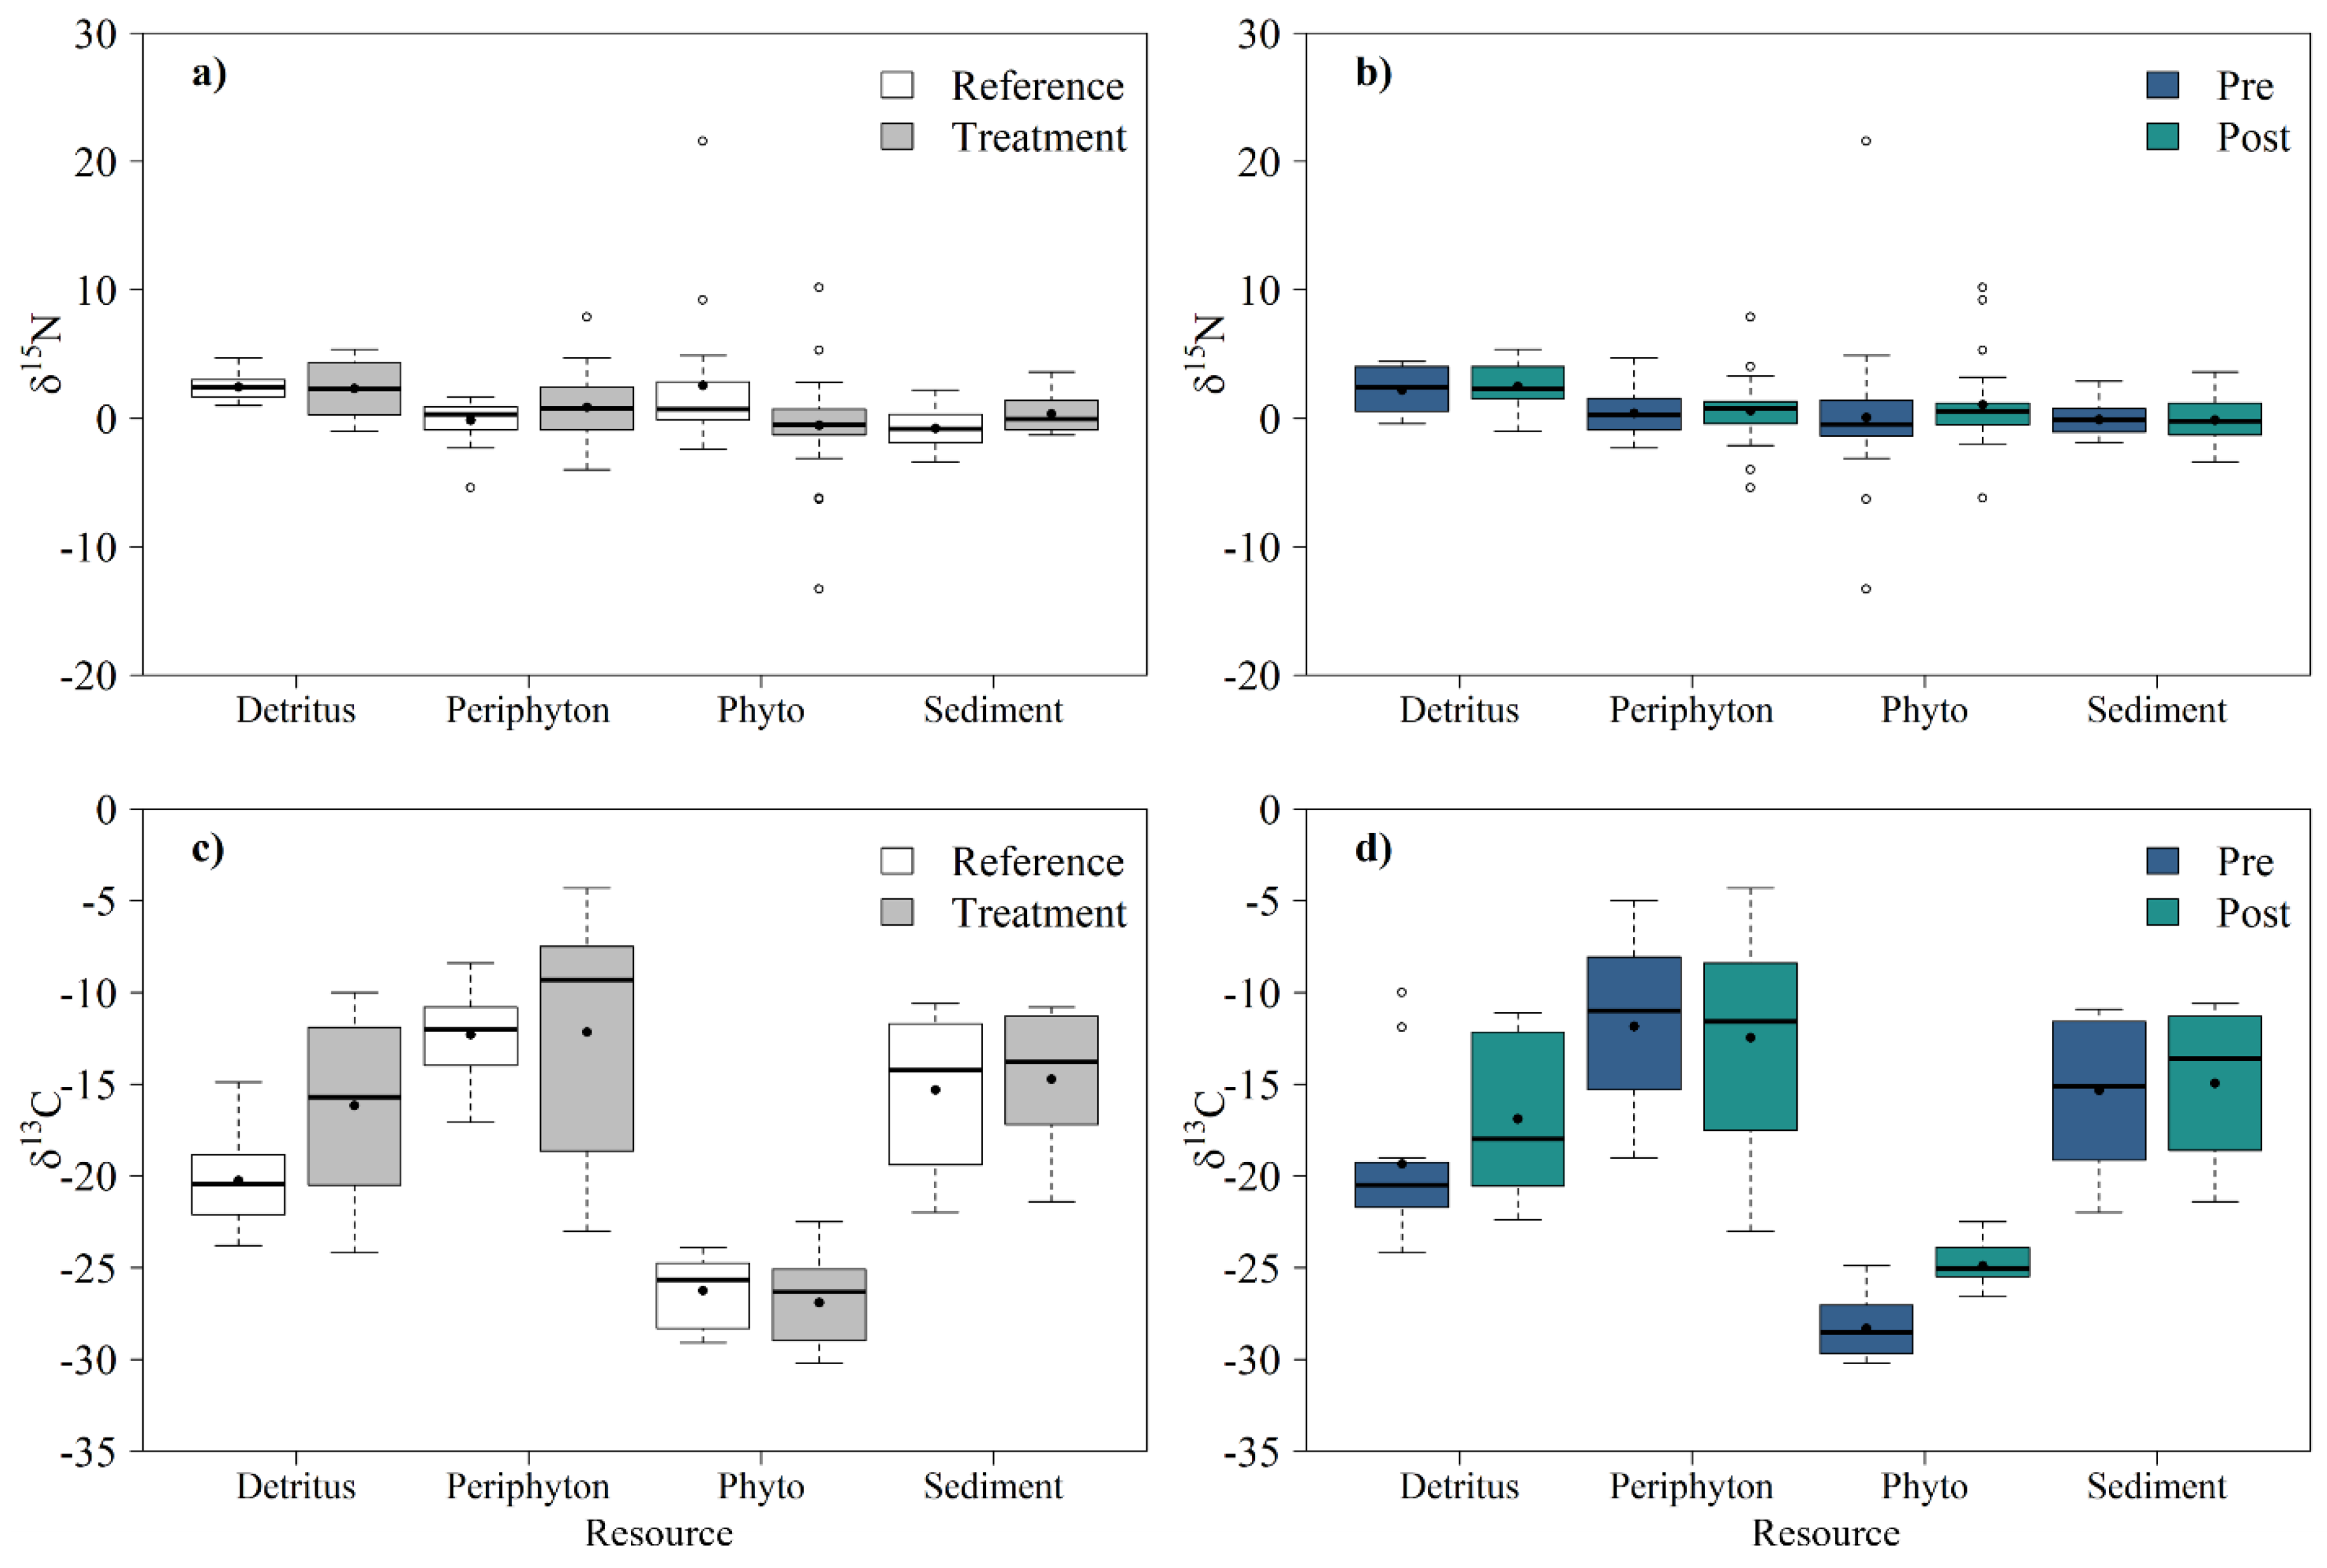
Figure 5.
Comparisons of stable isotope signatures of amphipods (i.e., Gammarus and Hyalella) for Nitrogen across years for a) Gammarus and b) Hyalella, Nitrogen pre or post treatment for c) Gammarus and d) Hyalella, Carbon across years for e) Gammarus and f) Hyalella, Nitrogen pre or post treatment for g) Gammarus and h) Hyalella, The horizontal line indicates the median, the boxes are the interquartile range (IQR), whiskers are the 25th and 75th percentile plus and minus 1.5*IQR, respectively, hollow points are outliers, and the solid points are the mean.
Figure 5.
Comparisons of stable isotope signatures of amphipods (i.e., Gammarus and Hyalella) for Nitrogen across years for a) Gammarus and b) Hyalella, Nitrogen pre or post treatment for c) Gammarus and d) Hyalella, Carbon across years for e) Gammarus and f) Hyalella, Nitrogen pre or post treatment for g) Gammarus and h) Hyalella, The horizontal line indicates the median, the boxes are the interquartile range (IQR), whiskers are the 25th and 75th percentile plus and minus 1.5*IQR, respectively, hollow points are outliers, and the solid points are the mean.
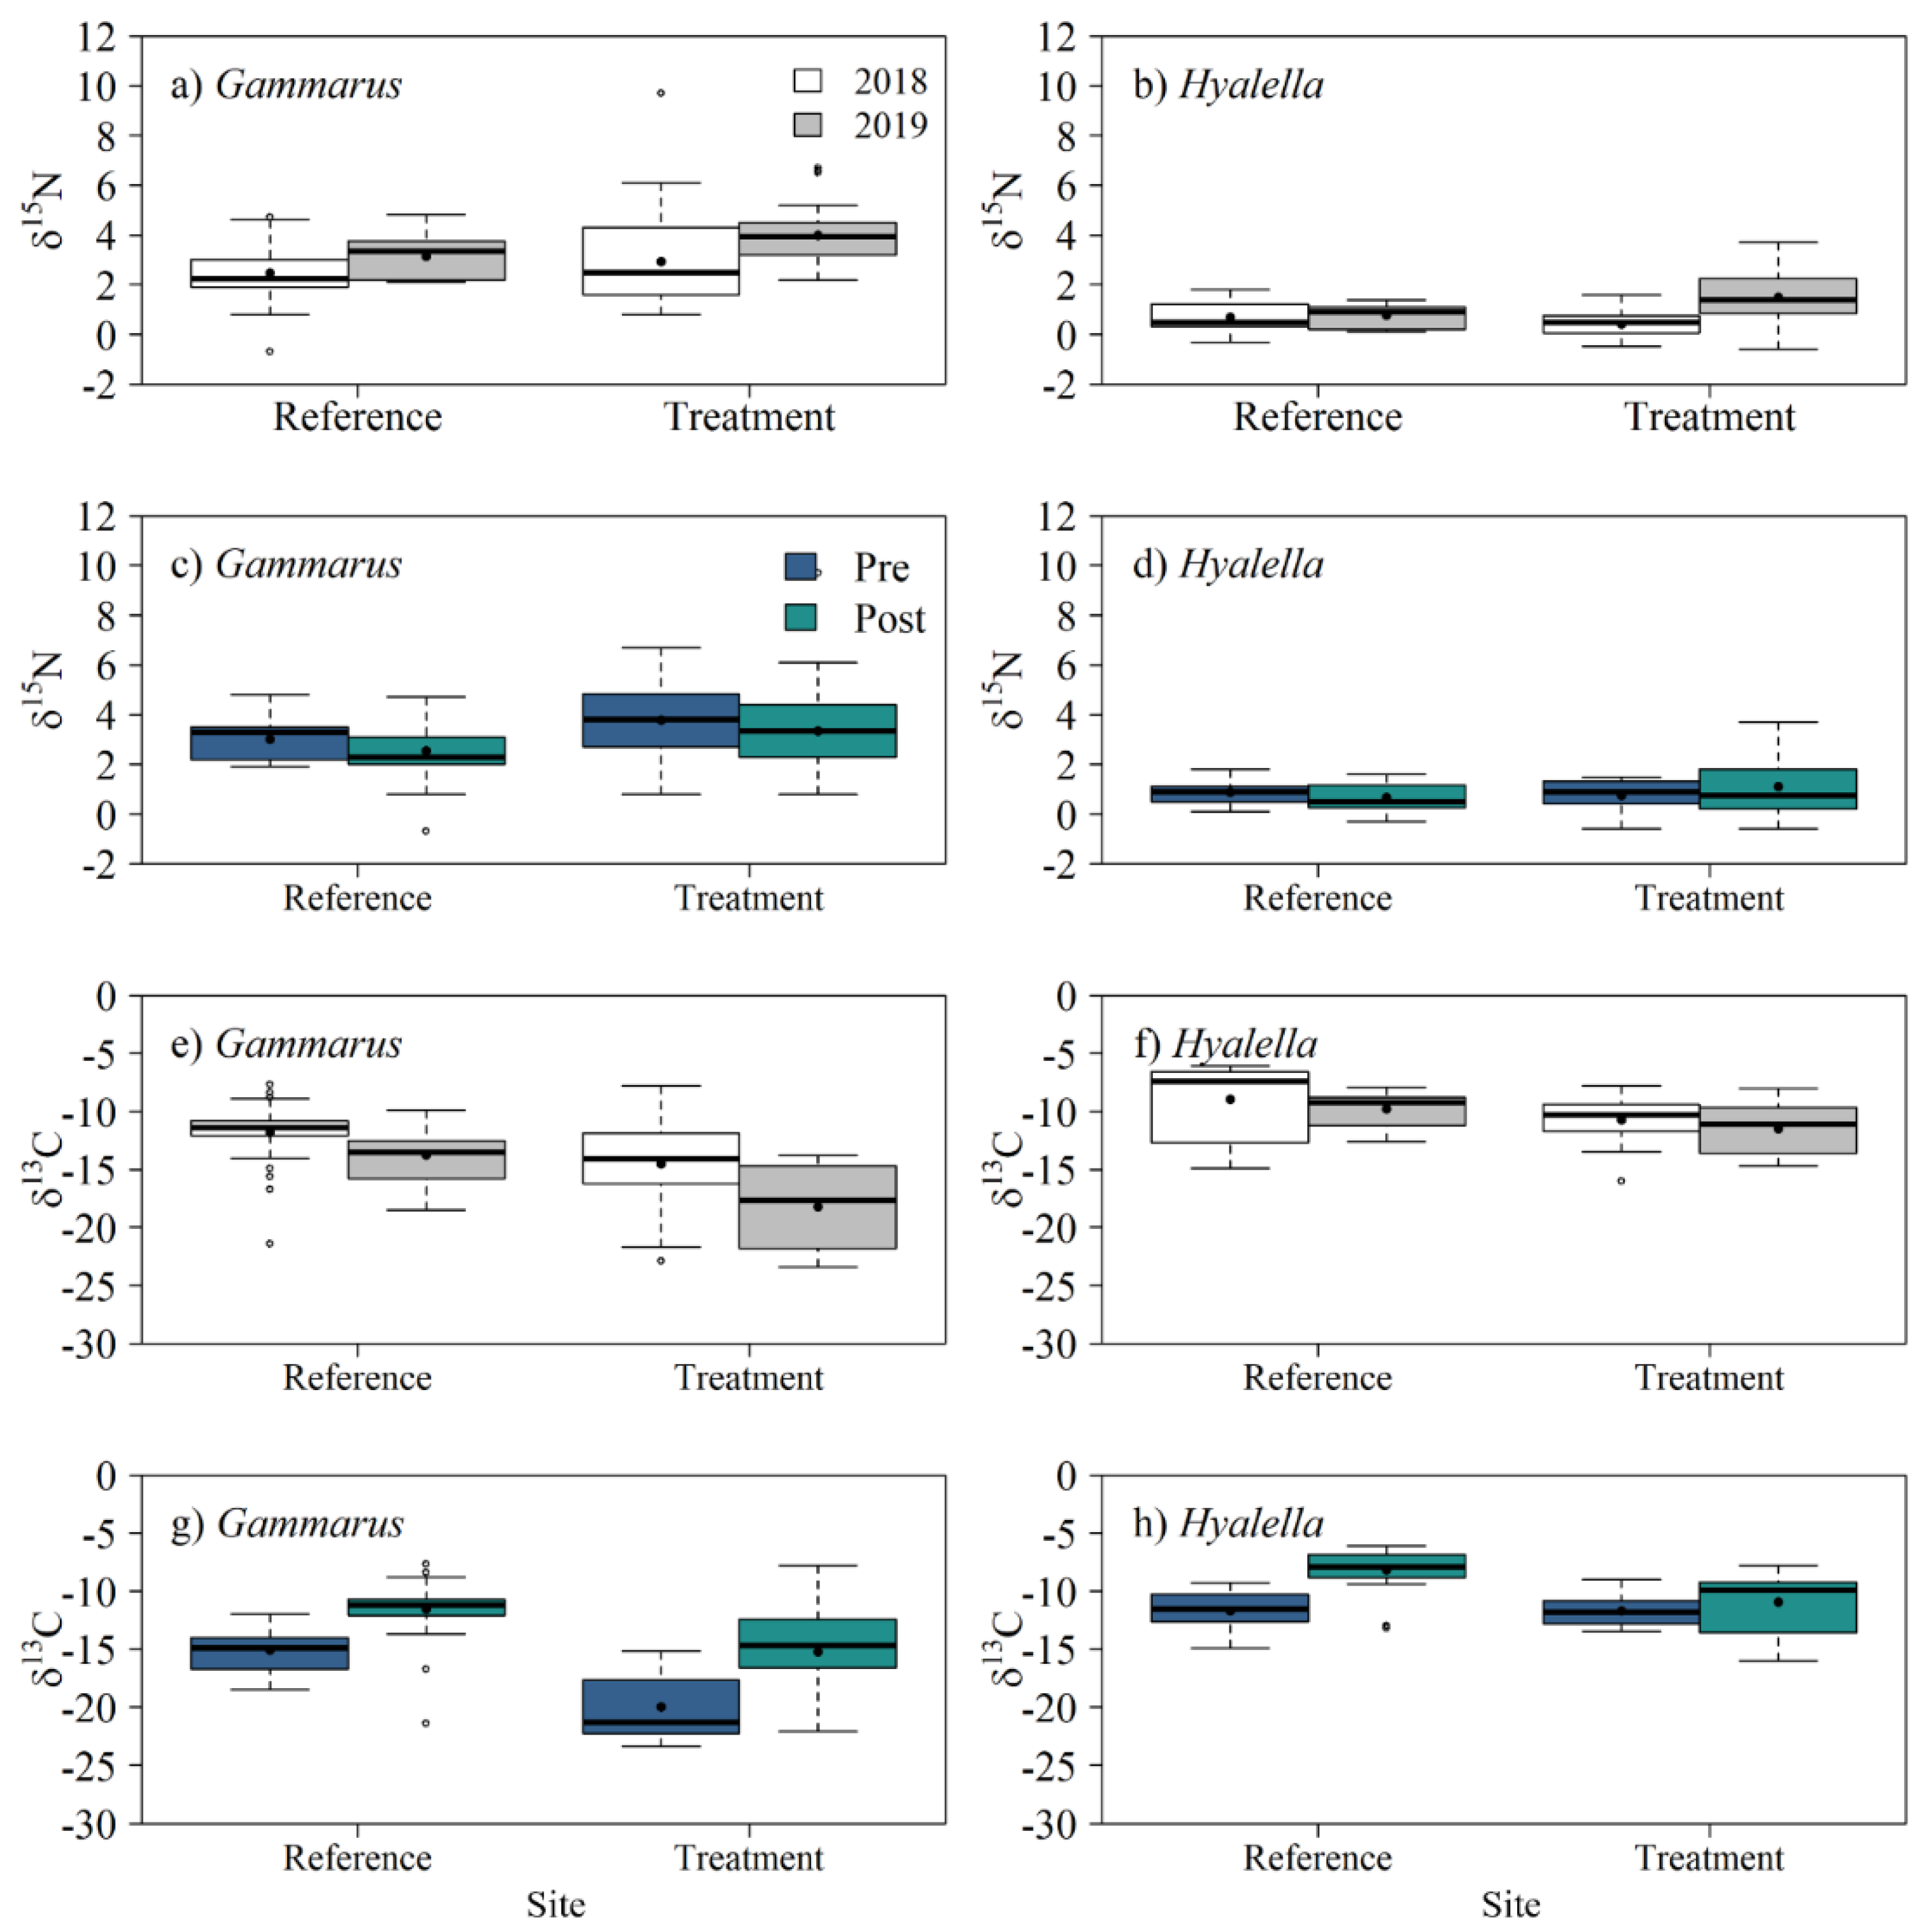
Figure 6.
Gammarus diet proportions estimated using stable isotope mixing models to determine if carcasses (LKT= lake trout = blended lake trout) were consumed at sites where carcasses were deposited for invasive species suppression at treatment sites (a, b) or reference sites (c, d) in Yellowstone Lake, Yellowstone National Park, Wyoming, USA. Inverts = benthic invertebrates considered an aggregation of different functional feeding groups: filterer, gatherer, predator, scraper, shredder. Peri = periphyton. Phyto = phytoplankton. Natural sources are an aggregation of all diet items except blended lake trout. The horizontal line indicates the median, the boxes are the interquartile range (IQR), whiskers are the 25th and 75th percentile plus and minus 1.5*IQR, respectively, and the hollow points are the outliers.
Figure 6.
Gammarus diet proportions estimated using stable isotope mixing models to determine if carcasses (LKT= lake trout = blended lake trout) were consumed at sites where carcasses were deposited for invasive species suppression at treatment sites (a, b) or reference sites (c, d) in Yellowstone Lake, Yellowstone National Park, Wyoming, USA. Inverts = benthic invertebrates considered an aggregation of different functional feeding groups: filterer, gatherer, predator, scraper, shredder. Peri = periphyton. Phyto = phytoplankton. Natural sources are an aggregation of all diet items except blended lake trout. The horizontal line indicates the median, the boxes are the interquartile range (IQR), whiskers are the 25th and 75th percentile plus and minus 1.5*IQR, respectively, and the hollow points are the outliers.
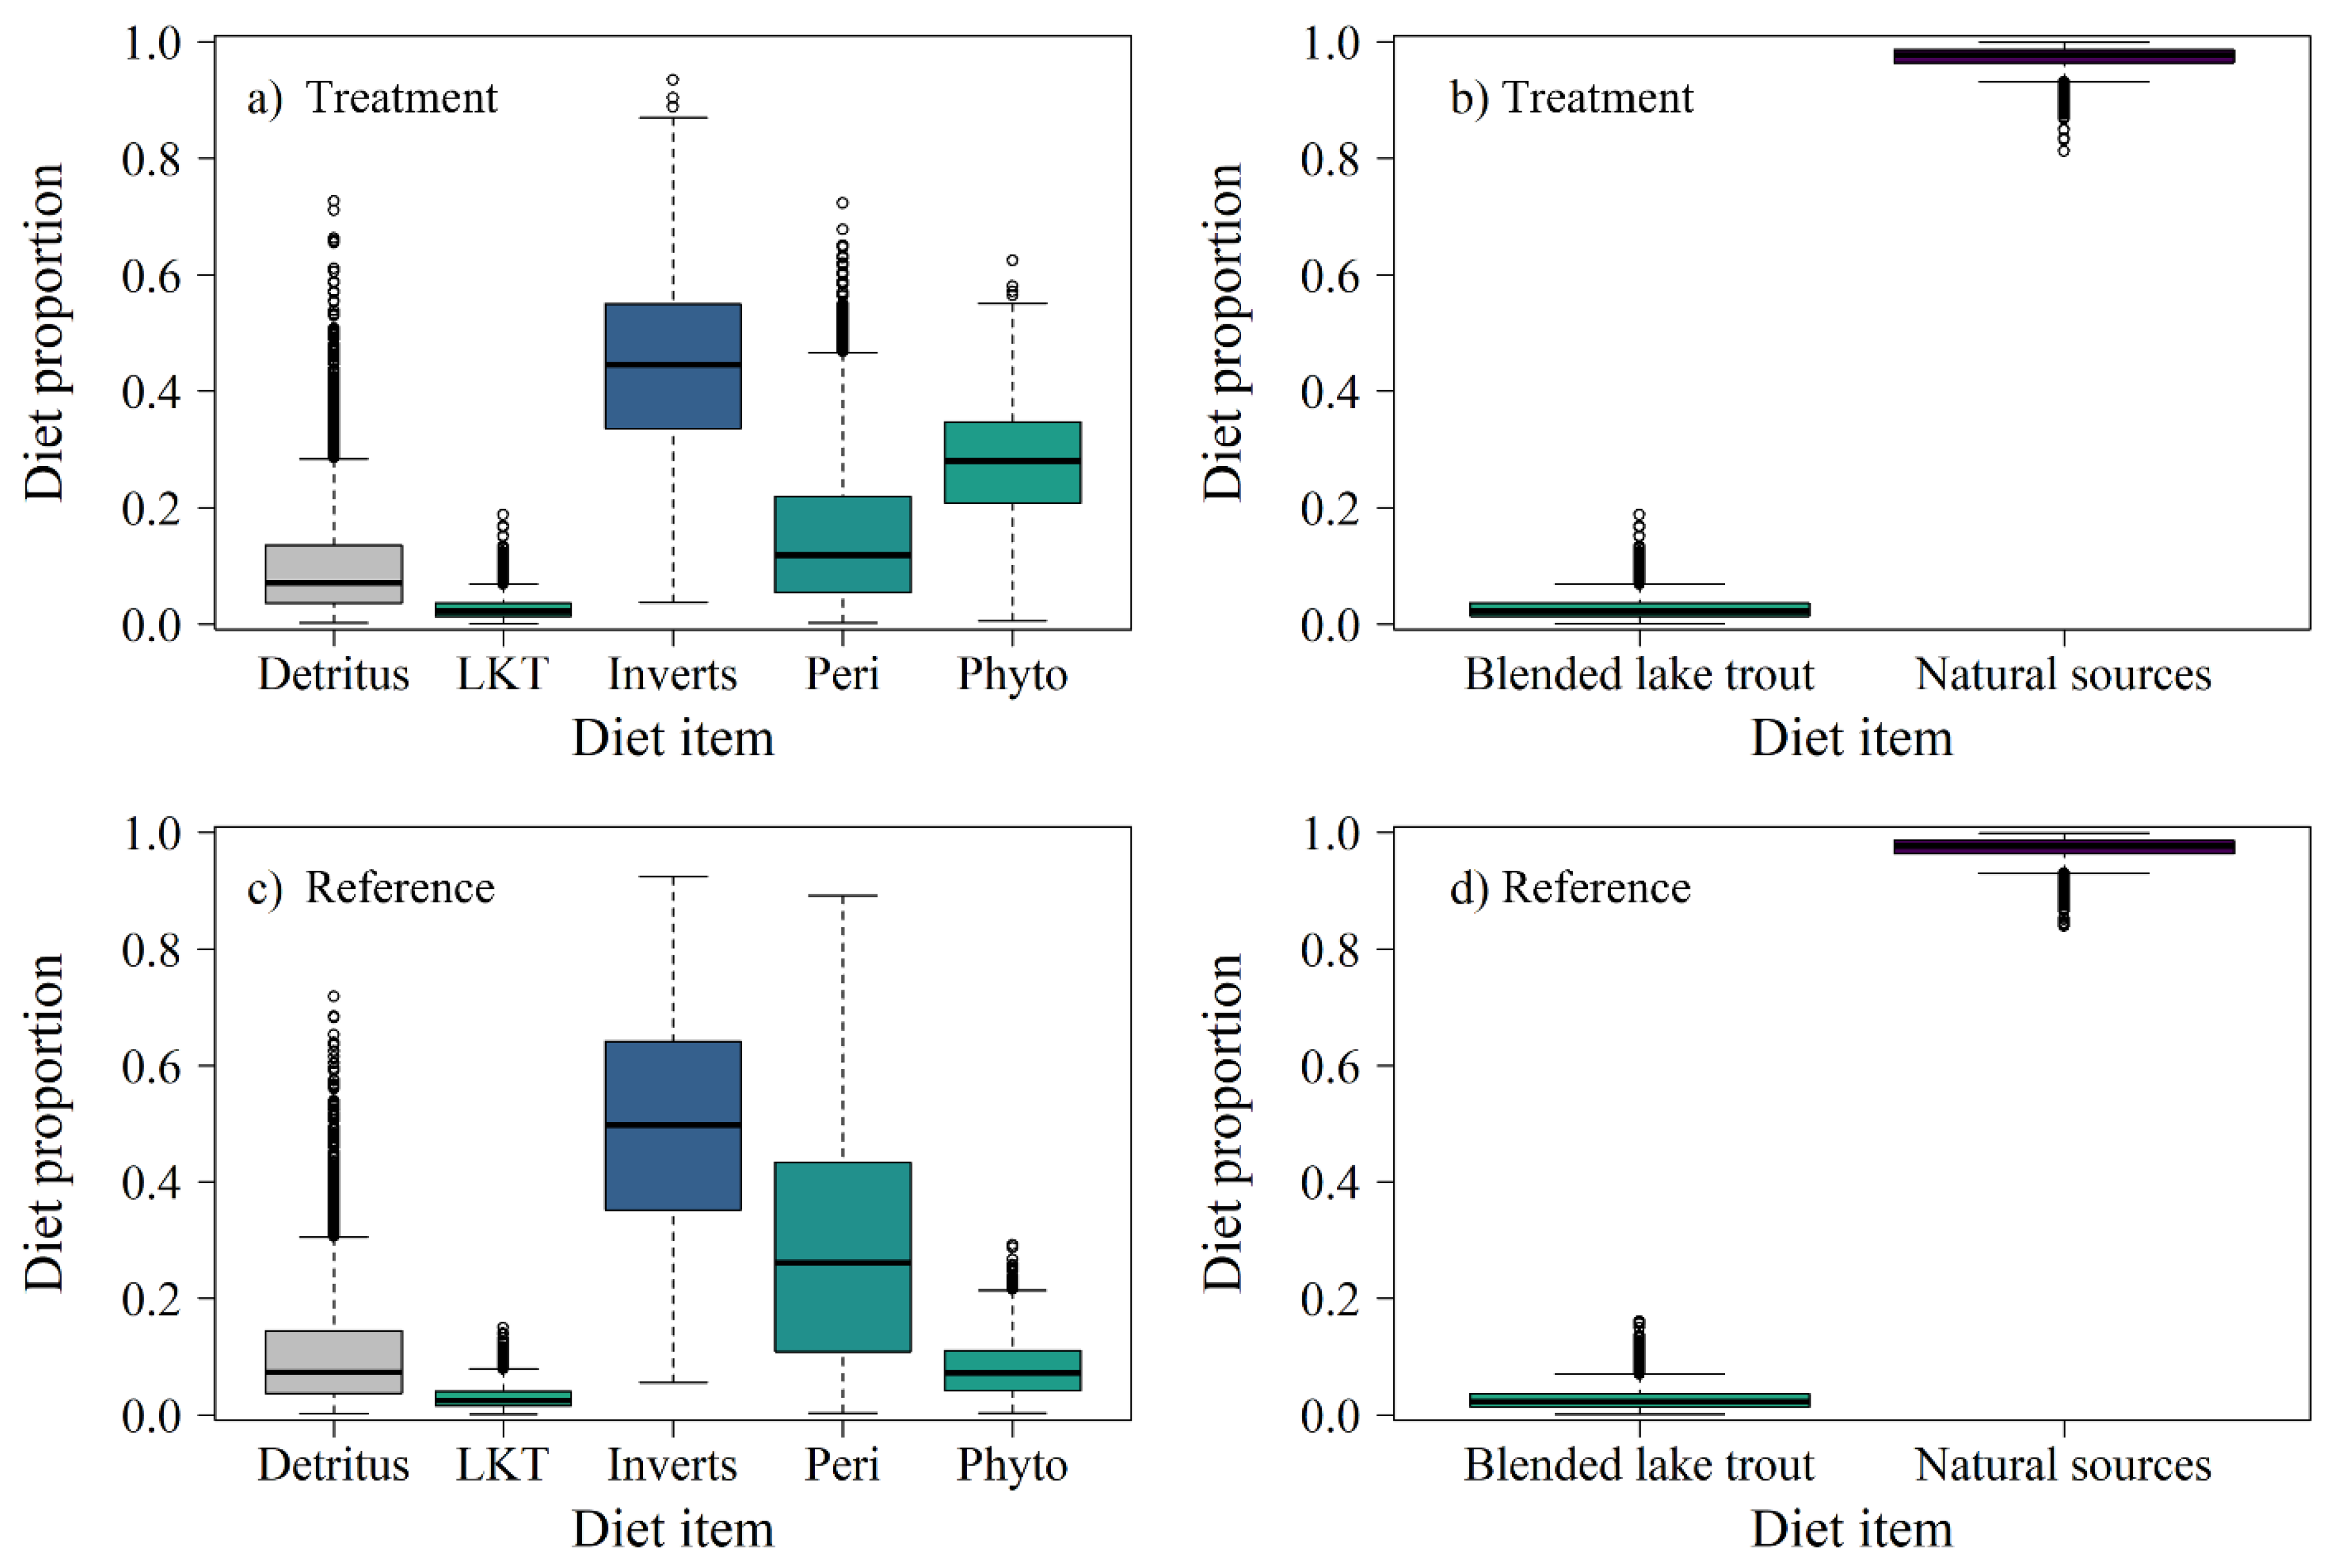

Table 1.
Diet items included for analysis in stable isotope mixing models for species in Yellowstone Lake, Yellowstone National Park, Wyoming, USA. Macroinvertebrates were considered an aggregation of different functional feeding groups: filterer, gatherer, predator, scraper, shredder. Leuciscids were considered an aggregation of the following fishes: lake chub, longnose dace, redside shiner because inclusion in diet analysis from historical studies in Yellowstone Lake did not distinguish among the species. Diet items Hyalella and Gammarus were aggregated for analysis as amphipods. Yellowstone cutthroat trout are abbreviated as YCT.
Table 1.
Diet items included for analysis in stable isotope mixing models for species in Yellowstone Lake, Yellowstone National Park, Wyoming, USA. Macroinvertebrates were considered an aggregation of different functional feeding groups: filterer, gatherer, predator, scraper, shredder. Leuciscids were considered an aggregation of the following fishes: lake chub, longnose dace, redside shiner because inclusion in diet analysis from historical studies in Yellowstone Lake did not distinguish among the species. Diet items Hyalella and Gammarus were aggregated for analysis as amphipods. Yellowstone cutthroat trout are abbreviated as YCT.
| Predator species | Length class (mm total length) |
Diet items included in simmr |
| Gammarus | NA | Whole lake trout (blended), Macroinvertebrates, Periphyton, Phytoplankton, Detritus |
| Lake trout | 100 - 300 | YCT < 100 mm, Hyalella, Gammarus, Macroinvertebrates, Zooplankton |
| 301 - 475 | YCT < 300 mm, Hyalella, Gammarus, Macroinvertebrates, Zooplankton | |
| 476 - 575 | YCT < 300 mm, Hyalella, Gammarus, Macroinvertebrates, Zooplankton | |
| > 575 | YCT < 300 mm, Hyalella, Gammarus, Macroinvertebrates, Zooplankton | |
| YCT | 100 - 300 | Hyalella, Gammarus, Macroinvertebrates, Zooplankton |
| 301 - 475 | Leuciscids, Hyalella, Gammarus, Macroinvertebrates, Zooplankton | |
| 476 - 575 | Leuciscids, Hyalella, Gammarus, Macroinvertebrates, Zooplankton |
Table 2.
Average values for measured benthic water temperature, water depth, Secchi disk depth, ammonium (NH4+), nitrate (NO3 -) concentrations, dissolved oxygen (DO; mg/L and % saturation), specific conductivity (SPC), and pH at each shallow site before (pre) and during (treatment) carcass additions at reference, early season, and late season sites. Standard error was calculated for nutrient concentrations when at least three measurements were above detection limit. The estimated amount of lake trout carcass material as wet mass (WM), dry mass (DM) and nitrogen (N) added to the early and late season sites (see methods for more details). Specific conductivity and pH were not collected in 2018 because of equipment failure.
Table 2.
Average values for measured benthic water temperature, water depth, Secchi disk depth, ammonium (NH4+), nitrate (NO3 -) concentrations, dissolved oxygen (DO; mg/L and % saturation), specific conductivity (SPC), and pH at each shallow site before (pre) and during (treatment) carcass additions at reference, early season, and late season sites. Standard error was calculated for nutrient concentrations when at least three measurements were above detection limit. The estimated amount of lake trout carcass material as wet mass (WM), dry mass (DM) and nitrogen (N) added to the early and late season sites (see methods for more details). Specific conductivity and pH were not collected in 2018 because of equipment failure.
| Reference | Early treatment | Late treatment | |||||
| Year | Measurement | Pre | Post | Pre | Post | Pre | Post |
| 2018 | Temperature (°C) | 11.7 | 13.5 | 10.8 | 11.4 | 7.8 | 10.3 |
| Depth (m) | 5 | 5 | 5 | 5 | 12 | 12 | |
| Secchi (m) | 7 | 8.2 | 6 | 8.5 | 8 | 10 | |
| NH4+ (µg N/L) | 4.6 ± 0.47 | 5.6 ± 0.32 | 3.4 ± 0.46 | 6.9 ± 0.24 | 3.5 ± 0.49 | 5.5 ± 0.11 | |
| NO3- (µg N/L) | 78 ± 41 | 120 ± 49 | 70 | 120 ± 48 | <50 | 50 ± 1.6 | |
| DO (mg/L) 8.7 | 8.7 | 8.4 | 8.5 | 5.9 | 9 | 8 | |
| DO (% saturation) | 111.4 | 108.6 | 99.7 | 74 | 101.3 | 95.3 | |
| WM carcasses (kg) | 0 | 0 | 0 | 2,172 | 0 | 443 | |
| DM carcasses (kg) | 0 | 0 | 0 | 478 | 0 | 97 | |
| N carcasses (kg) | 0 | 0 | 0 | 52 | 0 | 11 | |
| 2019 | Temperature (°C) | 11.5 | 13.2 | 10.5 | 13.8 | 7.8 | 10.3 |
| Depth (m) | 7 | 7 | 5 | 5 | 12 | 12 | |
| Secchi (m) | 7.5 | 11.25 | 8.75 | 10 | 9.5 | 10 | |
| NH4+ (µg N/L) | 4.8 ± 1.3 | 6.5 ± 1.2 | 3.7 ± 1.5 | 6.6 ± 0.64 | 3.2 ± 0.83 | 3.9 ± 0.72 | |
| NO3- (µg N/L) | <50 | <50 | <50 | <50 | <50 | <50 | |
| DO (mg/L) 8.7 | 8.9 | 8.1 | 9.2 | 6.6 | 9 | 8 | |
| DO (% saturation) | 108.5 | 102.9 | 110.2 | 86.4 | 101.3 | 95.3 | |
| SPC (µS/cm) | 120.8 ± 35 | 92.0 ± 0.3 | 126.1 ± 36 | 91.9 ± 0.4 | 92.2 ± 0.62 | 91.7 ± 0.43 | |
| pH | 7.3 | 7.1 | 6.8 | 7.7 | 7.6 | 7.2 | |
| WM carcasses (kg) | 0 | 0 | 0 | 5,937 | 0 | 404 | |
| DM carcasses (kg) | 0 | 0 | 0 | 1306 | 0 | 88 | |
| N carcasses (kg) | 0 | 0 | 0 | 144 | 0 | 10 | |
Table 3.
Proportion of diet items and standard deviations (SD) estimated using stable isotope mixing models for species in Yellowstone Lake, Yellowstone National Park, Wyoming, USA. Probability of diet proportions is the chance of the different diet item proportions being greater than or less than one another. The highest supported diet item probability is listed and the second supported with the associated probability is listed in footnotes. Yellowstone cutthroat trout are abbreviated as YCT and length classes are total length.
Table 3.
Proportion of diet items and standard deviations (SD) estimated using stable isotope mixing models for species in Yellowstone Lake, Yellowstone National Park, Wyoming, USA. Probability of diet proportions is the chance of the different diet item proportions being greater than or less than one another. The highest supported diet item probability is listed and the second supported with the associated probability is listed in footnotes. Yellowstone cutthroat trout are abbreviated as YCT and length classes are total length.
| Species | Length class | Diet item | Diet item proportion mean | Diet item proportion SD | Probability of diet proportions |
| (mm) | |||||
| Lake trout | 100 - 300 | Amphipods | 0.17 | 0.04 | 51%1 |
| Zooplankton | 0.61 | 0.04 | |||
| YCT <100 mm | 0.04 | 0.02 | |||
| Macroinvertebrates | 0.18 | 0.04 | |||
| 301 - 475 | Amphipods | 0.16 | 0.03 | 66%2 | |
| Zooplankton | 0.39 | 0.04 | |||
| YCT <300 mm | 0.42 | 0.05 | |||
| Macroinvertebrates | 0.04 | 0.01 | |||
| 476 - 575 | Amphipods | 0.22 | 0.04 | 51%3 | |
| Zooplankton | 0.22 | 0.04 | |||
| YCT <300 mm | 0.56 | 0.05 | |||
| Macroinvertebrates | 0.01 | 0.01 | |||
| >576 | Amphipods | 0.24 | 0.03 | 86%4 | |
| Zooplankton | 0.14 | 0.04 | |||
| YCT <300 mm | 0.59 | 0.04 | |||
| Macroinvertebrates | 0.03 | 0.01 | |||
| YCT | 100 - 300 | Amphipods | 0.67 | 0.05 | 99%5 |
| Zooplankton | 0.27 | 0.04 | |||
| Macroinvertebrates | 0.06 | 0.03 | |||
| 301 - 475 | Amphipods | 0.55 | 0.07 | 77%6 | |
| Zooplankton | 0.36 | 0.07 | |||
| Leuciscids | 0.03 | 0.02 | |||
| Macroinvertebrates | 0.06 | 0.03 | |||
| 475-575 | Amphipods | 0.56 | 0.06 | 56%7 | |
| Zooplankton | 0.39 | 0.05 | |||
| Leuciscids | 0.02 | 0.02 | |||
| Macroinvertebrates | 0.03 | 0.03 | |||
| Amphipods | Carcass treatment | Macroinvertebrates | 0.45 | 0.15 | 22%8 |
| Phytoplankton | 0.28 | 0.10 | |||
| Periphyton | 0.15 | 0.12 | |||
| Detritus | 0.10 | 0.10 | |||
| Blended Lake trout | 0.03 | 0.02 | |||
| Amphipods | Carcass treatment | Natural sources | 0.97 | 0.02 | 100% |
| Blended Lake trout | 0.03 | 0.02 | |||
| Amphipods | Reference site | Macroinvertebrates | 0.49 | 0.19 | 14%9 |
| Phytoplankton | 0.08 | 0.05 | |||
| Periphyton | 0.29 | 0.20 | |||
| Detritus | 0.11 | 0.11 | |||
| Blended Lake trout | 0.03 | 0.02 | |||
| Amphipods | Reference site | Natural sources | 0.97 | 0.02 | 100% |
| Blended Lake trout | 0.03 | 0.02 |
1Zooplankton > Amphipods > Macroinvertebrates > YCT <100mm: 49%. 2Zooplankton > YCT > Amphipods > Macroinvertebrates: 34%. 3YCT > Zooplankton > Amphipods > Macroinvertebrates: 49%. 4YCT > Amphipods > Macroinvertebrates > Zooplankton: 14%. 5Amphipods > Macroinvertebrates > Zooplankton: 1%. 6Amphipods > Zooplankton > Leuciscids > Macroinvertebrates: 12%. 7Amphipods > Zooplankton > Macroinvertebrates > Leuciscids: 41%. 8Macroinvertebrates > Phytoplankton > Detritus > Periphyton > Blended Lake trout: 15%. 9Macroinvertebrates > Periphyton > Detritus > Phytoplankton > Blended Lake trout: 11%.
Disclaimer/Publisher’s Note: The statements, opinions and data contained in all publications are solely those of the individual author(s) and contributor(s) and not of MDPI and/or the editor(s). MDPI and/or the editor(s) disclaim responsibility for any injury to people or property resulting from any ideas, methods, instructions or products referred to in the content. |
© 2026 by the authors. Licensee MDPI, Basel, Switzerland. This article is an open access article distributed under the terms and conditions of the Creative Commons Attribution (CC BY) license (http://creativecommons.org/licenses/by/4.0/).
Copyright: This open access article is published under a Creative Commons CC BY 4.0 license, which permit the free download, distribution, and reuse, provided that the author and preprint are cited in any reuse.


