

Submitted:
07 July 2026
Posted:
09 July 2026
You are already at the latest version
Abstract
The increasing availability of large-scale consumer data and advances in computational technologies have transformed marketing into a data-driven discipline. Mathematical and computational frameworks play a critical role in supporting decision-making processes by enabling organizations to analyze complex market dynamics, predict consumer behavior, optimize resource allocation, and improve strategic planning. This study explores the integration of mathematical modeling, optimization techniques, machine learning algorithms, simulation methods, and data analytics within contemporary marketing practices. Drawing on the interdisciplinary convergence of marketing, engineering, mathematics, and computer science, the paper examines how computational approaches enhance market segmentation, customer engagement, demand forecasting, pricing strategies, advertising performance, and customer relationship management. The analysis highlights the growing relevance of predictive and prescriptive analytics in converting raw data into actionable insights that support evidence-based managerial decisions. Furthermore, the study discusses emerging trends, including artificial intelligence, real-time analytics, and intelligent decision support systems, that are reshaping the marketing landscape. Challenges related to data quality, model interpretability, computational complexity, and ethical considerations are also addressed. The findings suggest that the effective integration of mathematical and computational frameworks can significantly improve organizational competitiveness by increasing decision accuracy, operational efficiency, and responsiveness to market changes. This research contributes to a broader understanding of how advanced analytical methods support the transition from data collection to strategic decision-making in modern marketing environments.
Keywords:
computational
; mathematical
; engineering
; mathematical engineering
; marketing
1. Introduction
In today’s competitive business environment, businesses must understand consumer behavior and how it shapes market trends. However, [1] argue that factors such as economic conditions and personal preferences have made it difficult for businesses to predict consumer behavior. This has created a need for technologies and models that support large-scale data collection and analysis to enable data-driven decisions and strategies. Thus, the rapid digitalization of business environments has transformed marketing from intuition-driven practices toward evidence-based decision-making [2]. The widespread adoption of digital platforms, e-commerce systems, social media networks, and connected technologies generates unprecedented volumes of consumer and market data. This includes consumer preferences, purchasing behaviors, engagement patterns, and market trends [3]. While this data creates significant opportunities, organizations face substantial challenges in extracting meaningful insights that support strategic and operational decisions. As a result, mathematical and computational frameworks have emerged as essential tools for converting raw data into actionable knowledge.
These frameworks provide systematic approaches for analyzing complex datasets, identifying patterns, predicting future outcomes, and optimizing business processes. Mathematical models enable organizations to represent market dynamics and consumer behavior through structured analytical formulations [4]. They decompose the factors that influence consumer actions, preferences, and choices. This provides marketers with insights that enhance decision-making, enable quick adaptation to market conditions, and inform strategy [1]. Computational methods facilitate the processing and interpretation of large-scale datasets that exceed the capabilities of traditional analytical approaches. These frameworks use probabilistic modeling to capture the interconnected, nuanced, and dynamic aspects of customer journeys [5]. With computational strategies, marketers can identify consumers’ short-term responsiveness to marketing campaigns and predict long-term behavioral patterns across different touchpoints [6,7]. Thus, mathematical and computational techniques contribute to a more rigorous understanding of marketing phenomena and support informed decision-making across a variety of organizational functions. This systematic review of the literature explores the major mathematical and computational analytical approaches employed in marketing, their practical applications, emerging technological developments, and the challenges associated with their implementation.
2. Materials and Methods
This study employed a systematic literature review to examine the role of mathematical and computational frameworks in contemporary marketing. The review followed the Preferred Reporting Items for Systematic Reviews and Meta-Analyses (PRISMA) 2020 guidelines to ensure a transparent, rigorous, and reproducible research process [8,9]. A systematic review was considered appropriate because it enables the structured identification, evaluation, and synthesis of existing scholarly knowledge on a specific topic (Xiao & Watson, 2019). This method enabled systematic screening and assessment of relevant studies, providing a comprehensive understanding of how mathematical modeling, computational techniques, and analytical tools contribute to marketing decision-making. The review process involved identifying relevant records, screening them against predefined criteria, assessing eligibility, and finally including studies for qualitative analysis.
The LRSB methodology was developed to provide a systematic and transparent approach to evidence synthesis, addressing several limitations commonly associated with conventional narrative reviews. Rather than relying on subjective study selection, it uses predefined procedures to identify, screen, and synthesize the available body of knowledge. By integrating both published and unpublished evidence, the methodology seeks to minimize selection bias while ensuring that the review process remains comprehensive, reproducible, and methodologically rigorous [10,11,12].
A defining characteristic of the LRSB methodology is the explicit documentation of every stage of the review process. This audit trail enables readers to understand how evidence was identified, assessed, and incorporated into the synthesis, thereby facilitating critical appraisal of the methodological quality of the included studies and the robustness of the conclusions drawn. Such transparency also enhances the reproducibility of the review and strengthens confidence in its findings.
Operationally, the LRSB framework is organized into three consecutive phases that encompass six interconnected steps, guiding the review from protocol design to evidence synthesis [10,11,12]. Each stage serves a specific methodological purpose and contributes to the review’s overall coherence. This sequential process promotes consistency in study selection, data extraction, and analysis, ultimately improving the reliability and scientific robustness of the evidence synthesis. The complete framework is presented in Table 1.
The identification and selection of the literature were conducted using the Scopus database, given its broad coverage of peer-reviewed journals and its widespread recognition as a reliable source of high-quality scholarly publications. Using a single database ensured methodological consistency throughout the review process and facilitated transparent, reproducible search procedures. Nevertheless, restricting the search to Scopus is an inherent limitation, as relevant studies indexed exclusively in other databases may not be captured. Future reviews could therefore strengthen the comprehensiveness of the evidence base by incorporating additional databases, such as Web of Science or Dimensions, and by extending the search to include peer-reviewed publications available up to June 2026.
The search strategy began with the development and implementation of a structured query in Scopus (Table 2). The retrieved records then underwent a sequential screening and selection process based on predefined eligibility criteria. This procedure enabled the exclusion of duplicate and non-relevant records, ensuring that the final corpus comprised studies directly aligned with the review’s objectives and meeting the required standards of scientific quality and methodological relevance.
The literature search was conducted in Scopus for its extensive coverage of peer-reviewed journals and conference proceedings across multiple disciplines. A staged search strategy was used to progressively refine the review’s scope. The initial search, using the keyword “Computational” in article titles, abstracts, and keywords, yielded 2,124,059 documents. Combining “Computational” and “Mathematical” reduced the results to 208,756 documents. Adding “Engineering” further narrowed the search to 17,158 documents. The search string was then expanded to include “Mathematical Engineering,” which produced the same number of records. Finally, the search was refined by incorporating the keyword “marketing,” resulting in 56 documents. These records were screened for relevance to the study objectives, and duplicate and non-relevant publications were excluded. The remaining articles were evaluated for their contribution to understanding the application of mathematical and computational frameworks in marketing, forming the final body of literature for analysis.
Explicit eligibility criteria were established to ensure that the review included studies directly relevant to the research objectives while maintaining a high level of methodological quality. Only peer-reviewed publications addressing smart cities and sustainable urban development were considered eligible for inclusion. Studies outside the review’s scope or lacking sufficient scientific rigor were excluded from the analysis.
Study selection was conducted in two consecutive stages. Initially, titles and abstracts were screened to assess their alignment with the predefined eligibility criteria. Publications considered potentially relevant were then subjected to a full-text review to determine their final suitability for inclusion. Applying these procedures consistently throughout the review ensured that the final corpus reflected the most relevant and methodologically robust evidence available on the topic.
Following the selection process, the evidence was analyzed using thematic analysis, consistent with the LRSB methodology proposed by [10,11,12]. This approach facilitates the systematic identification, comparison, and interpretation of recurring patterns across the literature, enabling findings from heterogeneous studies to be integrated into a coherent analytical framework. Rather than simply describing previous research, thematic analysis supports the development of higher-order themes that capture the principal concepts, relationships, and emerging directions within the field.
The resulting thematic structure provided the basis for synthesizing the existing evidence and identifying the dominant research streams in smart cities and sustainable urban development. Organizing the literature around these overarching themes also enabled the identification of areas of convergence, unresolved debates, and opportunities for future research, thereby strengthening both the analytical depth and the contribution of the review.
The analysis combined content and thematic analyses to synthesize the evidence retrieved through the LRSB protocol, following the methodological recommendations of [10,11,12]. The final dataset comprised 94 peer-reviewed publications indexed in the Scopus database. These studies were examined using complementary narrative and bibliometric techniques, enabling identification of the principal research themes, conceptual developments, and emerging patterns relevant to the research question (Figure 1).
To enhance methodological transparency and reproducibility, the review was conducted in accordance with the PRISMA 2020 reporting guidelines [8]. The PRISMA framework guided the identification, screening, eligibility assessment, and inclusion of studies, providing a clear record of the review process and facilitating replication of the search strategy. The corresponding flow diagram summarizes each stage of the study selection process and documents the rationale for excluding records throughout the review.
Data analysis combined content and thematic analyses, following the methodological principles of the LRSB framework [10,11,12]. The final sample comprised 56 peer-reviewed articles indexed in Scopus. Narrative synthesis and bibliometric analysis were used to examine the field’s intellectual structure, identify dominant research themes, and explore the conceptual relationships emerging from the literature.
4. Publication Distribution
A total of 56 sources published between 1992 and June 2026 were identified and analyzed. The annual distribution shows a gradual increase in scholarly interest over the decade. For example, by June 2026, 1 publication had been identified as a source (Figure 2). However, the trend began to rise in 2001, with a total of 1. The year 2005 had the highest number of publications (9). This growth likely reflects the intensification of research activity in response to the rapidly “Computational, Mathematical, Engineering, Mathematical Engineering, and Marketing”.
The publications were sorted as follows: Management Science (2); Engineer (2); Computers and Industrial Engineering (2); and the remaining publications had 1 document each.
Figure 3 displays the countries with the highest levels of scientific output in specific research areas, with a particular emphasis on USA, China, the UK, and Indonesia, which collectively boast the most significant number of publications.
Table 3 and Figure 3 present the ten most productive countries by scientific publication output. The distribution of research output highlights the geographical concentration of scholarly activity and identifies the national contexts that have made the strongest contributions to research on ethical branding and sustainability. These findings provide an overview of the field’s international landscape while revealing differences in the intensity of research activity across countries.
The observed distribution likely reflects broader structural factors, including national research priorities, funding mechanisms, institutional research capacity, and the growing policy emphasis on sustainability. Consequently, geographic publication patterns offer useful evidence of how the field has evolved and where its principal centers of knowledge production are located.
The publication pattern in the dataset aligns with Bradford’s Law, as scientific output is concentrated in a small number of journals. Figure 4 shows that the three most productive outlets together account for about 10% of the publications analyzed, indicating a well-defined core of journals that has substantially influenced the field’s development.
Such a distribution is characteristic of maturing research domains, in which a relatively small number of journals become the principal venues for disseminating new knowledge and fostering scholarly exchange. The prominence of these outlets has likely contributed to the consolidation of theoretical perspectives, the diffusion of methodological approaches, and the establishment of the research agenda that has shaped subsequent developments in ethical branding and sustainability.
As scholarly interest in this topic continues to grow, publication activity tends to cluster around a relatively small number of journals, which gradually emerge as the principal outlets in the field. These journals play a key role in shaping the development of the research area by helping consolidate knowledge, increase visibility, and provide a recognized space for emerging debates. Nevertheless, this concentration also raises concerns. When a small group of journals becomes dominant, the field may become more exposed to particular theoretical assumptions, methodological preferences, or editorial traditions, thereby narrowing the range of perspectives that receive attention. In this sense, while such dynamics can strengthen the topic’s academic legitimacy and support its institutional recognition, they may also constrain intellectual diversity and limit the plurality of approaches represented in the broader scientific debate [12].
Within this expanding body of literature, 13 journals stand out as particularly influential outlets, reflecting their central role in consolidating the field. Their contribution extends beyond publication volume, as they have helped shape conceptual debates, structure research agendas, and increase the visibility of this area within the academic community. By providing a recognized forum for scholarly dialogue, these journals enable researchers to revisit prior contributions, refine existing arguments, and advance new lines of inquiry. In doing so, they have supported the gradual development of a more coherent and cumulative knowledge base within the discipline.
The subject areas covered by the 56 scientific and/or academic documents were: Engineering (36); Computer Science (22); Business, Management and Accounting (11); Decision Sciences (7); Mathematics (6); Energy (4); Social Sciences (3); Materials Science (3); Physics and Astronomy (2); Chemistry (2); Chemical Engineering (2); Pharmacology, Toxicology and Pharmaceutics (1); Multidisciplinary (1); Environmental Science (1); Economics, Econometrics and Finance (1); Earth and Planetary Sciences (1); Biochemistry, Genetics and Molecular Biology (1).
The most quoted article was “Visualisation in architecture, engineering and con-struction (AEC)” by [13], with 222 quotes published in International Journal of Automation in Construction 2917 (SJR), the best quartile (Q1), and with H index (219). This paper will review the application of visualization in the process of design and construction and then present findings from three research projects that made use of some of these techniques at various stages of the process: for collaborative working during concept design stage, for design development and marketing in the house building sector, and for the modeling of design details during the construction stage.
In Figure 5, we can analyze the changes in citations for documents published through June 2026. The ≤2016-2026 period shows a positive net growth in citations, with an R2 of 28%, reaching 1,067.
The h-index indicates the scientific influence of a body of literature by combining publication output with citation performance. The dataset analyzed in this review achieved an h-index of 16, meaning that 16 publications each received at least 18 citations. This citation profile suggests that a substantial proportion of the literature has gained sustained recognition within the academic community, reflecting both the field’s maturity and the influence of its most frequently cited contributions.
Citations of all scientific and academic documents from the period ≤2016 to June 2026, with a total of 1,067citations; of the 56 documents, 20 were not cited. Using the main keywords “Computational, Mathematical, Engineering, Mathematical Engineering, and Marketing “ between 2016 and June 2026, the bibliometric analysis revealed key indicators of the evolution of the scientific and academic information landscape in the documents, as shown in Figure 5.
The analysis was conducted using VOSviewer software, which enabled the researchers to generate insights by focusing on the core search terms: “Computational, Mathematical, Engineering, Mathematical Engineering, and Marketing”.
The three-field plot shown in Figure 7 depicts the relationships among authors (AU), cited references (CR), and authors’ keywords (DE) within the literature on Ethical Brand Mapping for Sustainability. By simultaneously linking these three bibliometric dimensions, the analysis reveals the intellectual configuration of the field, identifying the authors who have shaped its development, the references that constitute its theoretical foundation, and the concepts that have emerged most prominently in the published literature.
Figure 6.
Network of all keywords.
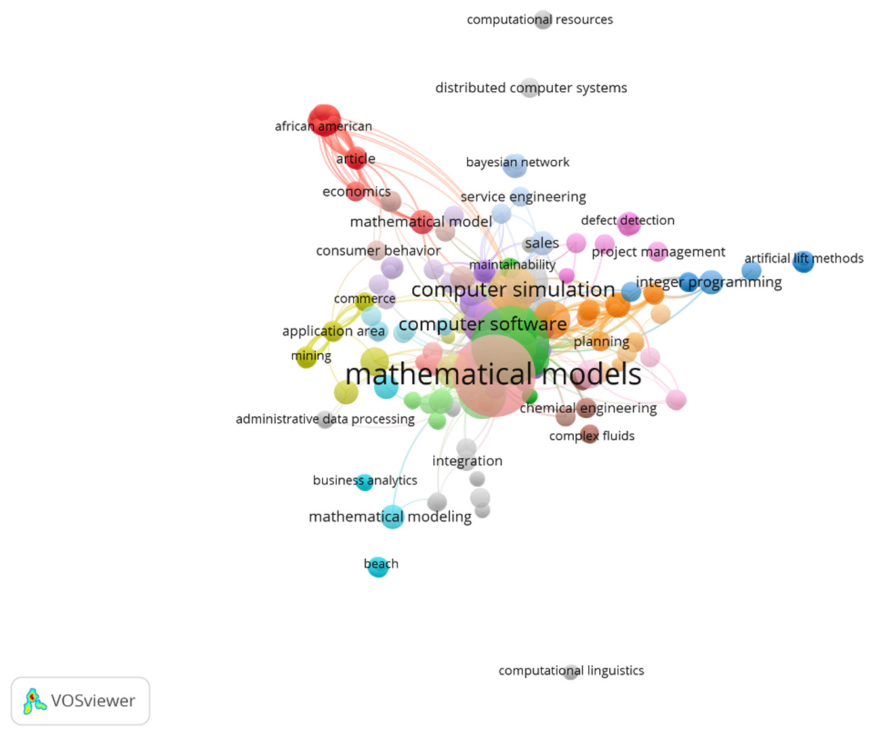
Figure 7.
Three fields plot analysis (AU=authors, CR=references, DE=authors keywords).
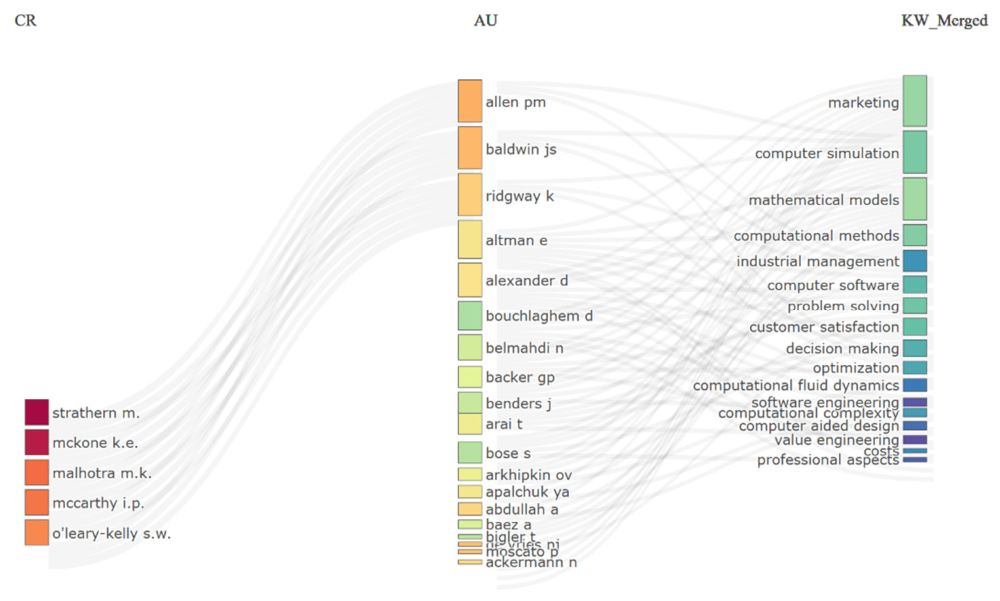
The resulting network provides insights into the convergence of research interests across influential scholars and illustrates how shared theoretical foundations have contributed to the evolution of the principal themes underpinning this area of research.
Figure 7 presents a Sankey diagram that illustrates the relationships among the principal themes emerging from the literature. The relative size of each node reflects the frequency with which a theme appears in the reviewed studies, while the connecting flows indicate the strength of associations between thematic categories. By visualizing these interdependencies, the diagram provides an overview of the field’s conceptual structure and highlights the thematic linkages that underpin its development [14].
As shown in Figure 7, the most frequently used keywords include “marketing” (incoming flow count: 12; outgoing flow count: 0), “computer simulation” (incoming flow count: 10; outgoing flow count: 0), and “mathematical models” (incoming flow count: 10; outgoing flow count: 0).
Figure 8 illustrates the conceptual relationships among the most frequently occurring author keywords and their connections to the most influential references in the dataset. The resulting network reveals the principal thematic clusters underpinning the literature and highlights the concepts that have shaped the field’s intellectual development. In addition to identifying well-established research streams, the analysis points to less-explored thematic areas that warrant further scholarly attention.
The thematic map shows how the main research topics are positioned by their relevance, measured by centrality, and by their development, measured by density (Figure 9). Overall, the figure suggests that the field is structured around a strong set of motor themes, while several other topics remain either peripheral or less consolidated.
The upper-right quadrant contains the motor themes, both highly developed and highly relevant to the field. In this area, topics such as marketing, mathematical models, computational methods, data mining, software engineering, object-oriented programming, electronic commerce, integer programming, strategic planning, and economics stand out. Their position indicates that these themes play a central role in the intellectual structure of the research area. In particular, the prominence of marketing suggests that the field is not only technically oriented but also strongly connected to managerial and market-based applications.
The presence of terms such as data mining, computational methods, and software engineering underscores the importance of analytical and technological approaches. These themes appear to support the development of more sophisticated decision-making tools, especially in contexts where large volumes of information must be processed and interpreted. At the same time, the connection with electronic commerce reinforces the practical relevance of digital environments and online business models.
The lower-left quadrant includes emerging or declining themes, such as mathematical modeling, quality assurance, and decision support systems. Their low centrality and density suggest that these topics are less integrated into the main research conversation. However, this does not necessarily mean they are irrelevant. Some may represent older lines of research that have lost visibility, while others may still be in an early stage of development and could become more important in future studies.
The upper-left quadrant, associated with niche themes, includes topics such as chemical engineering, process control, and simulation. These themes are relatively well developed internally but appear to have limited connections to the broader field. This suggests they may correspond to specialized research streams, important within particular technical domains but not yet strongly linked to the central debates of the field.
Near the center of the map, themes such as application area, mathematical tools, animation, computational geometry, and visualization occupy an intermediate position. These topics seem to serve as connecting elements between more technical and more applied research directions. Their location suggests they may contribute to the development of the field, although they are less dominant than the main motor themes.
In summary, the figure reveals a research field in which technological, analytical, and marketing-related themes are particularly influential. The strongest topics cluster in the motor themes quadrant, indicating that the area is driven by a combination of computational methods, modeling techniques, data analysis, and market-oriented applications. At the same time, the presence of emerging, niche, and intermediate themes suggests that the field remains dynamic, with opportunities for future research to connect specialized technical approaches with broader managerial and digital business concerns.
The thematic structure suggests that ethical brand mapping for sustainability has not yet reached a stage of conceptual maturity characterized by clearly established core themes. Although several research topics occupy a central position within the literature, stronger theoretical integration is still required to consolidate the field. Likewise, peripheral and more specialized themes remain weakly connected to the broader research landscape, indicating potential directions for future conceptual development.
Additional evidence is provided by the co-citation network in Figure 10. The observed pattern of co-citation links reflects an increasingly interconnected body of literature centered on a limited number of influential publications. This intellectual structure identifies the studies that have shaped the evolution of the field and reveals the theoretical foundations on which subsequent research has been built.
4. Theoretical Perspectives
The integration of mathematical modeling, optimization techniques, machine learning algorithms, simulation methods, and advanced analytics has expanded the capabilities of modern marketing systems. These approaches are applied across a wide range of marketing functions, including customer segmentation, demand forecasting, pricing optimization, advertising evaluation, and customer relationship management. Moreover, the emergence of artificial intelligence (AI) and intelligent decision-support systems has accelerated the development of more sophisticated analytical solutions that deliver real-time insights and recommendations. The following sections examine the key mathematical and computational frameworks used in marketing and their contributions to transforming data into effective business decisions.
4.1. Evolution of Data-Driven Marketing
The evolution of data-driven marketing has been shaped by rapid technological advances, greater digital connectivity, and the growing availability of consumer data. Traditional marketing often relied on intuition, experience, and limited market research. However, modern marketing increasingly depends on analytical methods that enable organizations to collect, process, and interpret vast amounts of information. This transformation has led to the development of sophisticated decision-making frameworks that support more accurate targeting, forecasting, and performance evaluation.
4.1.1. Growth of Digital Marketing
The rapid advancement of digital technologies in the early 2000s accelerated the transformation of marketing practices. As illustrated in Figure 11, the emergence of platforms such as Google, Google AdWords, Facebook, YouTube, Twitter, LinkedIn, and smartphone technologies changed how organizations engage with consumers and evaluate marketing performance [15]. These innovations shifted marketing from traditional one-way communication to interactive, personalized, and data-driven engagement. Unlike conventional channels, digital platforms generate continuous streams of consumer data that provide insights into preferences, behaviors, and purchasing patterns [16]. Marketers can monitor customer interactions across multiple touchpoints, including websites, advertisements, social media platforms, and e-commerce applications. This enables more precise targeting and performance measurement. Consequently, digital marketing has evolved into a highly analytical function that relies on computational tools and advanced data analysis to support strategic decision-making and enhance marketing effectiveness.
4.1.2. Big Data
Big data refers to large, diverse, and rapidly generated datasets produced by digital transactions, social media, customer interactions, mobile devices, and connected technologies. These datasets are characterized by their volume, velocity, variety, and complexity, making them difficult to analyze with conventional methods [17]. In marketing, big data provides valuable insights into consumer behavior, market trends, product performance, and competitive dynamics. Organizations increasingly use advanced analytical techniques, including machine learning, predictive modeling, and data mining, to uncover hidden patterns and derive meaningful insights from these extensive datasets [18]. The ability to analyze large-scale information enables marketers to make more informed decisions about customer targeting, pricing strategies, product development, and resource allocation [19]. Consequently, big data has become a critical asset that supports evidence-based decision-making and enhances organizational competitiveness.
4.1.3. Customer Data Ecosystems
The growing importance of customer information has led to the development of complex customer data ecosystems that integrate data from multiple sources into unified analytical environments. These ecosystems combine data from customer relationship management systems, social media platforms, online transactions, mobile applications, loyalty programs, and other digital channels [20]. Organizations consolidate data from various touchpoints to build a more comprehensive understanding of customer behaviors, preferences, and engagement patterns throughout the customer journey. Customer data ecosystems enable the creation of detailed customer profiles that support personalization, segmentation, and predictive analytics [21]. They also help organizations identify emerging trends and respond more effectively to changing market conditions. Integrating diverse data sources requires sophisticated computational infrastructures and analytical frameworks capable of managing large volumes of structured and unstructured information [20,22]. As customer interactions continue to expand across digital channels, the effective management of customer data ecosystems has become essential for achieving marketing effectiveness and maintaining competitive advantage.
4.1.4. Marketing as a Data-Intensive Discipline
The growing reliance on digital technologies and advanced analytics has transformed marketing into a highly data-intensive discipline. According to [17], contemporary marketing decisions are increasingly supported by quantitative evidence from customer data, market intelligence, and analytical models, rather than by managerial intuition alone. Organizations routinely employ mathematical and computational techniques to evaluate customer acquisition strategies, forecast demand, optimize pricing, assess campaign performance, and improve customer retention [1,3]. The growing complexity of modern markets has heightened the need for sophisticated decision-support systems capable of processing large datasets and generating timely insights. As a result, marketers are expected to possess both traditional marketing knowledge and analytical competencies in data interpretation, statistical analysis, and computational modeling [17]. This shift reflects the broader integration of data science principles into marketing practice, where organizational success increasingly depends on the ability to transform raw information into actionable knowledge that supports strategic and operational
4.2. Core Themes
The growing reliance on data-driven decision-making has heightened the importance of mathematical and computational frameworks in marketing. These approaches provide the analytical foundation for understanding consumer behavior, optimizing marketing activities, and informing strategic decisions. The literature identifies several core themes that show how advanced analytical methods transform marketing data into actionable insights and competitive advantage.
4.2.1. Theme 1: Mathematical Frameworks for Marketing Decision-Making
Mathematical frameworks provide a structured foundation for analyzing marketing problems and supporting evidence-based decision-making. These approaches represent complex market dynamics using quantitative models that enable organizations to forecast outcomes, evaluate alternatives, optimize resource allocation, and improve the effectiveness of strategic marketing decisions.
- Mathematical modeling
Mathematical modeling is one of the most widely used analytical approaches in marketing decision-making. It uses mathematical equations and quantitative relationships to represent complex marketing phenomena, including customer behavior, market demand, pricing dynamics, and advertising effectiveness [1,23]. Translating real-world marketing problems into structured mathematical frameworks helps organizations better understand relationships among variables, evaluate alternative strategies, and predict future outcomes. Mathematical models reduce uncertainty by providing objective, data-driven insights that support managerial decision-making [24]. They also enable marketers to simulate scenarios and assess the potential impact of strategic actions before implementation. [4] explains that as marketing environments become increasingly complex and data-rich, mathematical modeling is an essential tool for transforming raw information into actionable knowledge. Various models have been developed to address specific marketing challenges, including:
- a)
- Customer Lifetime Value (CLV) Model
The Customer Lifetime Value (CLV) is one of the most influential mathematical models in marketing because it enables organizations to estimate the long-term economic value generated by customers. Unlike traditional performance measures that focus on individual transactions, CLV adopts a relationship-oriented perspective by evaluating the cumulative value a customer contributes throughout their relationship with a firm [25]. This allows marketers to identify profitable customer segments, optimize acquisition and retention strategies, and allocate resources more effectively. As competition intensifies and customer acquisition costs rise, CLV has become an essential tool for guiding strategic marketing decisions and maximizing customer equity. [26] present the CLV formulation in Equations (1)–(3):
where a represents the acquisition rate, A denotes acquisition spending, m is the profit margin per transaction, R represents retention spending per customer, r is the customer retention rate, and d is the discount rate. This model estimates customer value by combining the returns generated from acquisition and retention activities [26]. The inclusion of retention and discount rates reflects the long-term nature of customer relationships and the time value of future revenues. By quantifying the financial impact of marketing investments, the CLV model supports data-driven decisions related to customer relationship management, promotional budgeting, and long-term profitability.
- b) Multinomial logit (MNL) model
The Multinomial Logit (MNL) model is a mathematical framework for analyzing consumer choice behavior and estimating demand in marketing. The model assumes that consumers select an option from a set of available alternatives based on the utility associated with each choice [27]. By quantifying the probability of selecting a particular product, the MNL model enables marketers to evaluate customer preferences, predict purchasing decisions, and estimate market demand across different product assortments. This capability makes the model particularly valuable for assortment planning, pricing strategies, product positioning, and market segmentation [28]. The MNL model has attracted significant attention in both academic research and industry practice because of its analytical simplicity and its ability to capture substitution effects among competing products. According to Abdallah and Vulcano (2020), customer choice probabilities under the MNL framework can be expressed as shown in Equation (4):
In this model, Pi (St, β) represents the probability that a customer selects product i from the assortment St, while βi denotes the preference weight or utility associated with product i. The term exp(βi) reflects the relative attractiveness of the product, and the denominator represents the combined attractiveness of all available alternatives within the choice set [27]. Consequently, products with higher utility values are more likely to be selected by consumers. The MNL model enables marketers to estimate customer preferences, evaluate substitution effects among competing products, and predict purchasing behavior under different assortment configurations [28]. The model quantifies consumer choice probabilities to provide valuable support for assortment planning, pricing decisions, market segmentation, revenue management, and demand forecasting. As a result, it remains one of the most widely applied mathematical frameworks for analyzing customer decision-making in modern marketing environments.
- 2.
- Optimization techniques
Optimization techniques are mathematical methods for identifying the best decision among feasible alternatives while satisfying predefined constraints. In marketing, these techniques support decision-making by determining how to allocate resources, budgets, and strategies to maximize desired outcomes such as customer value, sales, market share, or profitability [26]. Unlike mathematical models that primarily describe or predict market behavior, optimization methods focus on selecting the most effective course of action based on available information. The growing availability of customer and market data has heightened the importance of optimization in marketing, enabling organizations to evaluate multiple scenarios and improve decision quality in complex, dynamic environments [29,30]. Applications of optimization techniques in marketing include customer relationship management, promotional planning, pricing decisions, advertising budget allocation, and demand management. Examples of these models include:
- a)
- Stochastic dynamic programming model
Stochastic dynamic programming (SDP) is an advanced optimization technique that supports sequential decision-making under uncertainty. Unlike static optimization methods that evaluate decisions at a single point in time, SDP considers how current decisions influence future outcomes and adjusts strategies accordingly [31]. In marketing, this approach is particularly valuable for customer relationship management, retention planning, promotional targeting, and customer lifetime value optimization, where customer behavior evolves over time and future responses remain uncertain. [32] indicates that incorporating probabilistic transitions between customer states in SDP enables organizations to identify optimal actions that maximize long-term value rather than short-term gains. [26] applied this approach to customer lifetime value management by modeling customer transitions and promotional decisions as a dynamic optimization problem (Equation (5)).
In this model, vi(t) represents the expected value of a customer currently in state i at time t, ci(j) denotes the revenue generated from applying marketing action j, dj represents the cost of that action, α is the discount factor, and pik(j) denotes the probability that a customer transitions from state i to state k after action j is implemented. The model evaluates alternative marketing actions and selects the one that maximizes the expected discounted value of future customer interactions. Accounting for uncertainty, customer behavior dynamics, and long-term profitability in SDP provides marketers with a powerful optimization framework for allocating resources, designing retention strategies, and maximizing customer lifetime value.
- b) Linear programming model
Linear programming (LP) is an optimization technique that supports decision-making in situations with limited resources and competing objectives. The model determines the optimal allocation of scarce resources by maximizing or minimizing a linear objective function subject to a set of constraints [33]. In marketing, LP provides a structured framework for addressing resource allocation problems such as advertising budget distribution, product mix selection, inventory management, salesforce allocation, promotional planning, and pricing decisions. The technique translates complex business problems into mathematical expressions, enabling organizations to identify solutions that maximize profitability, revenue, customer value, or operational efficiency while adhering to budgetary and operational constraints [33]. [34] presents the linear programming process as follows in Equations (6)–(8):
Maximize
Minimize
Subject to:
where P and C represent the objective functions to be maximized or minimized, X1, X2,…, Xn denote the decision variables, a1,a2,…,an represent the contribution of each decision variable to the objective function, bij denotes the coefficients associated with the constraints, and d1,d2,…, dm represent the available resource limits. The non-negativity condition ensures that decision variables assume feasible values within the solution space [34]. Linear programming evaluates numerous possible combinations of decision variables and identifies the solution that optimizes the objective while satisfying all constraints [33]. Consequently, the model serves as a valuable optimization framework for marketing applications involving budget allocation, promotional planning, product portfolio decisions, and resource management under operational constraints.
4.2.2. Theme 2: Computational Frameworks for Marketing Intelligence
Computational frameworks are essential for transforming large volumes of marketing data into actionable intelligence. Unlike traditional mathematical models, these frameworks harness computational power to process complex datasets, uncover hidden patterns, and generate predictive insights [35,36]. Using techniques such as machine learning, simulation, and data analytics, organizations can better understand customer behavior, forecast market trends, and support data-driven decision-making in increasingly dynamic marketing environments.
- Machine learning
Machine learning enables organizations to extract insights, identify patterns, and make predictions from large, complex datasets. It is a subset of artificial intelligence that uses algorithms that learn from historical data and improve their performance over time without requiring explicit programming for every decision [21,37]. The rapid growth of digital platforms, e-commerce systems, mobile technologies, and social media has generated vast amounts of customer data. This has created opportunities for organizations to leverage machine learning for more informed, data-driven decision-making [38]. Unlike traditional analytical approaches that often rely on predefined assumptions, machine learning can identify hidden patterns and relationships within high-dimensional datasets.
Machine learning in marketing supports a wide range of applications, including customer segmentation, churn prediction, recommendation systems, demand forecasting, sentiment analysis, and personalized advertising. Techniques such as logistic regression, decision trees, random forests, neural networks, and clustering algorithms enable marketers to analyze customer behavior, predict future actions, and tailor marketing strategies to specific audience segments [39,40,41]. These capabilities help organizations improve customer experiences, enhance campaign effectiveness, and optimize resource allocation [42]. Furthermore, [43] indicate that advances in computational power and cloud-based technologies have increased the accessibility and scalability of machine learning applications, enabling real-time analysis and decision support. Consequently, machine learning has become a critical component of marketing intelligence, transforming raw data into actionable insights that strengthen organizational competitiveness and strategic decision-making.
- 2.
- Simulation methods
Simulation methods enable marketers to model, analyze, and evaluate complex market environments by recreating real-world processes in a virtual setting. Researchers and practitioners use them to examine how marketing systems behave under varying conditions and levels of uncertainty [44]. These techniques are especially valuable when direct experimentation is costly, risky, or impractical. Marketers can simulate customer interactions, market responses, and organizational decisions to observe potential outcomes before implementing strategies in real-world settings [45]. Simulation models can incorporate numerous variables simultaneously, making them well-suited for analyzing dynamic and interconnected marketing systems [46]. As marketing environments grow more complex due to globalization, digitalization, and rapidly changing consumer preferences, simulation methods provide organizations with a flexible framework for exploring alternative scenarios and understanding the potential consequences of strategic decisions.
Simulation methods in marketing intelligence support a wide range of applications, including demand forecasting, customer behavior analysis, pricing optimization, promotional planning, market penetration assessment, and new product evaluation. Common approaches include Monte Carlo simulation, which evaluates uncertainty through repeated random sampling. Agent-based modeling examines interactions among individual consumers and market participants [47]. System dynamics modeling analyzes feedback mechanisms and long-term behavioral patterns within marketing systems. These techniques enable decision-makers to compare strategic alternatives, identify potential risks, and assess how outcomes vary with changing assumptions [48,49]. Furthermore, simulation methods facilitate scenario analysis by allowing organizations to test marketing strategies under different economic, competitive, and consumer conditions (Alexander, 2003). Consequently, simulation techniques have become an important component of computational marketing intelligence, enhancing forecasting accuracy, supporting strategic planning, and improving the quality of data-driven marketing decisions.
- 3.
- Data analytics
Organizations today operate in increasingly data-rich environments, with continuous streams of information generated by digital platforms, social media networks, e-commerce transactions, mobile applications, and customer relationship management systems. The rapid expansion of these data sources has created both opportunities and challenges for marketers seeking to understand consumer behavior and market dynamics [20]. As the volume, velocity, and variety of marketing data continue to grow, traditional data processing and decision-making methods have become insufficient for extracting meaningful insights. This evolution has driven the rise of data analytics as a critical computational framework for managing and interpreting large, complex datasets [50]. According to [51], data analytics integrates statistical techniques, computational tools, and data management processes that enable organizations to identify patterns, uncover relationships, and derive actionable insights from vast amounts of information. As a result, marketing decisions are increasingly guided by evidence-based analysis rather than intuition or experience alone.
Data analytics has transformed how organizations monitor performance, understand customers, and develop marketing strategies. Through descriptive analytics, firms can evaluate historical performance and identify patterns in consumer behavior, while predictive analytics supports forecasting of future trends, customer preferences, and purchasing decisions [6,52]. More advanced approaches, such as prescriptive analytics, help decision-makers determine optimal actions based on predicted outcomes and available resources. Additionally, data analytics facilitates customer profiling, market segmentation, campaign performance evaluation, sentiment analysis, and customer journey mapping [53]. Integrating real-time data further enables organizations to respond quickly to changing market conditions and customer needs. Converting raw data into actionable knowledge enhances organizational agility, improves marketing effectiveness, and provides a significant competitive advantage in increasingly data-driven business environments.
4.2.3. Theme 3: Marketing Applications of Computational Decision Support
The value of mathematical and computational frameworks ultimately lies in their practical application to marketing activities. Organizations use these approaches across a wide range of functions to better understand customers, anticipate market developments, evaluate performance, and support strategic decision-making. As marketing becomes increasingly customer-centric and dynamic, analytical tools are now embedded in core marketing processes. They influence how firms segment markets, engage consumers, forecast demand, set prices, assess advertising effectiveness, and manage customer relationships.
- Market segmentation
Organizations use analytical and computational techniques to divide heterogeneous markets into smaller groups of consumers who share similar characteristics, preferences, behaviors, or purchasing patterns. Traditional segmentation approaches often relied on demographic variables alone [40]. Advances in computational methods have enabled marketers to incorporate behavioral, psychographic, geographic, and transactional data into segmentation. Techniques such as clustering algorithms, machine learning, and predictive analytics allow firms to identify meaningful customer segments with greater precision and accuracy [54,55]. This deeper understanding of customer differences enables organizations to develop targeted marketing strategies, personalize communications, and allocate resources more effectively [56]. Businesses that deliver products, services, and promotional messages aligned with each segment’s specific needs can improve customer satisfaction, strengthen market positioning, and enhance overall marketing performance.
- 2.
- Customer engagement
Customer engagement has become a strategic priority for organizations seeking to build stronger relationships with consumers in increasingly competitive markets. Computational decision-support systems enable firms to monitor, analyze, and respond to customer interactions across digital and physical touchpoints [57]. As a result, organizations can leverage customer data from websites, social media platforms, mobile applications, and customer service channels [20]. This data yields insights into consumer preferences, interests, and behavioral patterns. These insights inform the development of personalized content, targeted promotions, and interactive experiences that encourage greater customer participation and brand involvement [57,58]. Furthermore, real-time analytics enables firms to adapt engagement strategies to evolving customer behaviors and feedback [59]. Through more personalized and responsive interactions, organizations can increase customer satisfaction, foster loyalty, and strengthen long-term relationships. As a result, computational approaches have become essential tools for enhancing customer engagement and improving the overall customer experience.
- 3.
- Demand forecasting
Demand forecasting is a critical marketing function that supports strategic planning, inventory management, production scheduling, and resource allocation. Computational decision-support techniques enable organizations to analyze historical sales data, market conditions, seasonal patterns, and consumer behavior to forecast future demand more accurately [60]. Advanced forecasting models can process large volumes of structured and unstructured data to identify trends and relationships that may not be apparent with traditional methods [24,61]. More reliable demand estimates reduce uncertainty and enable better-informed decisions about product availability, supply chain operations, and marketing investments [62]. Accurate demand forecasting also helps businesses anticipate shifts in consumer preferences and market conditions, enabling proactive responses to emerging opportunities and risks. Therefore, computational forecasting tools improve operational efficiency, reduce costs, and enhance organizational performance in dynamic market environments.
- 4.
- Pricing strategies
Pricing decisions are fundamental to organizational profitability, market competitiveness, and customer perceptions of value. Computational decision-support systems help marketers develop pricing strategies by analyzing customer behavior, market demand, competitor actions, and cost structures [63]. Using advanced analytics, organizations can assess how customers respond to different pricing scenarios and pinpoint price points that maximize revenue or profitability. Dynamic pricing systems further enable firms to adjust prices in real time in response to fluctuations in demand, inventory levels, and market conditions [53]. These capabilities help businesses respond more effectively to competitive pressures and shifting consumer preferences. In addition, computational approaches support price optimization by balancing organizational objectives with customer willingness to pay [64]. As a result, data-driven pricing strategies have become increasingly important for organizations seeking to enhance financial performance while maintaining customer satisfaction and market relevance.
- 5.
- Advertising performance
The growing complexity of modern advertising environments has heightened the need for accurate performance measurement and evaluation. Computational decision-support systems enable organizations to monitor advertising activities across multiple channels, including search engines, social media platforms, websites, and digital media networks [65,66]. Marketers can analyze metrics such as impressions, click-through rates, conversions, customer engagement, and return on investment, which helps them assess campaign effectiveness and identify areas for improvement [67]. Advanced analytical techniques further support attribution analysis by determining the contribution of different marketing channels to customer acquisition and conversion outcomes [68]. These insights enable organizations to optimize advertising budgets, improve campaign targeting, and refine communication strategies. Through continuous performance monitoring and evaluation, computational tools help ensure that advertising investments generate measurable business value and contribute to broader marketing objectives.
- 6.
- Customer Relationship Management
Customer relationship management (CRM) is one of the most important applications of computational decision support because it focuses on developing and maintaining long-term customer relationships. Modern CRM systems integrate data from multiple customer interactions, providing organizations with a comprehensive view of customer behaviors, preferences, and purchasing histories [69]. Analytical and computational techniques enable firms to identify high-value customers, predict customer churn, assess lifetime value, and recommend personalized marketing actions. These insights support more effective customer acquisition, retention, and loyalty-building strategies [70]. Moreover, CRM systems enable personalized communication by delivering relevant products, services, and promotional messages to individual customers [71]. Computationally supported CRM initiatives strengthen customer relationships and improve customer experiences, contributing to higher customer satisfaction, increased loyalty, and sustained organizational growth.
5. Emerging Trends and Future Directions
The continued evolution of digital technologies is creating new opportunities to enhance marketing intelligence and decision-making capabilities. Emerging innovations are expanding the scope of analytical and computational applications, enabling organizations to process information more efficiently, generate deeper insights, and respond more effectively to changing market conditions. Advancing technological capabilities are leading to new forms of intelligent, automated, and real-time decision support, which are expected to play an increasingly important role in shaping the future of marketing.
Artificial Intelligence
Artificial intelligence (AI) is significantly enhancing organizations’ ability to analyze data, automate processes, and support complex decision-making. Advances in AI technologies have expanded the capabilities of marketing systems beyond traditional analytics [37,71]. AI enables the interpretation of structured and unstructured data from diverse sources, including social media, customer interactions, images, videos, and online reviews. AI-powered tools can identify patterns, generate predictions, and recommend actions with greater speed and accuracy than conventional approaches [60]. Applications such as conversational agents, recommendation engines, predictive customer analytics, and automated content generation are already reshaping marketing practices. As AI technologies continue to evolve, they are expected to drive greater personalization, operational efficiency, and strategic responsiveness. This makes AI a central component of future marketing intelligence and decision-support systems.
Intelligent Decision-Support Systems
Intelligent decision-support systems represent the convergence of advanced analytics, artificial intelligence, machine learning, and automated reasoning within a unified decision-making framework. These systems go beyond traditional decision-support tools by providing analytical insights, generating recommendations, evaluating alternatives, and supporting autonomous or semi-autonomous decision processes [6]. In marketing, intelligent decision-support systems can integrate information from multiple sources to assist managers with customer relationship management, demand forecasting, pricing optimization, campaign management, and resource allocation [27,32]. Continuous learning from new data and adaptation to changing market conditions enable these systems to improve the quality, consistency, and speed of marketing decisions [34]. Future developments are likely to further increase their sophistication by incorporating generative AI, explainable AI, and advanced predictive capabilities. This will enable organizations to make more proactive, personalized, and strategically informed marketing decisions.
6. Challenges and Limitations
Despite their significant contributions to marketing decision-making, mathematical and computational frameworks face several challenges and limitations. The effectiveness of these approaches depends heavily on data quality, since inaccurate, incomplete, or biased data can lead to unreliable predictions and suboptimal decisions [1]. In addition, the increasing complexity of advanced analytical models, particularly those based on machine learning and AI, often reduces interpretability, making it difficult for decision-makers to understand how outcomes are generated [72]. Computational complexity is another challenge because sophisticated models frequently require substantial processing power, specialized expertise, and significant technological resources for implementation and maintenance. Furthermore, the growing use of customer data has raised important ethical concerns related to privacy, data security, transparency, and algorithmic bias. Addressing these challenges is essential to ensuring that computational decision-support systems remain accurate, trustworthy, and aligned with organizational objectives and societal expectations.
7. Conclusions
The growing availability of digital data has fundamentally transformed marketing into a discipline driven by analysis, prediction, and evidence-based decision-making. As organizations navigate increasingly complex and competitive environments, mathematical and computational frameworks have become essential for extracting value from vast volumes of customer and market information. Mathematical models provide structured ways to represent consumer behavior, estimate customer value, evaluate market choices, and optimize resource allocation. Frameworks such as customer lifetime value models, multinomial logit models, stochastic dynamic programming, and linear programming demonstrate how quantitative approaches can support a wide range of strategic and operational marketing decisions. At the same time, the expansion of digital marketing, big data, and interconnected customer data ecosystems has intensified the need for computational approaches capable of processing information at unprecedented scale and speed. Machine learning, simulation methods, and data analytics have enhanced organizations’ ability to identify patterns, forecast outcomes, and generate insights that would be difficult to obtain through conventional analytical techniques. These mathematical and computational capabilities have strengthened the precision, efficiency, and adaptability of modern marketing practices.
The practical influence of these frameworks spans virtually every major marketing function, including market segmentation, customer engagement, demand forecasting, pricing, advertising evaluation, and customer relationship management. Their growing integration into organizational processes reflects the increasing importance of data-driven intelligence for understanding customer needs, anticipating market developments, and responding to changing business conditions. Emerging technologies such as AI, real-time analytics, and intelligent decision-support systems are further expanding marketing capabilities by enabling faster, more personalized, and increasingly automated decision-making. These advancements are expected to deepen the connection between analytical insights and strategic action, creating new opportunities for innovation and competitive advantage. However, the effectiveness of these approaches depends on the quality of underlying data, the transparency and interpretability of analytical models, the availability of computational resources, and the responsible management of ethical concerns related to privacy and algorithmic bias. The industry must address these challenges because marketing will continue to evolve within an increasingly digital and data-intensive field. Thus, mathematical and computational frameworks will remain central to transforming information into actionable knowledge and supporting more informed, agile, and strategically effective decision-making.
Author Contributions
Conceptualization, Rosário, A.T., Casaca, J.A., Cruz, R.; methodology, Rosário, A.T., Casaca, J.A., Cruz, R.; validation, Rosário, A.T., Casaca, J.A., Cruz, R.; formal analysis, Rosário, A.T., Casaca, J.A., Cruz, R.; investigation, Rosário, A.T., Casaca, J.A., Cruz, R.; resources, Rosário, A.T., Casaca, J.A., Cruz, R.; data curation, Rosário, A.T., Casaca, J.A., Cruz, R.; writing—original draft preparation, Rosário, A.T., Casaca, J.A., Cruz, R.; writing—review and editing, Rosário, A.T., Casaca, J.A., Cruz, R.; visualization, Rosário, A.T., Casaca, J.A., Cruz, R.; supervision, Rosário, A.T., Casaca, J.A., Cruz, R.; project administration, Rosário, A.T., Casaca, J.A., Cruz, R. All authors have read and agreed to the published version of the manuscript.
Funding
This research received no external funding.
Institutional Review Board Statement
Not applicable.
Informed Consent Statement
Not applicable.
Data Availability Statement
No new data were created.
Acknowledgments
We would like to express our gratitude to the editor and the referees. They offered extremely valuable suggestions or improvements. The first authors were supported by the GOVCOPP Research Unit of the Universidade de Aveiro, Instituto Politécnico de Setúbal, Escola Superior de Ciências Empresariais de Setúbal, and the second and third authors were supported by FCT – Fundação para a Ciência e a Tecnologia, I.P., under the project UID/00711/2025: Research Unit in Design and Communication - UNIDCOM/IADE. During the preparation of this manuscript/study, the author(s) used Grammarly (1.172.1.0, WebUI 2.16.6), for the purposes of a writing assistant. The authors have reviewed and edited the output and take full responsibility for the content of this publication.
Conflicts of Interest
The authors declare no conflicts of interest.
References
- Dawi, N.B.M.; Gupta, N.; Namazi, H. THE APPLICATION OF FRACTAL THEORY IN MARKETING: WHAT CAN WE DO? Fractals Located at Scopus. 2025, (7), 33. [Google Scholar] [CrossRef]
- Camilleri, M.A. The use of data-driven technologies for customer-centric marketing. Int. J. Big Data Manag 2020, 1(1), 50. [Google Scholar] [CrossRef]
- Johnson, D.S.; Muzellec, L.; Sihi, D.; Zahay, D. The marketing organization’s journey to become data-driven. J. Res. Interact. Mark. 2019, 13(2), 162–78. [Google Scholar] [CrossRef]
- Iyappan, K.; Kumar, S.; Kumar, P.; Parkash, R.; Dwivedi, V.K.; Mishra, M.K. Mathematical Models for Predicting Consumer Behavior in Dynamic Market Environments. J. Comput Anal. Appl. 2024, 33(8), 132–7. [Google Scholar]
- Sun, X. Enhancing Marketing Strategies Through Deep Learning: A Computational Approach. IEEE Access. 2025, 13, 162204–25. [Google Scholar] [CrossRef]
- Chinnaraju, A. Quantum Computing in Consumer Behavior: A Theoretical Framework for Market Prediction and Decision Analytics. Int. J. Adv. Res. Sci. Commun. Technol. 2025, 339–71. [Google Scholar] [CrossRef]
- Chang, C.L.; McAleer, M.; Wong, W.K. Big Data, Computational Science, Economics, Finance, Marketing, Management, and Psychology: Connections. J. Risk Financ Manag. 2018, 11(1), 15. [Google Scholar] [CrossRef]
- Page, M.J.; McKenzie, J.E.; Bossuyt, P.M.; Boutron, I.; Hoffmann, T.C.; Mulrow, C.D.; et al. The PRISMA 2020 statement: an updated guideline for reporting systematic reviews. BMJ 2021, n71. [Google Scholar] [CrossRef] [PubMed]
- Haddaway, N.R.; Page, M.J.; Pritchard, C.C.; McGuinness, L.A. PRISMA2020: An R package and Shiny app for producing PRISMA 2020-compliant flow diagrams, with interactivity for optimised digital transparency and Open Synthesis. Campbell Syst. Rev. 2022, 18(2), e1230. [Google Scholar] [CrossRef] [PubMed]
- Rosário, A.T.; Dias, J.C. The Role of Digital Marketing in Shaping Sustainable Consumption: Insights from a Systematic Literature Review. Sustainability 2025, 17(17), 7784. [Google Scholar] [CrossRef]
- Rosário, A.T.; Boechat, A.C. How Automated Machine Learning Can Improve Business. Appl. Sci. 2024, 14(19), 8749. [Google Scholar] [CrossRef]
- Travassos Rosário, A.; Carrizo Moreira, A.; Macedo, P. Competitive dynamics of strategic groups in the Portuguese banking industry. Cuad. Gest. 2021, 21(2), 119–33. [Google Scholar] [CrossRef]
- Bouchlaghem, D.; Shang, H.; Whyte, J.; Ganah, A. Visualisation in architecture, engineering and construction (AEC). Autom. Constr. 2005, 14(3), 287–95. [Google Scholar] [CrossRef]
- Rosário, A.; Casaca, J.A. Relationship Marketing and Customer Retention - A Systematic Literature Review. Stud. Bus. Econ. 2023, 18(3), 44–66. [Google Scholar] [CrossRef]
- Dsouza, A.; Panakaje, N. A Study on the Evolution of Digital Marketing. Int. J. Case Stud. Bus. IT Educ. 2023, 7(1), 95–106. [Google Scholar] [CrossRef]
- Basimakopoulou, M.; Theologou, K.; Tzavaras, P. A Literature Review on Digital Marketing: The Evolution of a Revolution. J. Soc. Media Mark. 2022, 1(1), 30–40. [Google Scholar] [CrossRef]
- Alshura, M.S.; Zabadi, A.; Abughazaleh, M. Big Data in Marketing Arena. Big Opportunity, Big Challenge, and Research Trends: An Integrated View. Manag Econ. Rev. 2018, 3(1), 75–84. [Google Scholar] [CrossRef]
- Rejeb, A.; Rejeb, K.; Keogh, J.G. Potential of big data for marketing: A literature review. Manag Res. Pract. 2020, 12(3), 60–73. [Google Scholar]
- Amado, A.; Cortez, P.; Rita, P.; Moro, S. Research trends on Big Data in Marketing: A text mining and topic modeling based literature analysis. Eur. Res. Manag Bus. Econ. 2018, 24(1), 1–7. [Google Scholar] [CrossRef]
- De Vries, N.J.; Carlson, J.; Moscato, P. A data-driven approach to reverse engineering customer engagement models: Towards functional constructs. PLoS ONE Located at Scopus. 2014, (7), 9. [Google Scholar] [CrossRef] [PubMed]
- Tsukasa, I.; Takenaka, T.; Motomura, Y. Customer behavior prediction system by large scale data fusion in a retail service. Trans Jpn Soc Artif Intell. Located at Scopus. 2011, 26(6), 670–81. [Google Scholar] [CrossRef]
- Yoshimitsu, Y.; Hara, T.; Arai, T.; Shimomura, Y. An evaluation method for service in the point of customers’ view. In Int. Conf. Services Systems Services Manage. Proc. ICSSSM [Internet].; Located at: Scopus, IEEE Computer Society, 2006; pp. 7–12. Available online: https://www.scopus.com/pages/publications/40649107850?origin=resultslist.
- Sivaji, A.; Abdullah, A.; Downe, A.G. Usability testing methodology: Effectiveness of heuristic evaluation in E-government website development; Proc. - AMS: Asia Model. Symp. - Asia Int. Conf. Math. Model. Comput. Simul. [Internet]; Scopus, 2011; pp. 68–72. Available online: https://www.scopus.com/pages/publications/80052309760?origin=resultslist.
- Gercekovich, D.A.; Gorbachevskaya, E.Y.; Shilnikova, I.S.; Arkhipkin, O.V.; Apalchuk, Y.A. Economic Assessment of Investment for the Production of Construction Products, Using the Mathematical Model. In Adv. Intell. Sys. Comput. [Internet].; Silhavy, R., Silhavy, P., Prokopova, Z., Eds.; Springer Science and Business Media Deutschland GmbH; Scopus, 2020; pp. 65–71. Available online: https://www.scopus.com/pages/publications/85098179106?origin=resultslist.
- Ali, N.; Shabn, O.S. Customer lifetime value (CLV) insights for strategic marketing success and its impact on organizational financial performance. Cogent Bus. Manag. 2024, 11(1), 2361321. [Google Scholar] [CrossRef]
- Ching, W.K.; Ng, M.K.; Wong, K.K.; Altman, E. Customer lifetime value: Stochastic optimization approach. J Oper Res Soc. Located at Scopus. 2004, 55(8), 860–8. [Google Scholar] [CrossRef]
- Abdallah, T.; Vulcano, G. Demand Estimation Under the Multinomial Logit Model from Sales Transaction Data. Manuf. Serv. Oper. Manag 2021, 23(5), 1196–216. [Google Scholar] [CrossRef]
- Thakur, P.; Mehta, P.S.; Guleria, A.; Divyanshu; Singh, P.; Sharma, P. Farmers’ Choice for Output Marketing Channels of Cauliflower in Himachal Pradesh, India: A Multinomial Logit Model Analysis. Econ. Aff. 2022, 67(5), 731–8. [Google Scholar] [CrossRef]
- Hoffmann, A.; Astutik, W.; Rasmussen, F.; Whitson, C.H. Diluent injection optimization for a heavy oil field. In Soc. Pet. Eng. - SPE Heavy Oil Conf. Exhib. [Internet].; Society of Petroleum Engineers: Located at: Scopus, 2016; Available online: https://www.scopus.com/pages/publications/85088206271?origin=resultslist.
- Zhou, M. Fuzzy logic and optimization models for implementing QFD. Comput Ind Eng. Located at Scopus. 1998, 35(1–2), 237–40. [Google Scholar] [CrossRef]
- Lawrence, T.; Hosein, P. Stochastic dynamic programming heuristics for influence maximization–revenue optimization. Int. J. Data Sci. Anal. 2019, 8(1), 1–14. [Google Scholar] [CrossRef]
- Sütçü, M.; Yıldız, B. A stochastic programming framework for pricing and market share optimization in retail systems. Decis. Anal. J. 2025, 16, 100604. [Google Scholar] [CrossRef]
- Chanda, R.; Pabalkar, V.; Gupta, S. A Study on Application of Linear Programming on Product Mix for Profit Maximization and Cost Optimization. Indian J. Sci. Technol. 2022, 15(22), 1067–74. [Google Scholar] [CrossRef]
- Anne, A.M.; Abiodun, O.S.; Olalekan, A.K. Application of linear programming to firm’s decision making: hypothetical example. Br. J. Manag Mark. Stud. 2020, 3(4), 94–105. [Google Scholar]
- Lin, X.; Zhou, X.; Liu, C. Efficient computation of a proximity matching in spatial databases. Data Knowl Eng. Located at Scopus. 2000, 33(1), 85–102. [Google Scholar] [CrossRef]
- Mentzas, G.; Papageorgiou, G. Computational parallels between office systems and production management systems [Internet]; Publ by Elsevier Science Publishers B.V.; IFIP Transactions B: Computer Applications in Technology; Scopus, 1993; Available online: https://www.scopus.com/pages/publications/0027725975?origin=resultslist.
- Brei, V.A. Machine Learning in Marketing: Overview, Learning Strategies, Applications, and Future Developments. Found. Trends Mark. 2020, 14(3), 173–236. [Google Scholar] [CrossRef]
- Zheng, X. A Scalable Digital Marketing Framework Based on Distributed Computing and Automated Machine Learning. In 2025 2nd International Conference on Intelligent Computing and Robotics (ICICR) [Internet]; IEEE: Dalian, China, 2025; pp. 1116–21. Available online: https://ieeexplore.ieee.org/document/11173036/.
- Dhanani, J.; Mehta, R.; Rana, D.; Tidke, B. Sentiment Analysis using Novel Distributed Word Embedding for Movie Reviews. In Int. Conf. Adv. Comput., ICoAC [Internet].; Institute of Electrical and Electronics Engineers Inc.; Scopus, 2018; pp. 138–45. Available online: https://www.scopus.com/pages/publications/85078071865?origin=resultslist.
- Frudakis, T.N. DNAPrint Genomics, Inc.: Better drugs for segmented markets. Pharmacogenomics Located at Scopus. 2008, 9(2), 247–51. [Google Scholar] [CrossRef] [PubMed]
- Hsu, T.H.; Chiang, L.T.L. A linguistic strategy model combined with genetic algorithms for promotion mix choice. In IEEE Int Conf Fuzzy Syst [Internet]; Institute of Electrical and Electronics Engineers Inc.; Scopus, 2006; pp. 845–50. Available online: https://www.scopus.com/pages/publications/34250708374?origin=resultslist.
- Liu, Y.; Guan, X.; Lai, F.; Zhou, D. Study on deregulated power market under energy supply companies changing bid strategy. In Dianli Xitong ZidonghuaAutomation Electr Power Syst [Internet]; Scopus, 2000; Volume 24, 7, pp. 7–10,15. Available online: https://www.scopus.com/pages/publications/0033877001?origin=resultslist.
- Ahmad, S.; Museera, S. The Strategic Influence of Cloud Computing on Contemporary Marketing and Management Practices. J. Eng. Comput Intell. Rev. 2024, 2(2), 21–30. [Google Scholar]
- Alexander, D. Simulation from the inside. Aerosp. Eng. [Internet] 2003, 23(11), 11–3. Available online: https://www.scopus.com/pages/publications/3042850307?origin=resultslist. [CrossRef] [PubMed]
- Belmahdi, N.; Nadif, A. Integrated model and simulation of the production system. In IEEE Symp Emerging Technol Fact Autom [Internet]; IEEE: Scopus, 1995; pp. 499–507. Available online: https://www.scopus.com/pages/publications/0029531356?origin=resultslist.
- Rasmussen, H. Computer simulation western [Report] [Internet]. Publ by AECL; 1992. p. 49–51. (Atomic Energy of Canada Limited, AECL (Report)). Report 00670367 (ISSN). Located at: Scopus. Available online: https://www.scopus.com/pages/publications/0026936605?origin=resultslist.
- Liu, X.; Yang, J.; Tang, B. A new agent-based artificial stock market with short-term dynamics. In Int Conf Wirel Commun Networking Mob Comput [Internet]; IEEE Computer Society; Scopus, 2007; pp. 4089–92. Available online: https://www.scopus.com/pages/publications/38049071214?origin=resultslist.
- Marks, R.E. Validating Simulation Models: A General Framework and Four Applied Examples. Comput Econ. 2007, 30(3), 265–90. [Google Scholar] [CrossRef]
- Mestat, P.; Humbert, P. System of tests for checking the programming of constitutive laws in finite element software. In Bull Lab Ponts Chaussees [Internet]; Scopus, 2001; Volume (230), pp. 23–38. Available online: https://www.scopus.com/pages/publications/14344271338?origin=resultslist.
- Elbertsen, L.; Benders, J.; Nijssen, E. ERP use: Exclusive or complemented? Ind Manag Data Syst. Located at Scopus. 2006, 106(6), 811–24. [Google Scholar] [CrossRef]
- Ducange, P.; Pecori, R.; Mezzina, P. A glimpse on big data analytics in the framework of marketing strategies. Soft Comput 2018, 22(1), 325–42. [Google Scholar] [CrossRef]
- Moscato, P.; de Vries, N.J. Business and Consumer Analytics: New Ideas. Bus. and Consumer Analytics: New Ideas [Internet]. Springer International Publishing; 2019. 1 p. (Business and Consumer Analytics: New Ideas). Located at: Scopus. Available online: https://www.scopus.com/pages/publications/85150111639?origin=resultslist.
- Ding, M.; Eliashberg, J.; Huber, J.; Saini, R. Emotional bidders - An analytical and experimental examination of consumers’ behavior in a priceline-like reverse auction. Manag Sci. Located at Scopus. 2005, 51(3), 352–64. [Google Scholar] [CrossRef]
- Talaat, F.M.; Aljadani, A.; Alharthi, B.; Farsi, M.A.; Badawy, M.; Elhosseini, M. A Mathematical Model for Customer Segmentation Leveraging Deep Learning, Explainable AI, and RFM Analysis in Targeted Marketing. Mathematics 2023, 11(18), 3930. [Google Scholar] [CrossRef]
- Kumar, J.; Petrov, V. Engineering approach to model and compute electric power markets settlements. Proc. IASTED INt. Conf. Energy and Powers Syst. [Internet]., Located at: Scopus, 2006; pp. 24–9. Available online: https://www.scopus.com/pages/publications/33847238799?origin=resultslist.
- Yang, B.; Luo, R.; Jin, J.; Zhu, H. Lightweight Auto-bidding based on Traffic Prediction in Live Advertising. Proc. ACM SIGKDD Int. Conf. Knowl. Discov. Data Min. [Internet]. Association for Computing Machinery, 2025; Scopus; pp. 5139–49. Available online: https://www.scopus.com/pages/publications/105014316755?origin=resultslist.
- Baldwin, J.S.; Allen, P.M.; Ridgway, K. An evolutionary complex systems decision-support tool for the management of operations. Int J Oper Prod Manag. Located at Scopus. 2010, 30(7), 700–20. [Google Scholar] [CrossRef]
- Heinrichs, J.H.; Lim, J.S. Model for organizational knowledge creation and strategic use of information. J Am Soc Inf Sci Technol. Located at Scopus. 2005, 56(6), 620–9. [Google Scholar] [CrossRef]
- Bose, S.; Pekny, J.F. A model predictive framework for planning and scheduling problems: A case study of consumer goods supply chain. In Comput. Chem. Eng. [Internet].; Elsevier Science Ltd.: Located at: Scopus, 2000; pp. 329–35. Available online: https://www.scopus.com/pages/publications/0034661221?origin=resultslist.
- Singhal, K.; Singh, J.N.; Sharma, V. Enabling Autonomous Digital Marketing: A Machine Learning Approach for Consumer Demand Forecasting. In 2024 IEEE International Conference on Computing, Power and Communication Technologies (IC2PCT) [Internet]; IEEE: Greater Noida, India, 2024; pp. 1903–8. Available online: https://ieeexplore.ieee.org/document/10486327/.
- Hurtubise, S.; Olivier, C.; Gharbi, A. Planning tools for managing the supply chain. In Comput Ind Eng [Internet]; Elsevier Ltd.: Located at: Scopus, 2004; pp. 763–79. Available online: https://www.scopus.com/pages/publications/3242686112?origin=resultslist.
- Sheikh, A.; Rinvee, T.M.; Sheikh, MdS. A hybrid machine learning framework for supply chain demand forecasting: Integrating historical data and market intelligence. 2025. [Google Scholar] [CrossRef] [PubMed]
- Sturts, C.S.; Griffis, F.H. Addressing pricing: Value bidding for engineers and consultants. J Constr Eng Manag. Located at Scopus. 2005, 131(6), 621–30. [Google Scholar] [CrossRef]
- Damodaran, P.; Wilhelm, W.E. Branch-and-price approach for prescribing profitable feature upgrades. Int J Prod Res. Located at Scopus. 2005, 43(21), 4539–58. [Google Scholar] [CrossRef]
- Yun, J.T.; Segijn, C.M.; Pearson, S.; Malthouse, E.C.; Konstan, J.A.; Shankar, V. Challenges and Future Directions of Computational Advertising Measurement Systems. J. Advert. 2020, 49(4), 446–58. [Google Scholar] [CrossRef]
- Huh, J.; Malthouse, E.C. Advancing Computational Advertising: Conceptualization of the Field and Future Directions. J. Advert. 2020, 49(4), 367–76. [Google Scholar] [CrossRef]
- Kuhfeld, W.F.; Tobias, R.D. Large factorial designs for product engineering and marketing research applications. Technometrics Located at Scopus. 2005, 47(2), 132–41. [Google Scholar] [CrossRef]
- Zhang, Q.; Yin, G.G.; Boukas, E.K. Optimal control of a marketing-production system. IEEE Trans Autom Control. Located at Scopus. 2001, 46(3), 416–27. [Google Scholar] [CrossRef]
- Ozay, D.; Jahanbakth, M.; Wang, S. Exploring the Intersection of Big Data and AI With CRM Through Descriptive, Network, and Contextual Methods. IEEE Access. 2025, 13, 57223–40. [Google Scholar] [CrossRef]
- Ganesh, C.N.; Rani, M.S.; Pradeep, S.; Dahiya, R.; Gupta, A.; Veeraiah, V. Optimizing Customer Relationship Management (CRM) Systems Using Advanced Machine Learning Algorithms. In 2025 Seventh International Conference on Computational Intelligence andCommunication Technologies (CCICT) [Internet]; IEEE: Sonepat, India, 2025 [cited 2026 Jul 1; pp. 215–20. Available online: https://ieeexplore.ieee.org/document/11088057/.
- Ledro, C.; Nosella, A.; Vinelli, A. Artificial intelligence in customer relationship management: literature review and future research directions. J. Bus. Ind. Mark. 2022, 37(13), 48–63. [Google Scholar] [CrossRef]
- Charpentier, J.C.; McKenna, T.F. Managing complex systems: Some trends for the future of chemical and process engineering. Chem Eng Sci. Located at Scopus. 2004, 59(8–9), 1617–40. [Google Scholar] [CrossRef]
Figure 1.
PRISMA 2020 flow diagram of the literature search and screening process, from [8].
Figure 1.
PRISMA 2020 flow diagram of the literature search and screening process, from [8].
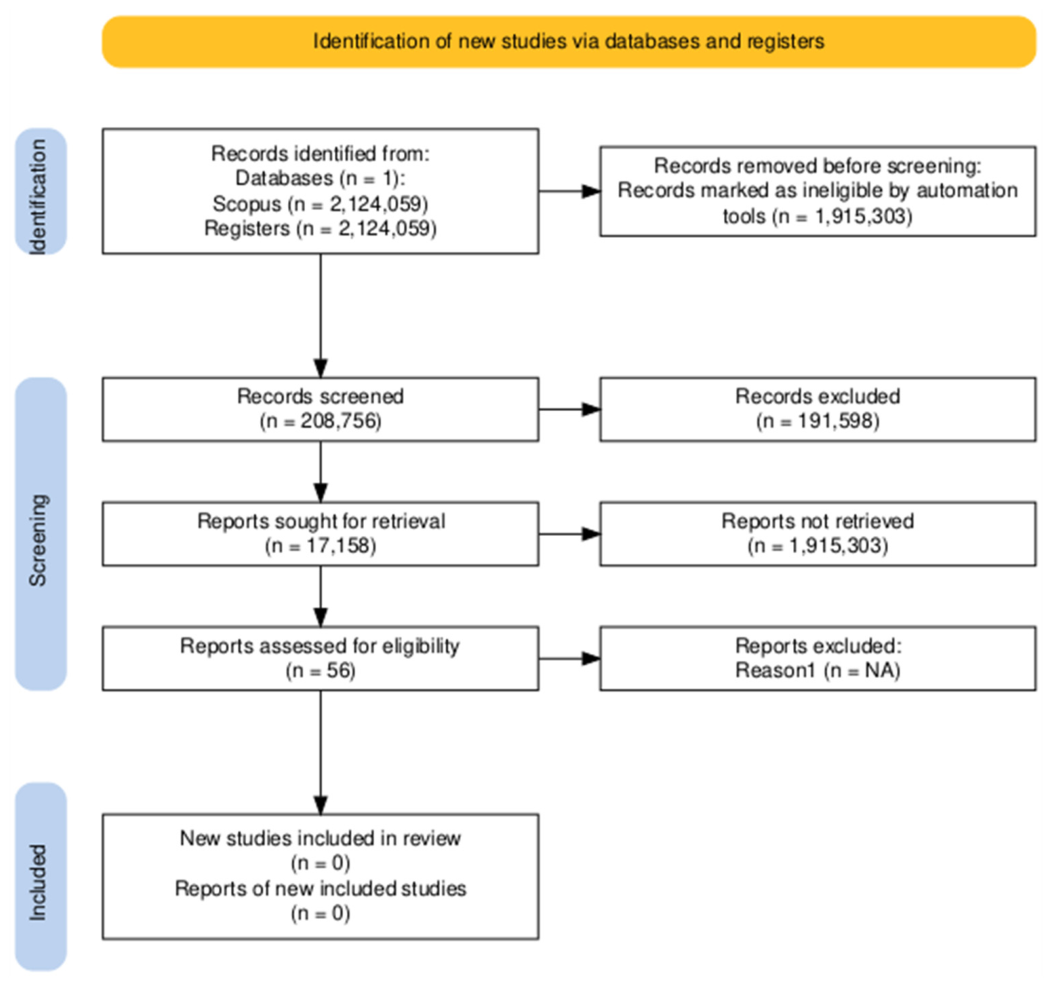
Figure 2.
Documents by year.
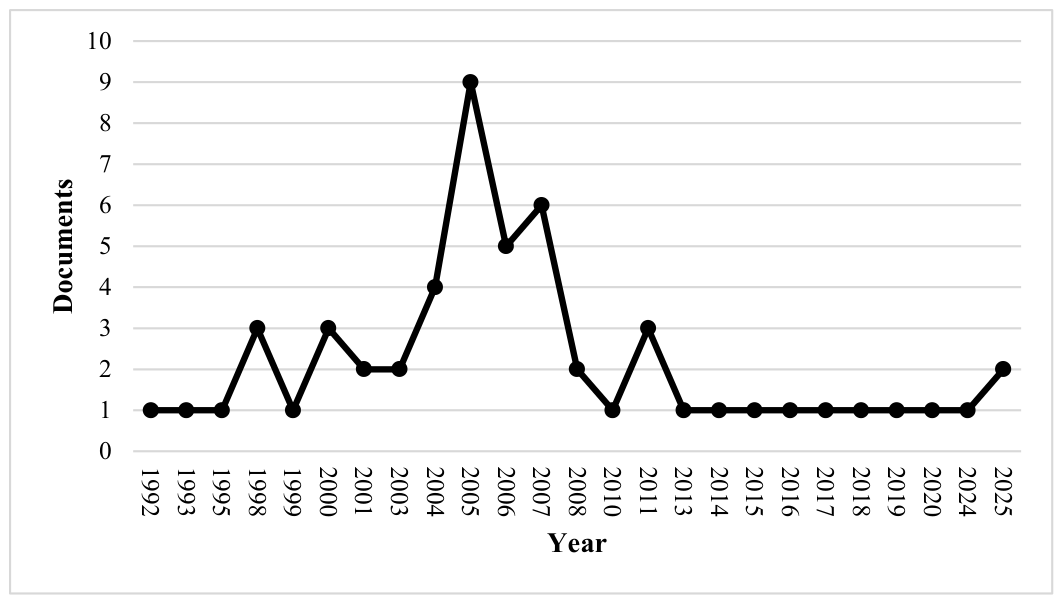
Figure 3.
Scientific production by country.
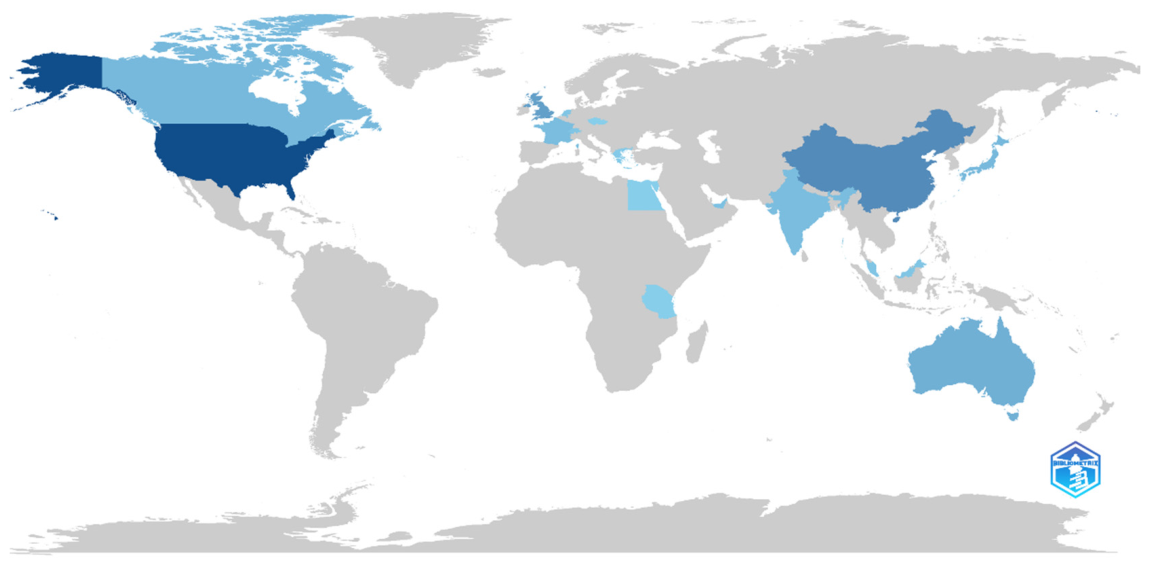
Figure 4.
Core sources by Bradford’s law (1992–2026).
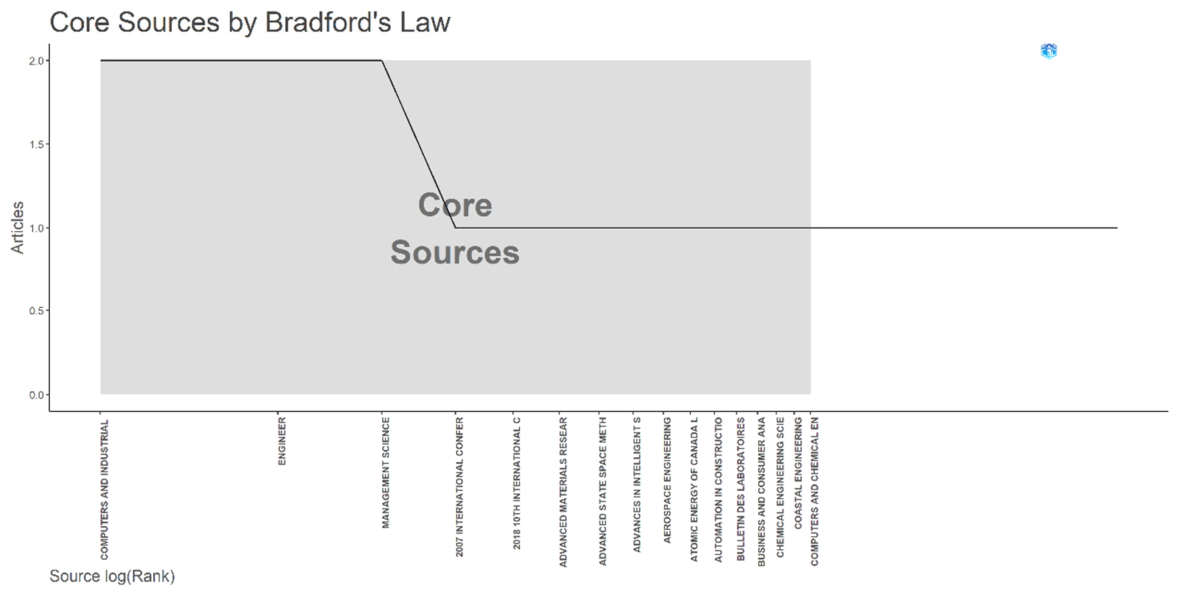
Figure 5.
Evolution of citations between ≤2016 and 2026.
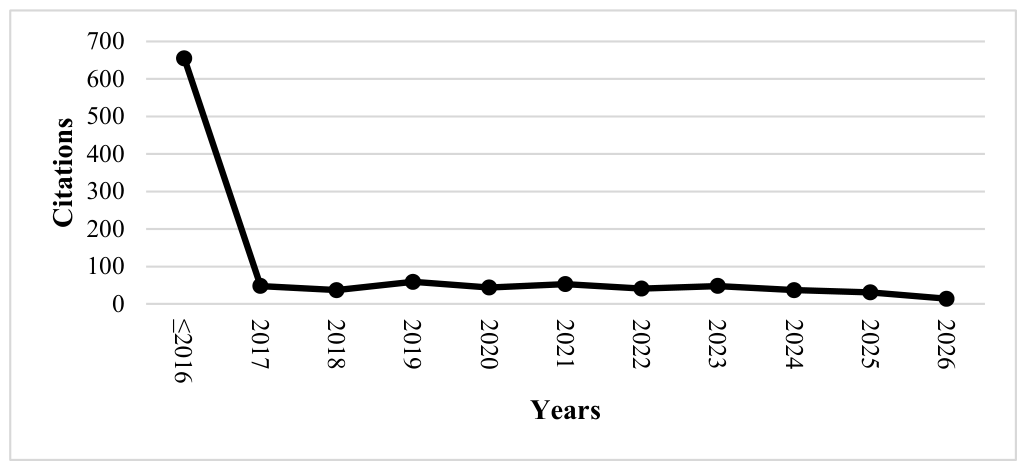
Figure 8.
Network of linked keywords.
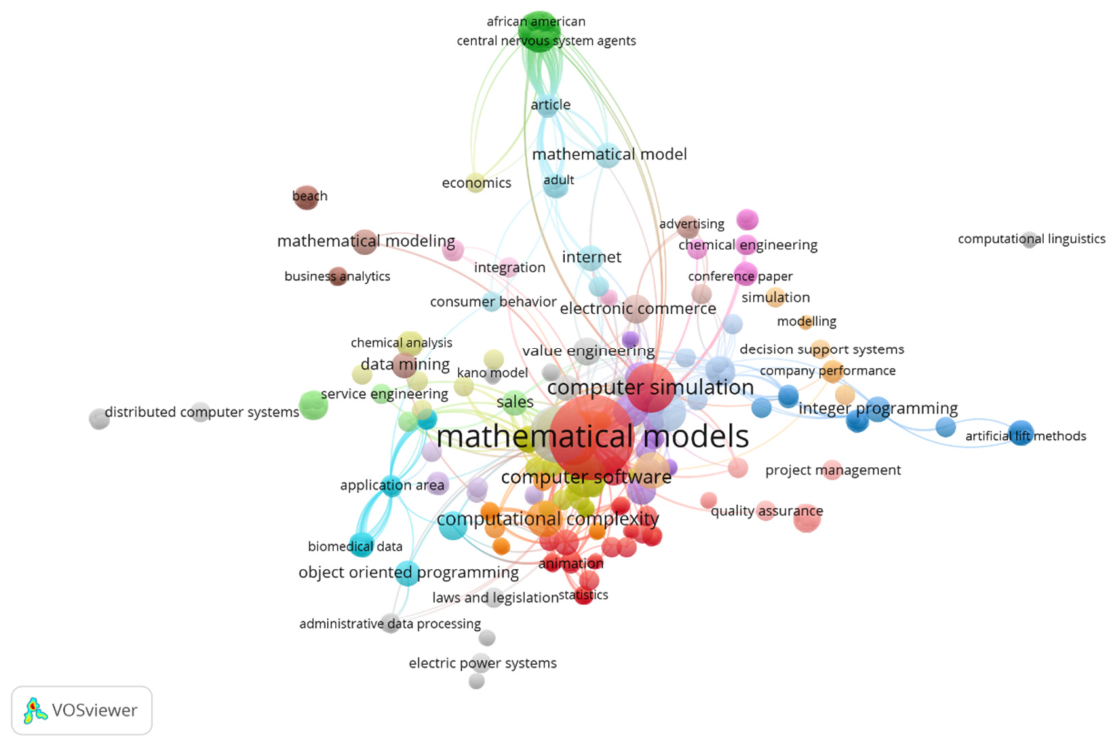
Figure 9.
Thematic map analysis.
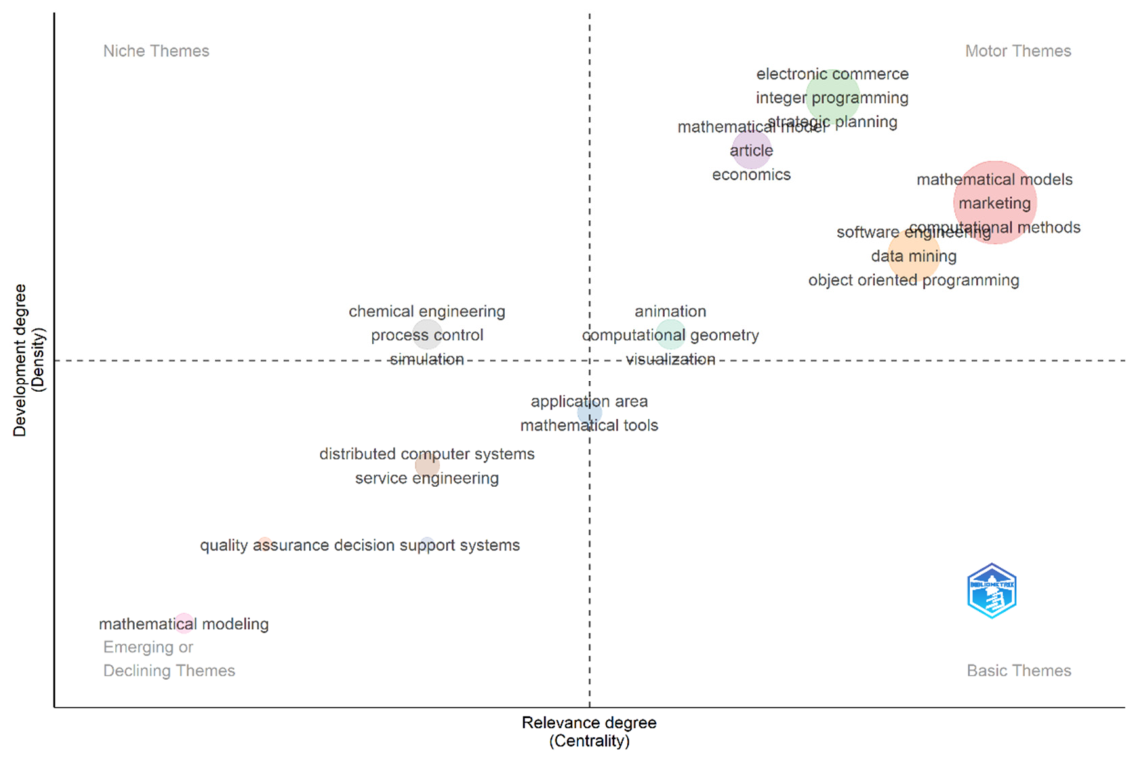
Figure 10.
Network of co-citation.
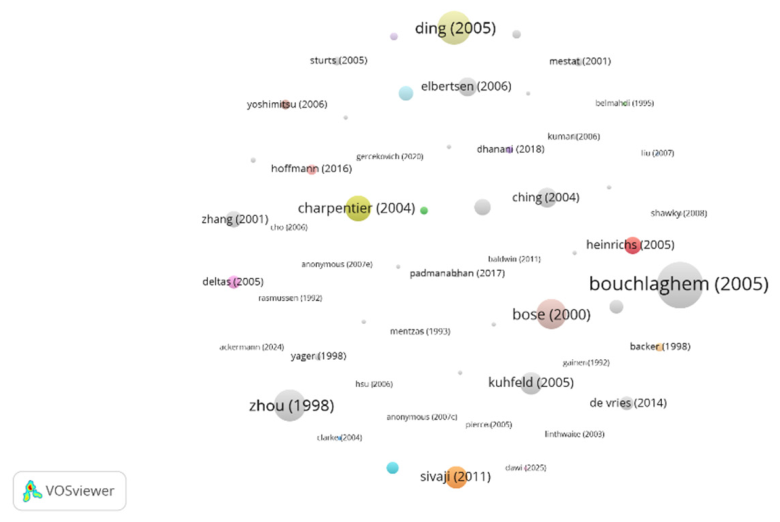
Figure 11.
The evolution of digital marketing from 1971 to 2010 [15].
Figure 11.
The evolution of digital marketing from 1971 to 2010 [15].
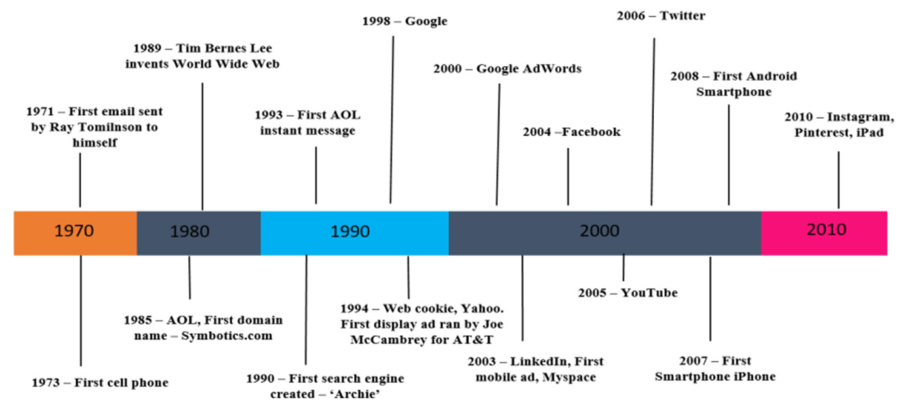

Table 1.
Process of systematic LRSB.
| Fase | Step | Description |
| Exploration | Step 2 | searching for appropriate literature |
| Step 3 | critical appraisal of the selected studies | |
| Step 4 | data synthesis from individual sources | |
| Interpretation | Step 5 | reporting findings and recommendations |
| Communication | Step 6 | Presentation of the LRSB report |
Table 2.
Screening methodology.
| Scopus Database | Screening | Publications |
| Initial Query | Keywords: Computational | 2,124,059 |
| First Screening | Keywords: Computational, Mathematical | 208,756 |
| Second Screening | Keywords: Computational, Mathematical, Engineering | 17,158 |
| Third Screening | Keywords: Computational, Mathematical, Engineering, Mathematical Engineering | |
| Fourth Screening | Keywords: Computational, Mathematical, Engineering, Mathematical Engineering, Marketing | 56 |
| Eligibility criteria | Keywords: Computational, Mathematical, Engineering, Mathematical Engineering, Marketing Published until June 2026 |
Table 3.
Top 10 countries by number of publications.
| Country | Number of Publications |
| USA | 33 |
| China | 17 |
| UK | 12 |
| Australia | 8 |
| Canada | 6 |
| Japan | 6 |
| France | 5 |
| India | 5 |
| United Arab Emirates | 4 |
| Malaysia | 3 |
Source: own elaboration.
Disclaimer/Publisher’s Note: The statements, opinions and data contained in all publications are solely those of the individual author(s) and contributor(s) and not of MDPI and/or the editor(s). MDPI and/or the editor(s) disclaim responsibility for any injury to people or property resulting from any ideas, methods, instructions or products referred to in the content. |
© 2026 by the authors. Licensee MDPI, Basel, Switzerland. This article is an open access article distributed under the terms and conditions of the Creative Commons Attribution (CC BY) license (http://creativecommons.org/licenses/by/4.0/).
Copyright: This open access article is published under a Creative Commons CC BY 4.0 license, which permit the free download, distribution, and reuse, provided that the author and preprint are cited in any reuse.


