

Submitted:
07 July 2026
Posted:
08 July 2026
You are already at the latest version
Abstract
Shale oil reservoirs are inherently tight and are currently developed mainly by natural energy depletion through horizontal wells with volumetric fracturing. However, the production characteristics during the post-fracturing process remain unclear, and the contributions of various energy sources have not been quantified, leading to a lack of targeted measures for maintaining stable production in horizontal wells. In this study, we combined microscopic visualization experiments with nuclear magnetic resonance (NMR) to characterize oil production in shale oil reservoirs across different development stages and to determine the contribution of each energy source to the overall recovery factor. Using reservoir engineering methods, we further evaluated the contributions of various energy sources in Xi-233 and Z-183 blocks. The results show that during the post-fracture shut-in (PFSI) stage, imbibition mobilizes oil from pores of all sizes, whereas the subsequent displacement phase primarily targets oil in meso and macropores. The PFSI not only enhances oil recovery factor but also improves oil-water flow during later production. The total recovery factor contributed by the shut-in phase, elastic energy of the fracturing fluid, elastic energy of the reservoir fluid, and solution gas drive is approximately 10%, with individual contributions of 7.40%, 6.67%, 66.74%, and 19.19%, respectively. Among these, the elastic energy of the reservoir fluid is the dominant contributor to the total recovery factor. These findings provide a theoretical foundation for optimizing production strategies in shale oil wells, support the efficient development of shale oil in Longdong area, and offer valuable insights for the development of shale oil resources across the world.
Keywords:
Ordos Basin
; Longdong area
; shale oil
; horizontal wells
; oil production characteristics
; development policy
1. Introduction
Continental shale oil reservoir in China is classified into three types: interbedded, mixed, and pure shale types [1], based on reservoir characteristics. The Chang-7 shale oil reservoir in the Ordos Basin represents an unconventional resource with coexisting source and reservoir rocks, characterized by abundant resources [2,3,4,5] and primarily developing interbedded and pure shale types. The interbedded shale oil reservoir mainly consists of continental clastic sediments with poor physical properties and complex pore-throat structures [6,7,8]. The reservoir porosity ranges from 4.0% to 12.9%, with an average of 7.4%; permeability ranges from 0.01 to 1.55 mD, averaging 0.1 mD. After over a decade of research and pilot testing, a large-scale development demonstration area, exemplified by the Longdong area in the Ordos Basin, has been established since 2018. By the end of 2025, over 1000 horizontal wells had been brought into production, with well spacing of 300-500 m and an average horizontal section length of approximately 1650 m. In 2025, shale oil production from this area accounted for half of PetroChina’s total shale oil output, achieving excellent implementation results.
Shale oil development aims for rapid investment recovery. The primary development model for such reservoirs in Ordos basin involves natural energy development and pressure-depletion production following large-scale volume fracturing. The production characteristics include high initial production rate, rapid decline, and generally low recovery factors (5%-7%) [6], yielding favorable economic results under high oil prices but being unsustainable under lower oil prices. To achieve large-scale and effective development of Chang-7 shale oil under low oil prices, efforts should focus not only on sweet spot selection, well pattern optimization, engineering technology improvement but also on optimizing the production policy to maintain a longer period of high production rate. This requires quantifying the contribution of various energy sources to production during the development of shale oil and managing a rational and smooth conversion of these energies. Based on production performance, shale oil development can be artificially divided into three stages: post-fracturing shut-in, flowback, and normal production [7]. Therefore, the production system should be optimized for each stage: optimizing the shut-in duration after fracturing to fully utilize the stored energy from fracturing fluid while minimizing formation damage; determining the reasonable flowback intensity during the flowback stage to directly slow proppant flowback and fracture closure; optimizing the liquid production intensity during the normal production stage to efficiently utilize reservoir energy in order to reduce the release of elastic energy of the injected fracturing fluid and to reduce the initial decline rate of horizontal wells[8]. If the production rate during the normal production period is too high, solution gas drive appears earlier, leading to a earlier two-phase flow and a steeper production decline. Therefore, optimizing the production rates depends on the rational release of three types of elastic energy: injected fluid, the formation and reservoir fluids, and solution gas[9,10,11,12]. Addressing these issues and needs, this study quantitatively determines the contribution rates of various energies to horizontal well production under natural energy development through laboratory experiments and reservoir engineering calculations. It clarifies the rational production policy for large-scale volume-fractured horizontal shale oil wells under natural energy development, guiding field practices to enhance initial well production and ultimate recovery, and providing a valuable reference for optimizing development strategies for similar shale oil reservoirs.
2. Materials and Methods
We designed two groups of experiments. One is to evaluate the PFSI effectiveness and the other is to evaluate oil production characteristics during different development stages.
2.1. Evaluation of PFSI Effectiveness
2.1.1. Experimental Samples
For the shut-in effectiveness study, six rock samples with similar physical properties were selected. Their basic physical parameters are shown in Table 1. Porosity of the selected samples ranges from 10.764% to 11.270%, and permeability ranges from 0.074 to 0.248 mD. Water used in the experiment was a 55,000 ppm MnCl₂ solution with a viscosity of 1 mPa·s. The experimental oil was a simulated oil prepared by mixing kerosene and white oil in a ratio of 1:9 , with a viscosity of 1.25 mPa·s at room temperature
For the evaluation of oil flow characteristics in the reservoir during the shut-in stage, the experimental oil was degassed crude oil from the formation with a viscosity of 1.5 mPa·s. The properties and parameters of the samples are shown in Table 2.
2.1.2. Experimental Procedure
The experimental setup is illustrated in Figure 1 and mainly comprises a high-pressure displacement pump (1), two intermediate containers (for experimental water and simulated oil)(2), a confining pressure pump(3), a core holder(4), and a fluid collector(6). NMR T₂ spectra (5) were acquired using a low-field NMR sample analyzer (MesoMR23-060H-1) operating at a magnetic field strength of 0.5 T and a hydrogen proton resonance frequency of 21.3 MHz. Spontaneous imbibition experiments were performed using an Amott imbibition bottle with a minimum scale graduation of 0.02 mL.
The experiments were conducted at room temperature (20°C) following these steps:
- The samples were placed in a vacuum saturator and saturated with simulated water (MnCl₂ solution) at 20 MPa for more than 48 hours to ensure a complete saturation of all pore spaces.
- The fully water-saturated sample was then placed in the core holder and displaced with simulated oil to establish irreducible water saturation. After that, the sample was immersed in the experimental oil and aged at formation temperature for at least 10 days to restore the original wettability, followed by the measurement of the NMR T₂ spectrum using the NMR core analysis unit.
- Water flooding experiments were performed on samples X233-9, X286-11, and B117-8. Each sample was placed in the core holder and displaced with experimental water at a constant injection pressure of 1.8 MPa and a confining pressure of 3.8 MPa, and until residual oil saturation was reached. The NMR T₂ spectrum was then measured using the NMR analyzer under the same parameters.
4. Spontaneous imbibition experiments were conducted on samples X233-10, X286-10, and B117-9. First, each sample was placed in an Amott imbibition bottle for spontaneous water imbibition. The volume of oil displaced and the imbibition time were recorded. When no further oil displacement was observed over a continuous 24-hour period, the sample was removed, and its NMR T₂ spectrum was measured. The sample was then moved to the core holder and water-flooded to residual oil saturation. Finally, the NMR T₂ spectrum was measured again using the NMR core analysis unit.
For the shut-in stage (Step 1), the core was sealed on three sides with a seal, leaving one face open, and the outlet end of the holder was closed with a plug. The NMR device was then activated, and the displacement pump was set to constant pressure mode. Water was injected into the core holder at 6 MPa. After the system pressure reached equilibrium, the injection pump and the valve at the top of the intermediate container were closed, and the pressurized imbibition experiment was initiated. During the experiment, NMR T₂ spectra, inlet pressure, and imbibition time were recorded in real time, and images were taken before, during, and after the experiment.
2.2. Evaluation of Oil Production Characteristics During different Development Stages
2.2.1. Experimental Samples
The experimental setup is shown in Figure 1. The rock samples were taken from the Chang-7 shale oil reservoir in the Xi-233 block of the Longdong area, Ordos Basin. Core parameters are listed in Table 3. The experimental water was heavy water (D₂O). The experimental oil comprised degassed crude oil and recombined live oil from the formation under reservoir conditions (pressure 15.9 MPa, temperature 60°C, gas-oil ratio stable at 90-110 m³/m³).
2.2.2. Experimental Procedure
1. Core samples were cleaned, dried, and their basic physical properties were measured.
2. Formation water was prepared according to the formation salinity, followed by vacuum degassing to remove dissolved gases that could interfere with the results.
3. Samples were vacuumed and were saturated with formation water for over 48 hours. Each saturated sample was then placed in the high-temperature, high-pressure core holder. Oil was injected at an appropriate flow pressure until no further water was produced downstream, thereby establishing irreducible water saturation and initial oil saturation.
4. The core holder was heated using a heating jacket until the system reached the formation temperature (60°C). The downstream valve was closed, and the displacement pump was set to constant pressure mode. Simulated oil was injected into the core holder until the system pressure reached the original formation pressure of 15.9 MPa, at which point pressure equilibrium was achieved. The confining pressure was maintained at 19 MPa throughout the experiment.
5. The pump was stopped, and the system was stabilized for a sufficient time for pressure distribution within the core to equilibrate, reaching the initial reservoir state. The elastic depletion experiment was then initiated. The downstream back pressure was regulated by a back-pressure pump, and the depletion experiment was conducted at the preset back pressure. During the depletion process, the upstream pressure at the outlet end and the liquid production volume were measured and recorded as a function of time until no further oil was produced. NMR T₂ spectra were acquired in real-time during the depletion process, and imaging was performed before, after, and during the experiment.
6. Steps 3-5 were repeated with different samples and experimental conditions to analyze the influence of various factors on elastic recovery.
3. Results
3.1. Evaluation of PFSI Effectiveness
3.1.1. Data Analysis
Based on the pore throat distribution and classification method, the T₂ spectrum was categorized into three pore size ranges: 0–1 ms (micropores), 1–10 ms (mesopores), and >10 ms (macropores). Based on the definitions of waterflood displacement efficiency, oil mobilization degree, and remaining-oil distribution frequency, the following equation was derived from the calculation of NMR signal magnitudes:
NMR signal at irreducible water saturation:
NMR signal after water flooding or imbibition:
Oil displacement or imbibition efficiency:
Degree of oil mobilization:
Remaining oil saturation:
Where:
- Toi - initial oil content;
- m(T) - signal amplitude at various relaxation times under initial conditions;
- Tor - remaining oil content after water flooding;
- m(T)or - signal amplitude at various relaxation times after water flooding;
- m(ri)oi - signal amplitude for a given pore class under initial conditions;
- m(ri)ori - signal amplitude for a given pore class after water flooding;
- rmini - minimum pore radius for a given pore class, μm;
- rmaxi - maximum pore radius for a given pore class, μm.
3.1.2. Experimental Results
The changes in the T₂ spectra also reflect the variations in the oil phase within the core samples. Figure 2 and Figure 3 present the NMR T₂ spectra of the core samples during the combined imbibition and waterflood process as well as during waterflooding alone. It can be observed that under irreducible water saturation, the spectra exhibit a bimodal distribution with comparable amplitudes on both peaks, indicating that the crude oil was initially distributed relatively uniformly in both macropores and micropores. After imbibition, the NMR signal amplitude within the relaxation-time range of 0.01–1000 ms decreases significantly, suggesting that crude oil in pore throats of all sizes was mobilized during imbibition. During the subsequent waterflooding after imbibition, the signal amplitude within 1–1000 ms decreases substantially, indicating that this waterflood stage mainly mobilizes crude oil in meso-to-macro pores. After waterflooding alone, the signal amplitude within 1–600 ms is markedly reduced, implying that waterflooding alone also mobilizes crude oil in medium-to-large pores.
To further quantitatively characterize the overall oil recovery factor and the production degree from each pore-throat size range during the combined process and waterflooding alone, we calculated the recovery factors and the production degree in each pore-throat category for each process (Table 4). From Table 4, it can be seen that the imbibition oil recovery factor ranges from 3.7% to 5.74%, and the subsequent waterflood recovery factor ranges from 28.2% to 29.37%, with imbibition contributing approximately 10% to the total recovery. Moreover, the residual oil content in all pore-throat categories after the combined process is lower than that after waterflooding alone. Particularly in micropores, the residual oil saturation after the combined process ranges from 4.66% to 24.69% with an average of 14.08%, which is significantly lower than that after waterflooding alone (12.53%–29.03%, average 19.56%). This indicates that, compared with waterflooding alone, the displacement after imbibition achieves a better oil mobilization effect, and the role of imbibition is not only to mobilize crude oil but also to facilitate the subsequent waterflood displacement.
3.2. Oil Mobilization Characteristics During the PFSI Stage
During fracturing and PFSI stage, pressure the near-wellbore is significantly higher than the formation pressure. Some of the fracturing fluid enters macro pores under the pressure difference (displacement), while the remainder moves from macro to micro pores through capillary forces (imbibition) [13]. As the pressure wave propagates and water saturation evolves, the displacement effect diminishes, and imbibition becomes relatively stronger [14].
3.2.1. Oil Production Mechanism
Figure 4 shows the NMR T₂ spectra of the rock sample at different imbibition stages. Under irreducible water saturation, the T₂ spectrum exhibits a bimodal distribution, where the peak signal amplitude for short relaxation times (T₂ between 0.01 and 5.94 ms) is smaller than that for long relaxation times (T₂ between 5.94 and 219 ms). This indicates strong heterogeneity in the distribution of crude oil within the reservoir rock, and that crude oil is primarily stored in meso and macro pores. After 16 hours of imbibition, the reduction in NMR signal amplitude is mainly observed in pores corresponding to T₂ > 10 ms. As imbibition time increases, crude oil in pores with relaxation times of less than 10 ms is gradually mobilized. Figure 5 shows how the recovery factor varies with imbibition time for different pores. In the early stage of imbibition, recovery from macropores increases rapidly, while recovery from micropore and mesopore increases more slowly. As imbibition time further increases, recovery factor from macro pores levels off, whereas recovery from micro and meso pores—especially micro pores—increases rapidly.
Based on the NMR T₂ spectra and the recovery variations across different pores, the oil production mechanism during the dynamic imbibition stage can be divided into two phases (Figure 6):
Phase I: Due to the pressure difference between the matrix and fractures, the fracturing fluid within the fractures is forced into the larger pores surrounding the fractures, resulting in a rapid increase in recovery from macropores.
Phase II: As the pressure difference between pores diminishes due to pressure propagation, the water retained in macropores and fractures spontaneously imbibes into micropores along grain surfaces under the combined effects of capillary force and wettability, leading to a sustained increase in recovery from micropores.
3.2.2. Recovery Factor and Contribution Rates of Different Processes
Table 5 present the contribution of different oil recovery mechanisms to the total recovery for two rock samples. Under low pressure conditions, imbibition accounts for up to 80% of the recovery factor, while displacement contributes relatively little. As the pressure increases, the contribution of imbibition gradually decreases, whereas that of displacement increases. This indicates that during the initial stage of fracturing and PFSI in shale oil reservoirs, the near- wellbore pressure is significantly higher than the formation pressure. At this stage, a portion of the fracturing fluid enters large pores due to the pressure difference, making displacement the dominant oil recovery mechanism. As the pressure wave propagates and the pressure difference between the fractures and the matrix diminishes, part of the fracturing fluid enters micropores via imbibition, mobilizing oil in the smaller pores. In this later stage, the contribution of imbibition gradually increases, while that of displacement weakens.
3.3. Oil Production Characteristics During the Production Stage
3.3.1. Elastic Depletion with Degassed Crude Oil
1. Pressure Variation Patterns
Figure 7 presents the pressure-variation curves of cores from the Chang-7 shale oil reservoir in the Xi-233 block of the Longdong area, Ordos Basin, under different downstream pressures and under the same downstream pressure, respectively. As shown in Figure 7a, under varying downstream pressures, as depletion time increases, the upstream pressure evolution can be divided into two stages: a rapid decline stage at the early depletion period, followed by a low-pressure stable-production stage at the middle-to-late depletion period. This behavior occurs because pressure propagation through the rock is a time-dependent process; it takes a certain period for the pressure signal to transmit from the downstream end to the upstream end of the core. During the early stage of depletion, the pressure differential between the upstream and downstream ends is large, corresponding to a greater pressure gradient, which results in faster pressure-wave propagation through the rock. Once the pressure wave reaches the upstream end, the upstream pressure gradually decreases. Consequently, the pressure differential across the core and the pressure decline rate both diminish, leading to a deceleration of pressure propagation and a slower reduction in pressure. A lower downstream production pressure corresponds to a larger initial pressure differential, a more pronounced pressure-change rate, a faster pressure-wave propagation, and thus a more rapid upstream pressure response.
As shown in Figure 7b, under the same downstream pressure, with increasing depletion time, the upstream pressure variation also exhibits two distinct stages: an initial rapid decline followed by a low-pressure stable-production phase in the middle-to-late depletion period. Furthermore, cores with higher permeability demonstrate a faster initial decline rate.
- 2.
- Variation Patterns of Production Degree
Figure 8 demonstrates that with increasing depletion time, both cumulative oil production and cumulative recovery factor increase gradually in a logarithmic manner. In the early stage, owing to the large pressure differential across the core, the instantaneous oil production rate is high, resulting in rapid increases in cumulative oil production and recovery factor. As depletion proceeds, the pressure differential decreases, the instantaneous production rate gradually declines, and the increments in cumulative production and recovery factor become smaller, eventually approaching plateau values. A lower downstream pressure yields higher ultimate cumulative oil production and cumulative recovery factor. Under the three different downstream-pressure conditions tested, the ultimate depletion recovery factors are 6.54%, 9.4%, and 12.1%, respectively (Figure 8a). Cumulative oil production is relatively high during the early depletion stage, whereas the contribution during the later stable-production stage is comparatively small(Figure 8b). This is primarily because, in the early depletion stage, the elastic energy released from the formation for oil displacement is abundant, leading to rapid increases in oil production and recovery factor [16]. However, as depletion continues, the formation pressure decreases, the elastic energy available for displacement diminishes, and the increases in cumulative oil production and recovery factor decelerate and eventually become negligible.
- 3.
- Crude Oil Mobilization Characteristics
In the initial state, the crude oil distribution exhibits a bimodal characteristic and is predominantly located in meso-to-macro pores, with only a minor proportion in micropores. During the early stage of depletion, the pressure in the core declines rapidly, and the NMR spectra show pronounced variations, which are mainly manifested in the meso-to-macro pores. As depletion time increases, the pressure decline rate gradually decreases, and the spectral variations become progressively smaller until they approach a steady state. After depletion, a significant amount of residual oil remains in the meso-to-macro pores (Figure 9).
3.3.2. Elastic Depletion with Recombined Live Crude Oil
1. Variation Patterns of Recovery
Figure 10 presents the recovery-factor variation curves of cores from the Chang-7 shale oil reservoir in the Xi-233 block under the same downstream pressure. At the same upstream and downstream pressures of 15.9 MPa and 7 MPa, respectively, with increasing depletion time, the evolution of recovery factor can be divided into three stages: a rapid initial increase followed by a slowdown, a sudden increase in the middle stage, and a subsequent low-pressure stable-production stage. In the early depletion stage, the pressure differential between the upstream and downstream ends of the core is large, corresponding to a higher pressure gradient, which leads to a relatively rapid rise in recovery factor. As depletion time increases, the rate of increase gradually decreases. When the internal core pressure declines to the bubble-point pressure (10 MPa), the recovery factor exhibits an upward trend within a relatively short period, after which it gradually declines and eventually stabilizes.
- 2.
- Crude Oil Mobilization Characteristics
In the initial state, the crude oil distribution exhibits a bimodal characteristic and is predominantly located in meso-to-macro pores, with only a minor proportion in micropores. During the early stage of depletion, the pressure in the core declines rapidly, and the T2 spectra show pronounced variations, which are mainly manifested in the meso-to-macro pores. As depletion time increases, the pressure decline rate gradually decreases; however, after the pressure drops to the bubble-point pressure, the T2 spectral variations become pronounced again. After depletion, a significant amount of residual oil remains in the meso-to-macro pores (Figures 11).
4. Discussion
4.1. Factors Effecting Oil Production During the Normal Development Stage
The above experimental results indicate that the depletion recovery factor of cores from the Chang-7 shale oil reservoir in the Xi-233 block is relatively low, suggesting poor development performance. To improve the depletion recovery factor of this reservoir, laboratory physical simulation experiments were conducted under various conditions to investigate the effects of pressure, permeability, and solution gas-oil ratio on depletion performance.
4.1.1. Effect of Pressure on Depletion Recovery Factor
To investigate the influence of production pressure on depletion recovery factor, depletion experiments were performed on three core samples (Table 6) using degassed formation crude oil with a viscosity of 1.45 mPa·s at reservoir temperature and an initial pressure of 15.9 MPa. The bottom-hole pressures were set to 12 MPa, 9 MPa, and 7 MPa, respectively. The detailed experimental results are presented in the tables and figures.
As shown in Table 6, the depletion recovery factor decreases with increasing downstream pressure. For each 2 MPa reduction in bottom-hole pressure (ΔP = 2 MPa), the depletion recovery factor increases by approximately 2.7%-2.86%. The relationship between depletion recovery factor and permeability follows a logarithmic trend. Within a certain range, the recovery factor decreases with decreasing permeability; when the permeability differs by a factor of two, the depletion recovery factor differs by a factor of 1.15.
Furthermore, the Chang-7 shale oil reservoir in the Xi-233 block is characterized by abundant nanopores and micro-nanopores, which serve as the primary oil storage space. However, owing to the small pore-throat radii, the influence of the boundary layer on crude oil flow cannot be neglected, resulting in significant seepage resistance that prevents oil in smaller pores from flowing. As bottom-hole pressure decreases, the pressure gradient across the core gradually increases, overcoming the seepage resistance and displacing more oil from micro-nano and nanopores, thereby accelerating the increase in recovery factor. This indicates that during depletion development of the shale oil reservoir, micro-nanopores and nanopores constitute the primary oil-producing pore space.
4.1.2. Effect of Permeability on Depletion Recovery Factor
Depletion experiments were conducted on tight core samples with different permeabilities (Table 7) at reservoir temperature and pressure, using formation crude oil with a viscosity of 1.45 mPa·s and a downstream pressure of 7 MPa.
The depletion recovery factors of core samples with varying permeabilities are presented in Table 7. The relationship between depletion recovery factor and permeability in the Chang-7 shale oil reservoir of the Xi-233 block follows a logarithmic trend. Within a certain range, the recovery factor decreases with decreasing permeability. When permeability is relatively low, the pore structure of the reservoir is poor, and the seepage resistance to oil displacement by elastic energy is high, which tends to trap oil at narrow pore throats, thereby reducing the depletion recovery factor. As permeability decreases further, the depletion recovery factor declines more rapidly, especially under higher production pressure, where the recovery factor becomes particularly low. This is because at very low permeability, the pore radii are extremely small, and the thickness of the oil-water boundary layer significantly affects fluid flow in the reservoir. Some pore channels may even become ineffective flow regions when completely occupied by the boundary layer. In addition, the abundant nanopores and micro-nanopores in tight reservoirs further increase seepage resistance. Under such conditions, the pressure differential generated by pressure depletion is insufficient to drive oil flow, thereby reducing the flow capacity of fine pore throats and decreasing the depletion recovery factor. [17].
4.1.3. Effect of Solution Gas-Oil Ratio on Depletion Recovery Factor
Under identical experimental conditions, depletion experiments were conducted on two representative core samples using live oil with a gas-oil ratio of 100 m³/m³ and degassed formation crude oil, respectively, with a downstream pressure of 7 MPa.
The depletion recovery factors of different formation crude oils are shown in Figure 12. With increasing depletion time, the recovery factors of both live oil and degassed oil exhibit similar increasing trends during the early depletion stage. However, it is evident that the recovery factor of live oil is significantly higher than that of degassed oil. This can be attributed to two factors. First, the dissolved gas in the live oil causes volume expansion and viscosity reduction of the simulated oil, thereby decreasing seepage resistance and enhancing fluid mobility, which facilitates oil production. Second, the live oil has a higher expansion coefficient; as formation pressure decreases, more elastic energy is released through volume expansion. When the pressure in the core drops to the bubble-point pressure (10 MPa), part of the dissolved gas exsolves, forming a solution-gas drive that displaces more simulated oil from fine pore channels. Consequently, the recovery factor increases noticeably over a certain period before eventually stabilizing.
4.2. Reservoir Engineering Method for Calculating Recovery Factor and Its Contribution at Different Development Stages
During depletion of shale oil reservoirs, the process successively undergoes hydraulic fracturing, post-fracturing shut-in, depletion, and solution-gas drive stages[18]. Based on previous experimental and theoretical studies, recovery-factor calculation models for different development stages were established. In addition, numerical simulation studies were conducted on the study area using a mechanistic model, preliminarily clarifying the recovery factors at different development stages and their contributions to the total recovery factor.
4.2.1. Imbibition Recovery Factor
Dynamic imbibition experimental results of shale oil reservoirs indicate that the recovery factor during the shut-in stage at the core scale is 9.96%. Based on the principle of similarity, this can be up-scaled to the reservoir scale. The recovery factor during the shut-in process can be expressed as:
Where:
- Es= Imbibition recovery factor, %;
- Ese = Imbibition recovery factor from laboratory experiment, %;
- ρo= Oil density, m³/g;
- Nleg= Fracturing fluid volume injected, m³;
- N= Single-well controlled reserves, t.
Figure 13 presents the recovery factor during the shut-in process of a shale oil reservoir under different injected fluid volumes, with a horizontal section length of 1500 m, well spacing of 400 m, and single-well controlled reserves of 17.78×10⁴ t. As shown in the figure, for horizontal wells with injected fluid volumes ranging from 10,000 to 30,000 m³, the imbibition recovery factor is estimated to be between 0.287% and 1.004%.
4.2.2. Elastic Energy Recovery
Typically, the key to calculating the recovery factor contributed by elastic energy lies in determining the comprehensive compressibility coefficient of the reservoir. The conventional calculation formula for comprehensive compressibility coefficient only considers three components: rock, irreducible water, and formation fluid[19]. However, the flowback rate of shale oil reservoirs is very low, resulting in a large volume of fracturing fluid retained in the formation, which also provides a portion of elastic energy during development. To address this, a new comprehensive compressibility coefficient model is proposed in this study, which incorporates four components: rock, irreducible water, formation fluid, and fracturing fluid. The concept of fracturing fluid storage multiplier (Fev) is introduced to characterize the magnitude of elastic energy contributed by the retained fracturing fluid during depletion development. It is defined as the ratio of the volume of fracturing fluid retained in the reservoir (Nleg) to the reservoir controlled reserves (N) (Equation 7).
Based on the material balance principle, the change in reservoir volume is mainly composed of three parts: the change in rock pore volume, the change in irreducible water volume, and the change in volume occupied by the retained fracturing fluid (Figure 14).
Where:
- ΔV = Change in reservoir volume, m³;
- ΔVp = Change in pore volume, m³;
- ΔVwc = Change in irreducible water volume, m³;
- ΔVw = Change in volume occupied by fracturing fluid, m³.
The change in pore volume (ΔVp), the change in irreducible water volume (ΔVwc), and the change in fracturing fluid volume (ΔVw) can be expressed as:
Where:
- Vp = Pore volume, m³;
- Vwc = Irreducible water volume, m³;
- Vw = Fracturing fluid volume, m³;
- Cp = Rock compressibility coefficient, MPa⁻¹;
- Cw = Formation water compressibility coefficient, MPa⁻¹;
- Δp = Change in formation pressure, MPa.
Substituting Equations (9), (10), and (11) into (8), the change in reservoir volume can be expressed as:
The irreducible water volume and pore volume in Equation (12) can be expressed as:
Where:
- Swc = Irreducible water saturation, %.
Substituting Equations (7), (13), and (14) into (12) yields:
Based on the definition of reservoir volume compressibility coefficient:
Where Cc is the reservoir volume compressibility coefficient, MPa-¹. Therefore, considering the fracturing fluid volume multiplier Fev, the new reservoir compressibility coefficient is:
where Ceff is the comprehensive compressibility coefficient, MPa-¹. Based on the new compressibility coefficient and the definition of compressibility, the recovery factor contributed by elastic energy during depletion development can be calculated as:
Where:
- E = Recovery factor contributed by elastic energy, %;
- Bo = Oil formation volume factor.
Based on Equation (18), the recovery factor contributed by the combined elastic energy of reservoir rock, crude oil, irreducible water, and fracturing fluid can be calculated. Meanwhile, when Fev=0 in Equation (17), the comprehensive compressibility coefficient reduces to the conventional form reflecting the elastic energy of rock, fluid, and irreducible water, and the calculated recovery factor excludes the elastic energy of fracturing fluid. The recovery factor contributed solely by fracturing fluid elastic energy can then be obtained by taking the difference between the two [20].
Using the actual reservoir parameters of the Xi-233 block and substituting them into Equations (17) and (18), the recovery factors contributed by the elastic energy of reservoir rock, crude oil, and irreducible water, as well as that contributed by fracturing fluid elastic energy during depletion development, were calculated (Figure 14). The calculation results indicate that for a single-well controlled reserve of 17.78×10⁴ t, the recovery factor contributed by fracturing fluid elastic energy is 0.72%, while that contributed by reservoir elastic energy (including rock, crude oil, and irreducible water) is 7.2%. Thus, the elastic energy is mainly derived from the reservoir rock, crude oil, and irreducible water, with the fracturing fluid providing relatively little elastic energy.
Using the above prediction models for recovery factors contributed by elastic energy and solution-gas energy, the recovery factors contributed by different energy sources and their contributions to the total recovery factor during depletion development of the shale oil reservoir in the Xi-233 block were further calculated. Taking the following parameters as an example: abandonment pressure of 6.2 MPa, well spacing of 400 m, solution gas-oil ratio of 108 m³/m³, reservoir thickness of 10 m, horizontal section length of 1500 m, permeability of 0.014 mD, single-well controlled reserves of 17.78×10⁴ t, and injected fluid volume of 27,823 m³, the recovery factors contributed by fracturing fluid elastic energy, reservoir elastic energy, and solution-gas energy were calculated separately. The calculation results show that the recovery factors contributed by different energy sources are 0.72%, 7.2%, and 2.07%, respectively, with corresponding contributions to the total recovery factor of 7.21%, 72.07%, and 20.72%. These results are consistent with the findings from laboratory physical simulation experiments.
In addition, a mechanistic model was constructed using CMG software to further simulate the oil production under different energy sources. The entire simulation scheme adopted a production schedule of constant liquid rate followed by constant flowing pressure. Different types of recovery factors were distinguished by varying reservoir conditions. The injected fluid volume was reflected by increasing formation pressure level (Figure 15), while the contribution of injected fluid elastic energy was calculated by comparing simulated oil production with and without consideration of fracturing fluid. The solution-gas drive recovery factor was reflected by varying the solution gas-oil ratio.
Figure 16 shows the daily oil production rates under different conditions (with fracturing fluid and solution gas, without fracturing fluid but with solution gas, and without fracturing fluid and without solution gas). The case without fracturing fluid but with solution gas yields the highest daily production, while the case without fracturing fluid and without solution gas yields the lowest daily production with the fastest decline rate. By combining the daily production curves under different conditions, the production contributed by fracturing fluid elastic energy can be obtained by subtracting the curves with and without fracturing fluid when solution gas is not considered. Similarly, the production contributed by solution-gas energy can be obtained by subtracting the curves with and without solution gas when fracturing fluid is not considered.
Figure 17 present the contribution ratios of different energy sources to recovery factor obtained by reservoir engineering calculations and numerical simulation, respectively. The contribution ratios of fracturing fluid elastic energy, reservoir elastic energy, and solution-gas energy to the total recovery factor are 9.23%, 62.14%, and 28.64%, respectively, showing good consistency between the two.
The reservoir engineering calculations, laboratory physical simulation experiments, and numerical simulation results all indicate that during natural energy development of shale oil reservoirs, the elastic energy provided by fracturing fluid, rock, and formation fluids makes the highest contribution to the recovery factor, while the contribution of solution-gas energy is relatively small. The effect of solution-gas energy is mainly manifested in the transition stage when solution gas just begins to exsolve (i.e., the low solution gas-oil ratio stage). When the solution gas-oil ratio is relatively high (entering the solution-gas drive stage), its contribution to improving the recovery factor is essentially negligible.
4.2.3. Prediction Model for Solution-Gas Recovery Factor
Various methods have been proposed for calculating the recovery factor contributed by solution-gas energy, including empirical correlations, material balance methods, and numerical simulation methods. Among these, the material balance method is currently the most commonly used approach[21]. In this study, the material balance method is also employed to calculate the solution-gas drive recovery factor. Based on the material balance principle, without considering the elastic expansion of rock and irreducible water, the material balance relationship under solution-gas drive can be expressed as.
Where:
- N = Oil reserves, m³;
- Np = Cumulative oil production under solution gas drive, m³;
- Bo = Oil FVF;
- Bg = Gas FVF;
- Rsi = Initial solution gas-oil ratio, m³/m³;
- Rs = Solution gas-oil ratio at pressure p, m³/m³;
- Rp = Average produced gas-oil ratio, m³/m³.
Based on Equation (19) and the basic definition of recovery factor, the recovery factor under solution-gas drive can be calculated as:
where ER is the recovery factor contributed by solution-gas drive, %.
Using the formation fluid parameters of the Xi-233 block (Table 8) and the variation characteristics of solution gas-oil ratio during natural energy development, the recovery factors under different solution gas-oil ratios were calculated using Equation (20). The calculation results indicate that the recovery factor contributed by solution-gas energy in the study area ranges from 2% to 17.29%, and decreases with increasing average solution gas-oil ratio (Table 9). This indicates that during depletion development, the effect of solution gas is mainly manifested at low solution gas-oil ratios (i.e., when gas just begins to exsolve), while its contribution to recovery factor gradually diminishes at higher solution gas-oil ratios, which is consistent with the experimental results.
4.2.4. Contribution of Elastic Energy and Solution-Gas Energy in Different Well Types
By analyzing the contributions of fracturing fluid elastic energy, reservoir fluid elastic energy, and solution-gas drive to recovery factor in 357 horizontal wells from two blocks, it was found that for Class I reservoirs, reservoir fluid elastic energy contributes the largest proportion, while solution-gas drive contributes a relatively small proportion.
4.3. Development Policy Optimization
Based on the pressure depletion curves of wells and the corresponding reservoir permeability characteristics, the relationship between the contribution ratio of displacement (where stronger displacement implies weaker imbibition replacement) and the distance from the main fracture was obtained using an interpolation method[22] (Figure 18). Results indicate the contribution ratio of imbibition replacement increases with increasing distance from the main fracture. Furthermore, as the production pressure differential increases, the contribution ratio of imbibition replacement decreases. When the production pressure differential is reduced from 7 MPa to 3 MPa, tthe contribution ratio of imbibition replacement in the matrix region far from primary fractures increases by 33.33%. This indicates that adjusting the production pressure differential during depletion development can effectively enhance the imbibition replacement effect in the matrix region, thereby improving the mobilization of micro and meco pore throats[23]. Therefore, to improve the development performance of shale oil under depletion, while maintaining formation energy, a stepped multi-stage pressure reduction strategy should be adopted to control the production pressure differential and enhance the contribution ratio of imbibition replacement in shale oil reservoirs.
The flowback intensities for the three development stages of horizontal wells in the study area are as follows: when water cut≥90%, the flowback intensity is 4.0-5.0 m3/100 m, corresponding to a liquid production rate of 60-75 m³/d for a 1500-m horizontal well; when water cut is between 60% and 90%, the flowback intensity is 2.0-3.0 m³/100 m, corresponding to a liquid production rate of 30-45 m³/d for a 1500-m horizontal well; when water cut < 60%, the production system follows the normal production schedule with four stages of reasonable liquid production intensity (Table 10).
5. Conclusions
1. mbibition mobilizes crude oil in pore throats of all sizes, while waterflooding mainly mobilizes crude oil in meco-to-macro pores. Compared with waterflooding alone, displacement after imbibition achieves better oil mobilization, indicating that the role of imbibition is not only to mobilize crude oil but also to enhance the seepage characteristics of crude oil during subsequent displacement.
- 2.
- The imbibition recovery factor under atmospheric pressure is 5.74%, contributing 16.5% to the total recovery factor, and this portion of oil mainly comes from micropores.
3. The peaks corresponding to micro and macro pores continuously decrease with increasing imbibition time, while the peaks corresponding to relaxation times of 1-10 ms fluctuate within a small range. This indicates that during imbibition, both micropores and macropores can be effectively mobilized, while pores with relaxation times of 1-10 ms, which serve as connecting channels between micropores and macropores, exhibit relatively small changes.
4. The oil production mechanism during the fracturing process can be divided into two stages: Stage I--owing to the pressure differential between the matrix and fractures, the fracturing fluid in the fractures enters the larger pores around the fractures under pressure, causing a rapid increase in recovery factor from macropores. Stage II--as the pressure differential between pores continuously decreases during pressure transmission, the retained water phase in macropores and fractures spontaneously imbibes into micropores along grain surfaces under the combined effects of capillary force and wettability, resulting in a continuous increase in recovery factor from micropores.
5. As injection pressure increases, the contribution ratio of imbibition to recovery factor gradually decreases, while the contribution of displacement gradually increases.
6. Patents
This section is not mandatory but may be added if there are patents resulting from the work reported in this manuscript.
Author Contributions
All authors have made substantial contributions to this work: -Shuwei Ma: Conceptualization, methodology, investigation, data curation, writing—original draft preparation. - Youan He: Methodology, supervision, project administration. - Qinchuan Yang: Visualization, formal analysis, investigation. - Tianjing Huang: Investigation, resources, validation. - Wenlian Xiao: Methodology, conceptualization, supervision. - Bo Wang: Investigation, data curation, resources. - Shunyan Feng: Writing—review and editing, supervision. We confirm that all the data used in this study are presented in the manuscript. The original experimental data and simulation results are available upon request from the corresponding author. All authors have read and agreed to the published version of the manuscript.
Funding
This research was funded by OIL & GAS MAJOR PROJECT, grant number 2025ZD1404803, and TECHNICAL RESEARCH & FIELD TEST PROJECT OF CHANGQING OILFIELD COMPANY, grant number 2026D3JS01.
Acknowledgments
We would like to express our gratitude to PetroChina Changqing Oilfield Company for providing access to the core samples and field data used in this study. We also acknowledge the support from the National Key Laboratory of Oil and Gas Reservoir Geology and Exploration, Southwest Petroleum University.
During the preparation of this manuscript/study, the authors used DEEPSEEEK for the purposes of language editing and formatting consistency. The authors have reviewed and edited the output and take full responsibility for the content of this publication.
Conflicts of Interest
The authors declare no conflicts of interest.
Abbreviations
The following abbreviations are used in this manuscript:
| NMR | nuclear magnetic resonance |
| PFSI | post-fracture shut-in |
References
- Jiao, F.; Zou, C.; Yang, Z. Geological theory and exploration & development practice of hydrocarbon accumulation inside continental source kitchens. Pet. Explor. Dev. 2020, 47, 1067–1078. [Google Scholar] [CrossRef]
- Yang, H.; Li, S.; Liu, X.; et al. Characteristics and re-source prospects of tight oil and shale oil in Ordos Basin. Acta Pet. Sin. 2012, 34, 1–11. [Google Scholar]
- Zou, C.; Zhang, G.; Yang, Z.; et al. Geological concepts, characteristics, resource potential and key techniques of unconven-tional hydrocarbon: On unconventional petroleum geology. Pet. Explor. Dev. 2013, 40, 385–399. [Google Scholar] [CrossRef]
- Wang, Q.; Tao, S.; Guan, P. Progress in research and exploration & development of shale oil in continental basins in China. Nat. Gas. Geosci. 2020, 31, 417–427. [Google Scholar]
- Yang, Z.; Zou, C. “Exploring petroleum inside source kitchen”: Connotation andprospects of source rock oil and gas. Pet. Explor. Dev. 2019, 46, 173–184. [Google Scholar] [CrossRef]
- Zou, C.; Yang, Z.; Zhu, R.; et al. Progress of unconventional oil and gas exploration and development and theoretical technology in China. Acta Geol. Sin. 2015, 89, 979–1007. [Google Scholar] [CrossRef]
- Wan, X.L.; Ma, S.W.; Fan, J.M.; et al. Optimization of production system of shale oil development in Ordos basin, China. Sci. Rep. 2023, 13, 6515. [Google Scholar] [CrossRef] [PubMed]
- He, G.; Tang, H. Petrophysics; Petroleum Industry Press: Beijing, 2011; pp. 240–242. [Google Scholar]
- Djebbar, T.; Erle, C.D. Petrophysic, 2nd ed.; Gulf Professional Publishing: Burlington, 2004; pp. 101–105. [Google Scholar]
- Sutanto, E.; Davis, H.T.; Scriven, L.E. Liquid distributions in porous rock examined by cryo scanning electron microscopy. In Proceedings of the SPE 20518, SPE Annual Technical Conference and Exhibition; SPE: New Orleans, Louisiana, 1990; pp. 459–474. [Google Scholar]
- Anderson, W. G. Wettability Literature Survey. J. Pet. Technol. 1987, 39, 1283~1300, 39, 1453~1468, 39, 1605~1622. 1986, 38(1125~1144, 38), 1246~1262, 1371~1378. [Google Scholar] [CrossRef]
- Donaldson, E.C.; Thomas, R.D.; Loren, B.P. Wettability determination and its effect on oil recovery. SPEJ 1969, 9, 13–20. [Google Scholar] [CrossRef]
- Borgia, G.C.; Fantazzini, P.; Mesini, E. Wettability effects on oil-water configurations in porous media: A nuclear magnetic resonance relaxation study. J. Appl. Phys. 1991, 70, 7623–7625. [Google Scholar] [CrossRef]
- Howard, J.J. Quantitative estimates of porous media wettability from proton NMR measurements. Magn. Reson. Imagin. 1998, 16, 529–533. [Google Scholar] [CrossRef]
- Wang, J.; Xiao, L.Z.; Liao, G.Z.; et al. Theoretical investigation of heterogeneous wettability in porous media using NMR. Sci. Rep. 2018, 8, 13450. [Google Scholar] [CrossRef] [PubMed]
- Wang, S.; Javadpour, F.; Feng, Q. Molecular dynamics simulations of oil transport through inorganic nanopores in shale. Fule 2016, 171, 74. [Google Scholar] [CrossRef]
- Zhong, J.; Wang, P.; Zhang, Y.; et al. Adsorption mechanism of oil components on water-wet mineral surface: A molecular dynamics simulation. Energy 2013, 59, 295. [Google Scholar] [CrossRef]
- Xiao, W.; Yang, Y.; Huang, C.; et al. Rock wettability and its influence on crude oil producing characteristics based on NMR technology. Pet. Geol. Recovery Effic. 2023, 30, 112–121. [Google Scholar]
- Brown, R.J.S.; Fatt, I. Measurements of fractional wettability of oil fields’ rocks by the nuclear magnetic relaxation method.// 1956, 26th Ann. Internat Mtg., Sox. Expi Geophys., Expanded Abstracts. Expanded Abstracts.
- Washburn, E. W. The dynamics of capillary flow. Phys. Rev. 1921, 17, 273–283. [Google Scholar] [CrossRef]
- Jiao, F. FSV estimation and its application to development of shale oil via volume fracturing in Ordos Basin. Oil Gas. Geol. 2021, 42, 1181–1188. [Google Scholar]
- Wu, Z.; Ma, S.; Zhao, J.; et al. Preliminary study on imbibition and oil displacement of Chang 7 shale oil in Ordos Basin. Nat. Gas. Geosci. 2021, 32, 1874–1879. [Google Scholar] [CrossRef]
- Xiao, W.; Yang, Y.; Li, M.; et al. Experimental study on the oil production characteristics during the waterflooding of different types of reservoirs in Ordos Basin, NW, China. Pet. Explor. Dev. 2021, 48, 807–816. [Google Scholar] [CrossRef]
Figure 1.
Flowchart of the water flooding experiment.
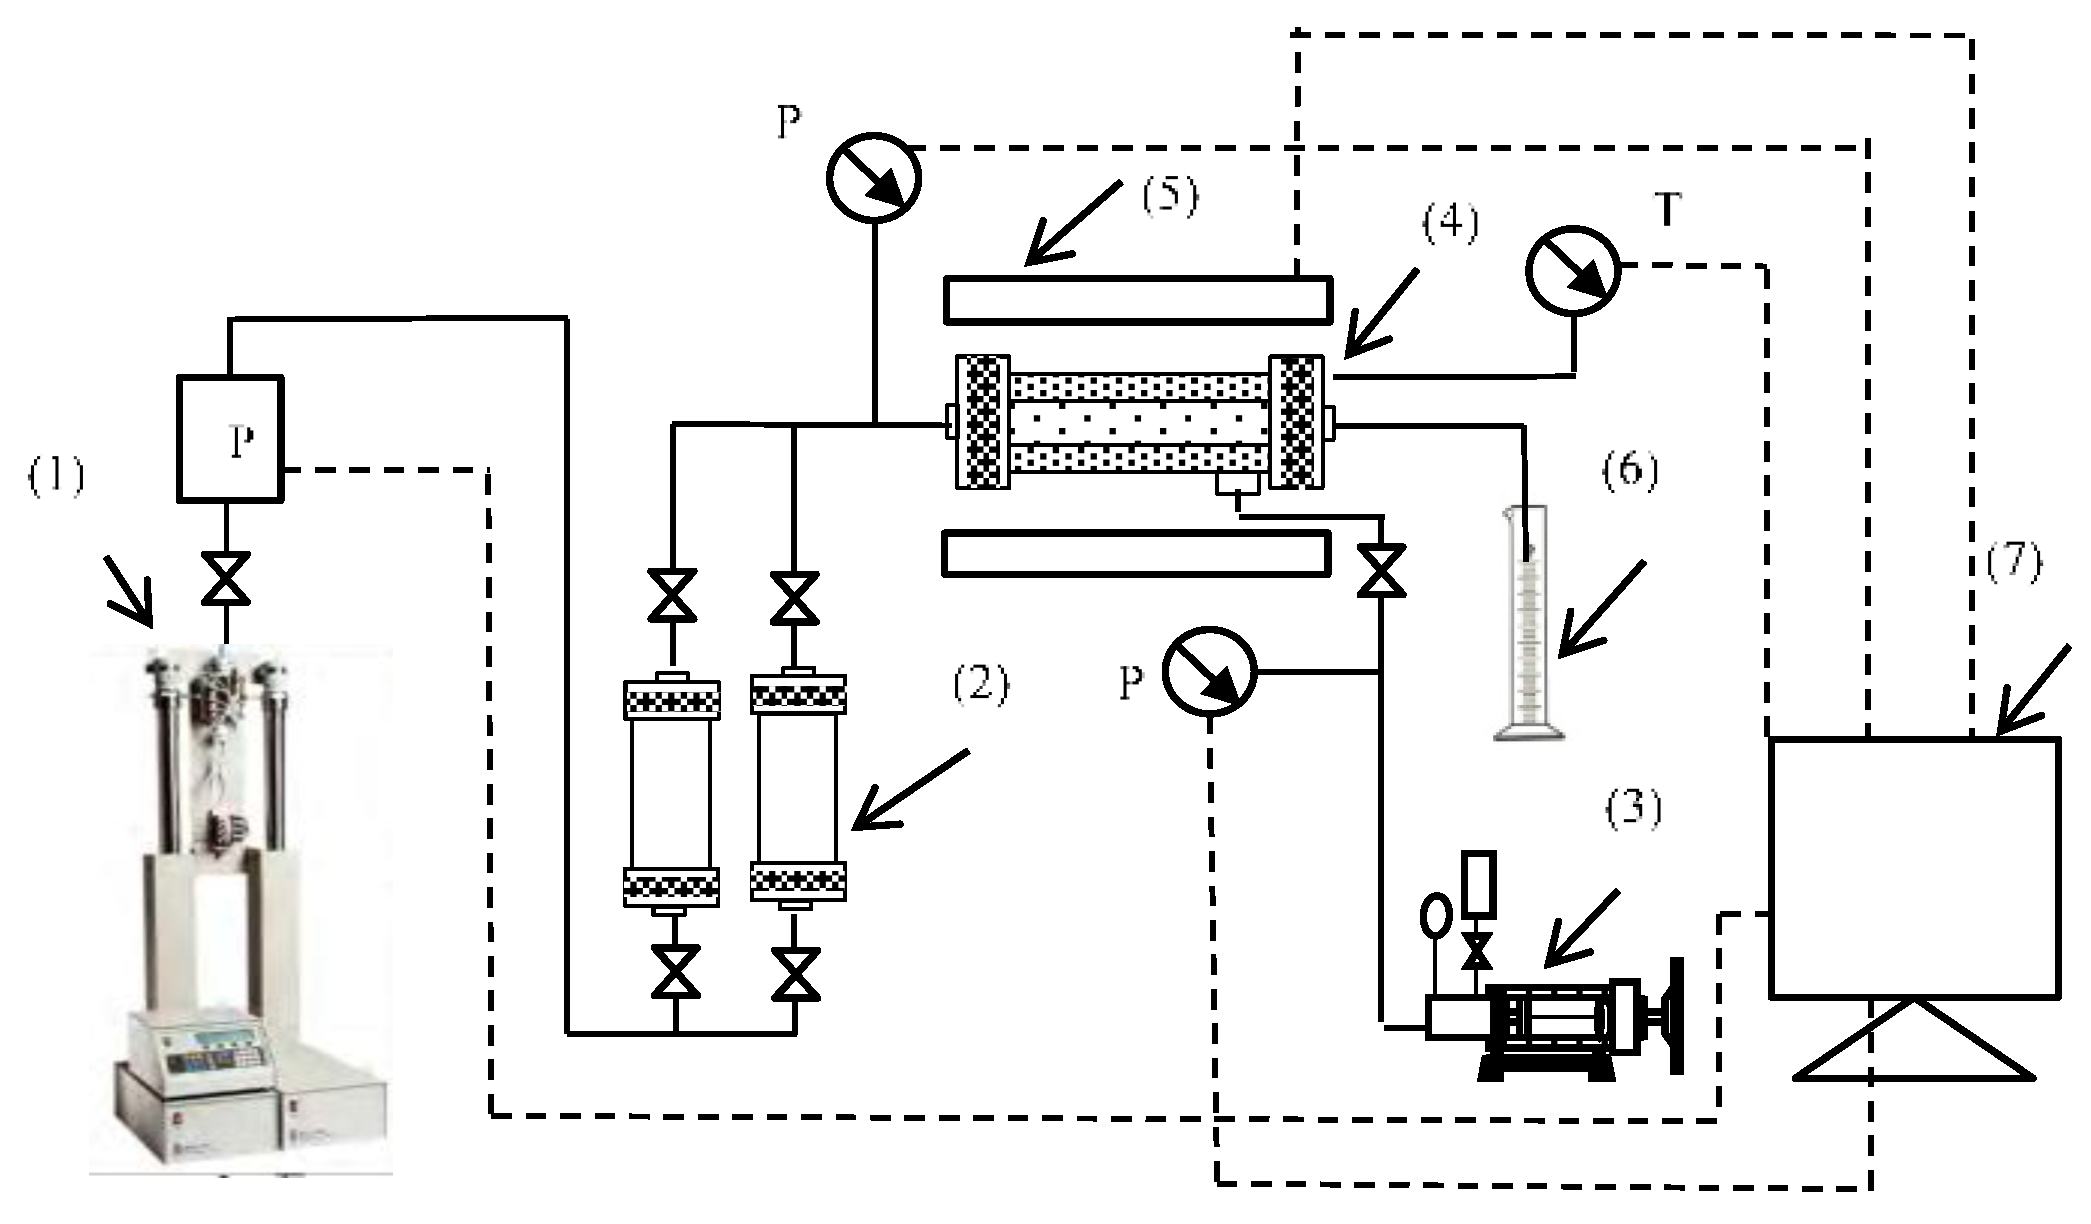
Figure 2.
T₂ curves for samples after imbibition followed by water flooding process:(a) X233-10; (b)X286-10; (c)B117-.
Figure 2.
T₂ curves for samples after imbibition followed by water flooding process:(a) X233-10; (b)X286-10; (c)B117-.
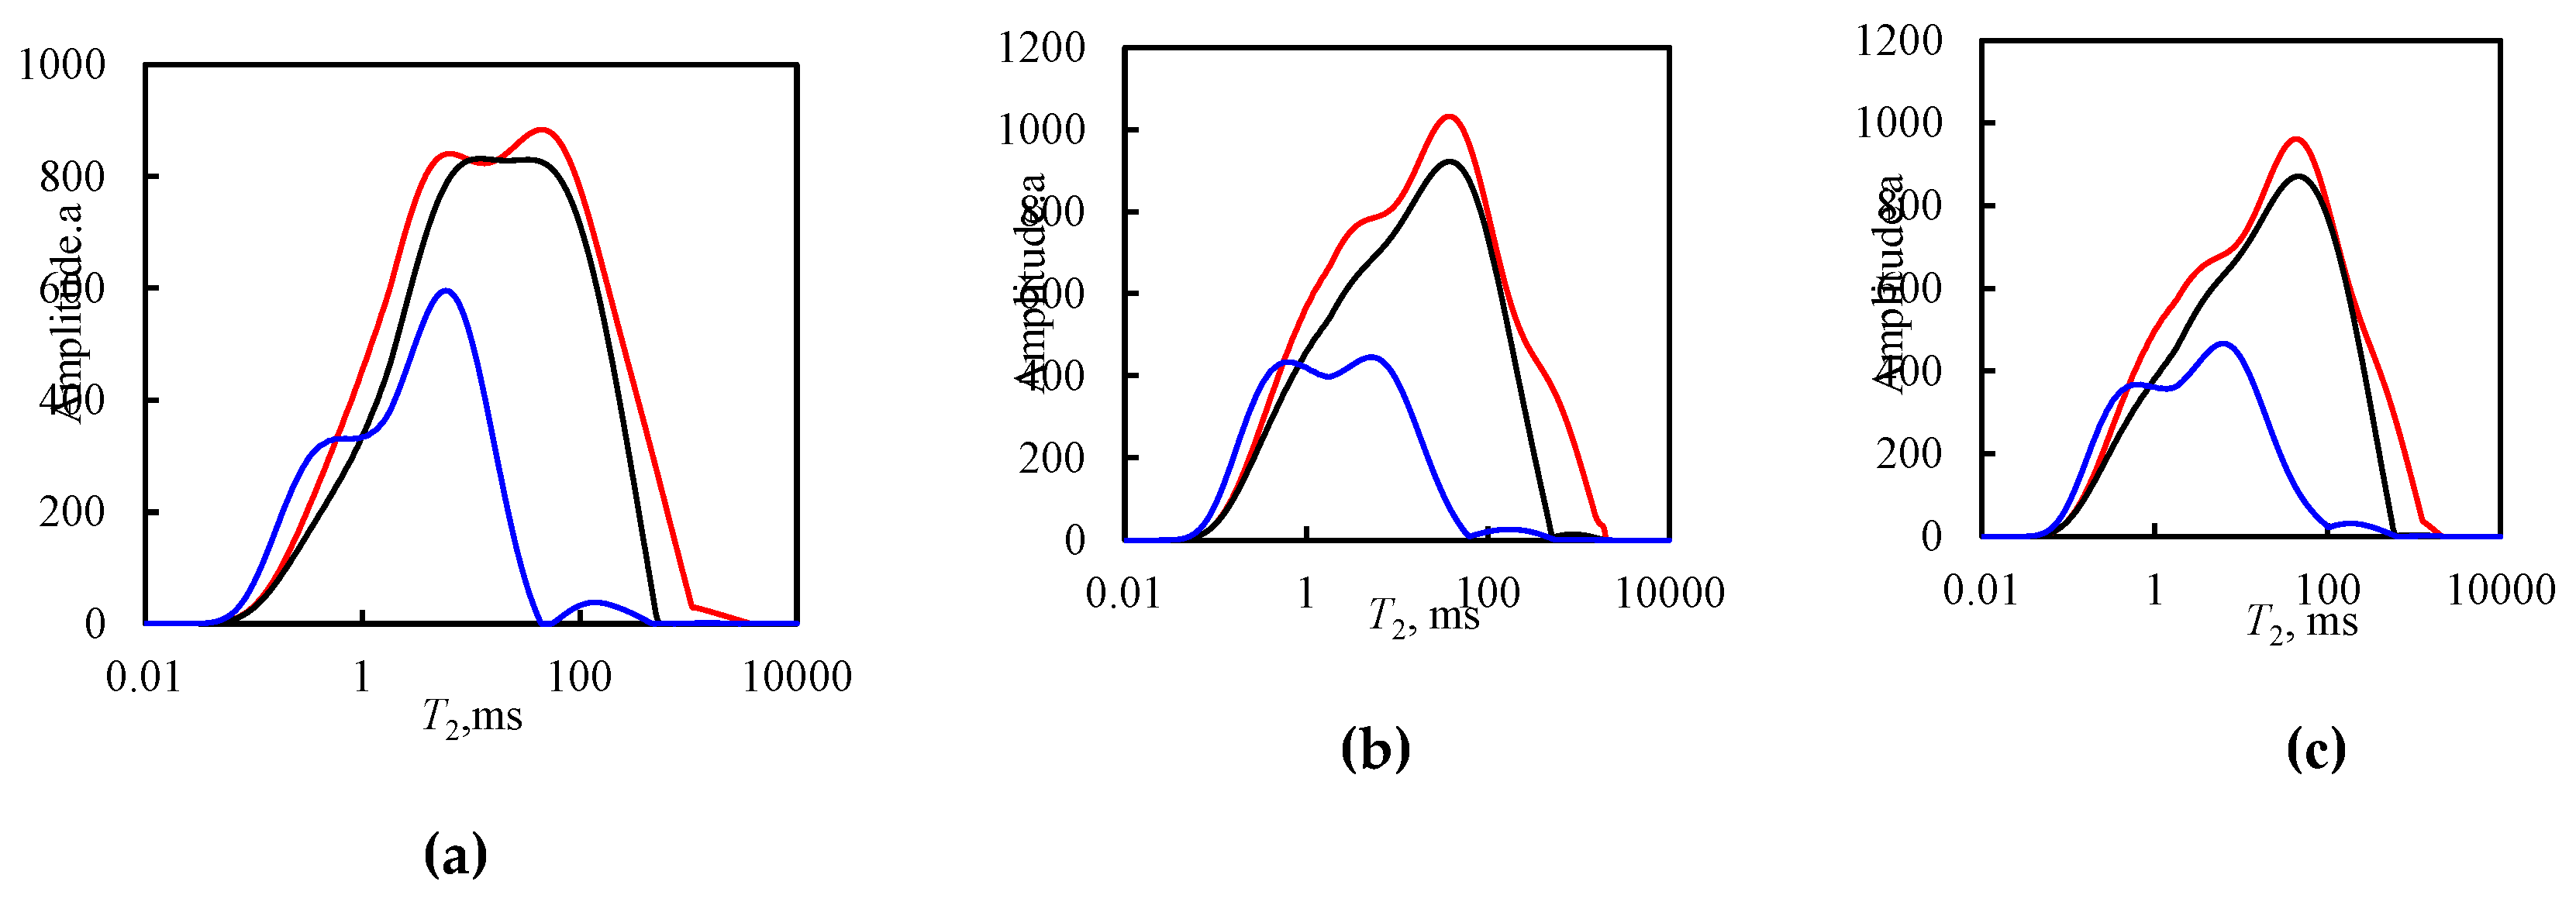
Figure 3.
T₂ curves for samples after water flooding only: (a) X233-9; (b) X286-11; (c)B117-8.
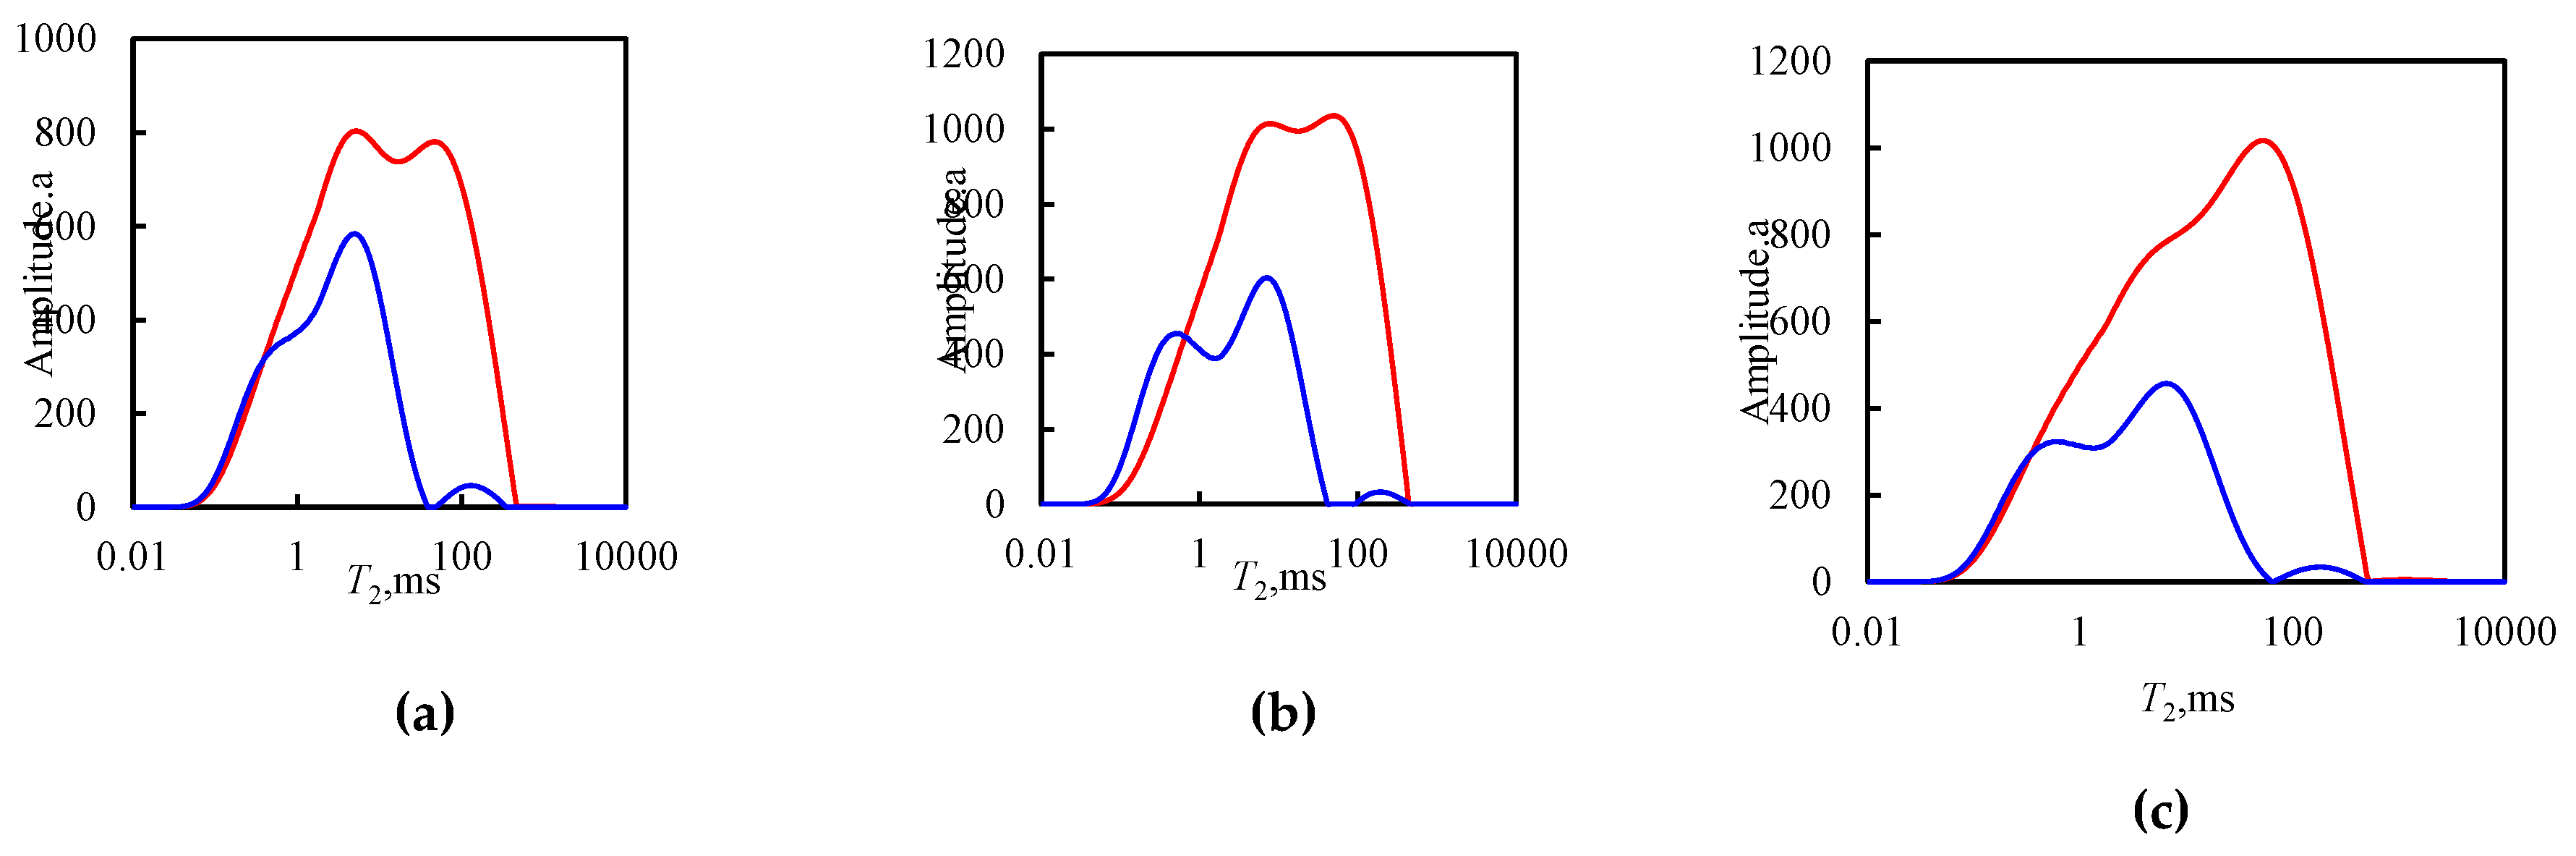
Figure 4.
NMR T₂ spectra at different imbibition stages.
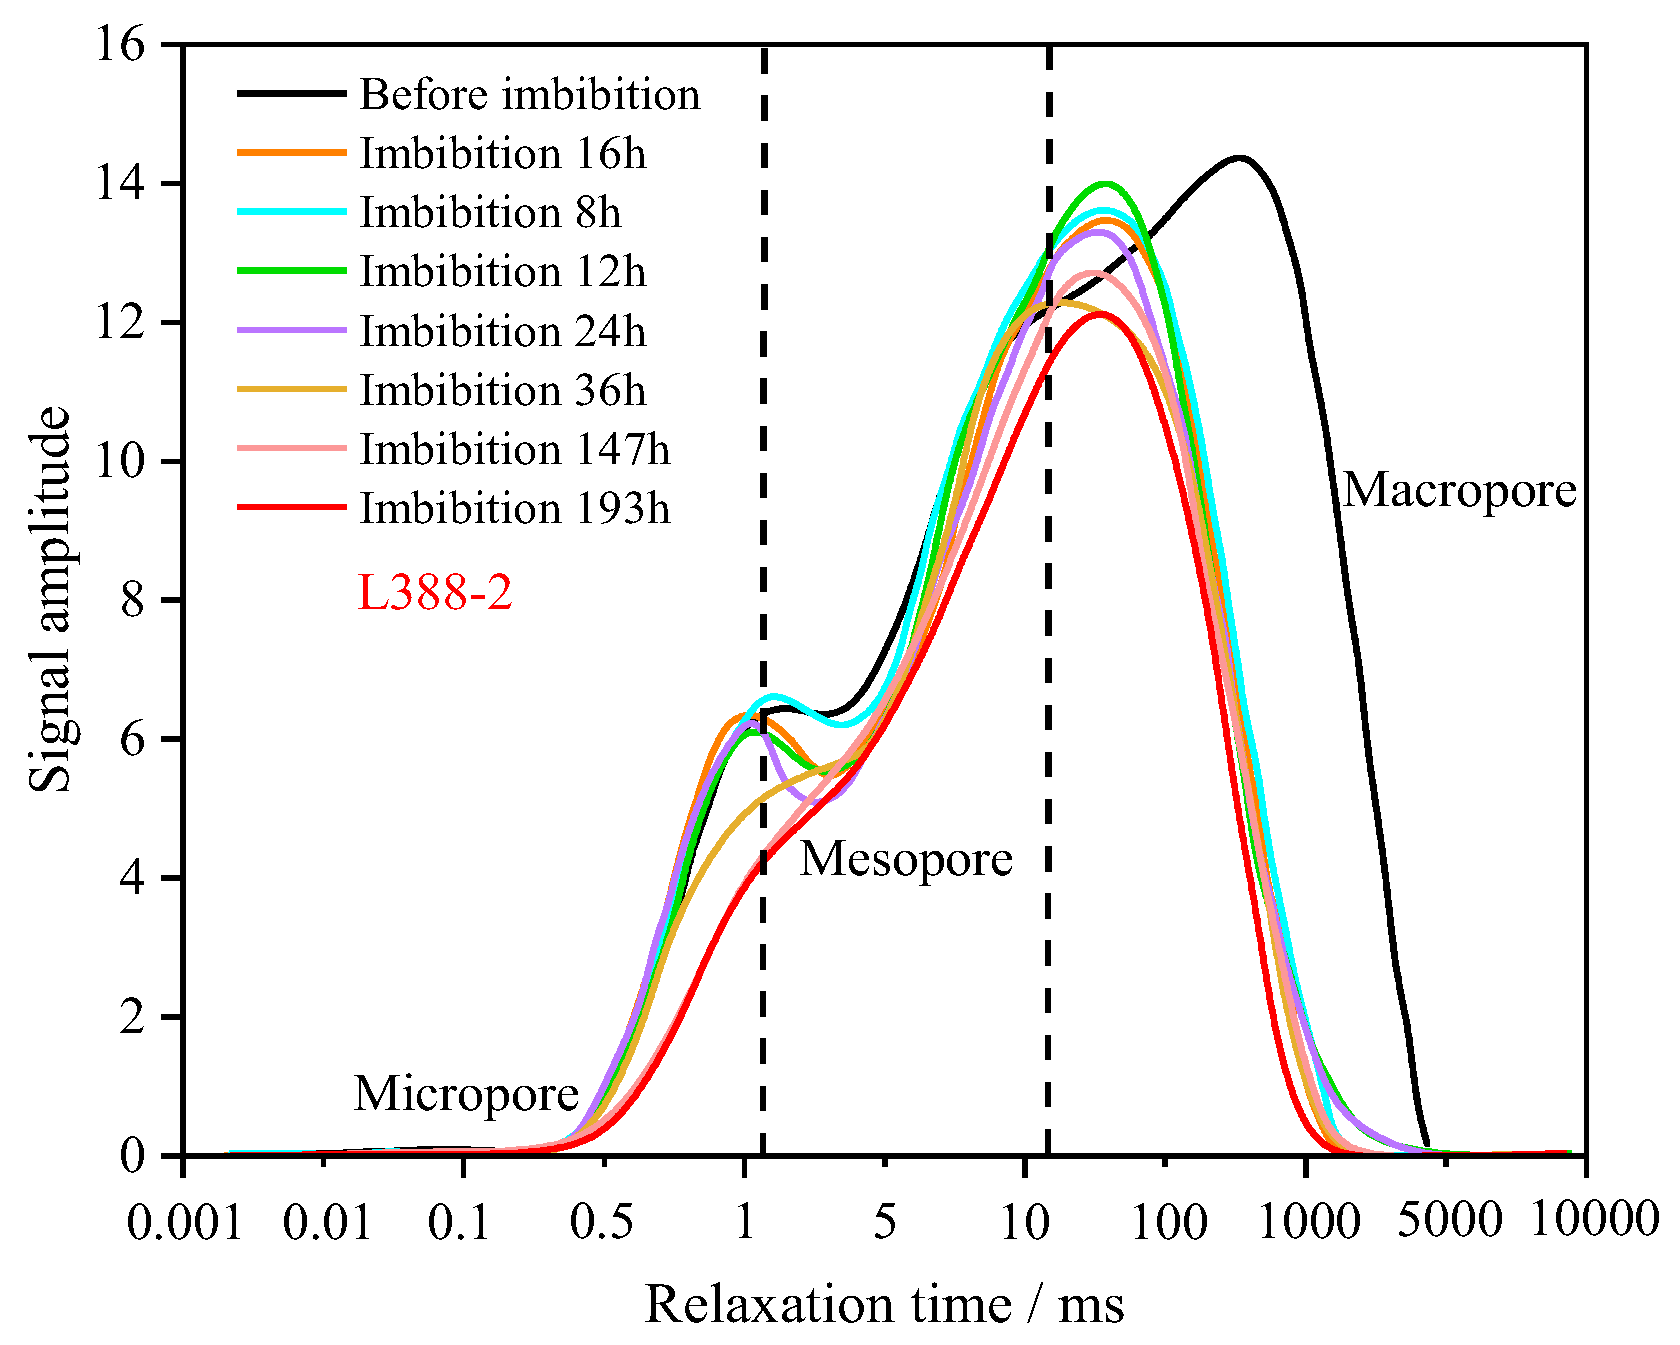
Figure 5.
Imbibition recovery factor from different pores.
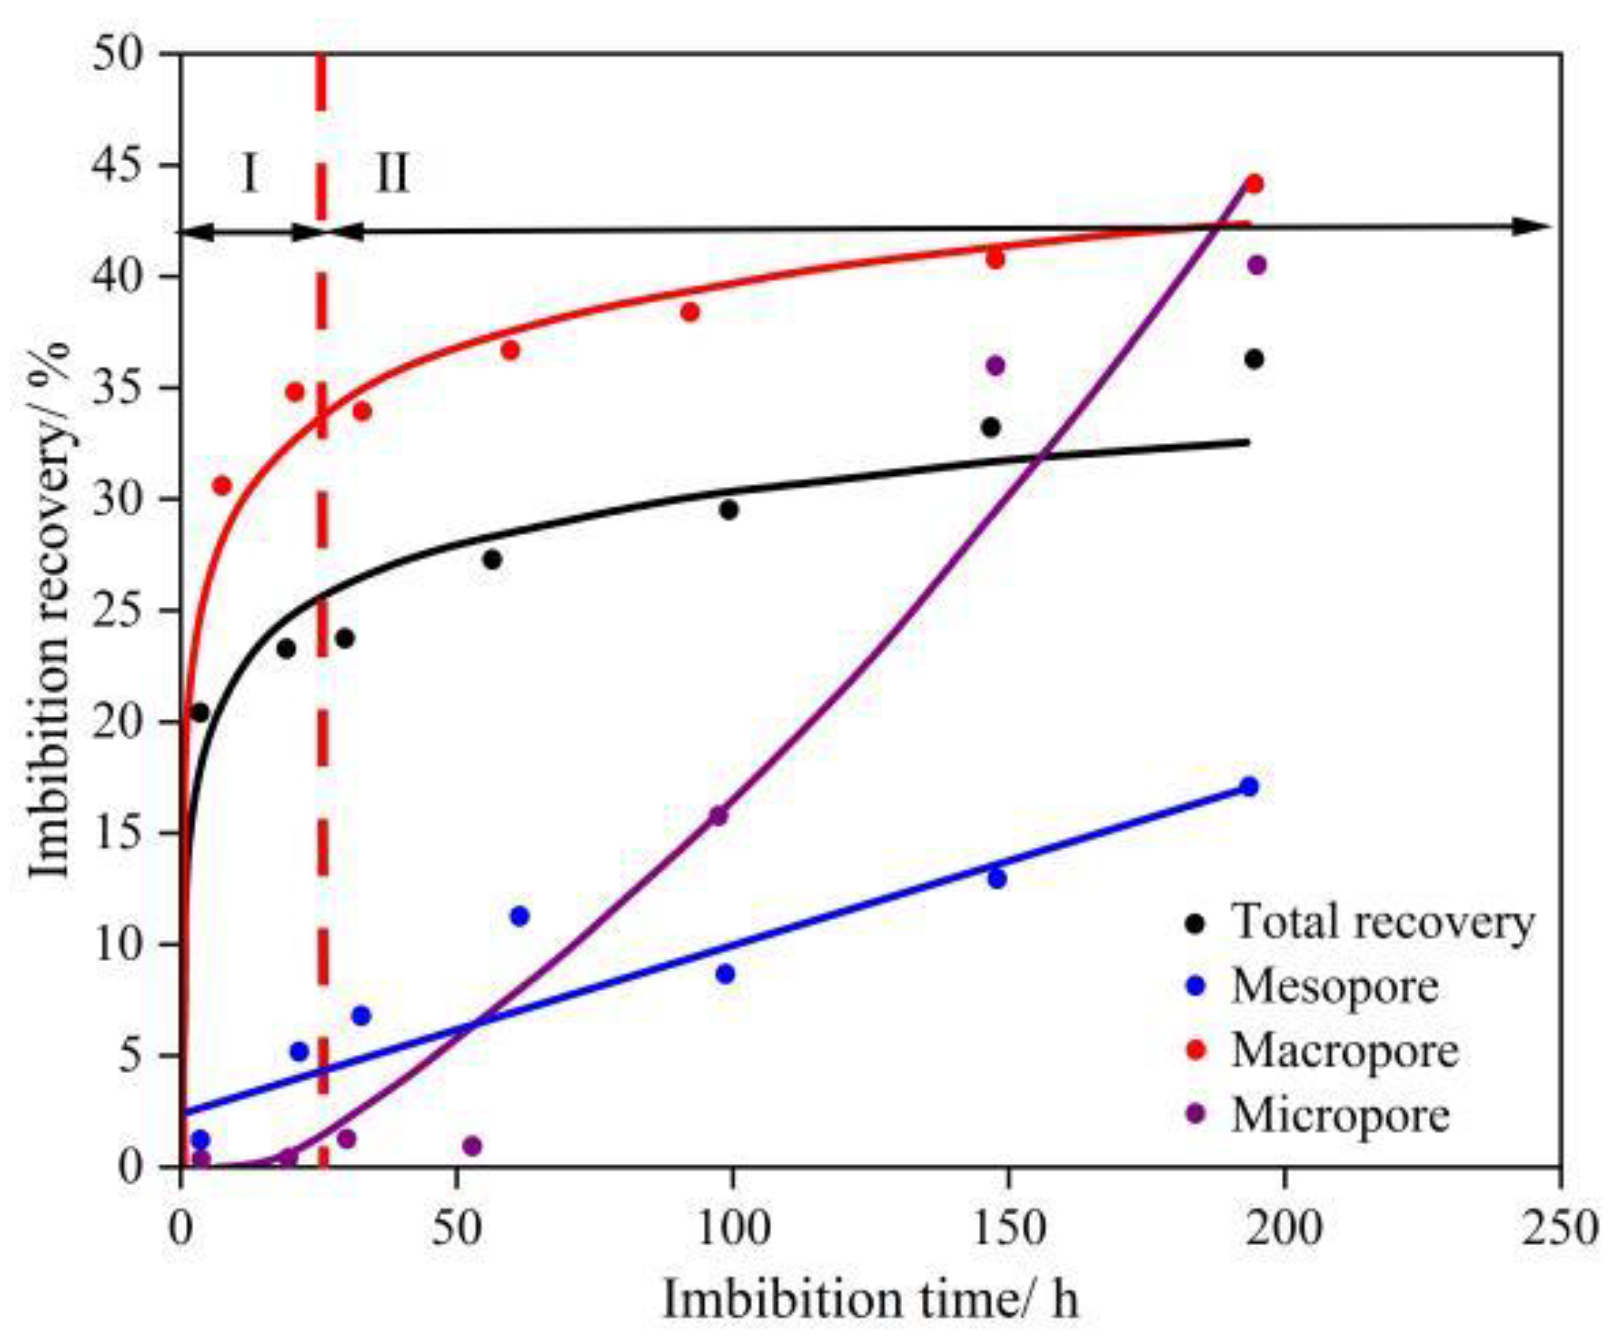
Figure 6.
Schematic diagram of dynamic imbibition mechanism.
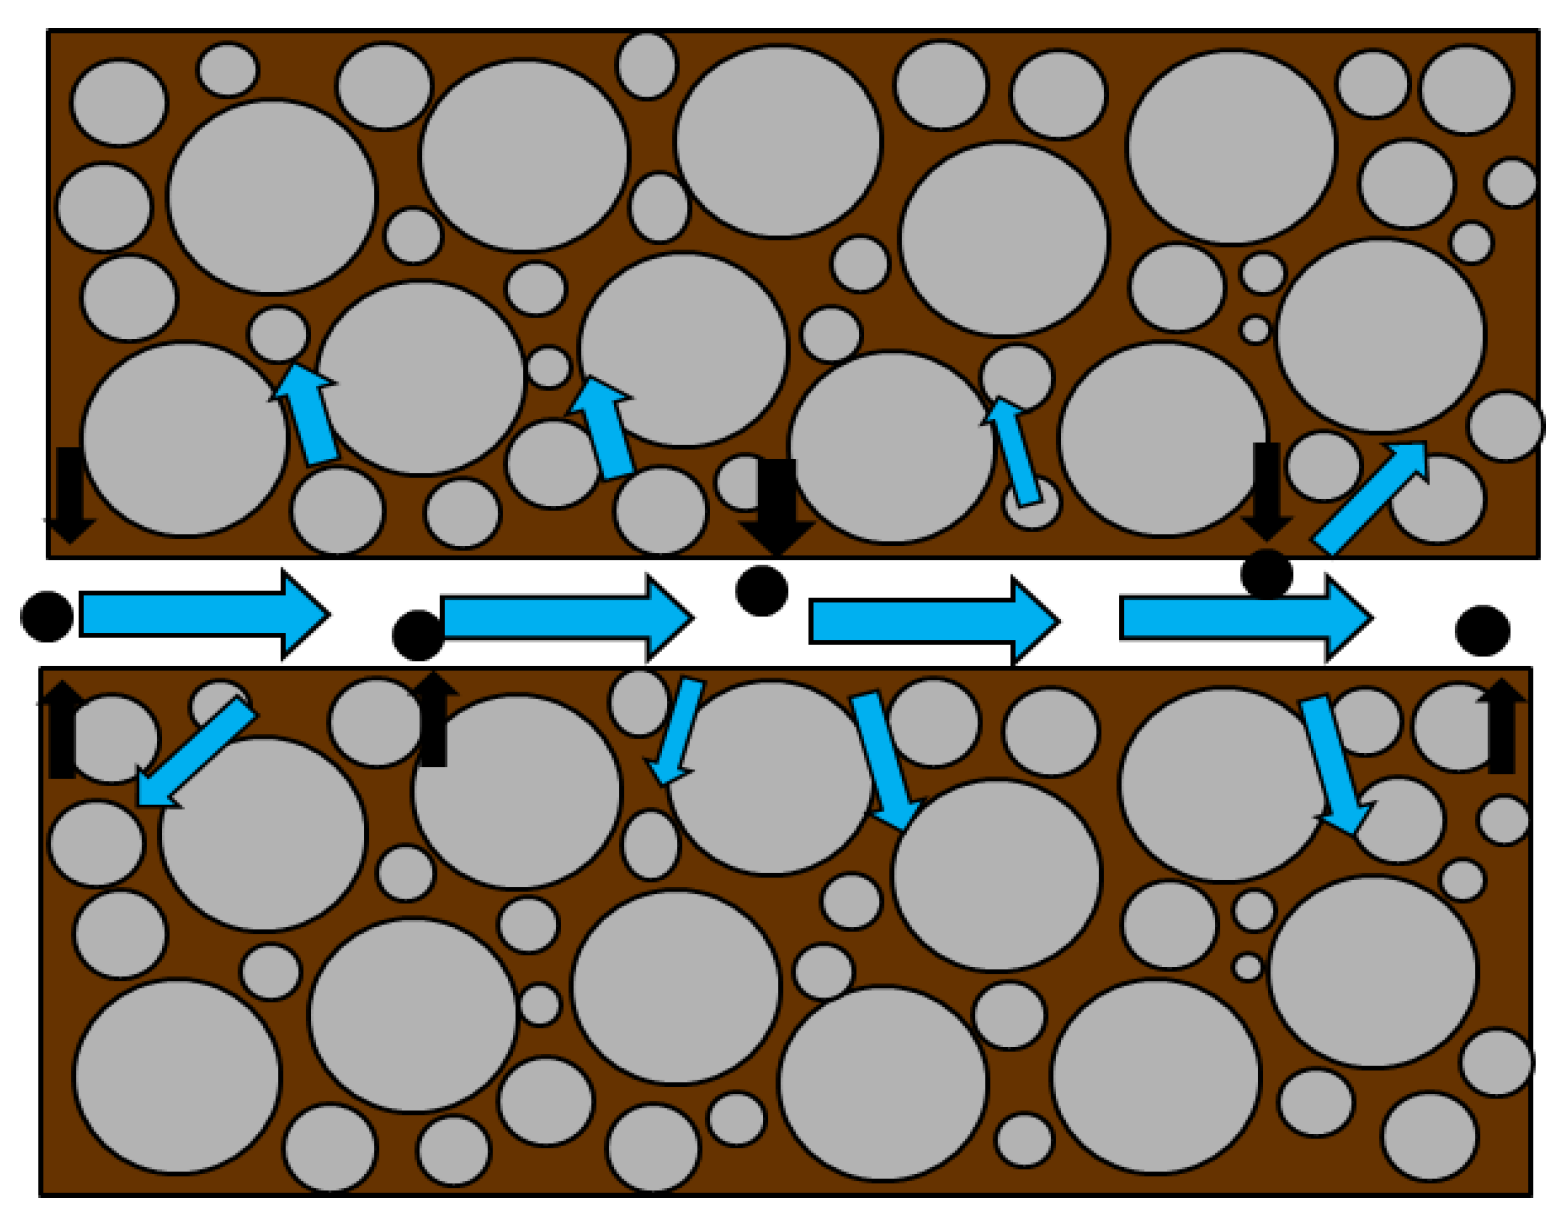
Figure 7.
Upstream pressure variation with time: (a)with different downstream pressures; (b) with a same downstream pressure.
Figure 7.
Upstream pressure variation with time: (a)with different downstream pressures; (b) with a same downstream pressure.
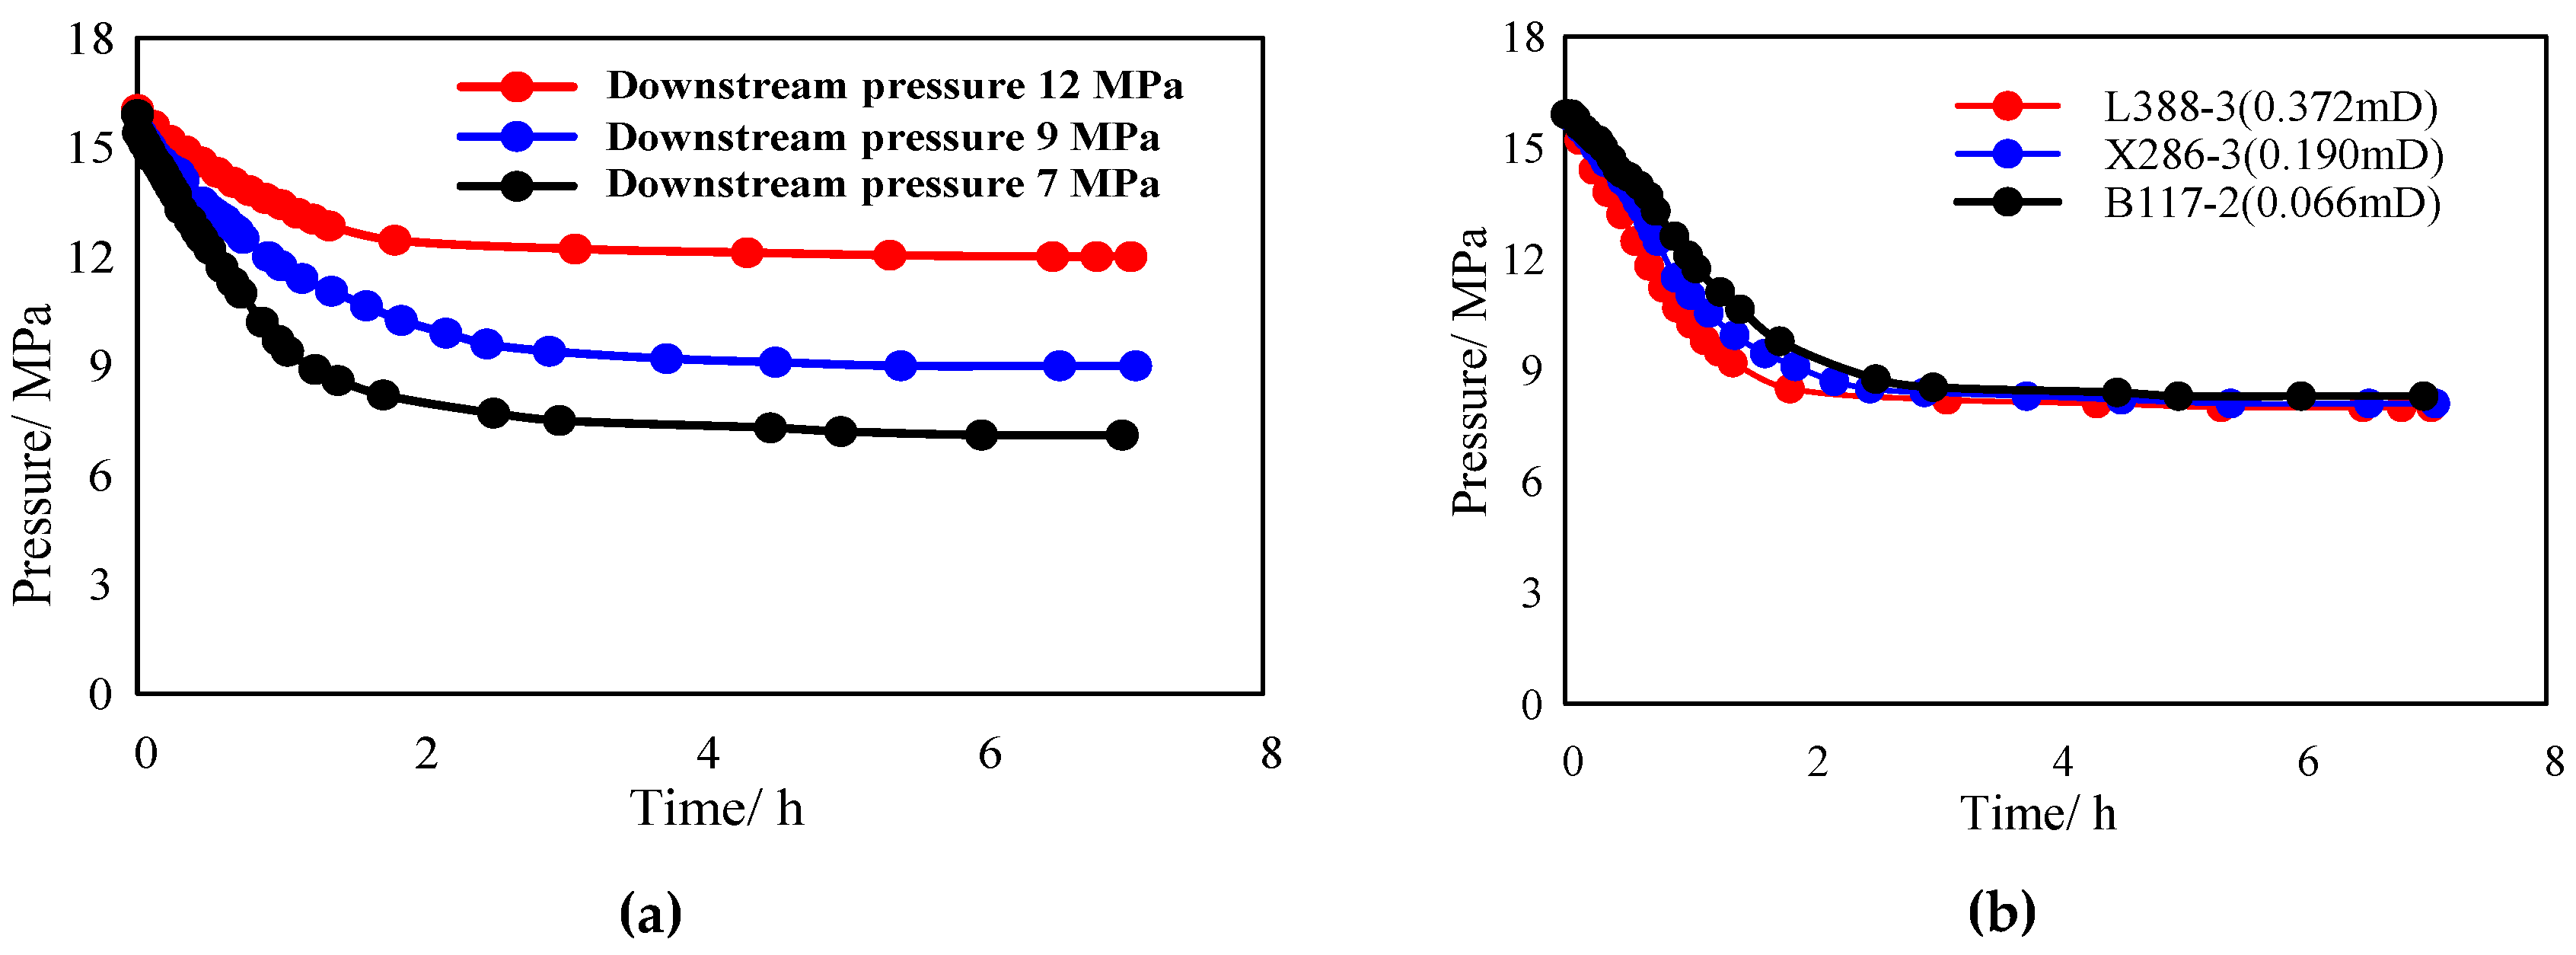
Figure 8.
Recovery factor variation with time: (a)with different downstream pressures; (b) with a same downstream pressure.
Figure 8.
Recovery factor variation with time: (a)with different downstream pressures; (b) with a same downstream pressure.
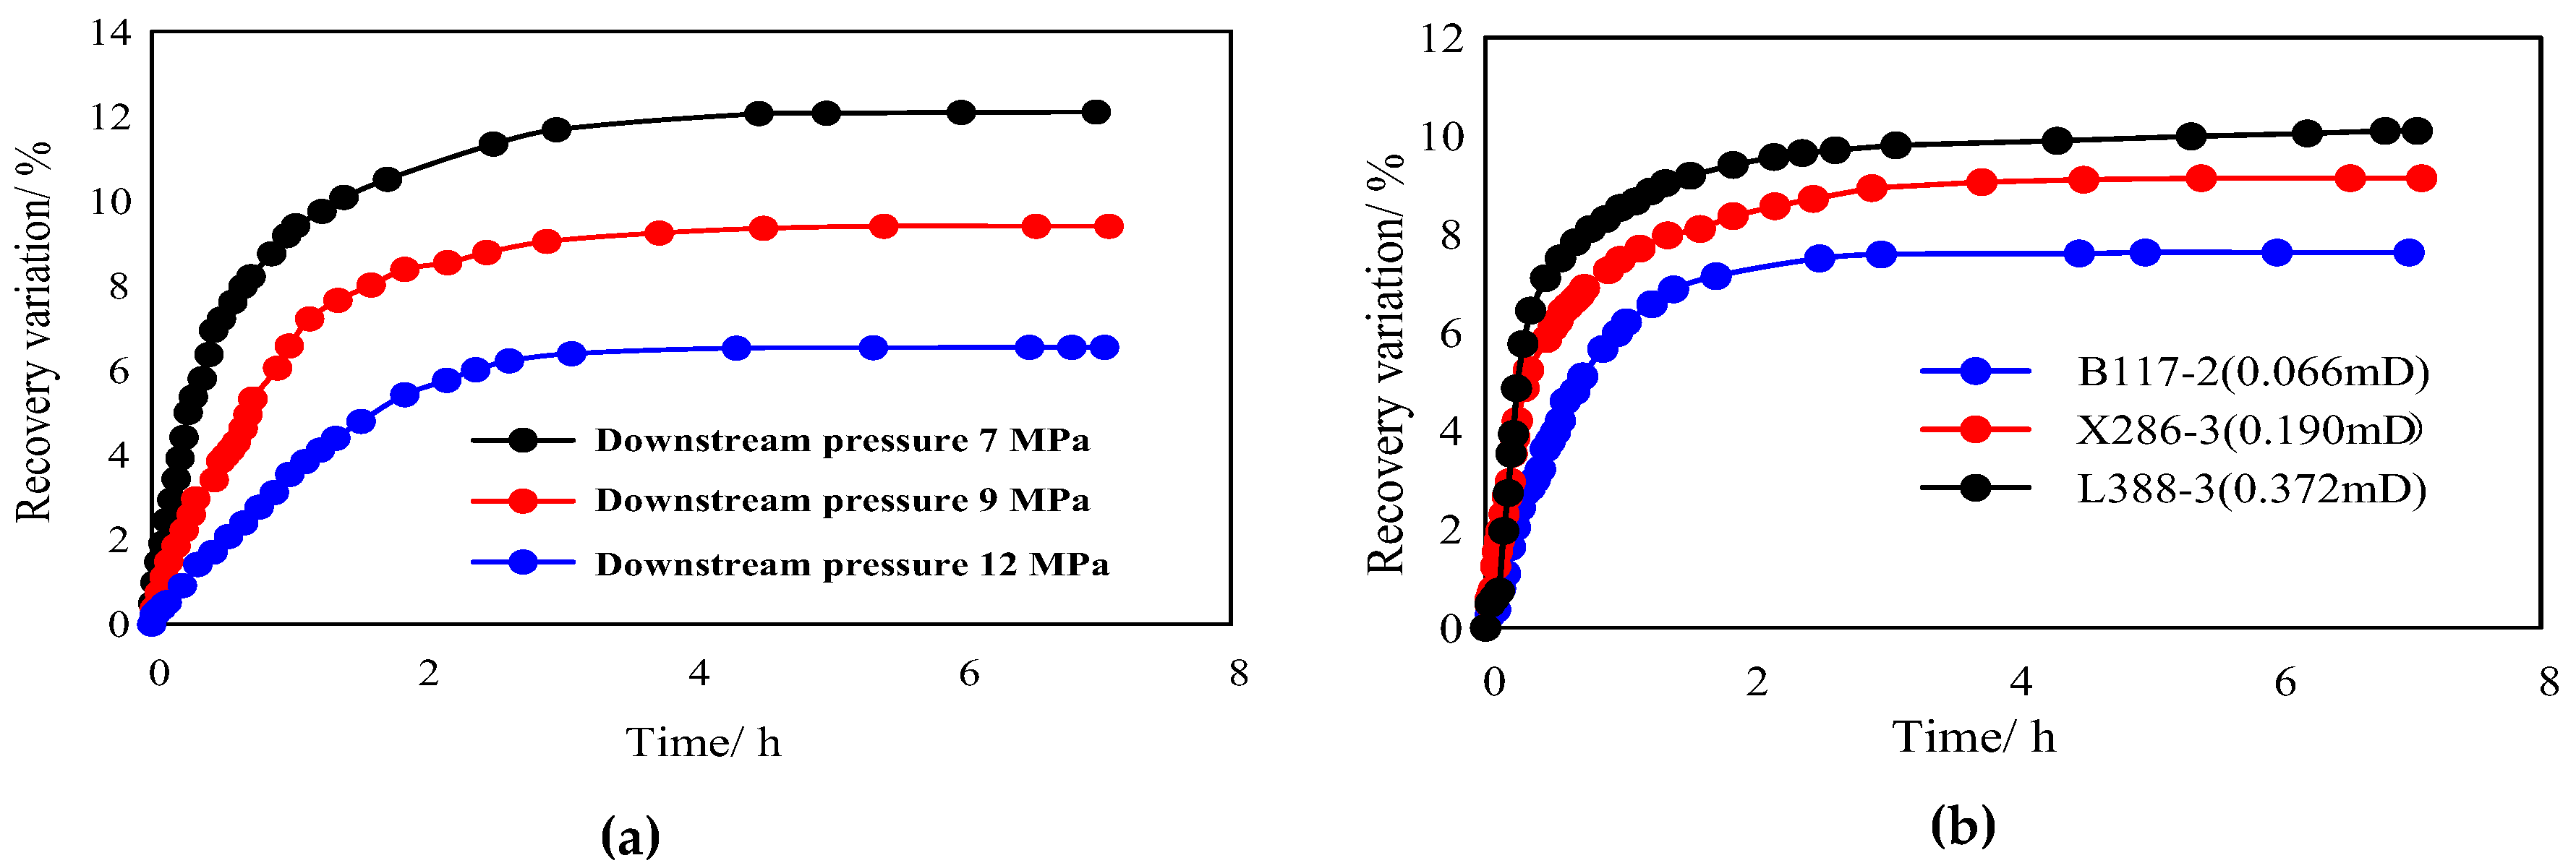
Figure 9.
T₂ spectra showing crude oil mobilization characteristics under different circumstances: (a)under different downstream pressures; (b) under a same downstream pressure.
Figure 9.
T₂ spectra showing crude oil mobilization characteristics under different circumstances: (a)under different downstream pressures; (b) under a same downstream pressure.
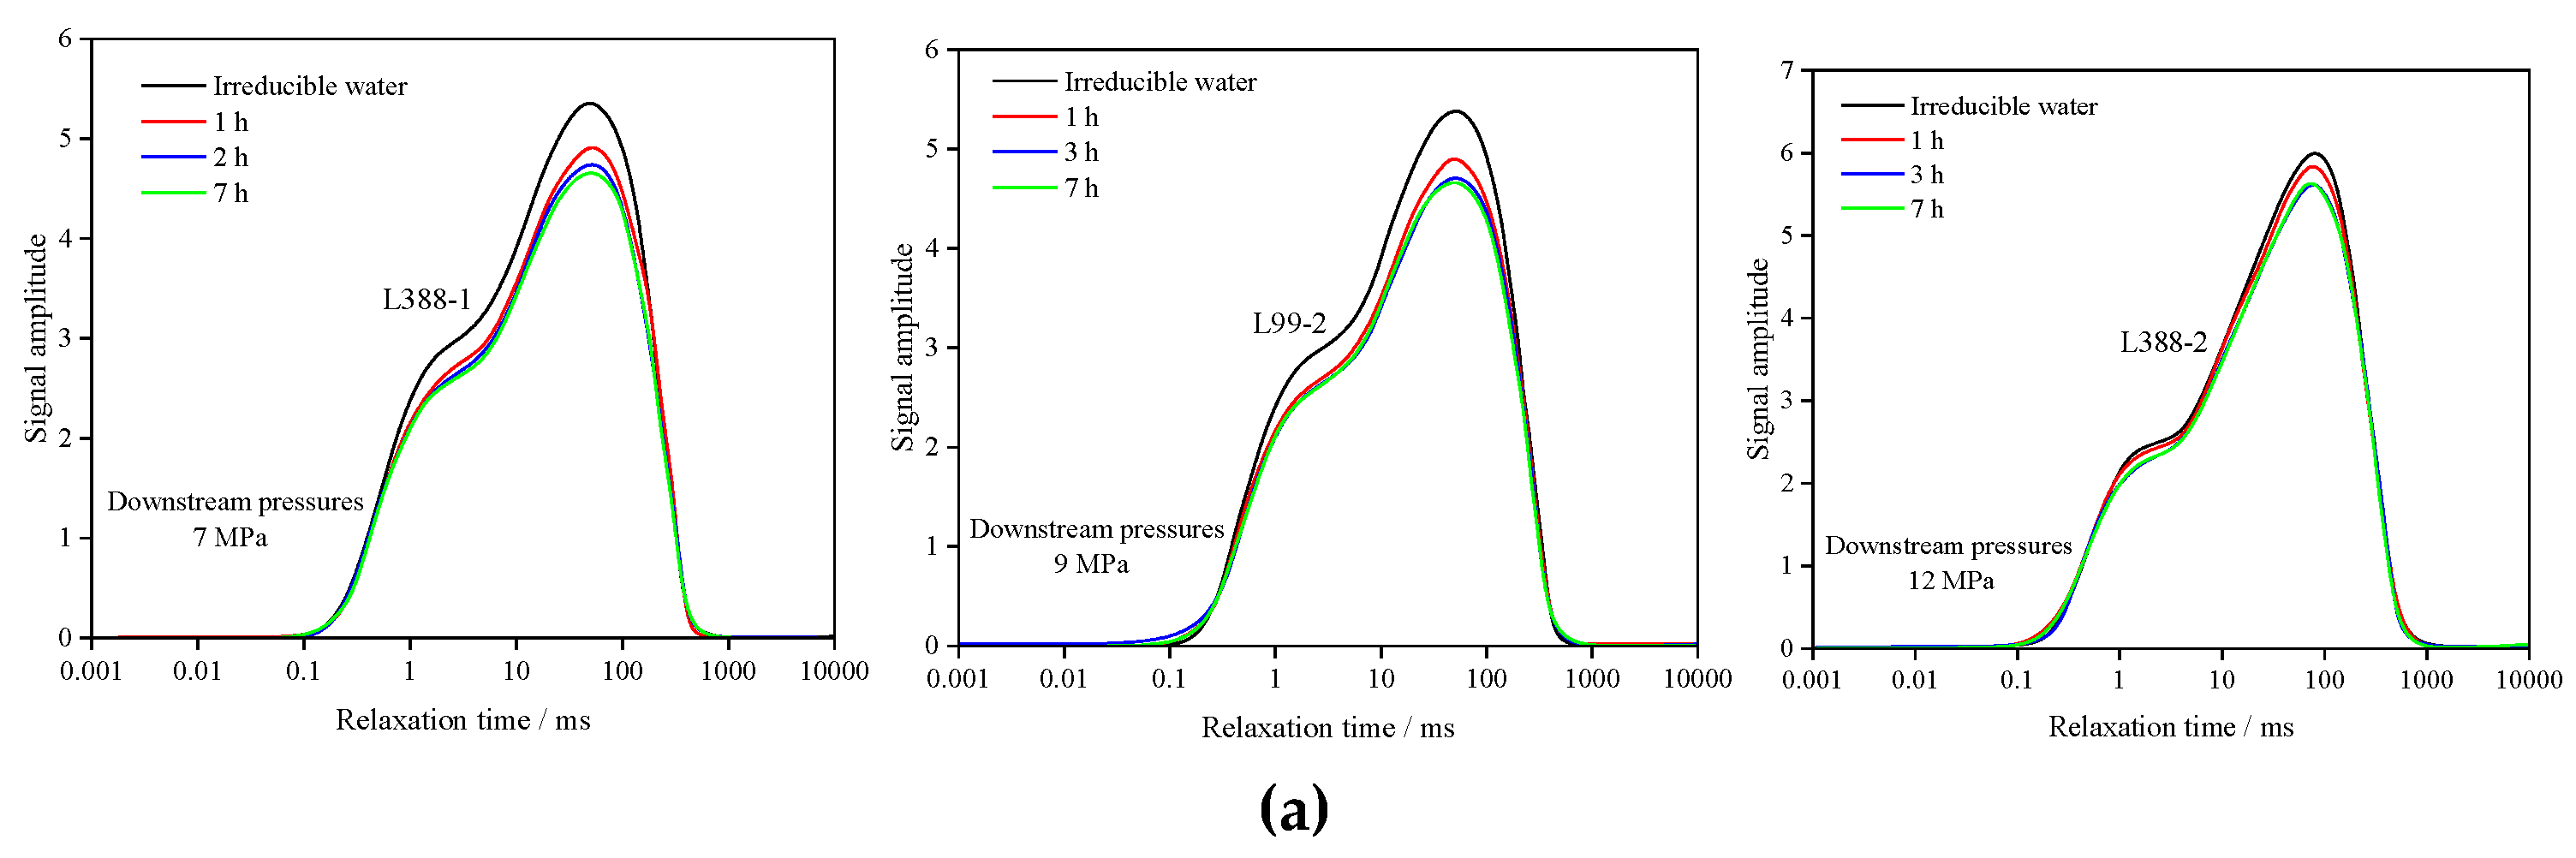
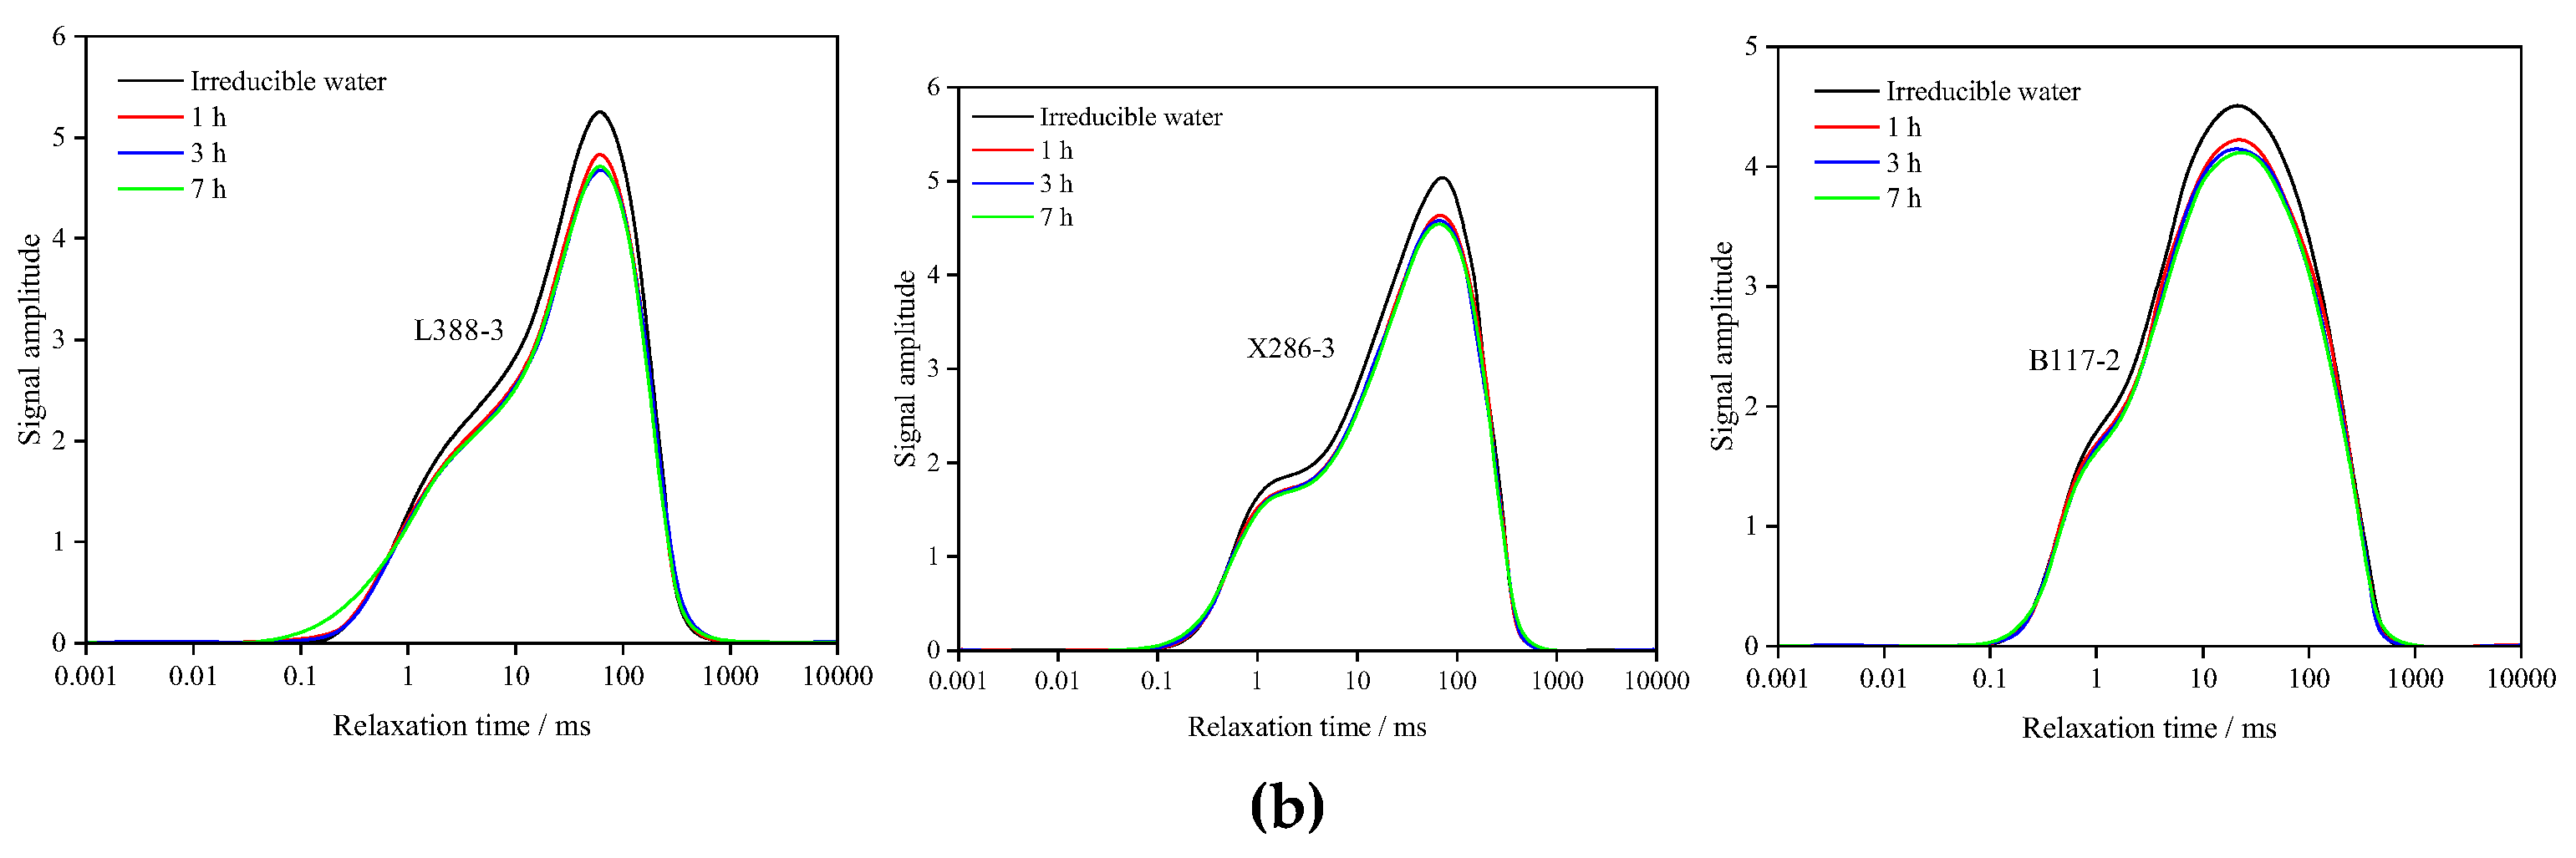
Figure 10.
Recovery under the same downstream pressure.
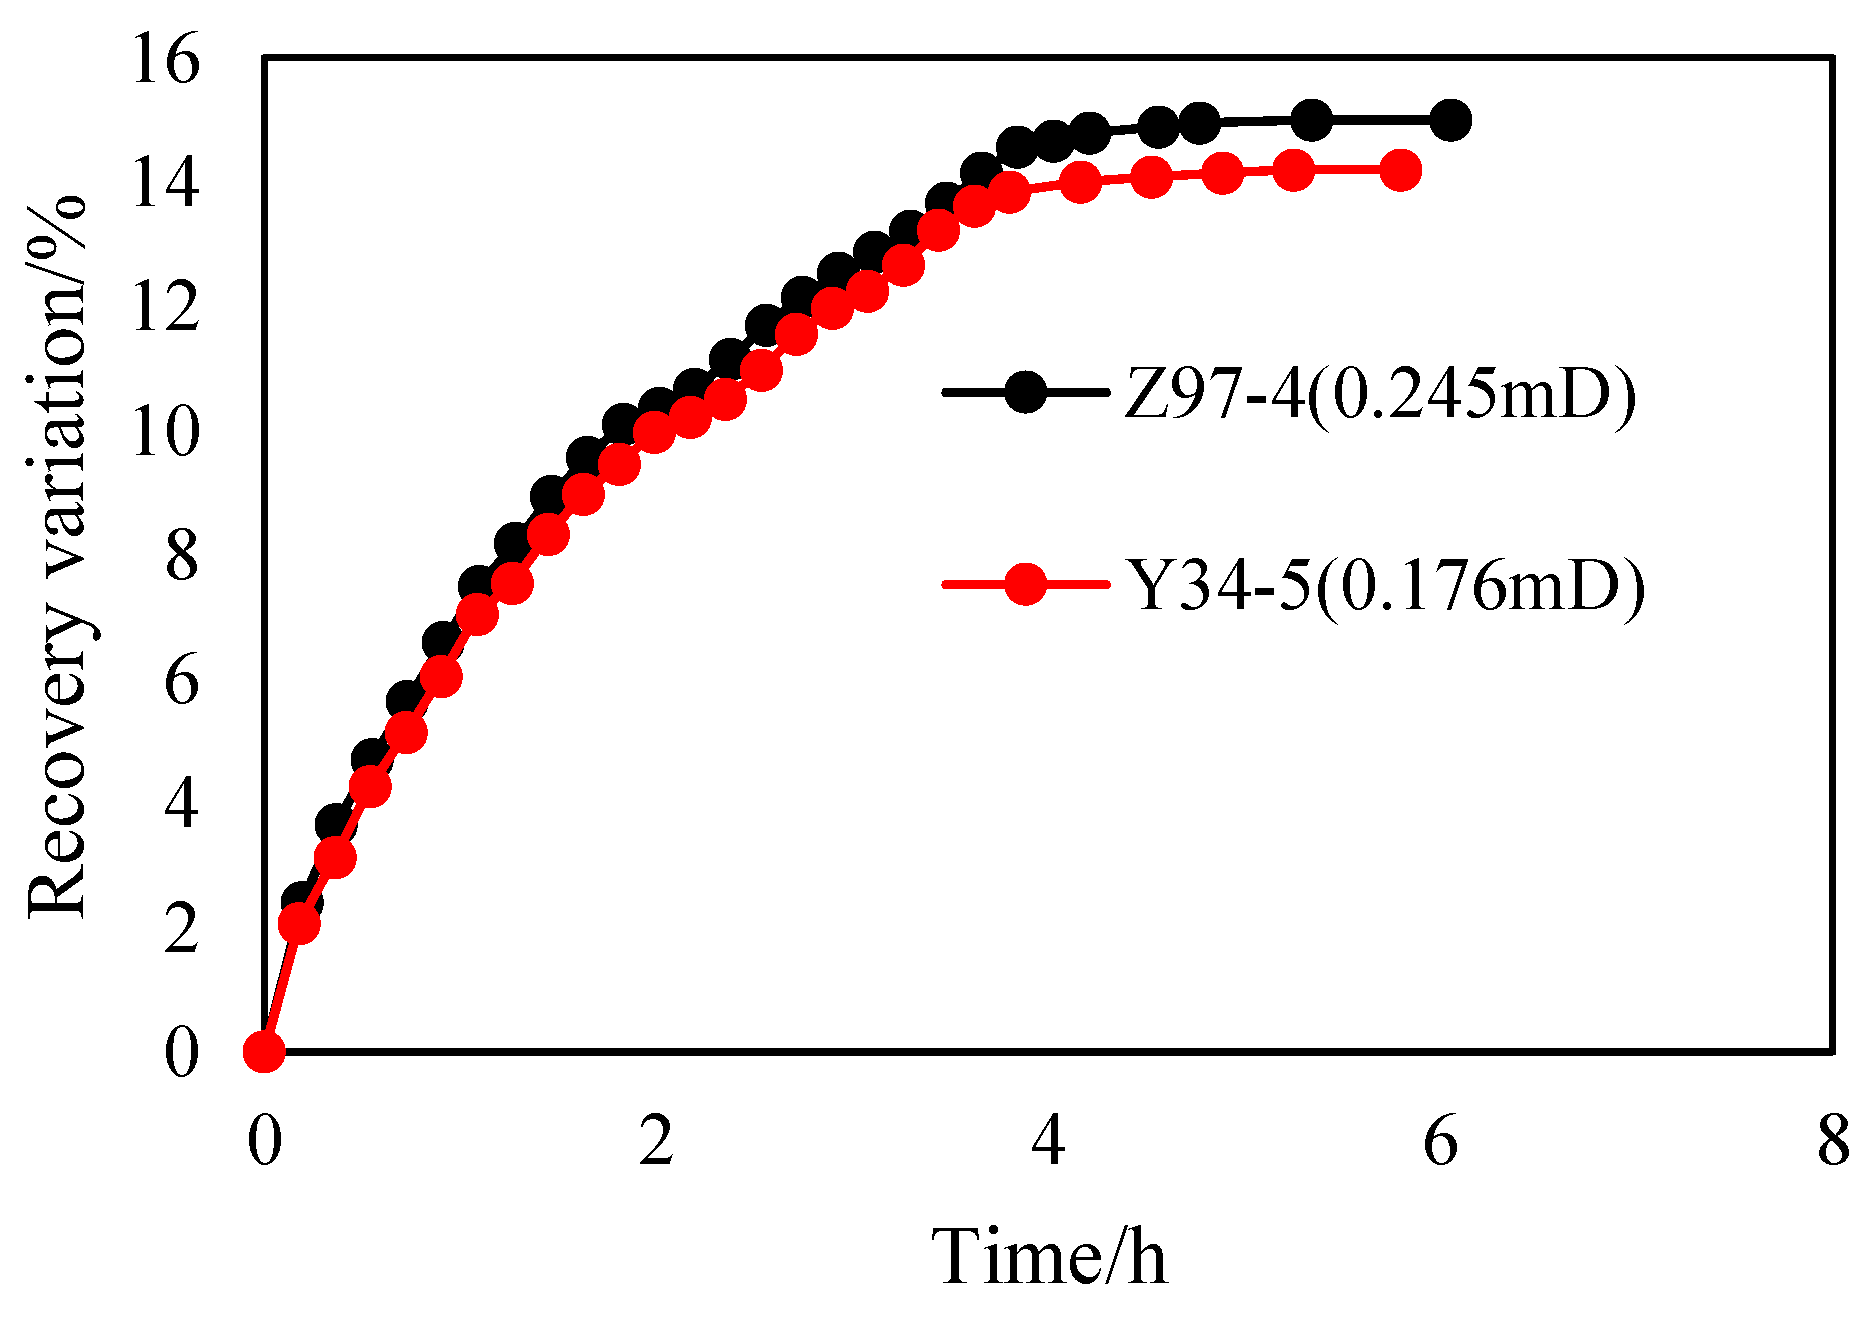
Figure 11.
T₂ spectra for live oil elastic depletion under reservoir conditions: (a) Z97-4; (b) Y34-5.
Figure 11.
T₂ spectra for live oil elastic depletion under reservoir conditions: (a) Z97-4; (b) Y34-5.
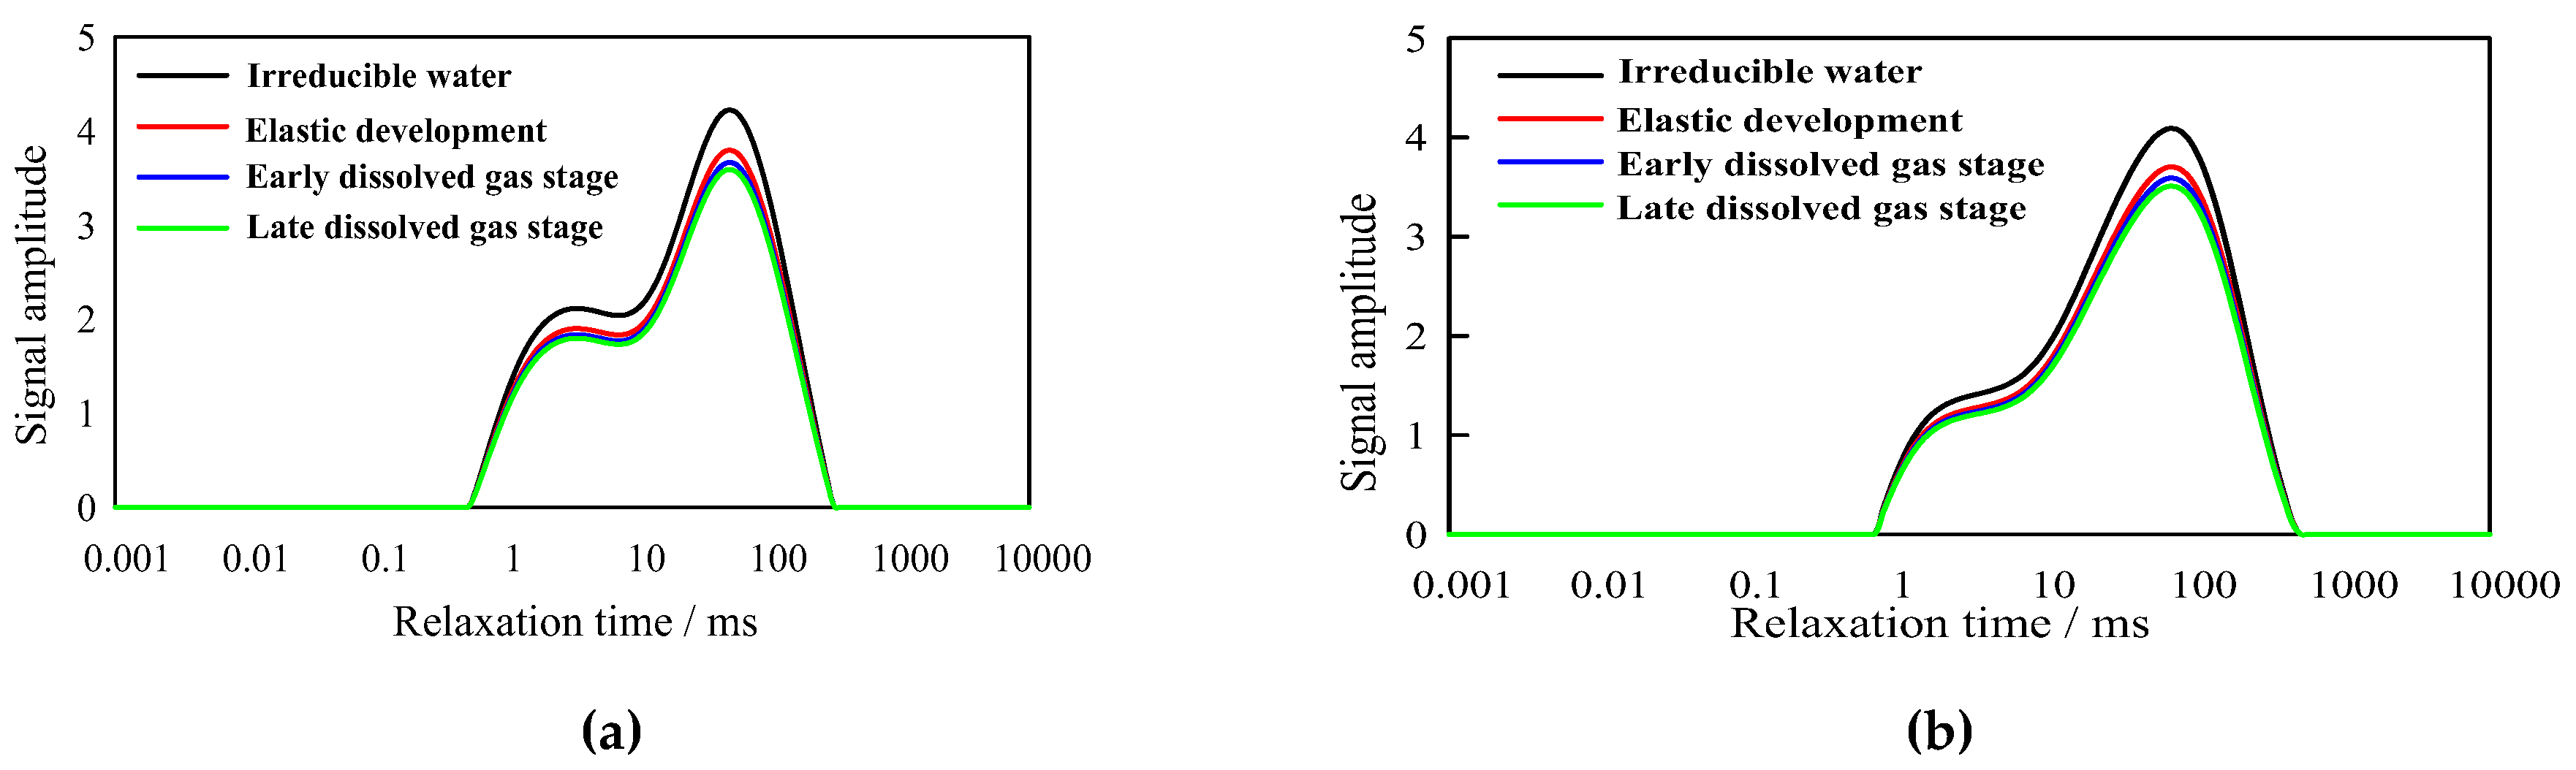
Figure 12.
Depletion recovery factor under different permeability conditions.
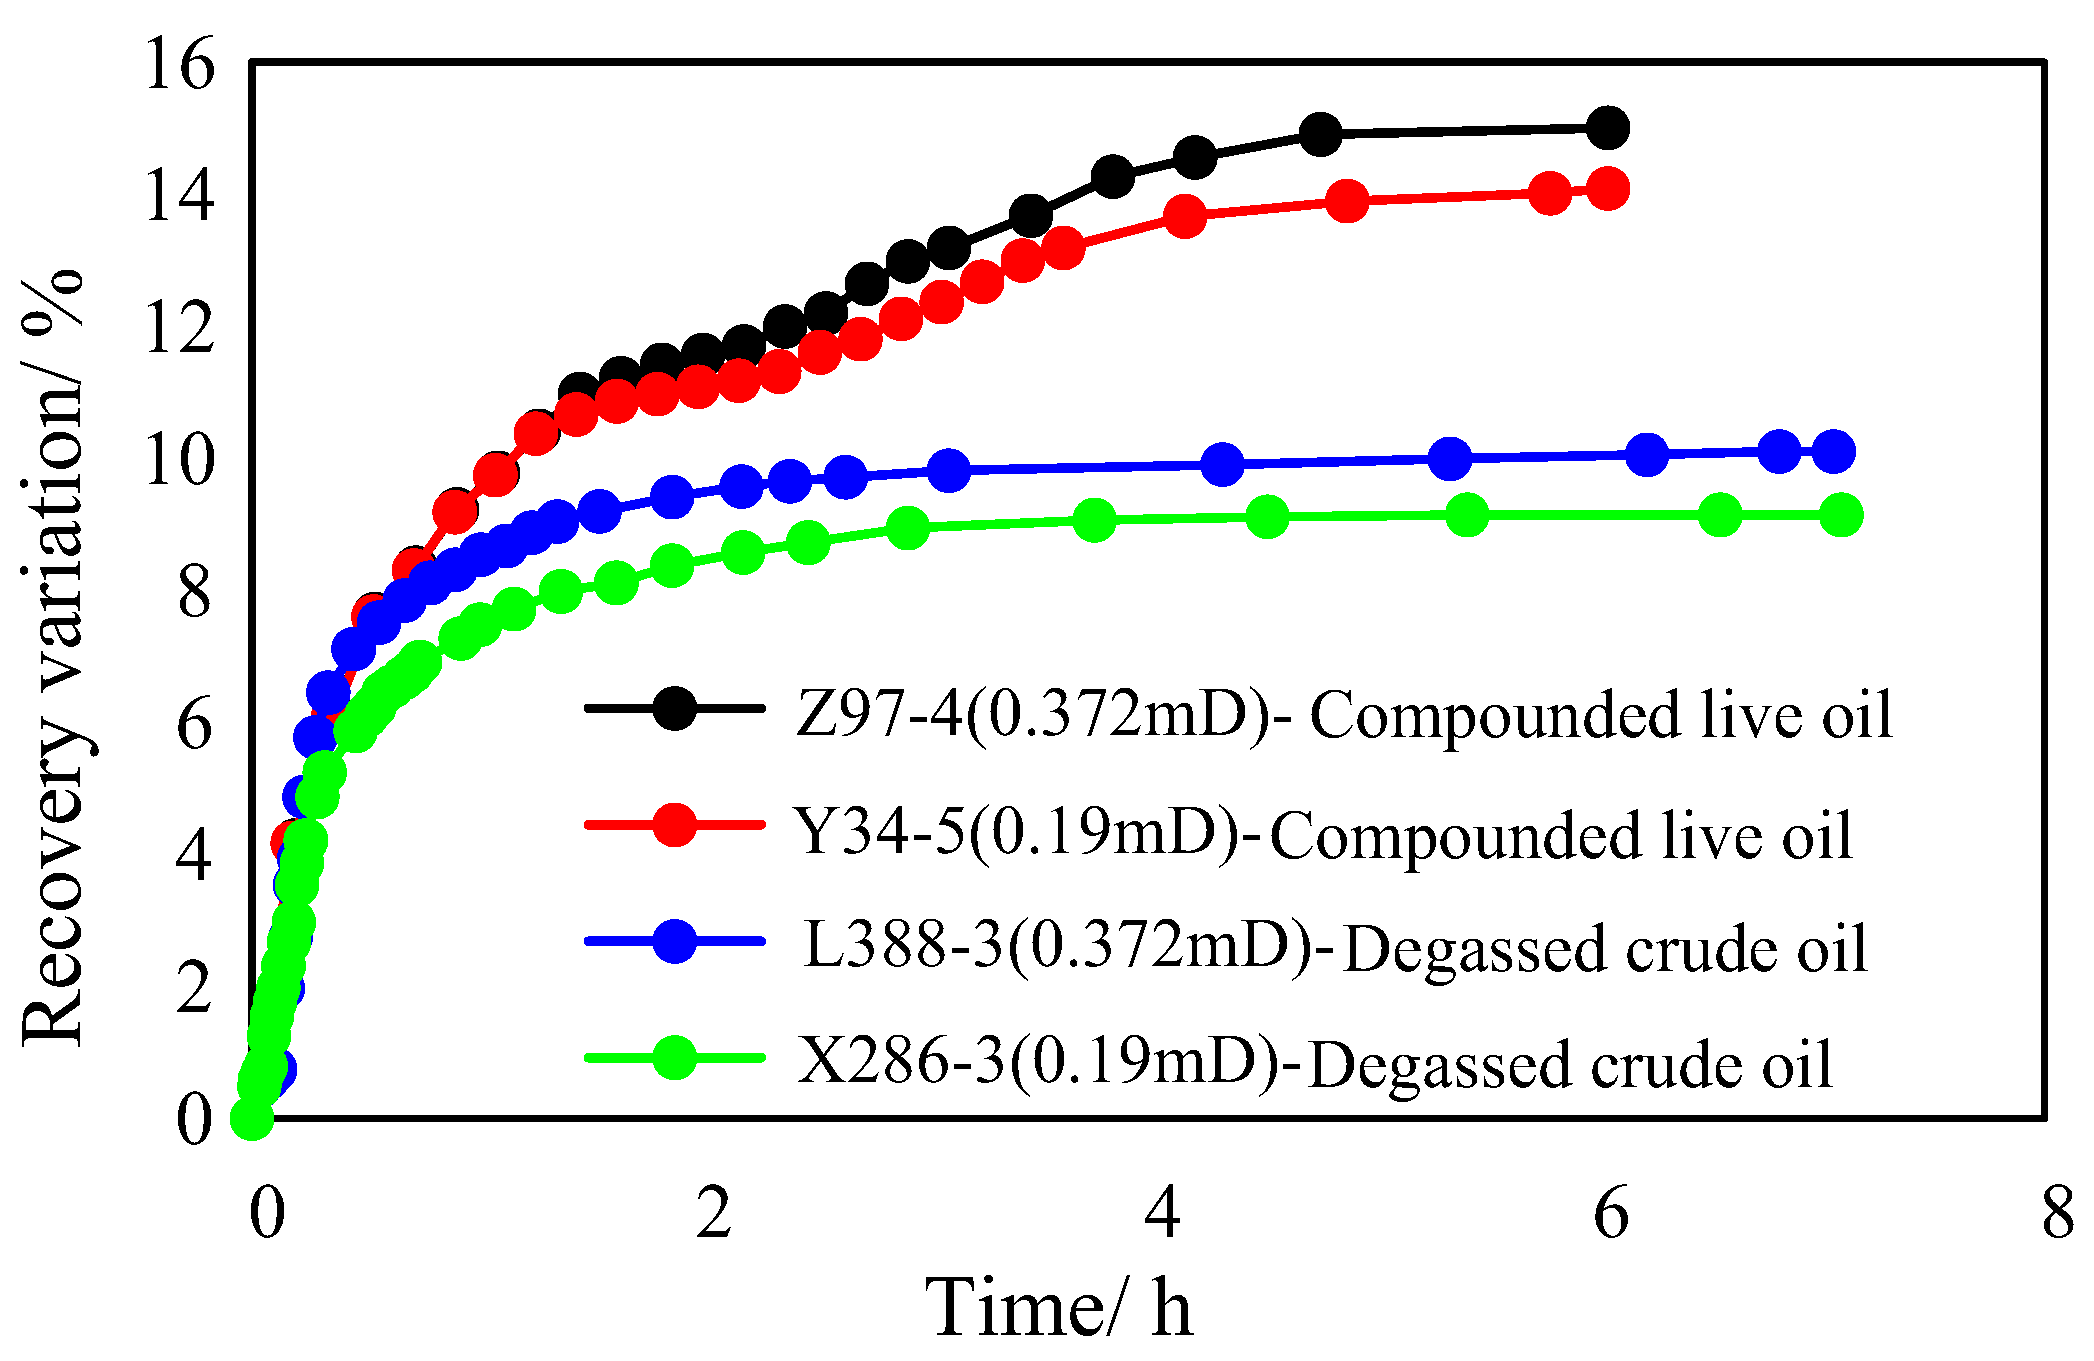
Figure 13.
Imbibition recovery factor of shale oil reservoir under different injected fluid volumes.
Figure 13.
Imbibition recovery factor of shale oil reservoir under different injected fluid volumes.
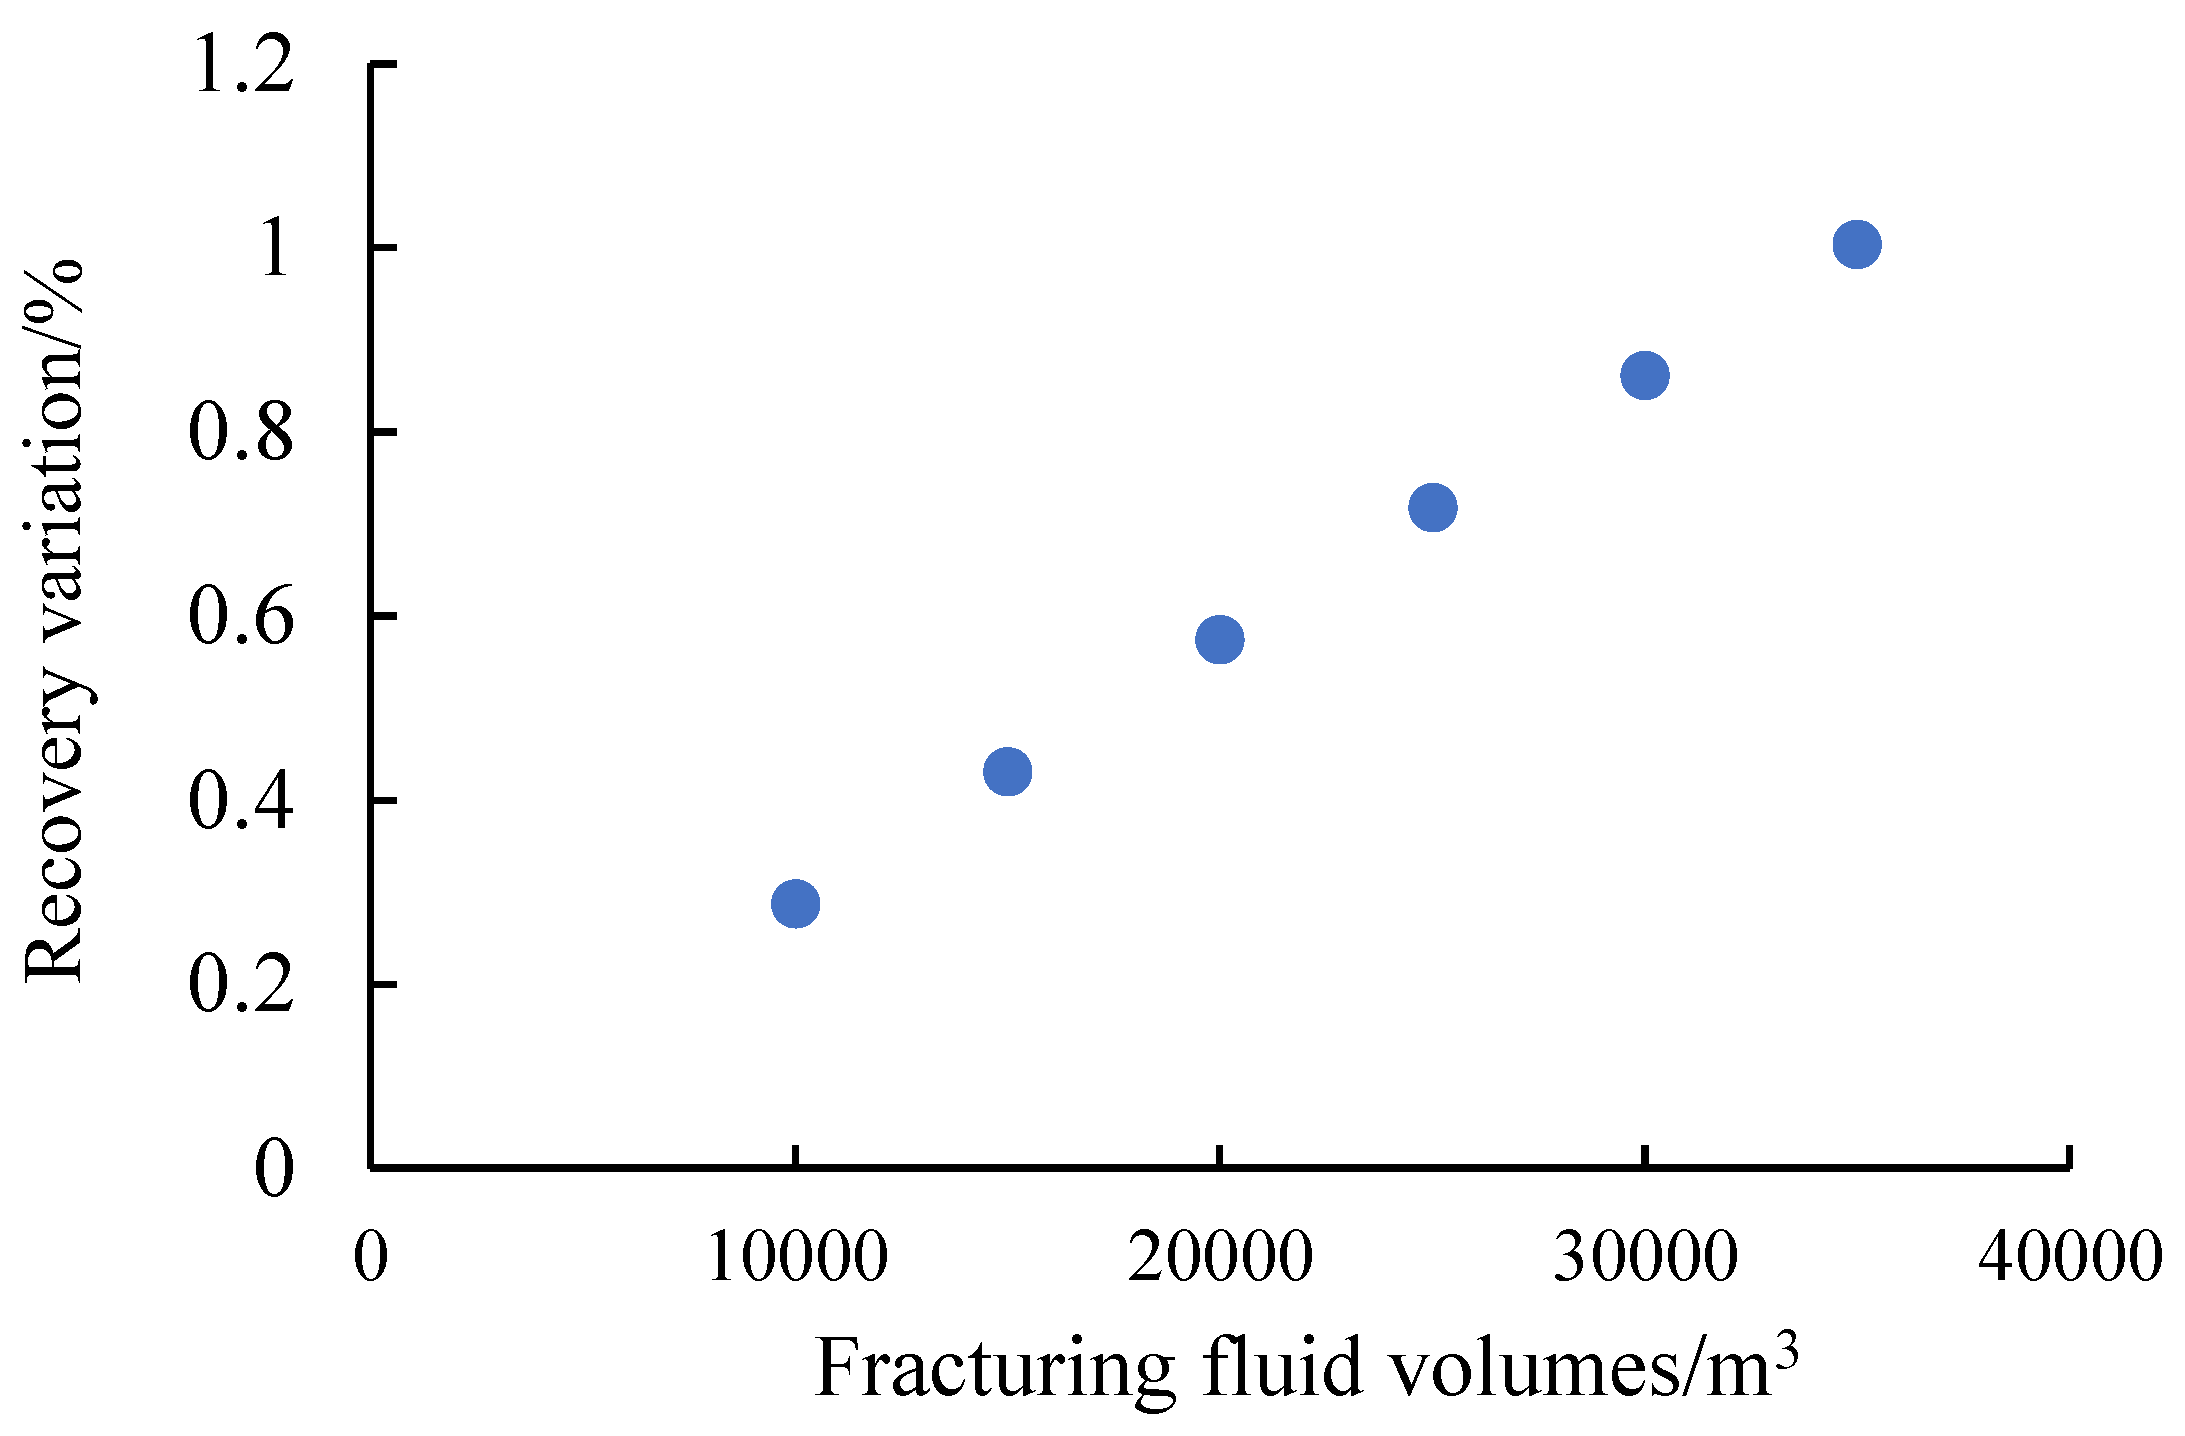
Figure 14.
Recovery factors contributed by fracturing fluid elastic energy and reservoir elastic energies.
Figure 14.
Recovery factors contributed by fracturing fluid elastic energy and reservoir elastic energies.
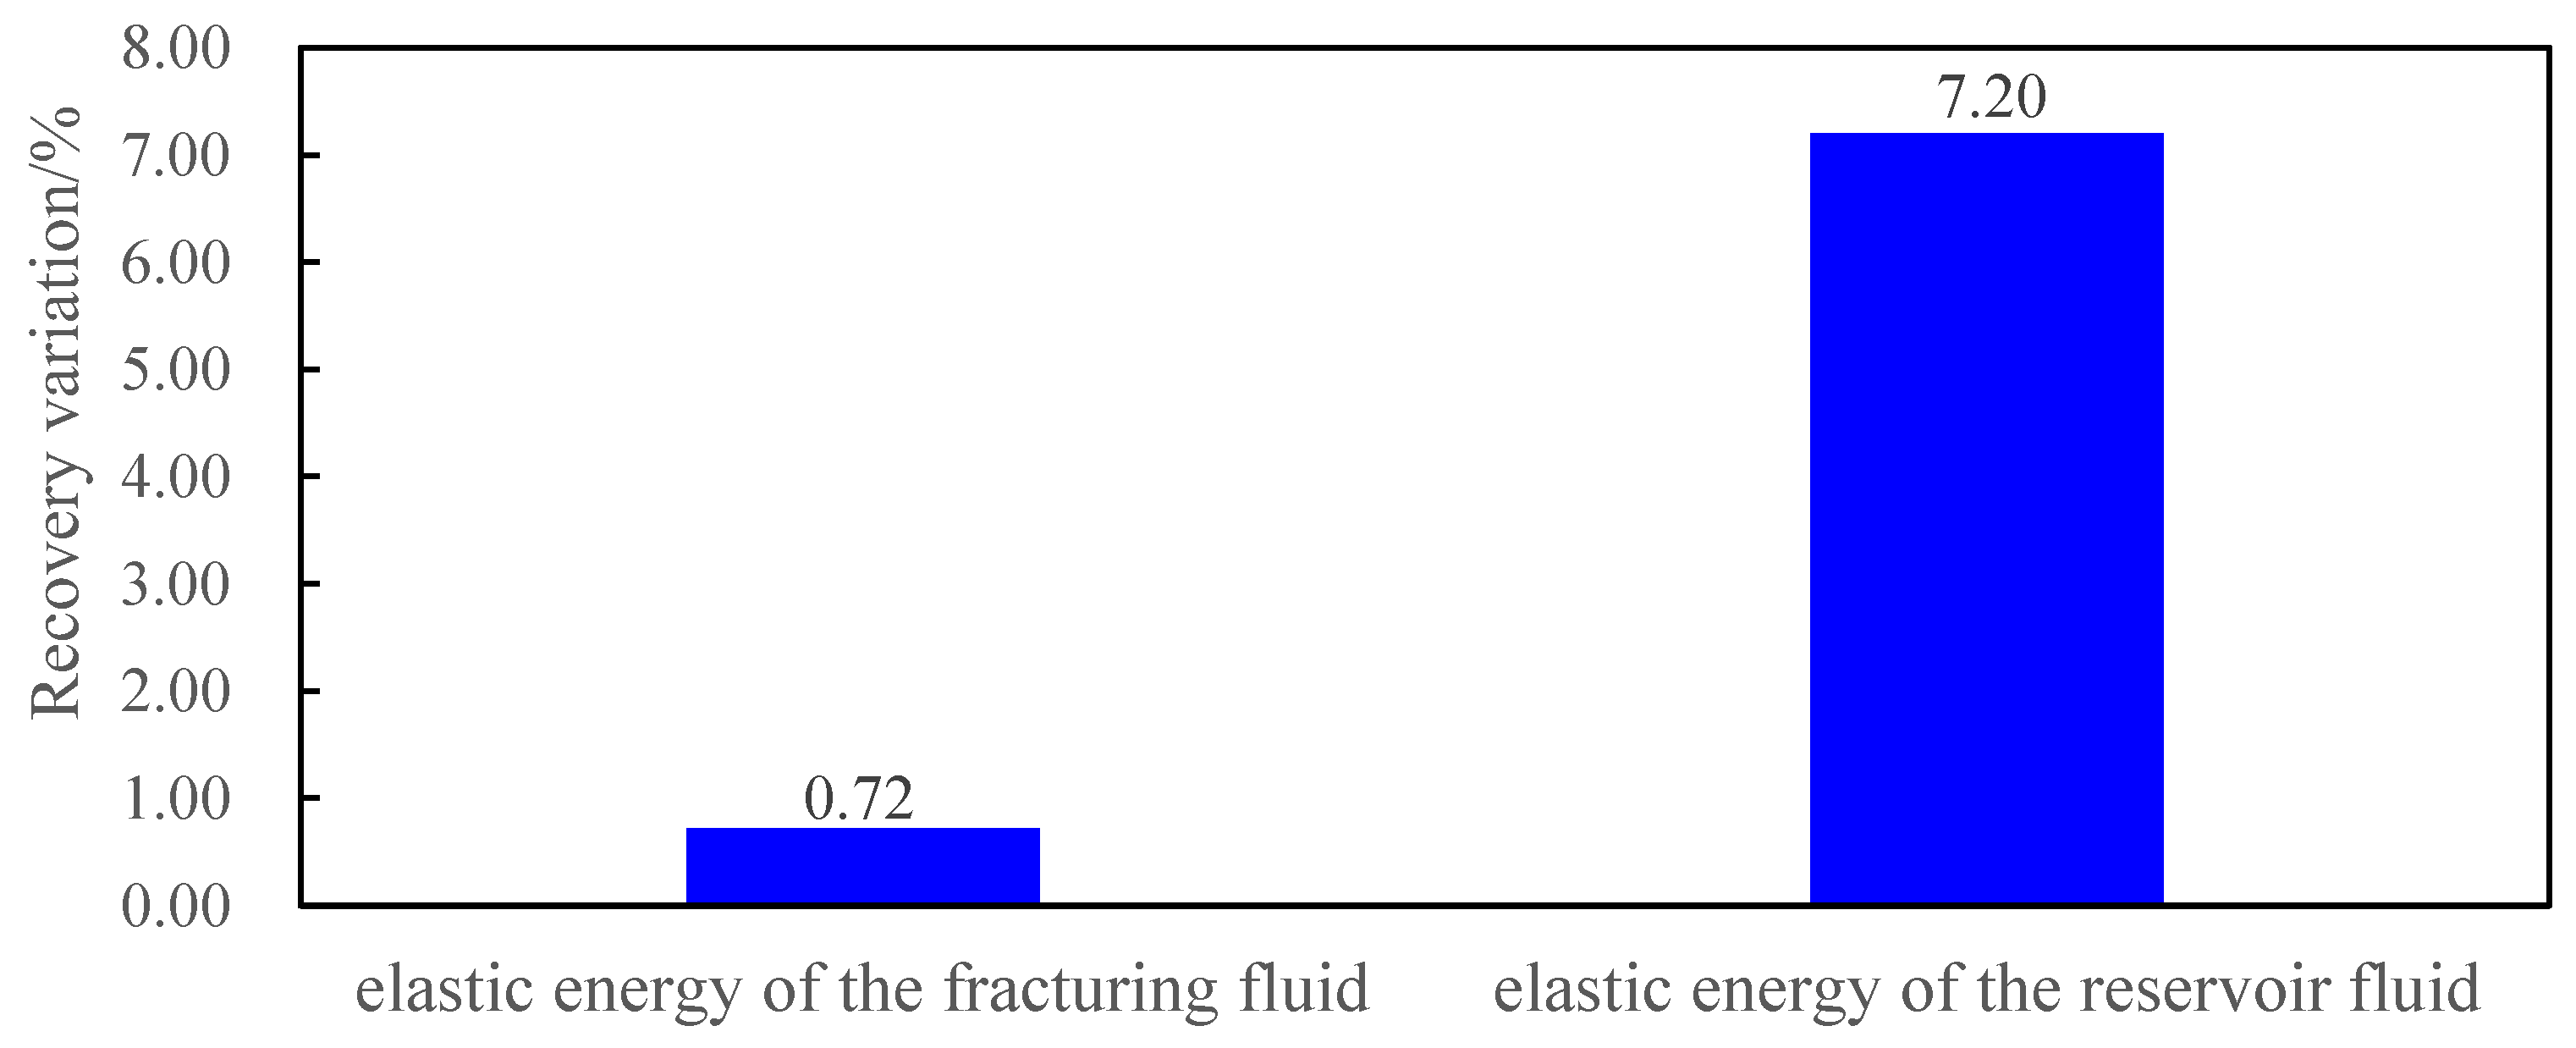
Figure 15.
Formation pressure under different fracturing fluid volumes.
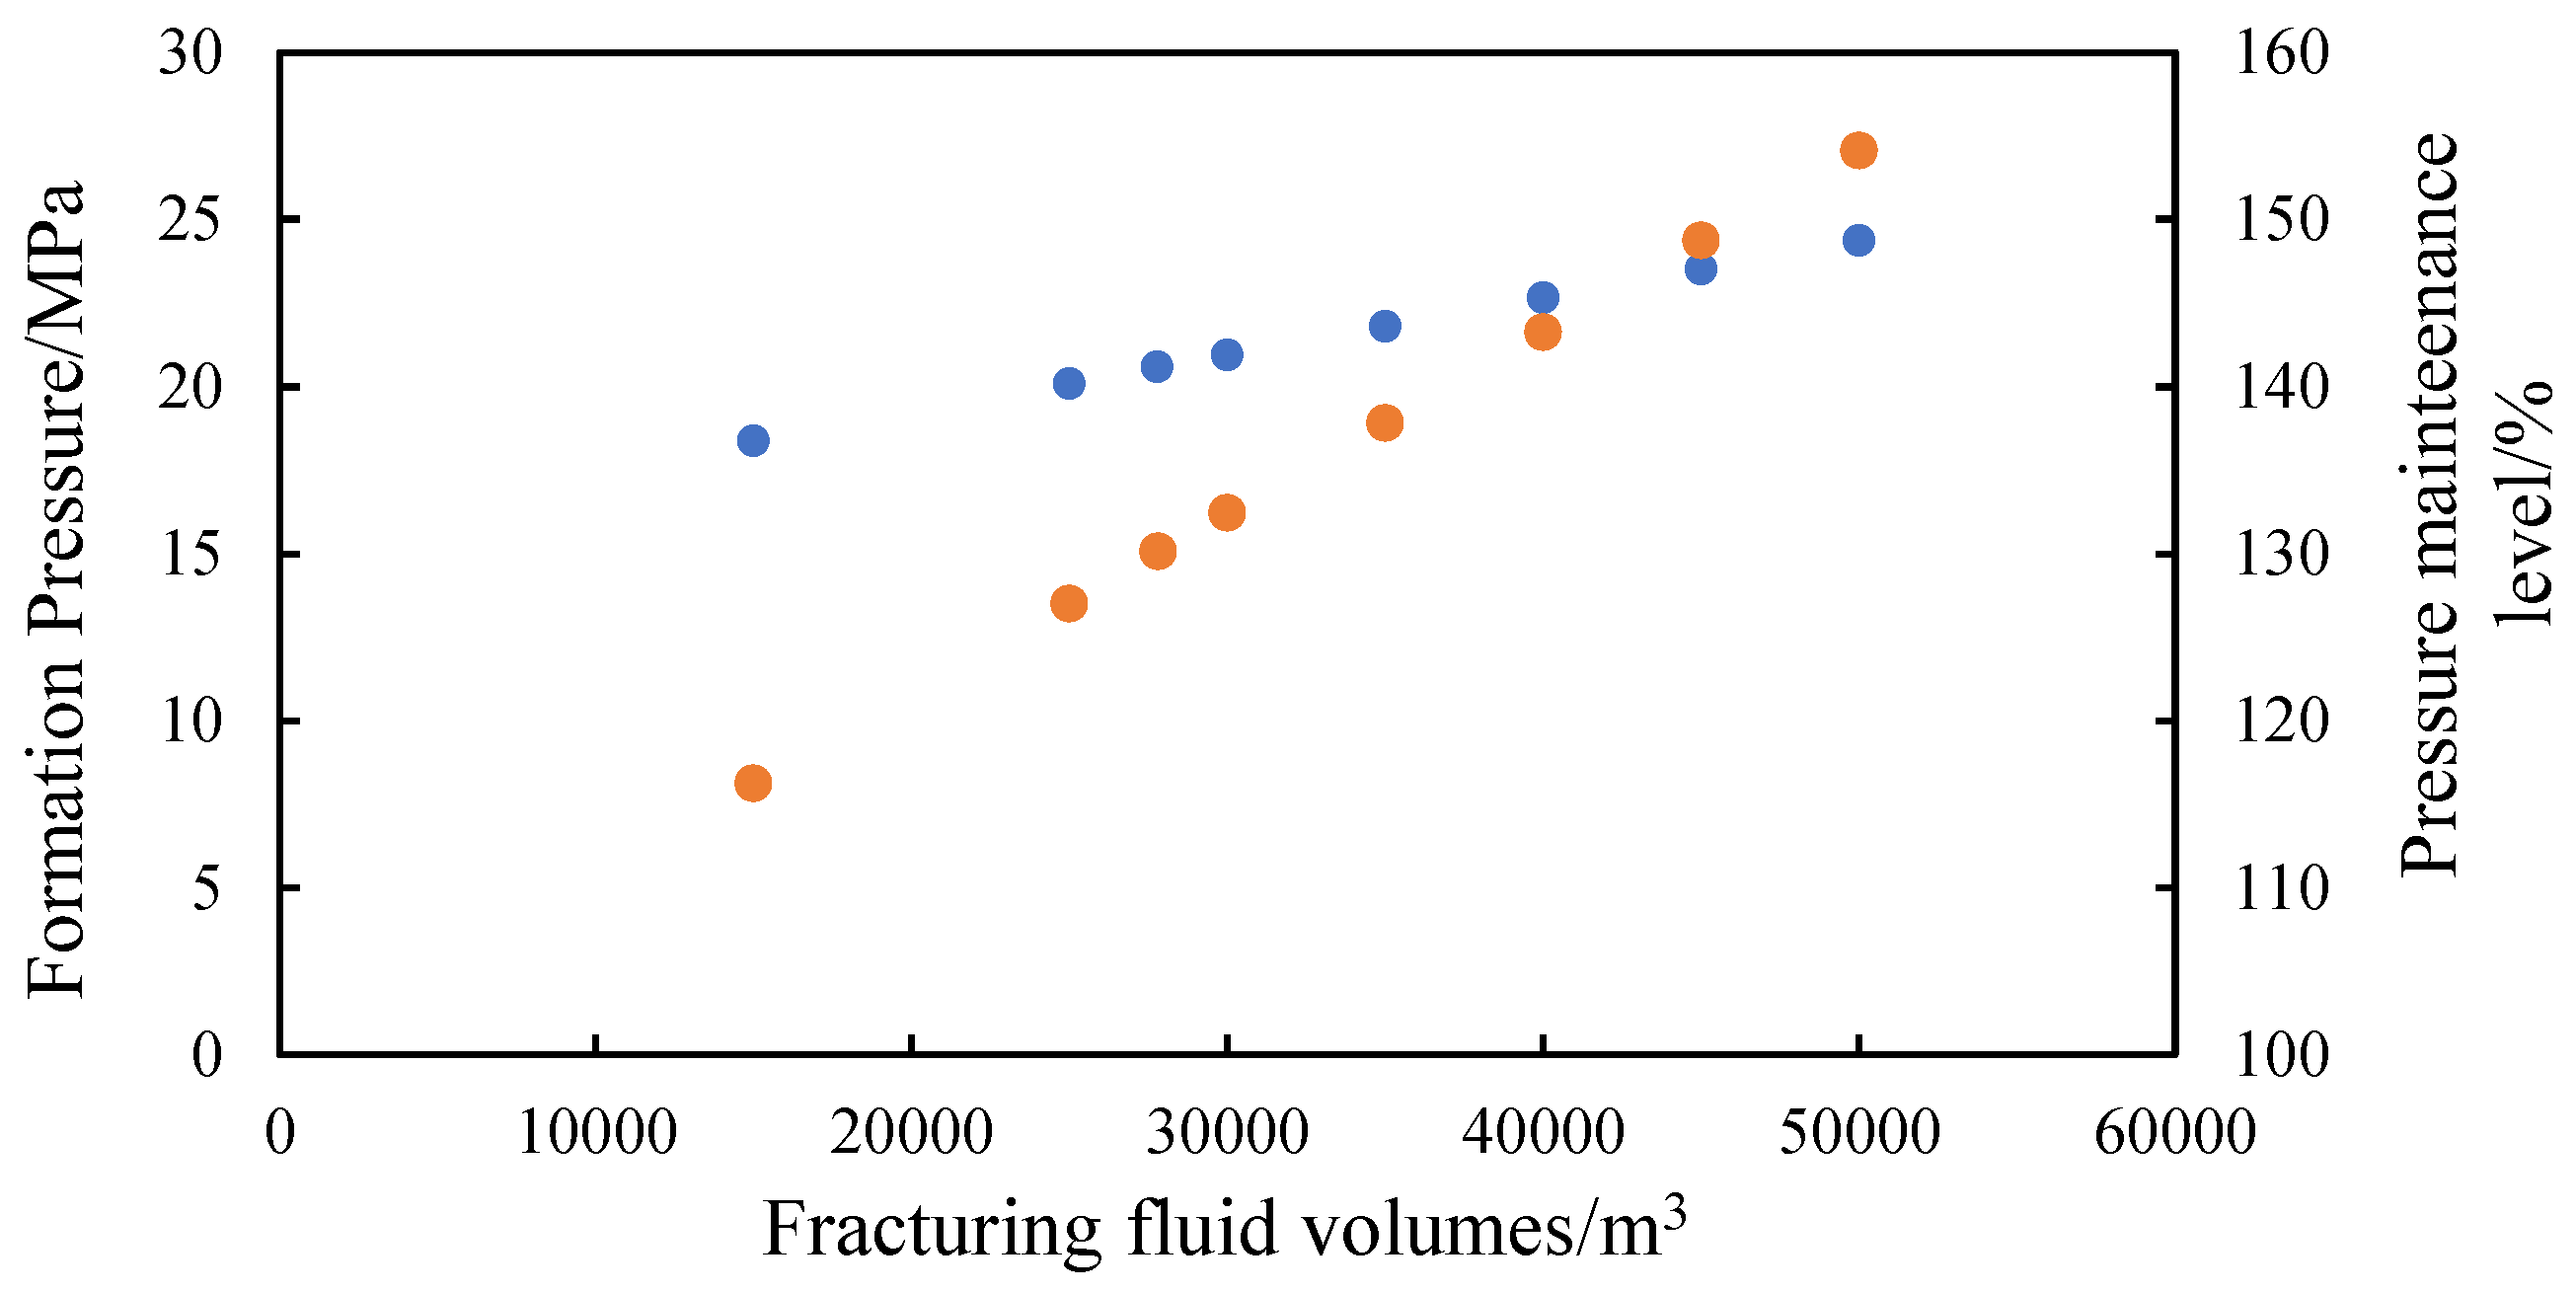
Figure 16.
Daily oil rates under different energy sources.
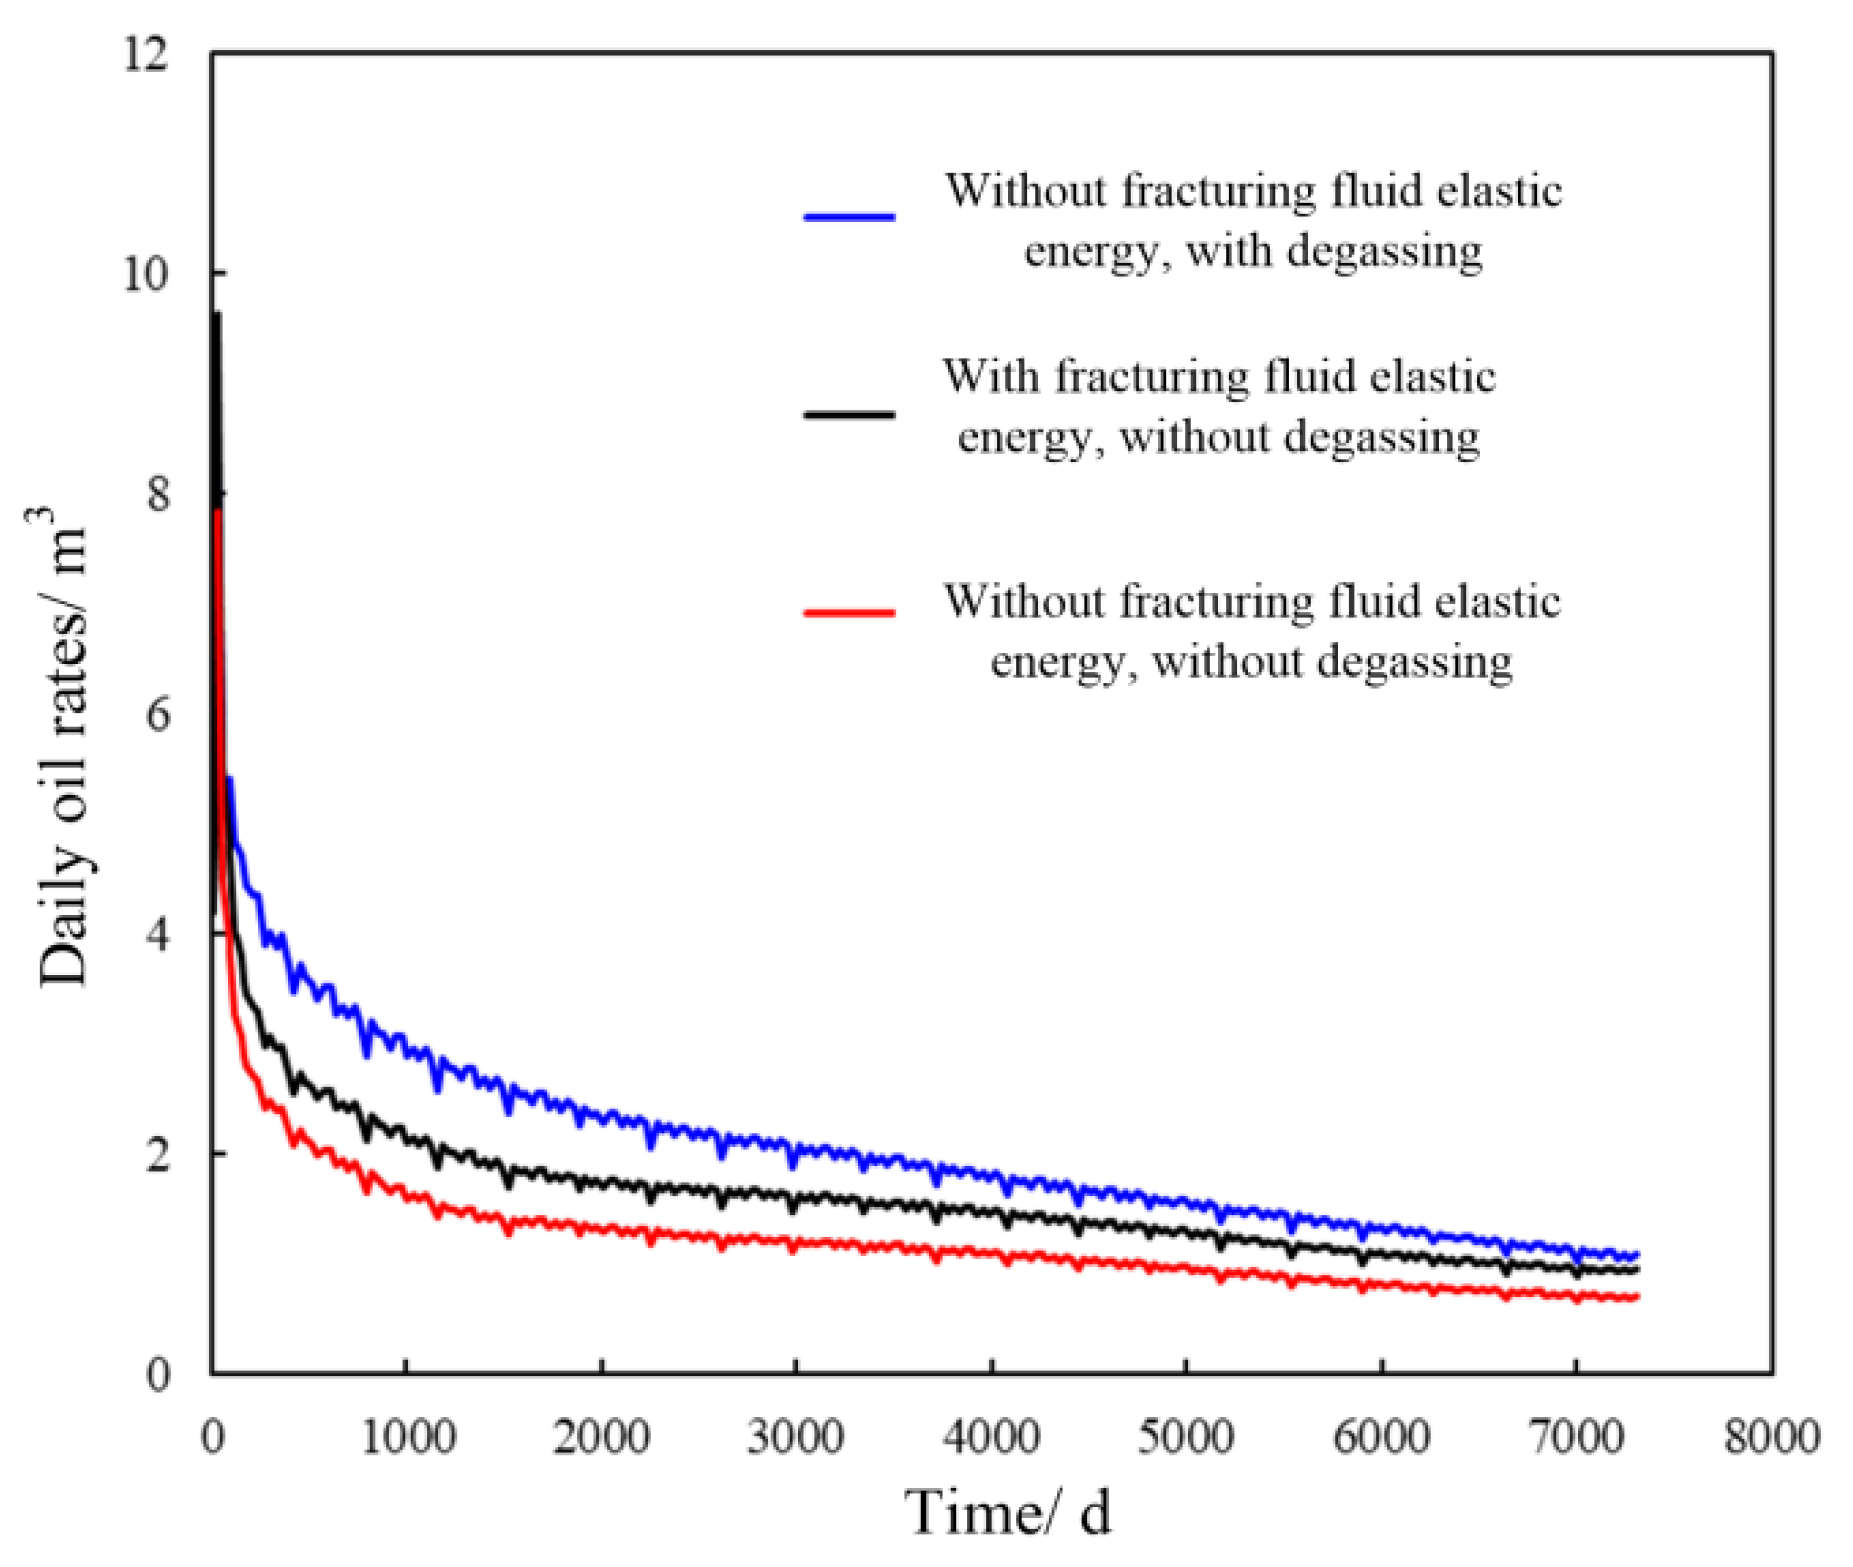
Figure 17.
Contribution rates of different energy sources to the total recovery factor obtained via different methods: (a)Reservoir engineering calculation results; (b) Numerical simulation results.
Figure 17.
Contribution rates of different energy sources to the total recovery factor obtained via different methods: (a)Reservoir engineering calculation results; (b) Numerical simulation results.
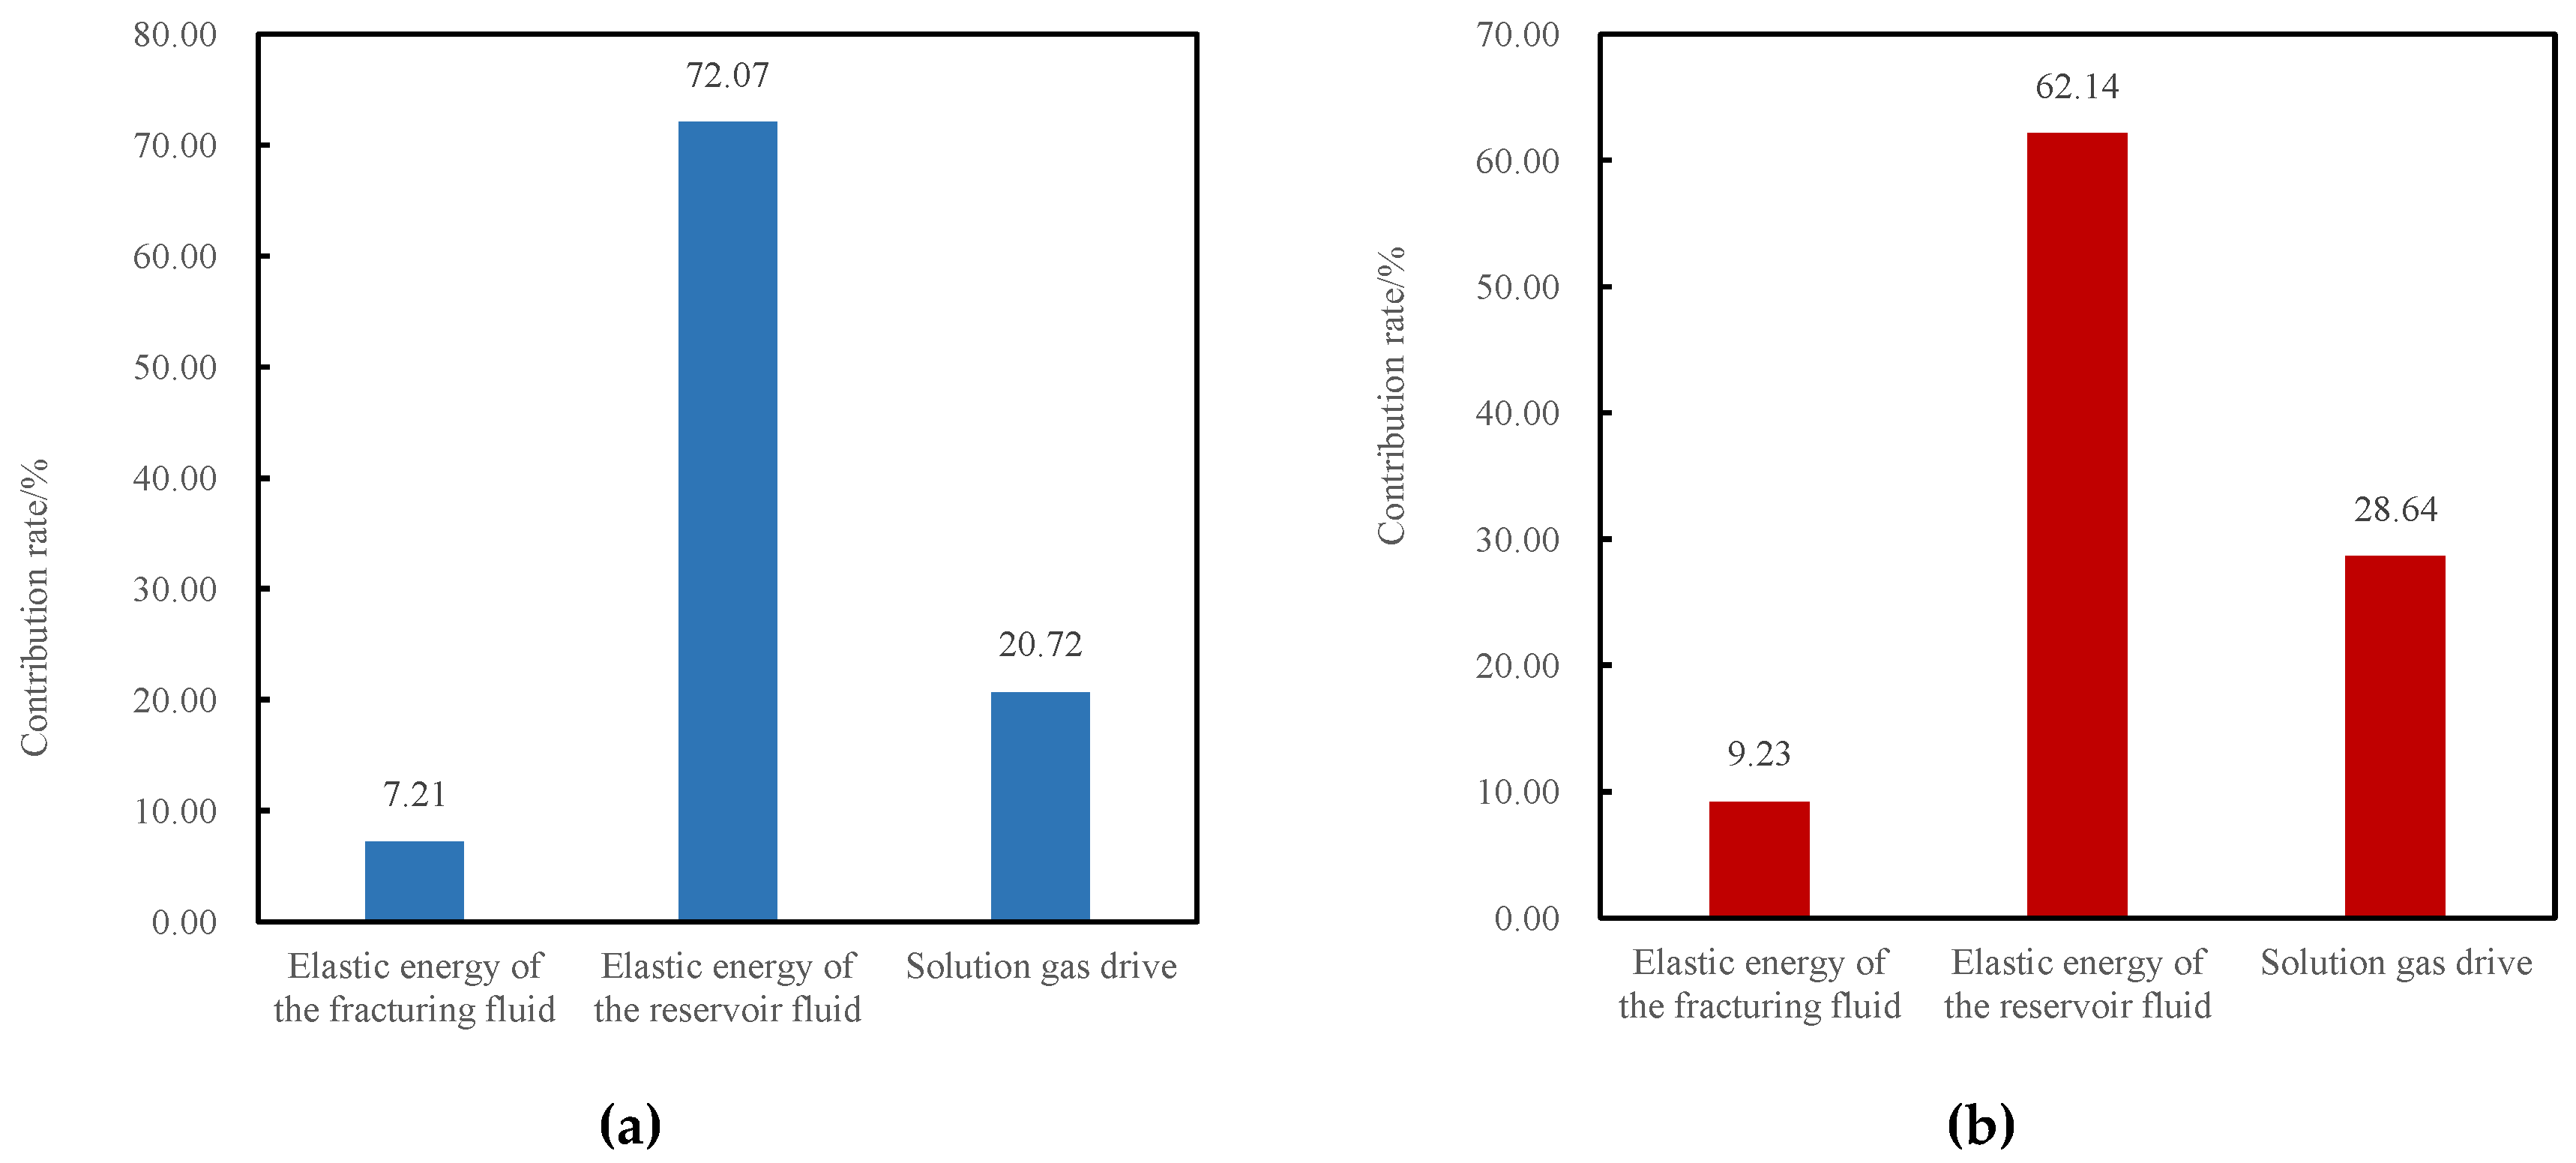
Figure 18.
Formation pressure distribution and displacement-to-imbibition ratio under different bottom-hole flowing pressures.
Figure 18.
Formation pressure distribution and displacement-to-imbibition ratio under different bottom-hole flowing pressures.
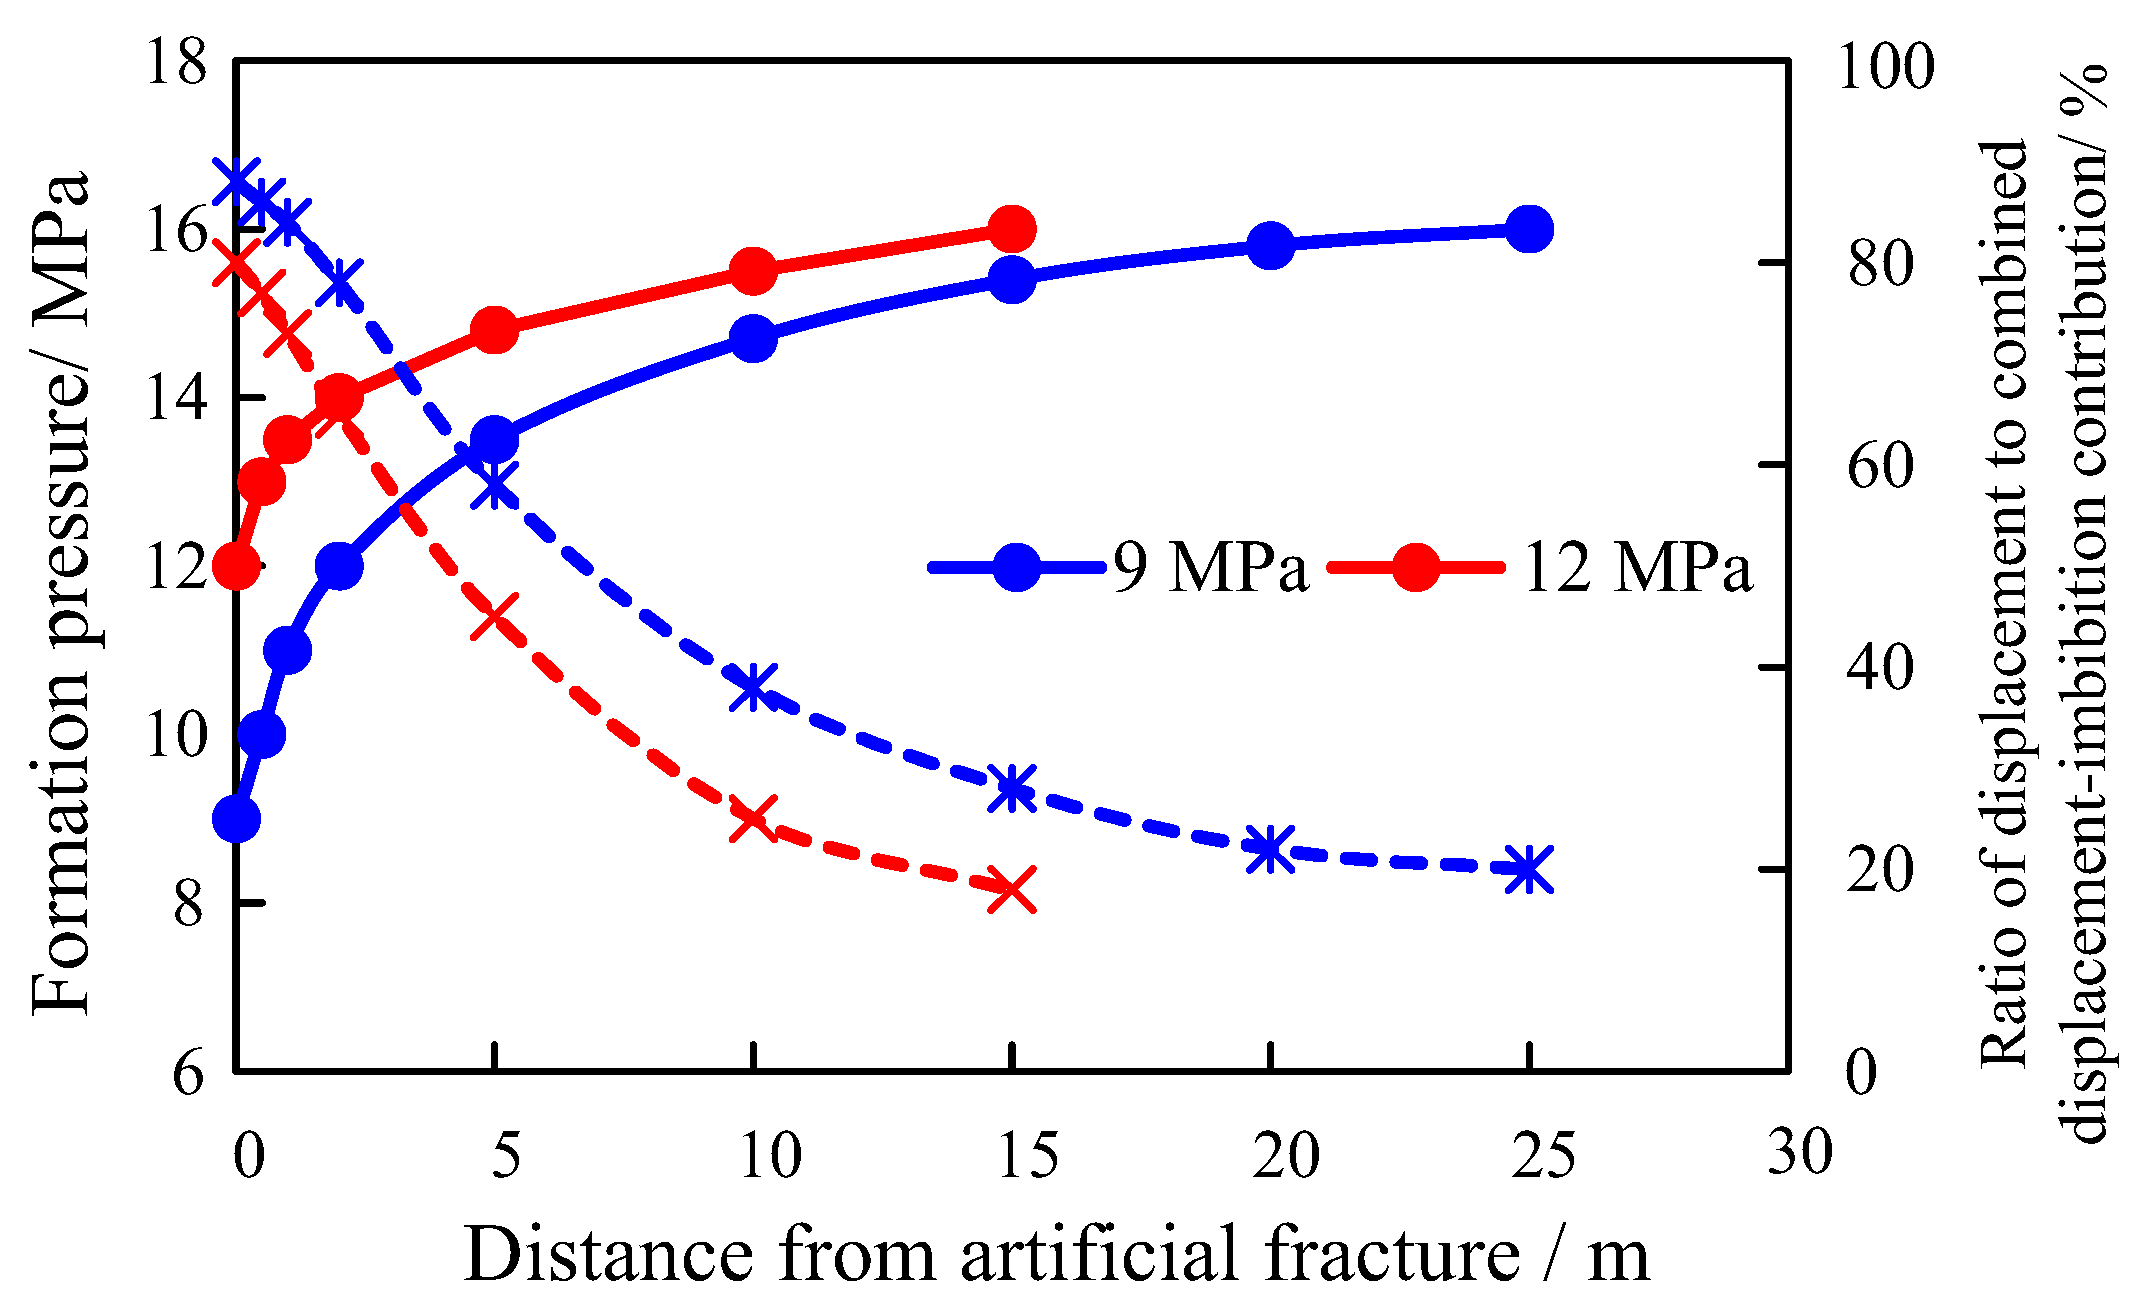

Table 1.
Basic data of rock samples for shut-in effectiveness evaluation.
| Sample No. | Porosity/% | Permeability/mD | WI_w | WI_o | Remarks |
| X233-10 | 10.764 | 0.110 | 0.074 | 0.95 | Imbibition + Displacement |
| X233-9 | 11.370 | 0.074 | - | - | Displacement |
| X286-10 | 11.306 | 0.121 | 0.132 | 0.93 | Imbibition + Displacement |
| X286-11 | 10.948 | 0.144 | - | - | Displacement |
| B117-9 | 10.987 | 0.140 | 0.019 | 0.92 | Imbibition + Displacement |
| B117-8 | 11.270 | 0.248 | - | - | Displacement |
Table 2.
Rock samples and basic properties for oil production characteristic evaluation during shut-in stage.
Table 2.
Rock samples and basic properties for oil production characteristic evaluation during shut-in stage.
| Sample No. | Porosity/% | Permeability /mD | Injection Pressure /MPa |
| L388-1 | 7.151 | 0.096 | 1 |
| L388-2 | 8.766 | 0.111 | 3 |
Table 3.
Rock samples and experimental scheme for elastic depletion experiments.
| Experiment Objective | Sample | Length /cm | Diameter /cm | Porosity /% | Permeability /mD | Formation Pressure /MPa | Downstream Pressure /MPa | Experimental Fluid |
| Evaluate effect of reservoir properties on elastic depletion | B117-2 | 4.254 | 2.515 | 9.36 | 0.066 | 15.9 | 7 | Water: D₂O; Oil: Degassed crude oil |
| L388-3 | 5.881 | 2.515 | 10.38 | 0.372 | ||||
| X286-3 | 5.661 | 2.482 | 9.01 | 0.190 | ||||
| Evaluate effect of solution gas drive on elastic depletion | B117-2 | 4.254 | 2.515 | 9.36 | 0.066 | 7 | Water: D₂O; Oil: Recombined crude oil | |
| L388-3 | 5.881 | 2.515 | 10.38 | 0.372 | ||||
| X286-3 | 5.661 | 2.482 | 9.01 | 0.190 | ||||
| Evaluate effect of production pressure on elastic depletion | L388-2 | 5.029 | 2.54 | 8.77 | 0.111 | 12 | Water: D₂O; Oil: Degassed crude oil | |
| L99-2 | 5.002 | 2.55 | 9.72 | 0.097 | 9 | |||
| L388-1 | 4.950 | 2.55 | 7.15 | 0.096 | 7 |
Research manuscripts re.
Table 4.
Experimental results of imbibition and displacement processes.
| Sample | Oil Saturation/% | Imbibition Recovery/% | Recovery after Imbibition + Water Flooding/% | Total Recovery/% | Remaining Oil in Pores after Imbibition + Water Flooding/% | ||
| MicroPores | MesoPores | MacroPores | |||||
| X233-10 | 72.58 | 3.77 | 29.37 | 33.14 | 24.69 | 5.16 | 0.59 |
| X286-10 | 63.19 | 5.74 | 29.04 | 34.78 | 12.89 | 2.51 | 0.26 |
| B117--9 | 56.47 | 3.70 | 28.20 | 31.90 | 4.66 | 1.33 | 0.12 |
| Sample | Oil Saturation/% | Water Flooding Recovery/% | Remaining Oil in Pores after Water Flooding Only/% | ||||
| MicroPores | MesoPores | MacroPores | |||||
| X233-9 | 65.96 | 20.73 | 29.03 | 4.79 | 0.69 | ||
| X286-11 | 62.57 | 26.86 | 17.14 | 3.70 | 0.29 | ||
| B117-8 | 56.52 | 22.94 | 12.53 | 3.05 | 0.34 | ||
Table 6.
Depletion recovery factors under different downstream pressures.
| Sample | Length /cm | Diameter /cm | Porosity /% | Permeability /mD |
Recovery factor /% |
Downstream Pressure /MPa |
| L388-2 | 50.29 | 2.54 | 8.766 | 0.111 | 6.54 | 12 |
| L99-2 | 50.02 | 2.55 | 9.72 | 0.097 | 9.4 | 9 |
| L388-1 | 4.95 | 2.55 | 7.151 | 0.096 | 12.1 | 7 |
Table 7.
Depletion recovery factors under the same downstream pressure.
| Sample | Length /cm | Diameter /cm | Porosity /% | Permeability /mD | Recovery /% | Downstream Pressure /MPa |
| B117-2 | 4.254 | 2.515 | 9.355 | 0.066 | 7.63 | 7 |
| L388-3 | 5.881 | 2.515 | 10.377 | 0.372 | 10.1 | 7 |
| X286-3 | 5.661 | 2.482 | 9.011 | 0.19 | 9.14 | 7 |
Table 8.
Basic parameters for elastic and solution-gas drive calculations.
| Parameter | Value | Parameter | Value |
| Initial formation pressure /MPa | 15.9 | Initial solution gas-oil ratio (m3/m3) | 108 |
| Oil compressibility /10-4 MPa-1 | 12.98 | Solution gas-oil ratio at pressure p (m3/m3) | 72.5 |
| Irreducible water saturation /fraction | 0.30 | Oil FVF at saturation pressure | 1.36 |
| Oil saturation /fraction | 0.70 | Oil FVF | 1.1 |
| Rock compressibility /10-4 MPa-1 | 11.70 | Gas FVF | 0.0189 |
| Water compressibility /10-4 MPa-1 | 4.20 | Saturation pressure /MPa | 10 |
| Average effective porosity /fraction | 0.091 | Abandonment pressure /MPa | 7 |
| Single-well controlled reserves /104t | 17.78 | Fracturing fluid volume/m3 | 27823 |
Table 9.
Recovery factors and contribution ratios at different stages for various types of horizontal wells.
Table 9.
Recovery factors and contribution ratios at different stages for various types of horizontal wells.
| Block | Xi-233 | Z-183 | ||||||
| Category | Class Ⅰ | Class Ⅱ | Class Ⅰ | Class Ⅱ | ||||
|
Recovery factor /% |
Contribution /% | Recovery factor /% | Contribution /% | Recovery factor /% | Contribution /% | Recovery factor /% | Contribution /% | |
| Fracturing Fluid Elasticity energy | 0.60 | 6.67 | 0.51 | 5.57 | 0.45 | 4.44 | 0.55 | 5.42 |
| Reservoir Fluid Elasticity energy | 6.59 | 68.10 | 5.54 | 60.09 | 7.15 | 70.51 | 6.57 | 64.79 |
| Solution Gas Drive | 2.48 | 25.69 | 3.17 | 34.34 | 2.54 | 25.05 | 3.11 | 30.67 |
Table 10.
Liquid production schedule for shale oil horizontal wells at different production stages.
| Flowback stage | Water cut characteristics | Flowback Intensity (m³/100m) | Flowback Rate for a 1500m Well (m³/day) | Main function |
| Strong flowback after opening | >90% | 4.0-5.0 | 60-75 | Increase pressure differential between matrix and induced fractures, facilitating breakthrough of water-blocking seepage barrier |
| Controlled flowback after oil appearance | 90%-60% | 2.0-3.0 | 30-45 | Prevent severe sand production in wellbore |
| Controlled pressure production | <60% | 1.5-2.0 | <30 | Control production flowing pressure |
Disclaimer/Publisher’s Note: The statements, opinions and data contained in all publications are solely those of the individual author(s) and contributor(s) and not of MDPI and/or the editor(s). MDPI and/or the editor(s) disclaim responsibility for any injury to people or property resulting from any ideas, methods, instructions or products referred to in the content. |
© 2026 by the authors. Licensee MDPI, Basel, Switzerland. This article is an open access article distributed under the terms and conditions of the Creative Commons Attribution (CC BY) license (http://creativecommons.org/licenses/by/4.0/).
Copyright: This open access article is published under a Creative Commons CC BY 4.0 license, which permit the free download, distribution, and reuse, provided that the author and preprint are cited in any reuse.