

Submitted:
07 July 2026
Posted:
08 July 2026
You are already at the latest version
Abstract
Aircraft often manifest as highly aspect/pose-sensitive, disjointed blobs made of pixels with fluctuating levels of brightness in classic grayscale SAR images, which makes the aircraft annotation task challenging even for human experts. As more and more high-resolution colorized SAR images acquired by the latest commercial imaging modes are released for open access, both the academia and the industry started to notice the benefits of color-coded SAR images. However, since the large-scale datasets in the area of SAR aircraft detection feature grayscale SAR images, research on discrimination feature learning in color space for SAR aircraft detection is very limited. To embrace the opportunity brought by the new generation of highly informative colored SAR images, we propose the Phase-Aware Clustering Enhanced Detector (PACE-Det), which consists of three main components: the Phase-Orientation Color Encoder (POCE) module, the core detection network, and the Multi-Space Clustering Constraint (MSCC) module. The front-end POCE module generates pseudo-color SAR images based on Phase Congruency (PC). The color representations are fed into the core detection network for feature extraction, where the phase-aware alignment loss is introduced in addition to the classification and regression losses in the standard object detection task. The initial predictions generated by the core detection network are further refined by the contextual information extracted by the post-processing MSCC module based on the image segmentation result in L*a*b* color space, where anisotropic objects like aircraft and isotropic scatterers like impervious surfaces exhibit distinct spatial distributions and color features. Experiments based on the Composite SAR Aircraft Dataset (CSAD), which is constructed by fusing airport scenes with SAR aircraft target patches, show that the proposed PACE-Det achieves a mAP75 of 0.948 and mAP90 of 0.561, which are higher than many state-of-the-art networks.
Keywords:
physical model
; SAR target detection
; deep learning
; remote sensing object detection
; airplane detection
1. Introduction
Due to the special imaging mechanism of Synthetic Aperture Radar (SAR) system, further increasing the dwell time will no longer improve the interpretability of SAR image once the resolution reaches 0.1 m. Since human vision system is equipped with rods for intensity and cones for color, researchers have been devising pseudo-color coding schemes to enhance the interpretability of SAR images since the very beginning. For polarimetric radar, RGB images are often generated with the Sinclair color coding or the Pauli coding [1,2]. However, since different types of vegetation and plants (such as shrubs, grasslands, trees, etc) exhibit very different characteristics, polarized InSAR are most commonly used for land-use segmentation and crop recognition. In contrast, the Colorized Subaperture Imaging (CSI) technique, which is flexible in subaperture partition and is low in computational cost, is more suitable for the mission of small manmade object detection since it assigns colors based on the target echo variation between different subapertures, which makes the sparking objects stand out in an otherwise gray natural background made of trees and other plants. The CSI technique is motivated by the fact that isotropic scatterers, such as grass, trees and impervious surfaces, scatter equally in all directions; in contrast, anisotropic scatterers like aircraft that have a dominant reflection in one particular direction will retain that color after all the subapertures are combined. With CSI, small colorful manmade objects will stand out against grayish-black backgrounds and naturally grasps human eyes. With commercial SAR companies like ICEYE and Capella Space [3,4,5] starting to provide CSI SAR products in 2024, more government and private users started to notice the advantages of colorized SAR images over the grayscale ones. Specifically, with the development of data-driven deep-learning-based SAR-ATR, adopting CSI technique would not only ease the work load of human annotators but also embed more information into one image, which is essential for on-board systems where the screen-size is limited.
Although ICEYE and Capella Space are releasing more free CSI data as appetizers for potential paying customers, most of these images require manual ground truth labeling before they can be used to train deep neural networks. On the other hand, tremendous effort has been made in creating the existing SAR airplane detection datasets [6,7], based on which many promising SAR automatic target recognition (ATR) networks have been developed [8]. To prepare the new generation of SAR ATR networks for the upcoming era of colorful SAR images, the research community should devise a set of physics-based color-coding rules to upgrade the existing grayscale SAR image datasets to color-enhanced versions, based on which research on color-guided discrimination SAR feature learning could be conducted. One of the most important bottle-neck problems for the research on colored SAR ATR is the special imaging mechanism employed by SAR and the imparity between human vision and computer vision in the domain of microwave vision. This problem stands out even for grayscale images since in SAR images anisotropic objects like aircraft often manifest as highly aspect/pose-sensitive, disjointed blobs made of pixels with fluctuating levels of brightness which defy the Gestalt rule [9], while the background suffers from speckle noises that prevent segmentation networks that worked perfectly on optical images to malfunction on SAR images. For grayscale SAR images, the commonly adopted discrimination features for single-pol SAR images include [10] texture features (standard deviation, fractal dimension, weighted fill), size features (mass, diameter, normalized rotational inertia), and contrast features (peak CFAR, mean CFAR, percent bright CFAR). And it has been shown in many research works that the performance of the SAR object detection networks does not improve with the size of the models as they did on optical-image-based small object detection tasks. By introducing color into the picture, things become even more complicated. Since the colormap is a function of the viewing geometry, the same anisotropic object could produce different pseudo-color signatures, which means common RGB image augmentation technique like color jittering could destroy the physical meaning of the SAR images. In contrast, the networks have to learn that the color is not intrinsic to the object, but is a function of a set of physical parameters mapped through a lookup table at a particular viewing geometry.
To embrace the opportunity brought by the new generation of highly informative colored SAR images, we propose the Phase-Aware Clustering Enhanced Detector (PACE-Det), which consists of three main components: the Phase-Orientation Color Encoder (POCE) module, the core detection network, and the Multi-Space Clustering Constraint (MSCC) module. The front-end POCE module generates pseudo-color SAR images based on Phase Congruency (PC). The color representations are fed into the core detection network for feature extraction, where the phase-aware alignment loss is introduced in addition to the classification and regression losses in the standard object detection task. The initial predictions generated by the core detection network are further refined by the post-processing MSCC module based on the image segmentation result in color space, where anisotropic objects like aircraft and isotropic scatterers like impervious surfaces exhibit distinct spatial distributions and color features.
The major contributions of this article are summarized as follows:
- 1.
- A prior-knowledge-based feature representation module named as the POCE module is proposed to map the grayscale values of SAR images to color space based on phase congruency. The proposed POCE module can generate structurally-enhanced colorized SAR images based on single-channel SAR data by extracting the local spatial phase and structure orientation of the image, which could effectively mitigate the speckle effect and optimize the visual features of aircraft.
- 2.
- A clustering-based spatial topological constraint module named as the MSCC module is designed and deployed during the inference phase for background interference suppression. The proposed MSCC module utilizes color-space clustering and geometric topological relations for contextual filtering, and could effectively distinguish targets from strong discrete clutters densely-distributed in a typical airport without requiring extra training supervision.
- 3.
- The PACE-Det framework is established for SAR aircraft detection in large-scale airport scenes by combining the POCE and MSCC modules, and its robustness is evaluated against a self-constructed dataset. Experimental results show that the proposed PACE-Det framework is capable of generating accurate object bounding boxes under stringent IoU thresholds, particularly at and , and eliminating false alarms.
The rest of the work is organized as follows. In Section 2, the research works related to SAR aircraft detection and classification based on deep learning, context-guided SAR ATR and SAR image colorization are introduced. Section 3 details the proposed PACE-Det and its three main components, i.e. the POCE module, the core detection network, and the MSCC module. Experimental results based on the Composite SAR Aircraft Dataset (CSAD) are presented in Section 4. Finally, Section 5 concludes this article and points out future research directions.
2. Related Work
2.1. SAR Aircraft Detection and Classification based on Deep Learning
Research in the field of SAR aircraft detection and classification based on deep learning normally involves structure-analysis-based feature enhancement since aircraft often manifest as disjointed pixels with fluctuating levels of brightness. To strengthen the structural relationship among the scattering points and suppress clutters, Kang et al. [11] proposed a novel anchor-free approach named scattering feature relation network (SFR-Net), which consists of the scattering point relation module (SPRM), the salient fusion module (SFM), and the contextual feature attention (CFA) module. Huang, et al. [8] proposed the physics-guided detector (PGD) learning paradigm for SAR aircraft detection, which consists of physics-guided self-supervised learning (PGSSL), physics-guided feature enhancement (PGFE), and physics-guided instance perception (PGIP). The PGD network achieved SOTA performance (90.7% mAP) on the SAR-AIRcraft-1.0 dataset, which contains seven types of civil aircraft. Since SAR aircraft targets lack consecutive contours, Fu et al. [12] proposed to integrate deep shape priors into the SAR aircraft reconstruction stage. Similarly, Geng et al. leverages on the infrared images to construct an “exoskeleton” for the airplane SAR signature, so that the dimension/shape/contour of the target and its electromagnetic characteristics are united [13]. Sun et al. proposed a SAR-to-optical translation network as a pre-processing procedure to facilitate both automatic and manual aircraft recognition within the framework of conditional generative adversarial network (cGAN) [14].
2.2. Context-Guided SAR ATR
For small object detection in remote sensing images, contextual information has always been the key for increasing the recall rate while suppressing false alarms [15]. Unfortunately, most SAR ATR datasets released for open access provide instance labels (i.e. bounding boxes for aircraft) rather than pixel-level annotations that support land-use segmentation since it is extremely difficult to decide the class label for each pixel in large-scene SAR images. One solution to this problem is to create paired Optical-SAR datasets [16]. Based on these datasets, it has been proved in many research works that jointly exploiting SAR and optical images could significantly enhance the robustness of SAR image segmentation [17,18]. Once a high-fidelity land-use segmentation result is obtained, a simple object detection problem based on the assumption of uniform distribution (i.e. any region of the same size has equal probability to hold the object of interest) evolves to intelligent scene analysis. In this stage, the network starts to look beyond the pixels and starts to obtain deeper insights regarding the connections between the objects coexisting in the scene [19]. To support the research in this field, manual pixel-level image annotation is often required to create a dataset for network model training. For example, Geng et al. proposed a context-driven joint scene–target analysis method based on optical-SAR image scene grammar alignment [20]. A multi-scale sliding window attention mechanism is employed to sift out the potential parking positions for the airplanes in the form of image chips based on the terminal area markings shown on the optical images of the airports. Experimental results based on the aligned optical-SAR images collected over Heathrow Airport in the U.K., Kuala Lumpur International Airport in Malaysia, Suvarnabhumi airport in Thailand, and the Arizona aircraft boneyard show that the F1 score of the proposed method reaches 0.987, which is much higher than the regular baseline networks like YOLOv8 that fail to incorporate the prior knowledge regarding the airport. Context-guided SAR ATR is also important for inshore ship detection. It has been shown in [13,21] that by utilizing the prior knowledge of the harbour layout to generate a land mask for terrain delimitation, the false alarms induced by discrete clutters in the coastal area could be effectively suppressed. The major limitation of the works mentioned above is the level of human supervision involved, which serves as the motivation behind the unsupervised context-extraction strategy proposed in this work.
2.3. SAR Image Colorization
In [22], a comprehensive research framework for SAR colorization based on supervised learning is presented, and three spectral-based methods are evaluated: LR4ColSAR, which is based on linear regression; NL4ColSAR, which is based on nonlinear regression; conditional generative adversarial network for SAR colorization (cGAN4ColSAR), which assigns specific colors to object or regions based on scene recognition and image-to-image translation. In [23], Shen et al. proposed a new SAR image colorization method called improved conditional generative adversarial network for SAR colorization (IcGAN4ColSAR), which aims to integrate full-band multispectral images and dual-polarization SAR images. In [24], SAR image colorization with conditional generative adversarial network in the color space is considered. To improve the SAR aircraft detection performance, Suo et al. proposed an adaptive pseudo-color SAR image synthesis solution by combining the output of the despeckle enhancement transformer network (DET-net) and adaptive quantization result [25]. Experiment results based on the GaoFen-3 satellite SAR images show that the proposed algorithm could suppress the speckle noise and enhance the visual features in SAR images, and is effective in improving the detection performance of various types of detectors.
3. Methodology
To resolve the representational mismatch encountered by traditional CNNs when processing SAR images characterized by discrete scattering and speckle noise, as well as the false alarms triggered by high-intensity background clutter in airport scenarios, the Phase-Aware Clustering Enhanced Detector (PACE-Det) is proposed. The core rationale of this framework involves alleviating the optimization difficulty of structural representation through the characterization of geometric topological features, while integrating geometric consistency verification during the inference phase to ensure robust precision. This section elaborates on the technical nuances of the proposed methodology: First, SubSection 3.1 presents an overview of the global architecture. Subsequently, SubSection 3.2 delivers an analysis of the POCE module, describing its physical feature extraction principles. SubSection 3.3 further outlines the semantic feature extraction process and the phase-aware alignment optimization strategy. Finally, SubSection 3.4 details the MSCC module, expounding the procedural implementation of post-processing spatial filtering via color-space clustering during the inference stage.
3.1. Architecture
As illustrated in Figure 1, the proposed PACE-Det operates through a pipeline comprising three sequential components: physical prior encoding, semantic feature extraction, and geometric consistency filtering. To overcome the representation bottlenecks of conventional CNNs when processing single-channel SAR data, raw images serve as the direct input to the POCE module. Instead of directly relying on the fluctuating amplitude information, this module functions to extract the topological structural intensity and local orientation attributes from the complex background. These physical priors are subsequently coupled via a directional color coding mechanism, transforming the inherent spatial structures into a three-channel color-coded representation. This mapping provides a stabilized and discriminative structural input for the subsequent network.
Following the physical prior encoding, the generated orientation-color image serves as the input to a core detection network meta-architecture. Benefiting from the color feature representation provided by POCE, the detector can extract multi-scale deep semantic features and generate initial predictions including bounding boxes and classification confidence scores without the necessity for highly customized feature extractors.
Finally, during the inference stage, the Multi-Space Clustering Constraint (MSCC) module serves as an independent post-processing filter. By enforcing spatial geometric consistency through color-space clustering, MSCC refines the initial predictions and suppresses false alarms generated by background clutter.
3.2. Phase-Orientation Color Encoder (POCE)
In the field of radar target recognition, Colorized Subaperture Imaging (CSI) maps subaperture echoes from varying aspect angles into independent color channels. Such a mapping mechanism enables man-made metallic targets, which possess strong anisotropic scattering characteristics, to exhibit distinct color signatures. Conversely, background regions such as natural terrains and conventional paved surfaces typically exhibit isotropic scattering, resulting in consistent echo intensities across different subapertures. Consequently, upon superimposition in the RGB color space, the aforementioned background areas often manifest as achromatic grayish tones devoid of color variations. This scattering directivity endows CSI with a significant advantage over single-channel grayscale SAR images in target detection tasks, as the incorporation of color as an independent and highly discriminative feature dimension substantially enlarges the inter-class distance between high-intensity targets and high-intensity clutter.
However, generating authentic CSI relies on full-aperture Single Look Complex (SLC) data, which is computationally expensive and subject to restrictions. More critically, currently available commercial colored SAR or CSI products remain exceptionally scarce, failing to meet the requirement for constructing a large-scale, standard-compliant dataset essential for training and evaluating deep neural networks. Driven by this limitation, the POCE module is specifically designed as a spatial-domain pseudo-color encoding mechanism to replicate such an efficient salient feature representation for man-made targets directly from conventional single-channel grayscale images. The systematic architecture and internal signal flow of the POCE module are illustrated in Figure 2. Specifically, POCE leverages PC to precisely extract the topological structural intensity of targets. Furthermore, the local structure tensor is resolved to capture the dominant orientation of the physical texture. By adopting the acquired spatial orientation attributes as the basis for color allocation, the proposed POCE mimics the multi-aperture coloring logic of CSI in the spatial domain, delivering a feature representation with structural discriminability for the subsequent detection network.
3.2.1. Phase Congruency Extraction
To implement the proposed feature representation, the core of POCE lies in extracting the topological structural intensity of targets within the frequency domain. Given a normalized input image, feature extraction first relies on a bank of 2D Log-Gabor filters to acquire multi-scale and multi-directional frequency responses. The filter is constructed by multiplying a radial frequency response curve with an angular Gaussian spread function, which provides effective spatial localization and bandwidth control in the frequency domain. The transfer function is expressed as follows
where f and denote the radial frequency and the angular coordinate in the frequency domain, respectively. The parameter represents the center frequency of the filter, and governs the scaling factor of the radial bandwidth. The term specifies the angular distance from the filter’s center orientation, while determines the angular bandwidth.
By constructing a multi-scale and multi-orientation filter bank based on this transfer function, the amplitude and phase components of the SAR image can be effectively separated to compute the underlying structural intensity. Then, the even-symmetric component and the odd-symmetric component at a specific scale s and orientation o are obtained via the inverse Fourier transform. Based on these two orthogonal spatial-domain responses, the local amplitude is defined as:
To construct a robust structural representation across multiple frequency observations, it is theoretically necessary to aggregate the local energy. To precisely preserve the true phase evolution characteristics across scales, the energy calculation for a specific orientation requires independent summation of even-symmetric and odd-symmetric components across all scales before calculating the magnitude. By performing a scalar summation of the responses across all orientations, the global pixel-level total local energy is obtained, and the mathematical form is given by
Furthermore, considering the specificity of the energy distribution induced by the interleaving of speckle and strong discrete scattering clusters in SAR images, traditional constant noise estimation models based on statistical hypotheses of minimum-scale responses often fail to objectively reflect the actual background disturbance level. Therefore, a dynamic noise truncation mechanism based on global energy distribution characteristics is theoretically introduced. This adaptive noise threshold T is jointly constrained by the mathematical expectation and standard deviation of the total local energy matrix
Finally, incorporating the calculated physical parameters, the dimensionless PC map is computed as follows
In this definition, the numerator introduces a zero-bounded truncation function to strictly suppress invalid noise energy below the dynamic threshold. The denominator utilizes the absolute sum of all local amplitudes for normalization, with an infinitesimal constant added to circumvent division-by-zero errors.
3.2.2. Structure Orientation Calculation
Although PC provides the structural intensity information of targets, orientation features are equally indispensable for adequately characterizing the geometric symmetry and topological trends of complex man-made targets such as aircraft. From a geometric perspective, the geometric structure of a target often manifests as texture edges with specific extension directions. However, due to the inherent speckle noise in SAR images, single-pixel gradient directions exhibit significant randomness, making it difficult to stably describe the macroscopic structure. To address this, the structure tensor is introduced to compute a Structure Orientation (SO) field by aggregating structural consistency within local neighborhoods.
First, the partial derivatives of the input image I in the horizontal and vertical directions, denoted as and , are calculated, from which the initial gradient cross product matrix is constructed. To suppress the interference of isolated noise points while capturing the connected structural correlations within the local neighborhood, a spatial integration scale is introduced for neighborhood aggregation. This parameter is essentially utilized to govern the physical balance between fine structure preservation and noise suppression. Based on this integration scale, the two-dimensional isotropic Gaussian smoothing kernel is defined as
By applying a spatial weighted convolution to each component of the initial gradient cross-product matrix using this scalar Gaussian kernel, the originally unstable rank-1 gradient matrix is transformed into a robust structure tensor encapsulating local texture distribution characteristics, which is formulated as
The principal axes of the local neighborhood are demarcated by the eigenvectors of the structure tensor , where the primary and secondary eigenvectors correspond to the orthogonal directions of the most drastic and the most gradual image intensity variations, respectively, thereby effectively representing the local structural orientation. By applying trigonometric transformations to the tensor components, the analytical solution for the dominant orientation angle is derived as
Considering that local edge structures possess axial symmetry in geometric topology, meaning the orientation of a linear texture is physically equivalent to its expression after a rotation under the structure tensor representation, the calculated continuous angle field is mapped modulo and normalized into a unified numerical interval . This operation not only eliminates the sign ambiguity in the orientation representation but also preserves the distinction between left and right inclinations. This standardized feature variable establishes a theoretically rigorous input basis for the subsequent continuous color mapping mechanism, formulated as
3.2.3. Orientation-Color Mapping
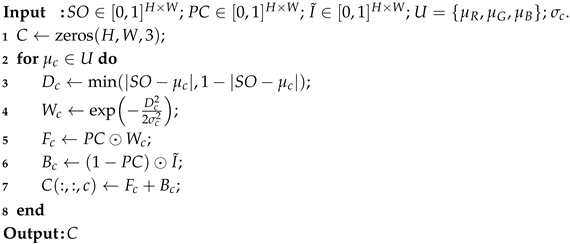
Upon acquiring the topological structural intensity and orientation, the POCE module ultimately couples these two distinct physical attributes to generate a discriminative structural feature representation. To simulate the directional colorization logic of multiple subapertures in the spatial domain and ensure a continuous mapping to the visual space, a PC-guided directional color coding mechanism is devised, as detailed in Algorithm 1. Specifically, for each color channel centered at a predefined phase angle , the algorithm first computes the angular distance between the local SO and the channel center. Subsequently, a non-linear exponential decay function, parameterized by a decay constant , is applied to to generate an assignment weight map . To screen out invalid color responses in background clutter, the PC map is utilized as a confidence metric to weight via the Hadamard product, ensuring that the requisite colors are exclusively preserved on anisotropic target structures with high confidence. The detailed mapping logic from the SO and PC to the RGB color space is visually illustrated in Figure 3. Simultaneously, to construct the background context , the complementary confidence acts as a blending weight on , where denotes the linearly normalized original SAR image I to ensure numerical compatibility. This operation retains the isotropic clutter as grayscale background while suppressing the original intensity at target locations. Eventually, the composite color representation C is synthesized by superimposing foreground and background responses.
| Algorithm 1: PC-Guided Directional Colorization |
 |
Ultimately, by employing the computed PC map to regulate the mapping from structural orientation to color space, the processed SAR representation highlights anisotropic man-made targets with directional colors, whereas isotropic natural textures are suppressed into dark tones, as depicted in Figure 4. By encoding the underlying spatial structural characteristics into a color-based representation, this mechanism translates physical topological priors into a distinct feature space. This not only preserves crucial spatial contextual information but also significantly alleviates the representation learning burden on the subsequent backbone network.
3.3. Core Detection Network
After the physical prior encoding is completed by the POCE module, the generated orientation-color representations are fed into the convolutional architecture to extract high-level semantic features and generate initial bounding box predictions. To enhance the stability of the feature representations while utilizing the POCE physical priors, a phase-aware alignment optimization strategy is introduced during the training phase, aiming to alleviate the potential loss of structural information in deep neural networks during the downsampling process. The overall training objective function is defined as:
where represents the standard object detection loss, determined by the default classification and bounding box regression losses inherent to the instantiated detection head. The hyperparameter is utilized to balance the influence of the auxiliary constraint term. The phase-aware alignment loss enhances the perception capability of the model toward target contours by establishing an association between the low-level PC map and the deep feature map . Specifically, this loss term achieves feature alignment by calculating the mean squared error (MSE) between the two:
where Q denotes the total number of spatial elements in the feature map. Through the aforementioned optimization process, the core network is capable of combining deep semantic information with physical scattering contours. Once the network is fully optimized, the initial predicted bounding boxes generated during the inference stage are subsequently forwarded to the MSCC module for further spatial verification.
3.4. Multi-Space Clustering Constraint (MSCC)
Although the core detection network is optimized via the phase-aware alignment strategy, the initial bounding boxes generated during the inference stage may still contain false positives localized on high-intensity anisotropic background clutter. To address this, the MSCC module is introduced as an independent post-processing step. It aims to conduct spatial geometric consistency verification on the initial predictions without incurring additional training overhead. The core workflow of the MSCC module primarily consists of color-space clustering and overlap ratio verification.
To impose this macroscopic geometric topology as a physical constraint, the MSCC module reuses the orientation-color representation generated by POCE. It operates sequentially after the detection network. By applying a smoothing filter to the colorized representation, MSCC effectively diminishes false alarms induced by background clutter, thereby achieving a balance between recall and precision. Specifically, let C denote the colorized image. The spatial scale suppression process can be formulated as
where * denotes the two-dimensional discrete convolution operation, denotes the local neighborhood window radius utilized in the spatial scale suppression process, represents the feature map after scale suppression, and the Gaussian kernel is defined as in Eq. 6.
Subsequently, MSCC transforms the filtered multi-channel features into the color space to separate the physical intensity and chrominance features. Specifically, the filtered image is first subjected to inverse Gamma correction in accordance with the sRGB standard and mapped into the CIE XYZ color space via a standard linear transformation matrix, ensuring that the Euclidean distance between feature vectors is proportional to the difference in their anisotropic scattering properties. The mapping from the feature vector to the channels is defined as
where , , and denote the tristimulus values of a standard reference white point. Furthermore, the deployed non-linear compression function is defined as
Afterwards, within the multi-dimensional feature space, MSCC utilizes the K-means clustering on the filtered multi-dimensional pixel features. Let N be the total number of image pixels, and let the feature vector of the i-th pixel in the color space be denoted as . The clustering algorithm aims to partition the entire feature space into K disjoint topological clusters , with its standard optimization objective being the minimization of the feature variance
where denotes the centroid vector of the k-th cluster.
Upon the convergence of the clustering algorithm, the complex airport background is segmented into coherent topological regions. Since anisotropic man-made structures and background textures exhibit distinct spatial distributions and chrominance aggregations in the color space, distinct clusters can be isolated by utilizing the global mean luminance as a statistical prior to reject background clutter, as illustrated in Figure 5. Subsequently, the isolated clusters are binarized to construct a spatial constraint M, which is then projected back onto the original spatial scale to verify the initial bounding box predictions generated by the core detection network. For each predicted bounding box, the algorithm calculates its overlapping ratio with the valid regions of the constraint. Any bounding box whose overlap falls below a predefined threshold is determined to be a false alarm induced by background clutter and is consequently discarded. Through such geometric consistency verification, PACE-Det achieves the discrimination of targets from clutter, yielding refined detections.
4. Experiments
4.1. Dataset
The experiments are conducted on the Composite SAR Aircraft Dataset (CSAD), which is constructed by fusing airport scenes with SAR aircraft target patches. Specifically, the airport scenes are derived from the Geocoded Ellipsoid Corrected (GEO) imagery products released by Capella Space, featuring a resolution of 0.2 m and encompassing typical airport facilities such as terminal buildings, control towers, hangars, and surrounding greenbelts. The SAR aircraft target patches are sourced from the available SAR-AIRcraft-1.0 dataset, which is primarily acquired by the Gaofen-3 satellite operating in the C-band with a resolution of 1 m.
To encompass the seven typical aircraft categories from the SAR-AIRcraft-1.0 dataset while ensuring realistic effects of the fusion results and overcoming the inherent class imbalance of the original data, the generation process of the CSAD is designed as follows: First, stratified brightness matching is introduced. The entire set of background images and target patches is divided into four brightness levels for intra-level matching, thereby avoiding brightness mismatches between the aircraft patches and the background scenes. Moreover, based on the distance transform, target anchor points are generated within potential aircraft maneuvering areas, ensuring that aircraft instances are restricted to valid regions while maintaining reasonable spacing to prevent overlapping. During the target implantation stage, after completing spatial resolution alignment, a lower absolute intensity threshold is utilized to isolate the aircraft pixels. A slight contrast stretching is then applied to these pixels to enhance the anisotropic reflection characteristics of the metallic targets. Furthermore, a dynamic class-balanced sampling strategy is embedded in the simulation pipeline. By dynamically reducing the sampling weights of high-frequency categories in real time, it effectively mitigates the class imbalance issue in the original data. Eventually, the generated images are sized at 1024×1024 pixels, comprising a total of 2268 images and 6801 aircraft instances. Detailed target information and quantity distributions are presented in Table 1.
4.2. Implementation Details
All model training and testing were conducted under a unified hardware and software environment. Specifically, the experiments were performed on a workstation running the Ubuntu 20.04x64 operating system, equipped with a single 16 GB memory Quadro RTX 5000 GPU. The algorithms were implemented in Python 3.9, utilizing the PyTorch deep learning framework for model construction and optimization. For the CSAD, 70% of the images were allocated for training, while the remaining 30% were reserved for testing.
To validate the generalizability of the proposed PACE-Det architecture, two representative backbone networks in the field of object detection were selected for comparative experiments: ResNet-50 and CSPNeXt, coupled with a DETR-style head and an anchor-free detection head, respectively. During the training phase, all input images were processed at original resolution without any resizing or scaling adjustments. The training batch size was uniformly set to 2, and the maximum number of epochs was set to 100 for all models.
Specifically, for the ResNet-50 backbone, the AdamW optimizer was employed with an initial learning rate of 0.0001 and a weight decay of 0.0001. A learning rate multiplier of 0.1 was applied to the backbone network to preserve the stability of the pre-trained weights. The learning rate scheduling adopted a two-stage strategy: a linear warm-up was applied for the first 2000 iterations with a starting factor of 0.001, followed by a multi-step learning rate decay that reduced the learning rate by a factor of 0.1 at the 80th and 95th epochs to accelerate loss convergence. For the CSPNeXt backbone, the AdamW optimizer was similarly adopted, with an initial learning rate of 0.004 and a weight decay of 0.05. To enhance the generalization capability of the model, the Exponential Moving Average mechanism was employed with a momentum of 0.0002. Regarding the learning rate scheduling, a linear warm-up with an initial factor of was utilized for the first 1000 iterations, and a Cosine Annealing strategy was implemented during the latter half of the training to smoothly decay the learning rate.
Regarding the internal hyperparameters of the proposed modules presented in Section 3, the specific configurations are as follows. In the POCE module, to generate an effective Log-Gabor filter bank, the radial bandwidth and the angular bandwidth defined in Eq. 1 are 0.55 and 1.2, respectively, constructing a filter array of 4 scales and 6 orientations. When computing the structure tensor to extract local orientations, the scale of the Gaussian kernel for spatial integration in Eq. 7 is 3.0. Furthermore, during the phase congruency-guided directional colorization process described in Algorithm 1, the exponential decay constant is 0.08. In the post-processing MSCC module, considering the actual pixel dimensions occupied by aircraft targets in the high-resolution images, the local neighborhood window radius for spatial scale suppression in Eq. 12 is 4.5. Furthermore, since the POCE module encodes anisotropic target structures into specific directional color channels and suppresses isotropic background clutter into low-intensity regions, the number of color-space topological clusters K for the K-means algorithm is 5. Additionally, regarding the spatial topology filtering criterion, the filtering threshold for the area ratio of the non-target background region within a predicted bounding box is 0.9.
4.3. Parameter Sensitivity Analysis
In the proposed PACE-Det, the hyperparameter is utilized to balance the conventional detection loss and the phase-aware alignment loss . To investigate the sensitivity of the model to this hyperparameter and determine a local optimal value, a systematic parameter tuning experiment was designed. To evaluate the effectiveness of employing the PC map to constrain the loss function, this evaluation was conducted across both ResNet-50 and CSPNeXt.
Table 2 records the detection performance of the ResNet-50 and CSPNeXt backbone networks under different values of . The experimental data demonstrate that after introducing the phase-aware alignment loss, the detection accuracy of both architectures generally improves compared to the configuration where PC is not incorporated as a constraint in the loss function.
Specifically, comparing the performance across different parameter points, the optimal parameter intervals for the two backbones exhibit certain divergence. For ResNet-50, the model achieves the highest accuracy of 0.842 when is set to 1.0 and 2.0. For CSPNeXt, the accuracy reaches a peak of 0.823 when is 0.5. It is worth noting that when is 1.0, the accuracy of CSPNeXt experiences a slight drop to 0.819, but this value still significantly outperforms the unconstrained performance.
The results above indicate that although different network architectures exhibit slightly different peak sensitivities to loss weight, provides a robust balance point capable of delivering locally optimal performance improvements across architectures. Therefore, to avoid overfitting to a specific network architecture, is fixed at 1.0 as a locally optimal reference value for subsequent evaluations.
4.4. Ablation Study
The results of the ablation study for the proposed modules, evaluated on two backbone networks, are presented in Table 3. First, both baseline models demonstrate high performance under relatively loose threshold conditions, such as mAP50. This indicates that the detection capabilities of the baseline architectures approach saturation for coarse localization. However, as the requirement for localization precision increases, the baseline models experience performance degradation under higher IoU thresholds. Specifically, the baseline CSPNeXt yields an mAP90 of 0.305. This demonstrates that although conventional detection networks can roughly locate SAR targets, the generated bounding boxes lack geometric tightness.
4.4.1. Effect of POCE
The independent introduction of the POCE module yields performance improvements in high-localization-precision metrics. Specifically, in the CSPNeXt network, incorporating POCE increases the from 0.305 to 0.541; similarly, in the ResNet-50 network, the achieves an increase of 6.1% . The performance improvement achieved under high IoU thresholds is primarily attributed to the effective extraction of the geometric contours of the targets by POCE. Due to the presence of discrete strong scattering noise in single-channel grayscale SAR images, conventional networks tend to focus their attention on localized isolated scattering points, resulting in relatively loose bounding boxes. POCE utilizes PC to extract physical boundaries and maps them into directional color features. This front-end feature guidance mechanism compels the backbone network to shift its focus from local strong scattering points to the overall geometric structure of the targets during the feature extraction stage, thereby generating tighter predicted bounding boxes.
To analyze the mechanism of the POCE module from the perspective of network learning dynamics, Figure 6 plots the training convergence curves of the two backbone networks before and after the introduction of this module, using as the reference metric. It can be observed that the impact of the POCE module on the network convergence process exhibits distinct staged characteristics. Specifically, for ResNet-50, the ascent trajectory of the network equipped with POCE highly overlaps with that of the baseline network during the early training stage; as training progresses into the middle and later stages, the network equipped with POCE gradually overcomes the performance bottleneck of the baseline and ultimately converges stably at a higher precision level. In contrast, CSPNeXt experiences a temporary performance lag during the initial training stage after the introduction of POCE; however, after passing the initial feature adaptation phase, the model achieves a rapid precision increase between the 25th and 35th epochs, surpasses the baseline network, and maintains its lead thereafter. The aforementioned dynamic differences indicate that although the spatial topological priors extracted by POCE exhibit distinct adaptation processes during the early feature fitting stages across different architectures, their core value lies in providing reliable geometric constraints for feature refinement in the middle and later stages of the network. Such physical constraints enable the model to avoid prematurely falling into local optima, thereby elevating the final performance upper bound of the detection task.
4.4.2. Effect of MSCC
When applying the MSCC post-processing filter to the baseline detectors independently of the core optimization process, detection performance is notably improved, particularly in suppressing false alarms induced by airport backgrounds. Since MSCC requires color-space representations for topological clustering, deploying only MSCC means that the pseudo-color images generated by the POCE module need to be exported for color space conversion and clustering, but the images participating in the inference phase are the original grayscale SAR images unprocessed by the POCE module. By applying the spatial masks generated by MSCC to the predicted bounding boxes generated by the baseline detector trained on grayscale SAR images, stable improvements in localization precision are observed across both baseline models. Specifically, within the CSPNeXt network, the sole addition of the MSCC elevates the metric from 0.305 to 0.460. Concurrently, in the ResNet-50 network, the is boosted from 0.916 to 0.938. Based on the experimental data, it can be concluded that by introducing spatial constraints and performing overlap ratio verification on the initial bounding boxes generated by the core detection network, the MSCC module effectively filters out false positives emerging on anisotropic, high-intensity scatterers. Consequently, it successfully enhances precision without compromising the recall rate, thereby realizing accuracy improvements across various threshold conditions.
However, it should be pointed out that the empirical effectiveness demonstrated by the MSCC module in suppressing airport clutter is currently primarily based on heuristic modeling. The establishment and effective operation of this module fundamentally rely on the preceding feature mapping of the POCE module; namely, MSCC can only execute topological clustering in the color space after POCE successfully encodes anisotropic objects in grayscale SAR images into pseudo-colors and suppresses isotropic backgrounds into dark tones. Consequently, the applicability boundary of the MSCC module is directly constrained by the geometric and scattering feature contrast between targets and the background.
Finally, when integrating both the POCE and MSCC modules simultaneously, the model achieves the highest detection performance among the tested configurations. Since POCE provides tight contour guidance at the structural feature level, while MSCC enforces strict clutter filtering at the spatial topological level, the two modules form effective complementary advantages. The final PACE-Det architecture achieves metrics of 0.851 and 0.836 on ResNet-50 and CSPNeXt, respectively. This demonstrates that the combined configuration can simultaneously maintain high localization precision and effective false alarm suppression capabilities when dealing with complex SAR airport scenarios.
4.5. Efficiency Analysis
After validating the performance improvements yielded by the POCE and MSCC modules, it is essential to evaluate the computational overhead introduced by these physical priors and spatial constraints. Table 4 presents the end-to-end efficiency comparison of the models based on two backbone architectures.
Fundamentally, for both backbone architectures, the additional parameters and computational cost introduced by PACE-Det originate entirely from the same components. Specifically, the computational increment of approximately 3.7 GFLOPs stems from the POCE frequency-domain transformations executed prior to the core network, alongside the MSCC clustering operations applied as post-processing. Meanwhile, the parameter increment of 0.147 M is attributed to the physical alignment projector, which is activated exclusively during the training phase. Within the detection framework, regardless of whether ResNet-50 or CSPNeXt is adopted, the extracted multi-scale features are uniformly mapped to a fixed 256 channels by the neck network. Since the feature map dimensions received by the projector are strictly fixed, its own convolutional layer structure and parameter count naturally remain consistent.
4.6. Comparison with State-of-the-Art Methods
To further validate the detection efficacy of PACE-Det in complex SAR scenarios, this subsection presents a comprehensive performance comparison with several SOTA object detection frameworks. The selection of baseline models encompasses diverse architectural paradigms, including classical two-stage detection frameworks, representative single-stage models, Transformer-based architectures, and specialized SAR aircraft detectors. For a rigorous evaluation, the CSAD is partitioned into training and testing sets with a 7:3 ratio, consisting of the first 70% and the remaining 30% of the images, respectively. While all experiments are conducted under identical hardware and software environments to ensure fairness, the hyperparameters for each baseline model are adaptively fine-tuned according to their inherent architectural characteristics to facilitate stable convergence and optimal performance.
Based on the conclusions of the ablation study, the PACE-Det configuration with the ResNet-50 backbone is selected as the default implementation for comparison, as it yields the optimal overall performance. As presented in Table 5, PACE-Det achieves a comprehensive of 0.851, outperforming all other baseline models.
Regarding the performance distribution across different IoU thresholds, YOLOv8m achieves the highest accuracy of 0.992 under the relaxed metric. This indicates that purely data-driven single-stage models can effectively learn coarse semantic information through deep network architectures to provide initial localization. However, under more stringent localization requirements such as and , the performance of general frameworks degrades significantly. In contrast, PACE-Det demonstrates superior adaptability, achieving peak values of 0.948 and 0.561 for and , respectively.
The performance limitations of general frameworks at high IoU thresholds primarily stem from the inability of purely data-driven visual mechanisms to fully adapt to the specific physical phenomena of SAR imagery. Traditional convolutional neural networks, such as Faster R-CNN and Cascade R-CNN, are prone to local feature confusion when encountering discrete scattering and high-intensity background clutter. Meanwhile, the attention mechanism in Transformer architectures, represented by Deformable DETR, is affected by speckle noise, making it difficult to focus precisely on the complete geometric topology of targets without spatial constraints.
As validated in the previous ablation study, the capability of PACE-Det to overcome these bottlenecks fundamentally relies on the synergy between the POCE and MSCC modules. While conventional frameworks suffer from localization drift or false alarms in complex SAR airport scenarios due to the lack of physical modeling and spatial constraints, PACE-Det maintains robustness through physical contour guidance in the early stages and spatial topological filtering in the late stages. Consequently, it comprehensively surpasses existing advanced architectures in terms of extreme detection precision.
Building upon the aforementioned quantitative evaluation that underscores extreme detection precision, the testing scope is extended from standard image slices to large-scale simulated monitoring scenarios to further verify the practical applicability of PACE-Det in complex scenarios. In accordance with the construction strategy of the CSAD, aircraft detection and recognition tasks characteristic of practical airport scenes are reconstructed by implanting aircraft targets into large-scale empty airport backgrounds. Sliding window detection is performed on two simulated large-scale airport scenes, using the specialized SAR aircraft detector PGD as a benchmark. The detection results are illustrated in Figure 7.
Notably, to demonstrate the cross-framework applicability of the proposed spatial constraints, the topological masks generated by PACE-Det were exported offline and subsequently integrated into the inference phase of PGD for joint spatial verification. As shown in Figure 7, clutter from airport peripheral facilities is effectively suppressed, with neither PGD nor PACE-Det producing false positive predictions outside the target areas. Furthermore, while PGD demonstrates proficient classification of specific aircraft models due to its extensive training on the SAR-AIRcraft-1.0 dataset, it struggles to generate bounding boxes that tightly fit the targets. Consequently, a portion of the predicted boxes generated by PGD fail to achieve the strict IoU threshold of 0.8 and are excluded from the final visualization. The ground truth boxes of these targets are highlighted in red to clarify that such misses are caused by localization deficiency rather than classification failure. We verified that these targets are actually correctly classified when the IoU requirement is relaxed. In Figure 7, even for a PGD prediction that meets the 0.8 IoU threshold, the box still encapsulates significant clutter from adjacent boarding bridges.
In contrast, these localization and fitting issues are effectively resolved in PACE-Det. The superiority of PACE-Det stems from the POCE module, which introduces spatial topological priors to guide the feature alignment process. Unlike purely data-driven bounding box regression, the phase-aware guidance ensures that the model remains sensitive to the inherent spatial geometric structures of the aircraft, rather than being biased by high-intensity noise or overlapping background echoes.
In summary, the experimental evaluations presented substantiate the effectiveness of the proposed framework. The results indicate that the performance advantages of PACE-Det, particularly at high IoU thresholds, are primarily attributed to the synergy between the physical contour guidance provided by the POCE module and the spatial topological constraints of the MSCC module. Both the quantitative analysis on standardized datasets and the qualitative results in large-scale simulated scenes demonstrate the model’s capability to mitigate scattering discreteness and background interference, confirming that PACE-Det provides a reliable technical solution for high-precision SAR aircraft detection in complex environments.
5. Conclusion and Future Work
To reduce the target localization errors and false alarms caused by scattered target pixels, speckle noise, and complex background clutters, a novel SAR aircraft detection network capable of discrimination feature learning in color space named as PACE-Det is proposed in this work. By employing a color-space feature representation preprocessing module POCE and a clustering-based post-processing module MSCC, the proposed framework integrates the radar physical scattering model and spatial topological constraints into the learning process and exhibits robust target detection and clutter suppression performance. Specifically, the front-end POCE module is capable of generating structurally-enhanced colorized SAR images based on phase congruency by extracting the local spatial phase and structure orientation of the image, which could effectively mitigate the speckle effect and optimize the visual features of aircraft. The color representations are fed into the core detection network, which employs a specially-devised loss function combining the phase-aware alignment loss as well as the classification and regression loss. Finally, the initial predictions generated by the core detection network are further refined by the contextual information extracted by the post-processing MSCC module based on the image segmentation result in color space. Extensive experiments on the self-constructed CSAD show that the proposed PACE-Det framework is capable of generating accurate object bounding boxes under stringent IoU thresholds, particularly at and , and eliminating false alarms. It indicates that the challenging problem of aircraft detection in large-scene SAR images could be effectively tackled within the framework of informative machine learning by jointly exploiting informative SAR target feature enhancement processing in color space at the beginning and clustering-based geometric consistency verification at the end.
Despite the effectiveness demonstrated by PACE-Det, a limitation of this study lies in the synthetic nature of the constructed CSAD dataset. Because the dataset is generated by fusing aircraft target patches with independent airport scenes, it lacks the scattering characteristics and contextual information of real-world SAR imagery. Furthermore, due to the restricted accessibility of current commercial color SAR products, comprehensive validation on physical multi-aperture colored data remains unsupported at this stage. Consequently, the generalization capability of the proposed framework in real-world environments warrants further investigation. As future work, we plan to accumulate more real large-scene SAR imagery and actual CSI data to validate and refine the PACE-Det framework, aiming to bridge the gap between synthetic dataset evaluations and practical application scenarios.
Author Contributions
Writing - original draft, methodology, data curation, validation, Y.Z.; conceptualization, writing - review & editing, funding acquisition, Z.G.; data curation and visualization, L.Y.; supervision, D.Z. All authors have read and agreed to the published version of the manuscript.
Funding
This work was supported by National Natural Science Foundation of China Grant 62301250.
Institutional Review Board Statement
Not applicable.
Informed Consent Statement
Not applicable.
Data Availability Statement
Some of the data are available upon request.
Conflicts of Interest
The authors declare no conflicts of interest.
References
- Uhlmann, S.; Kiranyaz, S. Classification of dual- and single polarized SAR images by incorporating visual features. ISPRS J. Photogramm. Remote Sens. 2014, 90, 10–22. [Google Scholar] [CrossRef]
- Hochstuhl, S.; Pfeffer, N.; Thiele, A.; Hinz, S.; Amao-Oliva, J.; Scheiber, R.; Reigber, A.; Dirks, H. Pol-InSAR-island - a benchmark dataset for multi-frequency Pol-InSAR data land cover classification. ISPRS Open J. Photogramm. Remote Sens. 2023, 10, 100047. [Google Scholar] [CrossRef]
- Vehmas, R.; Dogan, O.; Ignatenko, V.; Radius, A.; Muff, D.; Leprovost, P.; Nottingham, M.; Vilja, P.; Seilonen, T.; Arbenina, M.; Castillo, J. A look at spotlight extended dwell – a new level of information content from small-satellite SAR. IGARSS 2024-2024 IEEE Int. Geosci. Remote Sens. Symp. 2024, 1169–1172. [Google Scholar] [CrossRef]
- Ignatenko, V.; Dogan, O.; Radius, A.; Nottingham, M.; Muff, D.; Lamentowski, L.; Leprovost, P.; Vehmas, R.; Seilonen, T.; Vilja, P. ICEYE microsatellite SAR constellation: SAR data quality improvements and new dwell imaging mode. in: EUSAR 2024; 15th European Conference on Synthetic Aperture Radar; 2024, pp. 1118–1192.
- De, S.; Cazcarra-Bes, V.; Castelletti, D.; Stringham, C.; Farquharson, G. Applications of very high resolution X-band SAR data acquired by the Capella space constellation. in: EUSAR 2024; 15th European Conference on Synthetic Aperture Radar; 2024, pp. 1307–1312.
- Wang, Z.; Kang, Y.; Zeng, X.; Wang, Y.; Zhang, T.; Sun, X. SAR-AIRcraft-1.0: High-resolution SAR aircraft detection and recognition dataset. J. Radars 2023, 12, 906–922. [Google Scholar]
- Li, Y.; Li, X.; Li, W.; Hou, Q.; Liu, L.; Cheng, M.-M.; Yang, J. SARDet-100K: Towards open-source benchmark and toolkit for large-scale SAR object detection. 2024. Available online: https://arxiv.org/abs/2403.06534.
- Huang, Z.; Liu, L.; Yang, S.; Wang, Z.; Cheng, G.; Han, J. Physics-guided detector for SAR airplanes. IEEE Trans. Circuits Syst. Video Technol. 2025, 35, 12082–12095. [Google Scholar] [CrossRef]
- You, R.; Qian, Y.; Xu, F. Preliminary research on the effectiveness of Gestalt perceptual principles in SAR. J. Radars 2024, 13, 345–358. [Google Scholar]
- Novak, L.; Halversen, S.; Owirka, G.; Hiett, M. Effects of polarization and resolution on SAR ATR. IEEE Trans. Aerosp. Electron. Syst. 1997, 33, 102–116. [Google Scholar] [CrossRef]
- Kang, Y.; Wang, Z.; Fu, J.; Sun, X.; Fu, K. SFR-Net: Scattering feature relation network for aircraft detection in complex SAR images. IEEE Trans. Geosci. Remote Sens. 2022, 60, 1–17. [Google Scholar] [CrossRef]
- Dou, F.; Diao, W.; Sun, X.; Zhang, Y.; Fu, K. Aircraft reconstruction in high resolution SAR images using deep shape. J. Radars 2017, 6, 503–513. [Google Scholar] [CrossRef]
- Geng, Z.; Zhang, S.; Xu, C.; Zhou, H.; Li, W.; Yu, X.; Zhu, D.; Zhang, G. Context-driven automatic target detection with cross-modality real-synthetic image merging. IEEE J. Sel. Top. Appl. Earth Obs. Remote Sens. 2025, 18, 5600–5618. [Google Scholar] [CrossRef]
- Sun, Y.; Jiang, W.; Yang, J.; Li, W. SAR target recognition using cGAN-based SAR-to-optical image translation. Remote Sens. 2022. [Google Scholar] [CrossRef]
- Qian, Y.; Pu, X.; Jia, H.; Wang, H.; Xu, F. Arnet: Prior knowledge reasoning network for aircraft detection in remote-sensing images. IEEE Trans. Geosci. Remote Sens. 2024, 62, 1–14. [Google Scholar] [CrossRef]
- Qing, Y.; Zhu, J.; Feng, H.; Liu, W.; Wen, B. Two-way generation of high-resolution EO and SAR images via dual distortion-adaptive GANs. Remote. Sens. 2023, 15, 1878. [Google Scholar] [CrossRef]
- Lan, T.; He, S.; Qing, Y.; Wen, B. Leveraging mixed data sources for enhanced road segmentation in synthetic aperture radar images. Remote Sens. 2024, 16. [Google Scholar] [CrossRef]
- Xu, C.; Geng, Z.; Wu, L.; Zhu, D. Enhanced semantic segmentation in remote sensing images with SAR-optical image fusion (IF) and image translation (IT). Sci. Rep. 2025, 35433. [Google Scholar] [PubMed]
- Geng, Z.; Li, W.; Xu, Y.; Wang, B.-N.; Zhu, D.-Y. SAR image scene classification and out-of-library target detection with cross-domain active transfer learning. IGARSS 2023 - 2023 IEEE International Geoscience and Remote Sensing Symposium, 2023; pp. 7023–7026. [Google Scholar] [CrossRef]
- Geng, Z.; Zhang, S.; Zhang, Y.; Xu, C.; Wu, L.; Zhu, D. Parking pattern guided vehicle and aircraft detection in aligned SAR-EO aerial view images Remote Sensing 17. 2025. [Google Scholar] [CrossRef] [PubMed]
- Zhou, H.; Geng, Z.; Sun, M.; Wu, L.; Yan, H. Context-guided SAR ship detection with prototype-based model pretraining and check-balance-based decision fusion. Sensors 2025. [Google Scholar] [CrossRef] [PubMed]
- Shen, K.; Vivone, G.; Yang, X.; Lolli, S.; Schmitt, M. A benchmarking protocol for SAR colorization: From regression to deep learning approaches. Neural Netw. 2024, 169, 698–712. [Google Scholar] [CrossRef] [PubMed]
- Shen, K.; Vivone, G.; Lolli, S.; Schmitt, M.; Yang, X.; Chanussot, J. IcGAN4ColSAR: A novel multispectral conditional generative adversarial network approach for SAR image colorization. IEEE Geosci. Remote Sens. Lett. 2025, 22, 1–5. [Google Scholar] [CrossRef]
- Islam, M. N.; Anand, A.; Mandal, M.; Mohanty, L.; Dash, A. SAR image colorization using cGAN and gradient difference in LAB color space. in: 2025 International Conference on Artificial intelligence and Emerging Technologies (ICAIET); 2025, pp. 1–5. [CrossRef]
- Suo, Y.; Wu, Y.; Miao, T.; Diao, W.; Sun, X.; Fu, K. Adaptive SAR image enhancement for aircraft detection via speckle suppression and channel combination. IEEE Trans. Geosci. Remote Sens. 2024, 62, 1–15. [Google Scholar] [CrossRef]
Figure 1.
Overall architecture of PACE-Det. The framework consists of three main components: 1) The front-end POCE module maps the discrete SAR scattering points into an orientation-color space utilizing PC and structure tensor; 2) The core detection network extracts deep semantic features for initial bounding box predictions, optimized jointly by the phase-aware alignment loss during training; 3) The post-processing MSCC module enforces spatial constraints by first applying low-pass filtering to suppress micro-scale targets, followed by feature clustering to generate a macroscopic topological mask.
Figure 1.
Overall architecture of PACE-Det. The framework consists of three main components: 1) The front-end POCE module maps the discrete SAR scattering points into an orientation-color space utilizing PC and structure tensor; 2) The core detection network extracts deep semantic features for initial bounding box predictions, optimized jointly by the phase-aware alignment loss during training; 3) The post-processing MSCC module enforces spatial constraints by first applying low-pass filtering to suppress micro-scale targets, followed by feature clustering to generate a macroscopic topological mask.
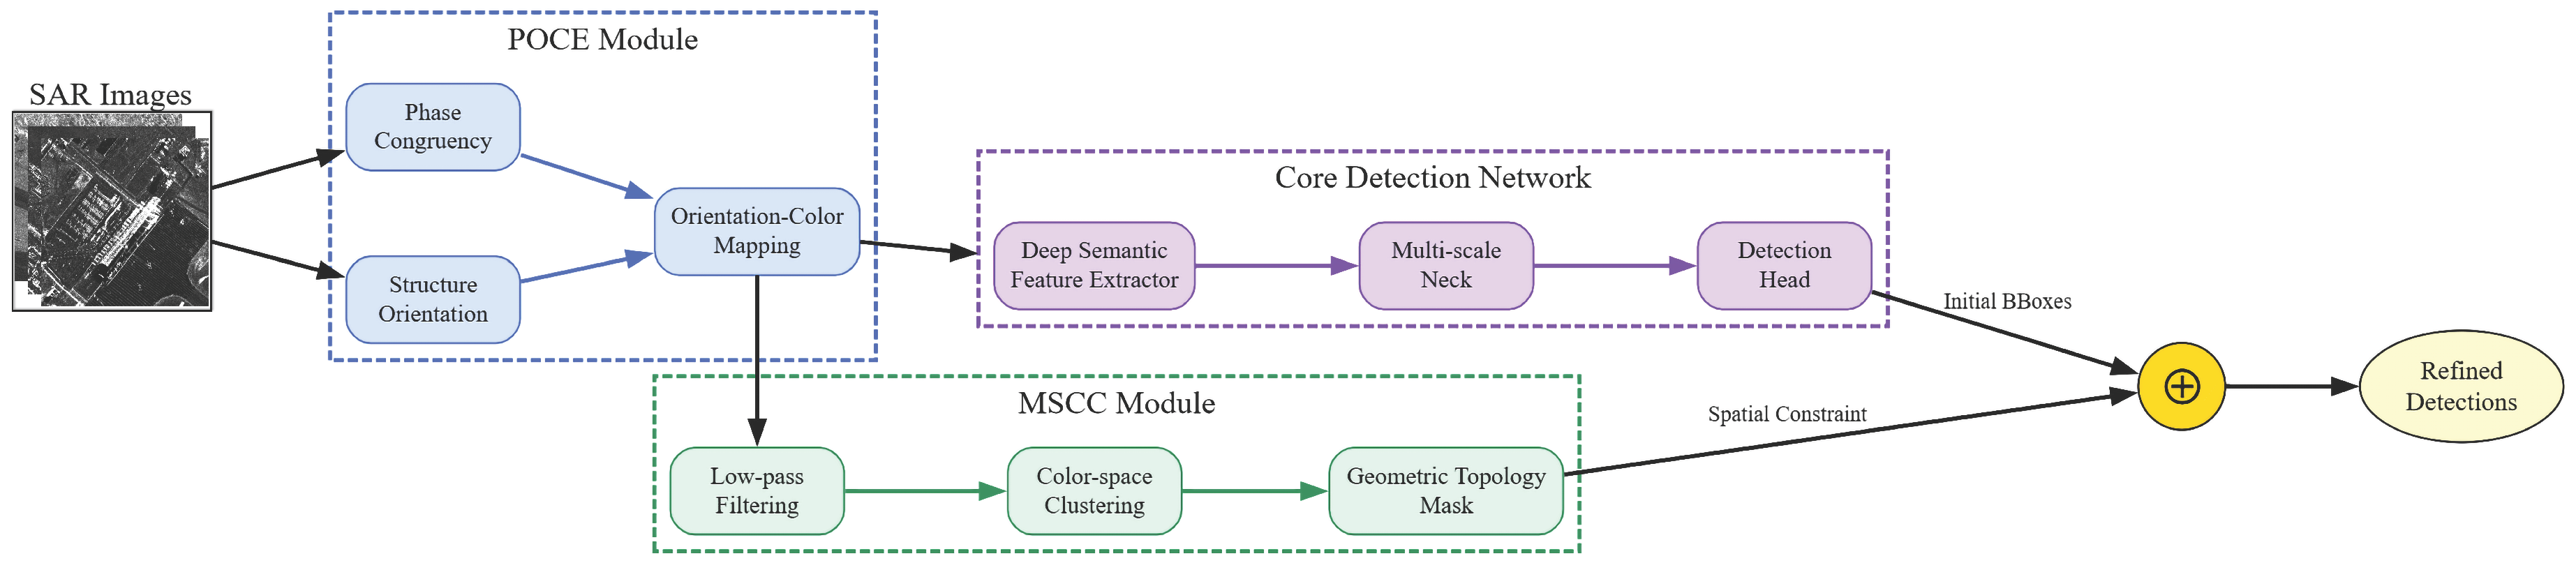
Figure 2.
The schematic architecture of the POCE module.
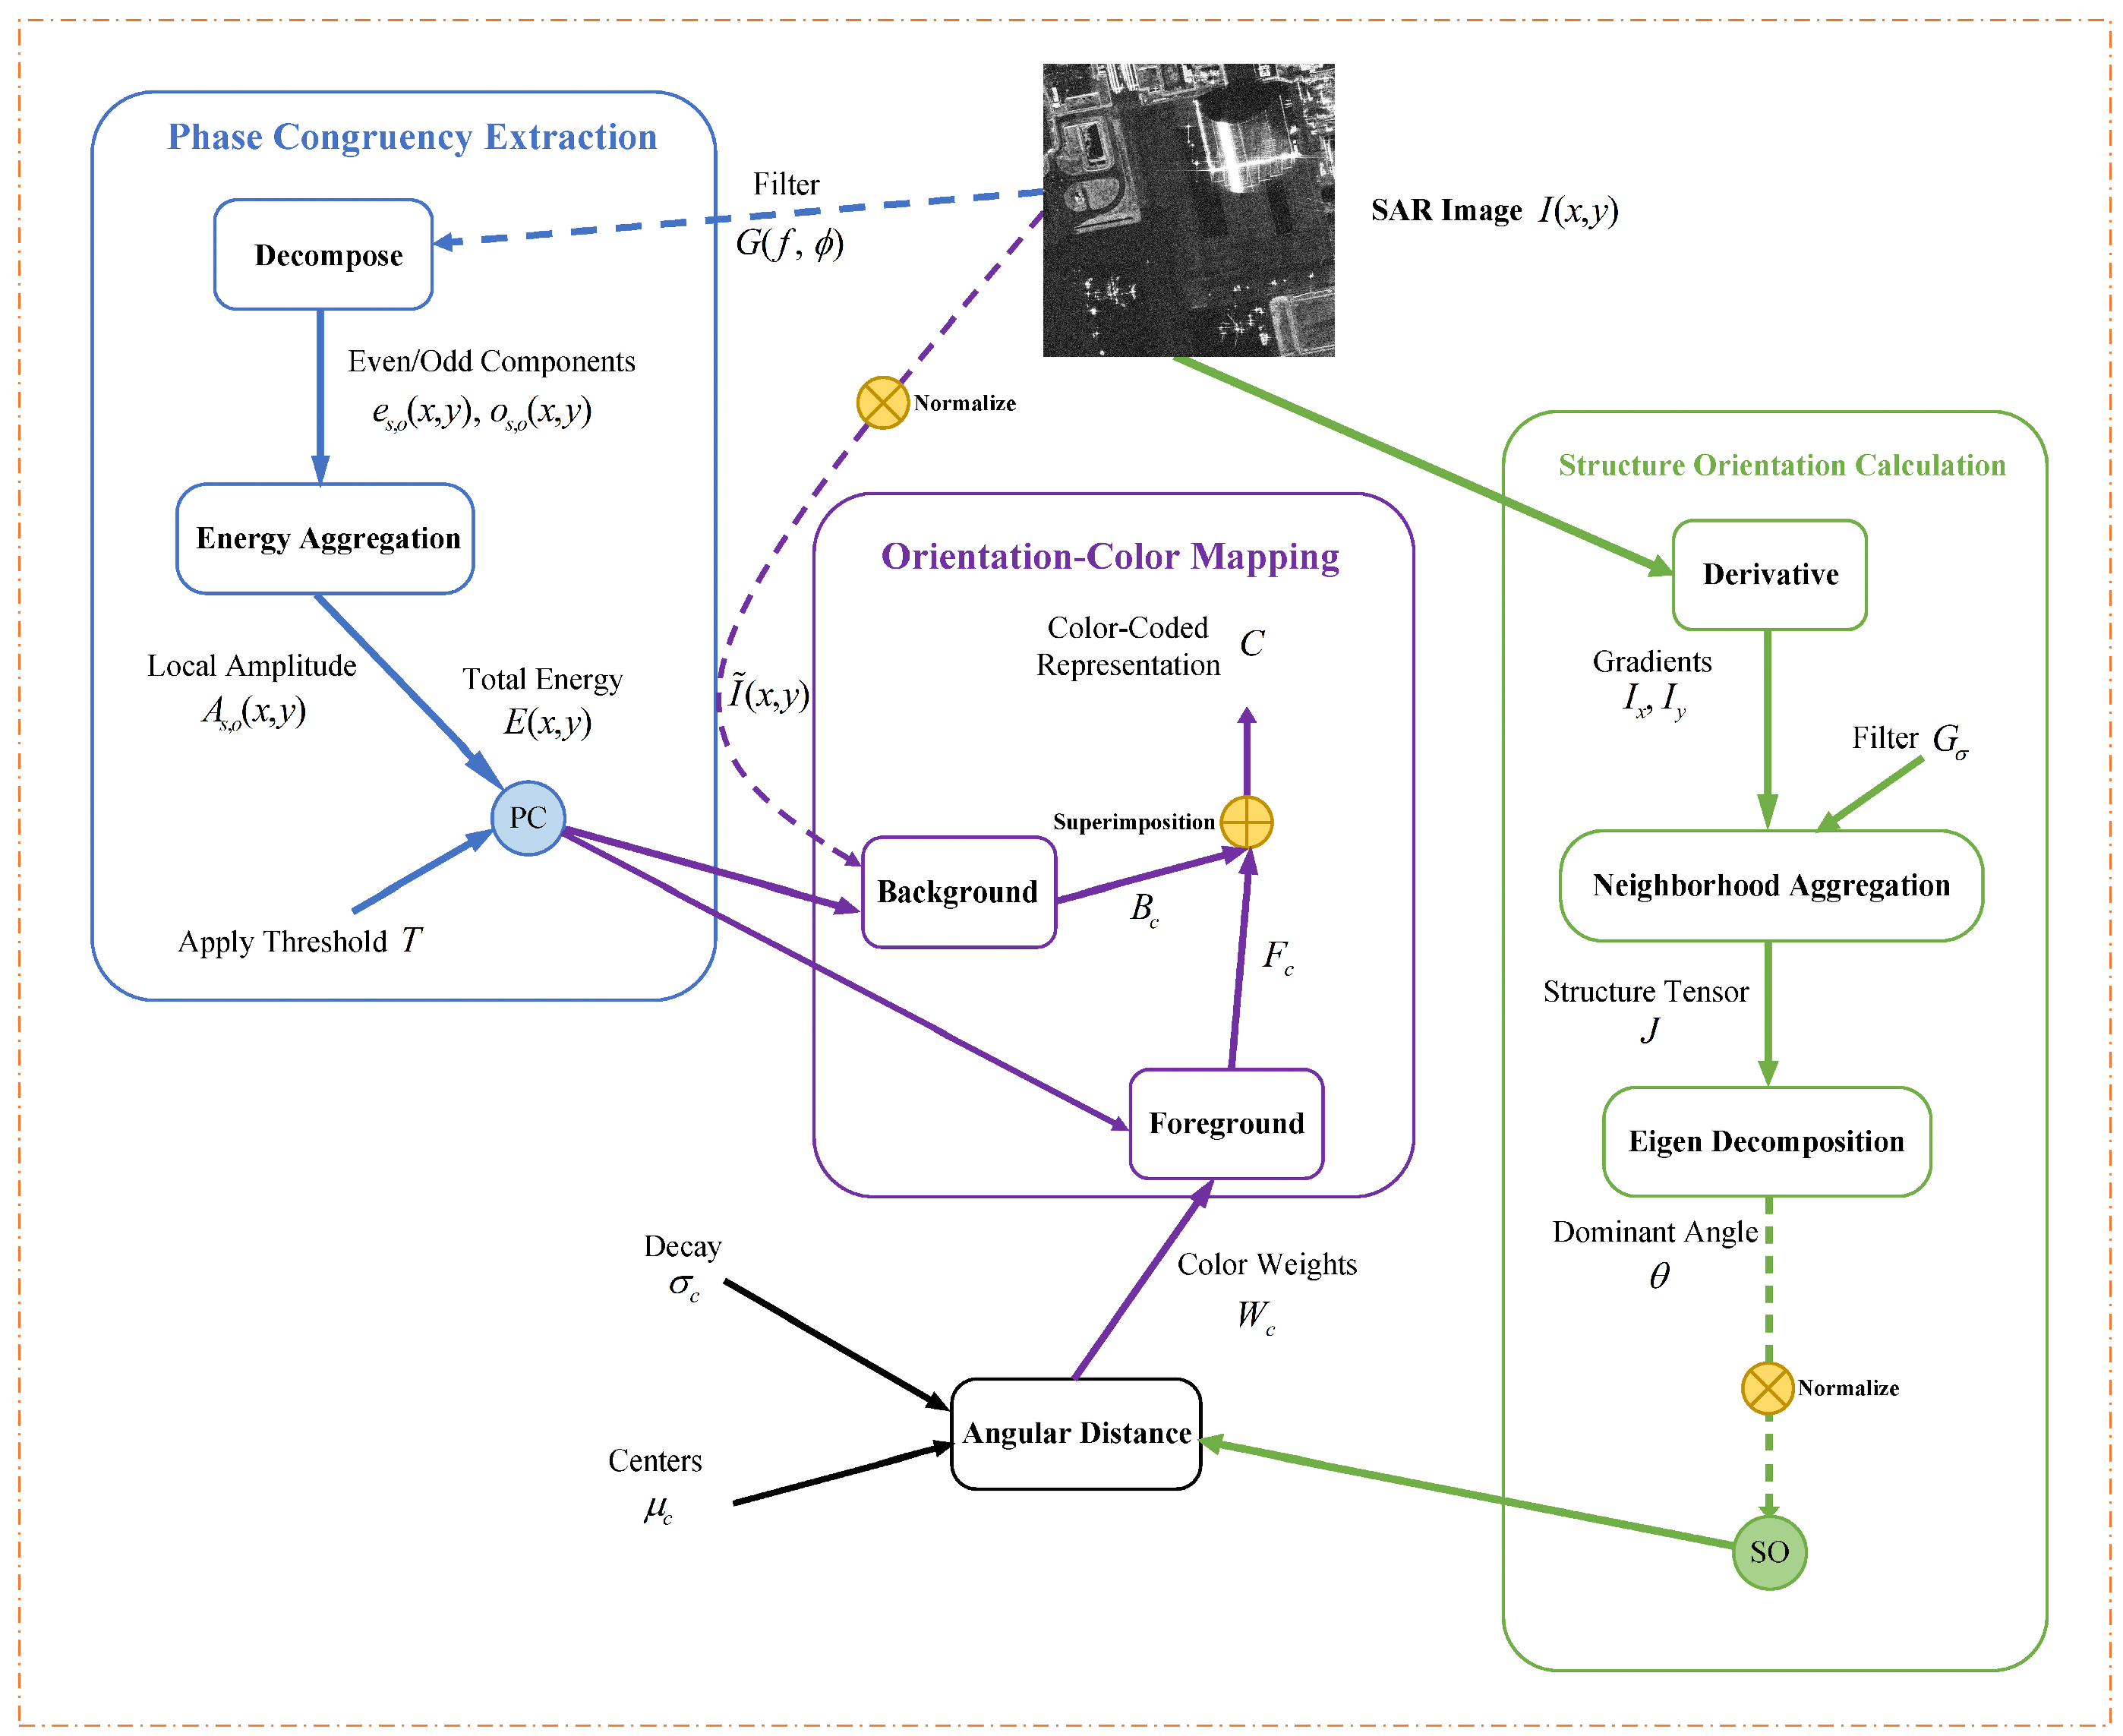
Figure 3.
Illustration of the PC-guided directional color coding mechanism, presenting the periodic Gaussian response functions for the three color channels across the SO. The distance is computed with axial symmetry, resolving the orientation discontinuity at the boundaries.
Figure 3.
Illustration of the PC-guided directional color coding mechanism, presenting the periodic Gaussian response functions for the three color channels across the SO. The distance is computed with axial symmetry, resolving the orientation discontinuity at the boundaries.
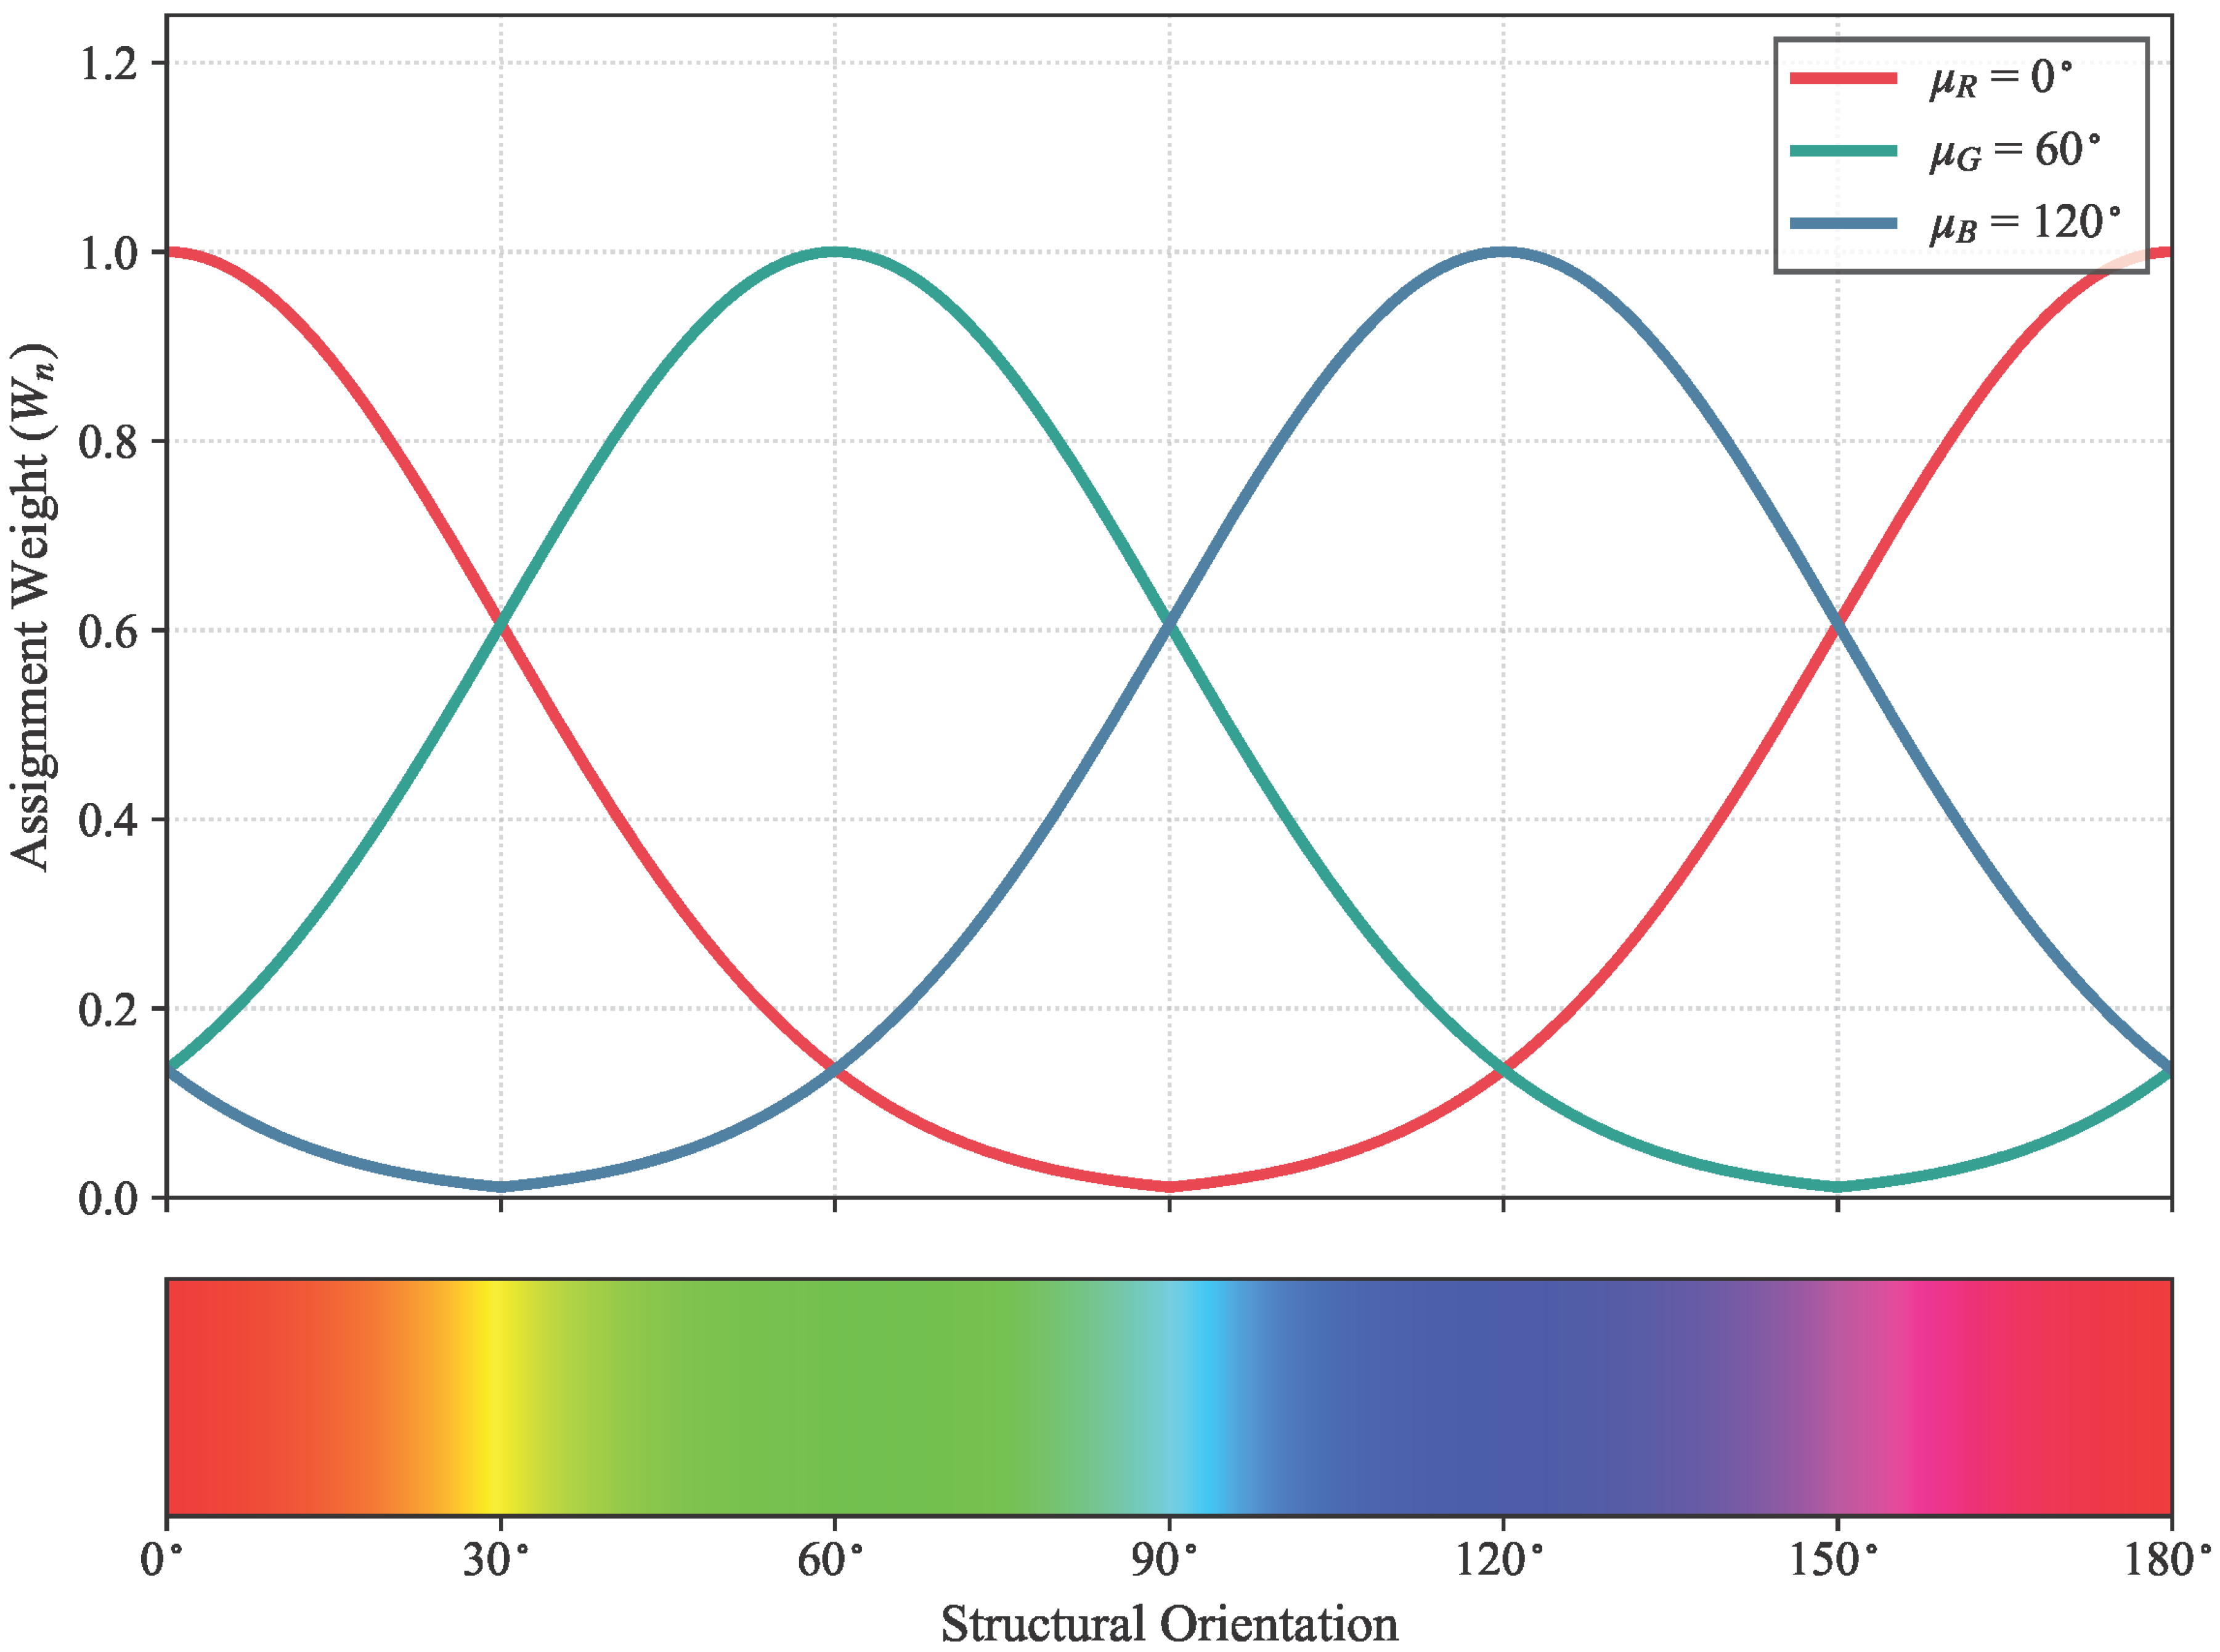
Figure 4.
Visual demonstration of the proposed PC-guided directional color coding mechanism. (a) The original SAR image I. (b) The PC map , serving as a physical confidence metric to locate anisotropic structures. (c) The final color-coded representation C. It highlights man-made targets with directional colors while suppressing the isotropic natural textures into a monochromatic backdrop, significantly enlarging the inter-class feature distance.
Figure 4.
Visual demonstration of the proposed PC-guided directional color coding mechanism. (a) The original SAR image I. (b) The PC map , serving as a physical confidence metric to locate anisotropic structures. (c) The final color-coded representation C. It highlights man-made targets with directional colors while suppressing the isotropic natural textures into a monochromatic backdrop, significantly enlarging the inter-class feature distance.
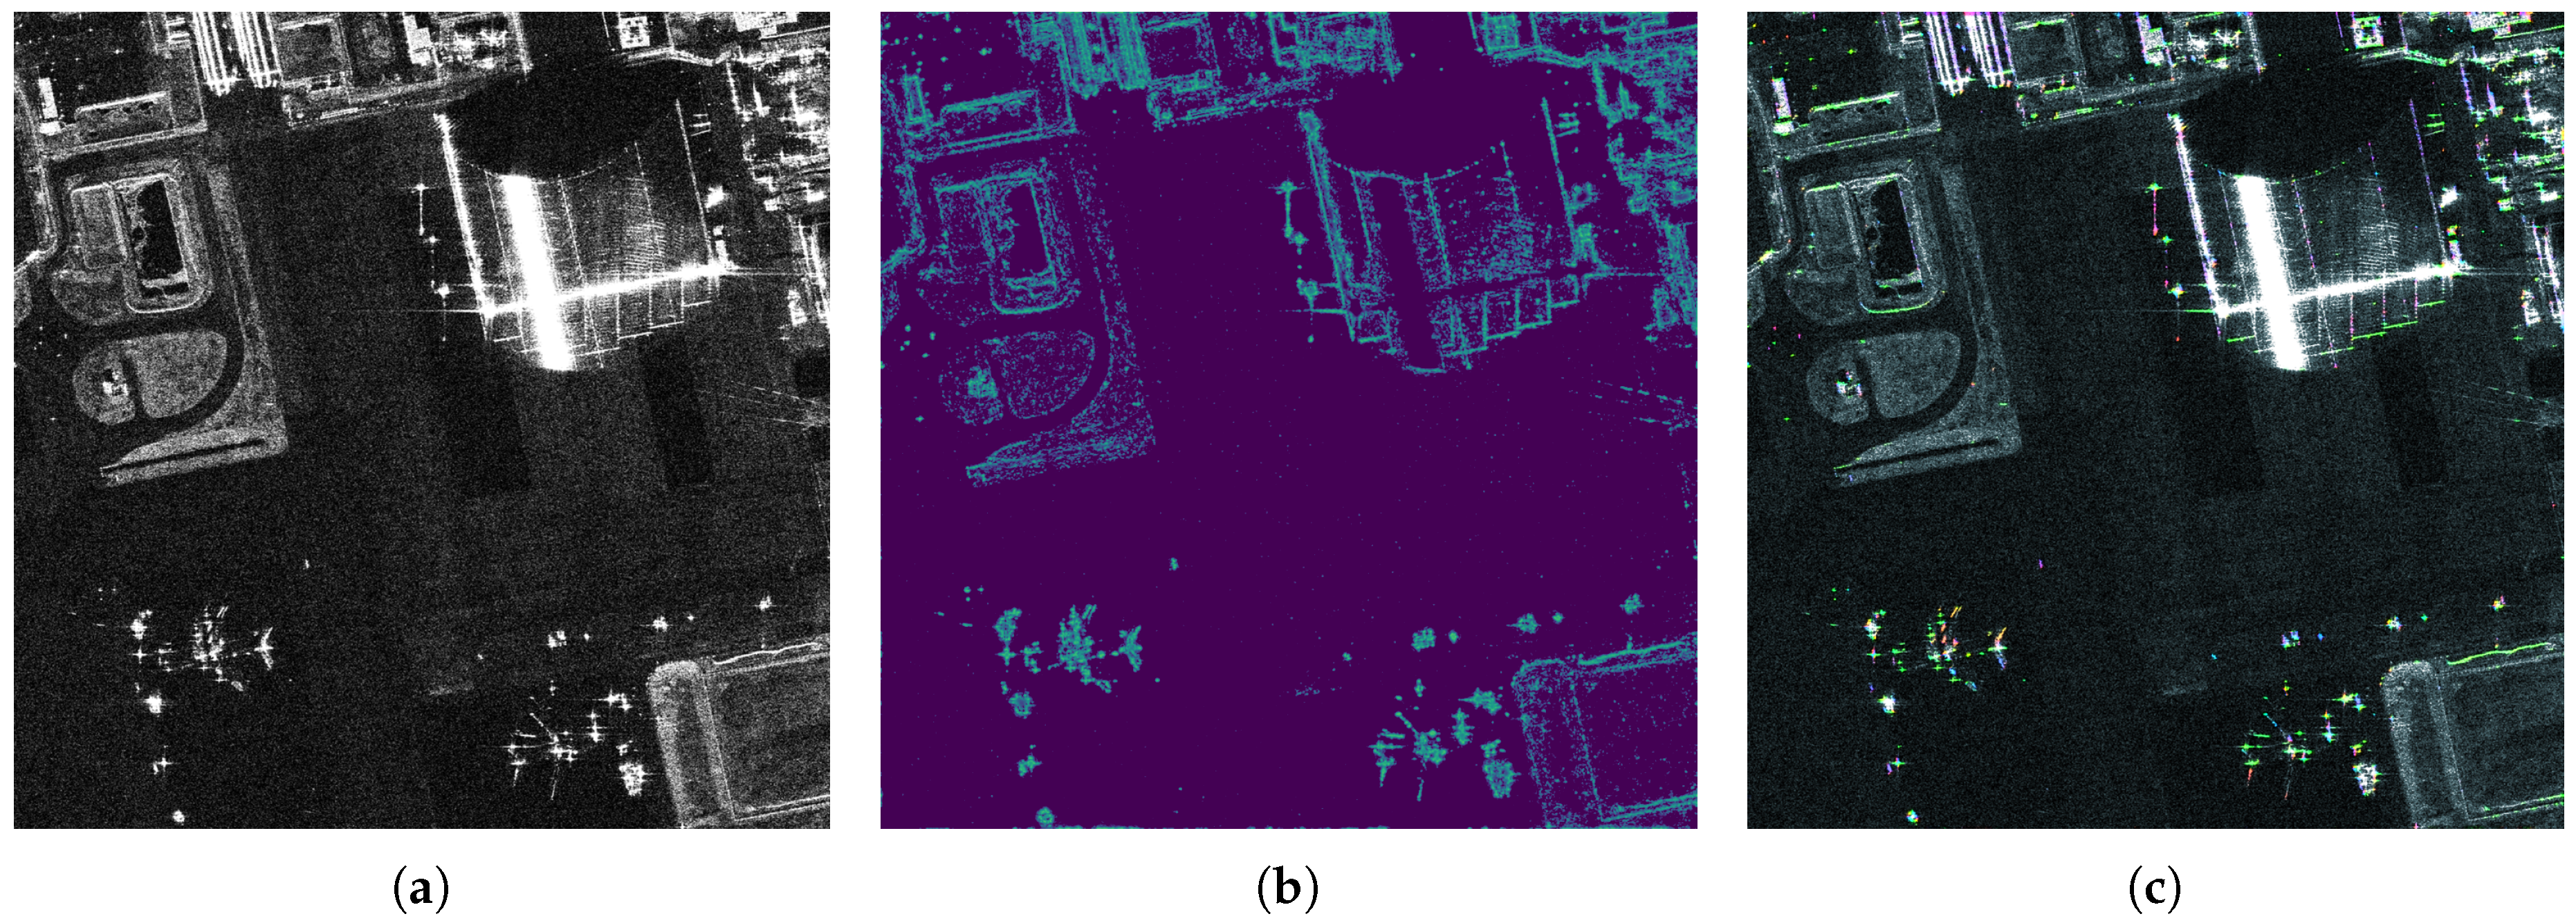
Figure 5.
Visualization of the MSCC module workflow. (a) The colorized SAR image, generated by POCE. (b) K-means clustering results, where the potential aircraft maneuvering areas are distinguished by the global mean luminance . (c) The spatial constraint, where white regions indicate the potential aircraft maneuvering areas, used for joint decision-making with the predicted bounding boxes. (d) Ground truth labels of the areas mentioned, shown in white for comparison.
Figure 5.
Visualization of the MSCC module workflow. (a) The colorized SAR image, generated by POCE. (b) K-means clustering results, where the potential aircraft maneuvering areas are distinguished by the global mean luminance . (c) The spatial constraint, where white regions indicate the potential aircraft maneuvering areas, used for joint decision-making with the predicted bounding boxes. (d) Ground truth labels of the areas mentioned, shown in white for comparison.
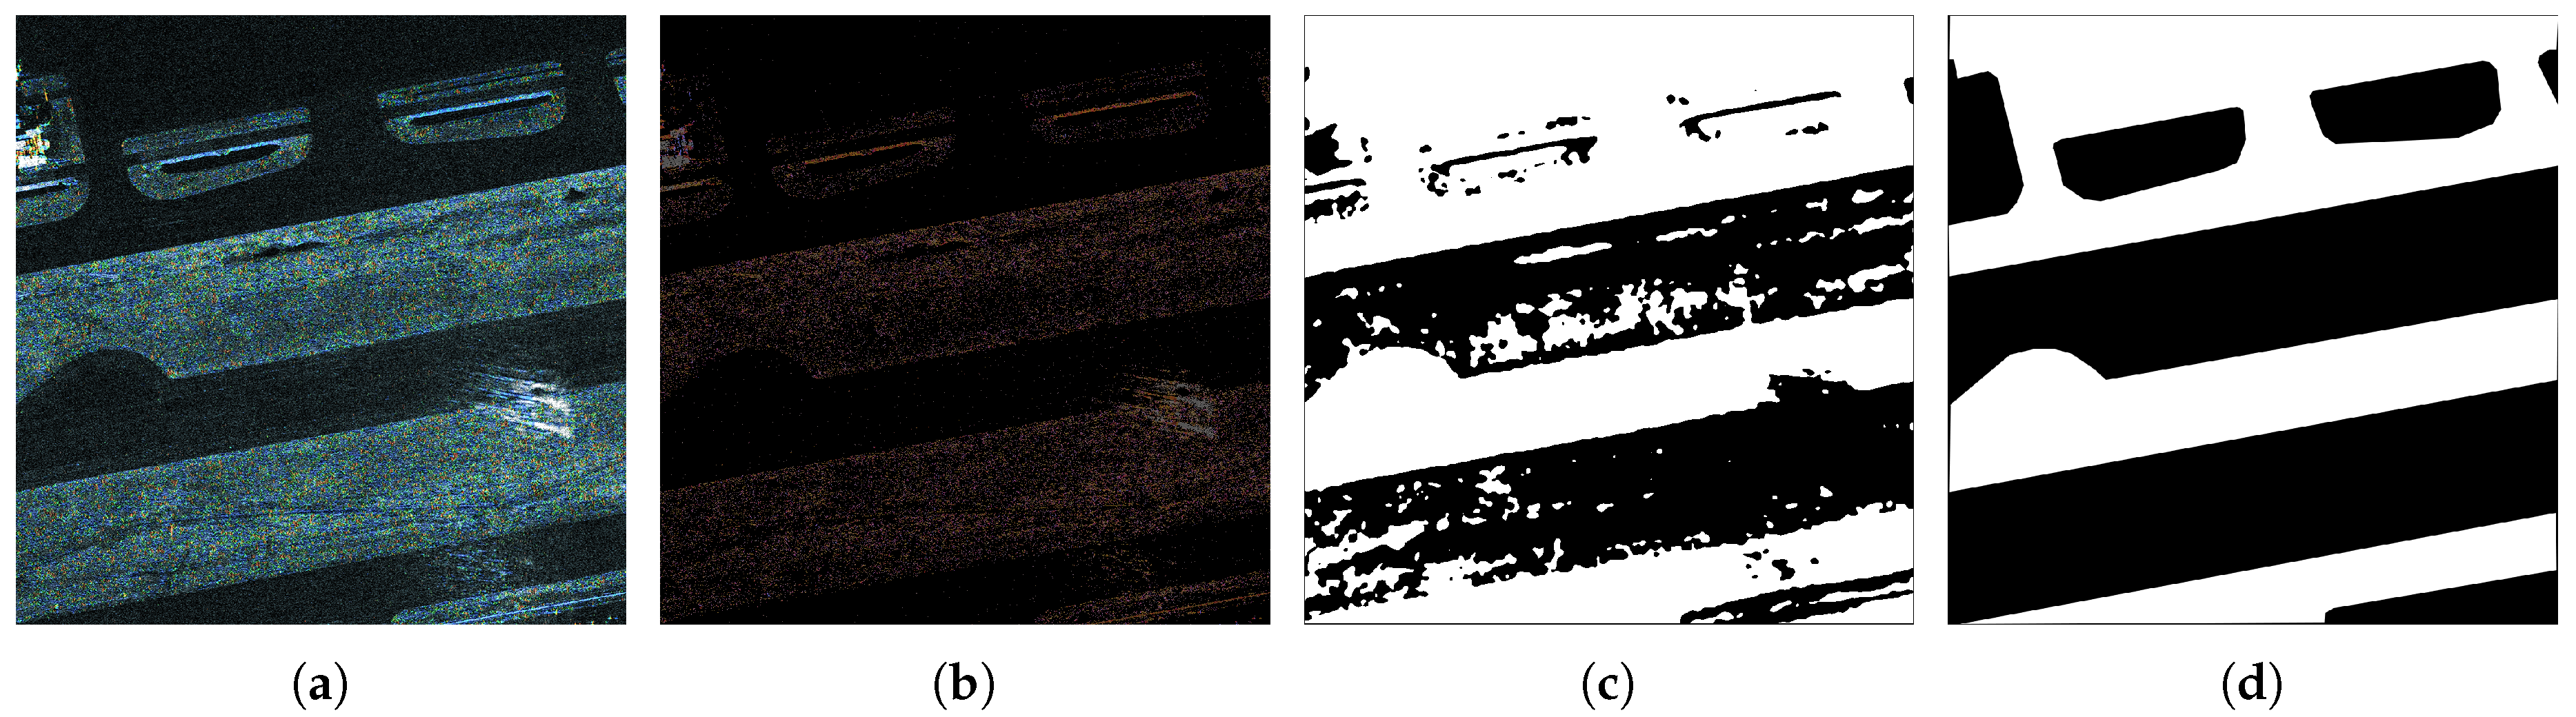
Figure 6.
Training convergence curves of different backbone networks before and after introducing the POCE module. The inset highlights the final convergence details from the 70th to 100th epochs.
Figure 6.
Training convergence curves of different backbone networks before and after introducing the POCE module. The inset highlights the final convergence details from the 70th to 100th epochs.
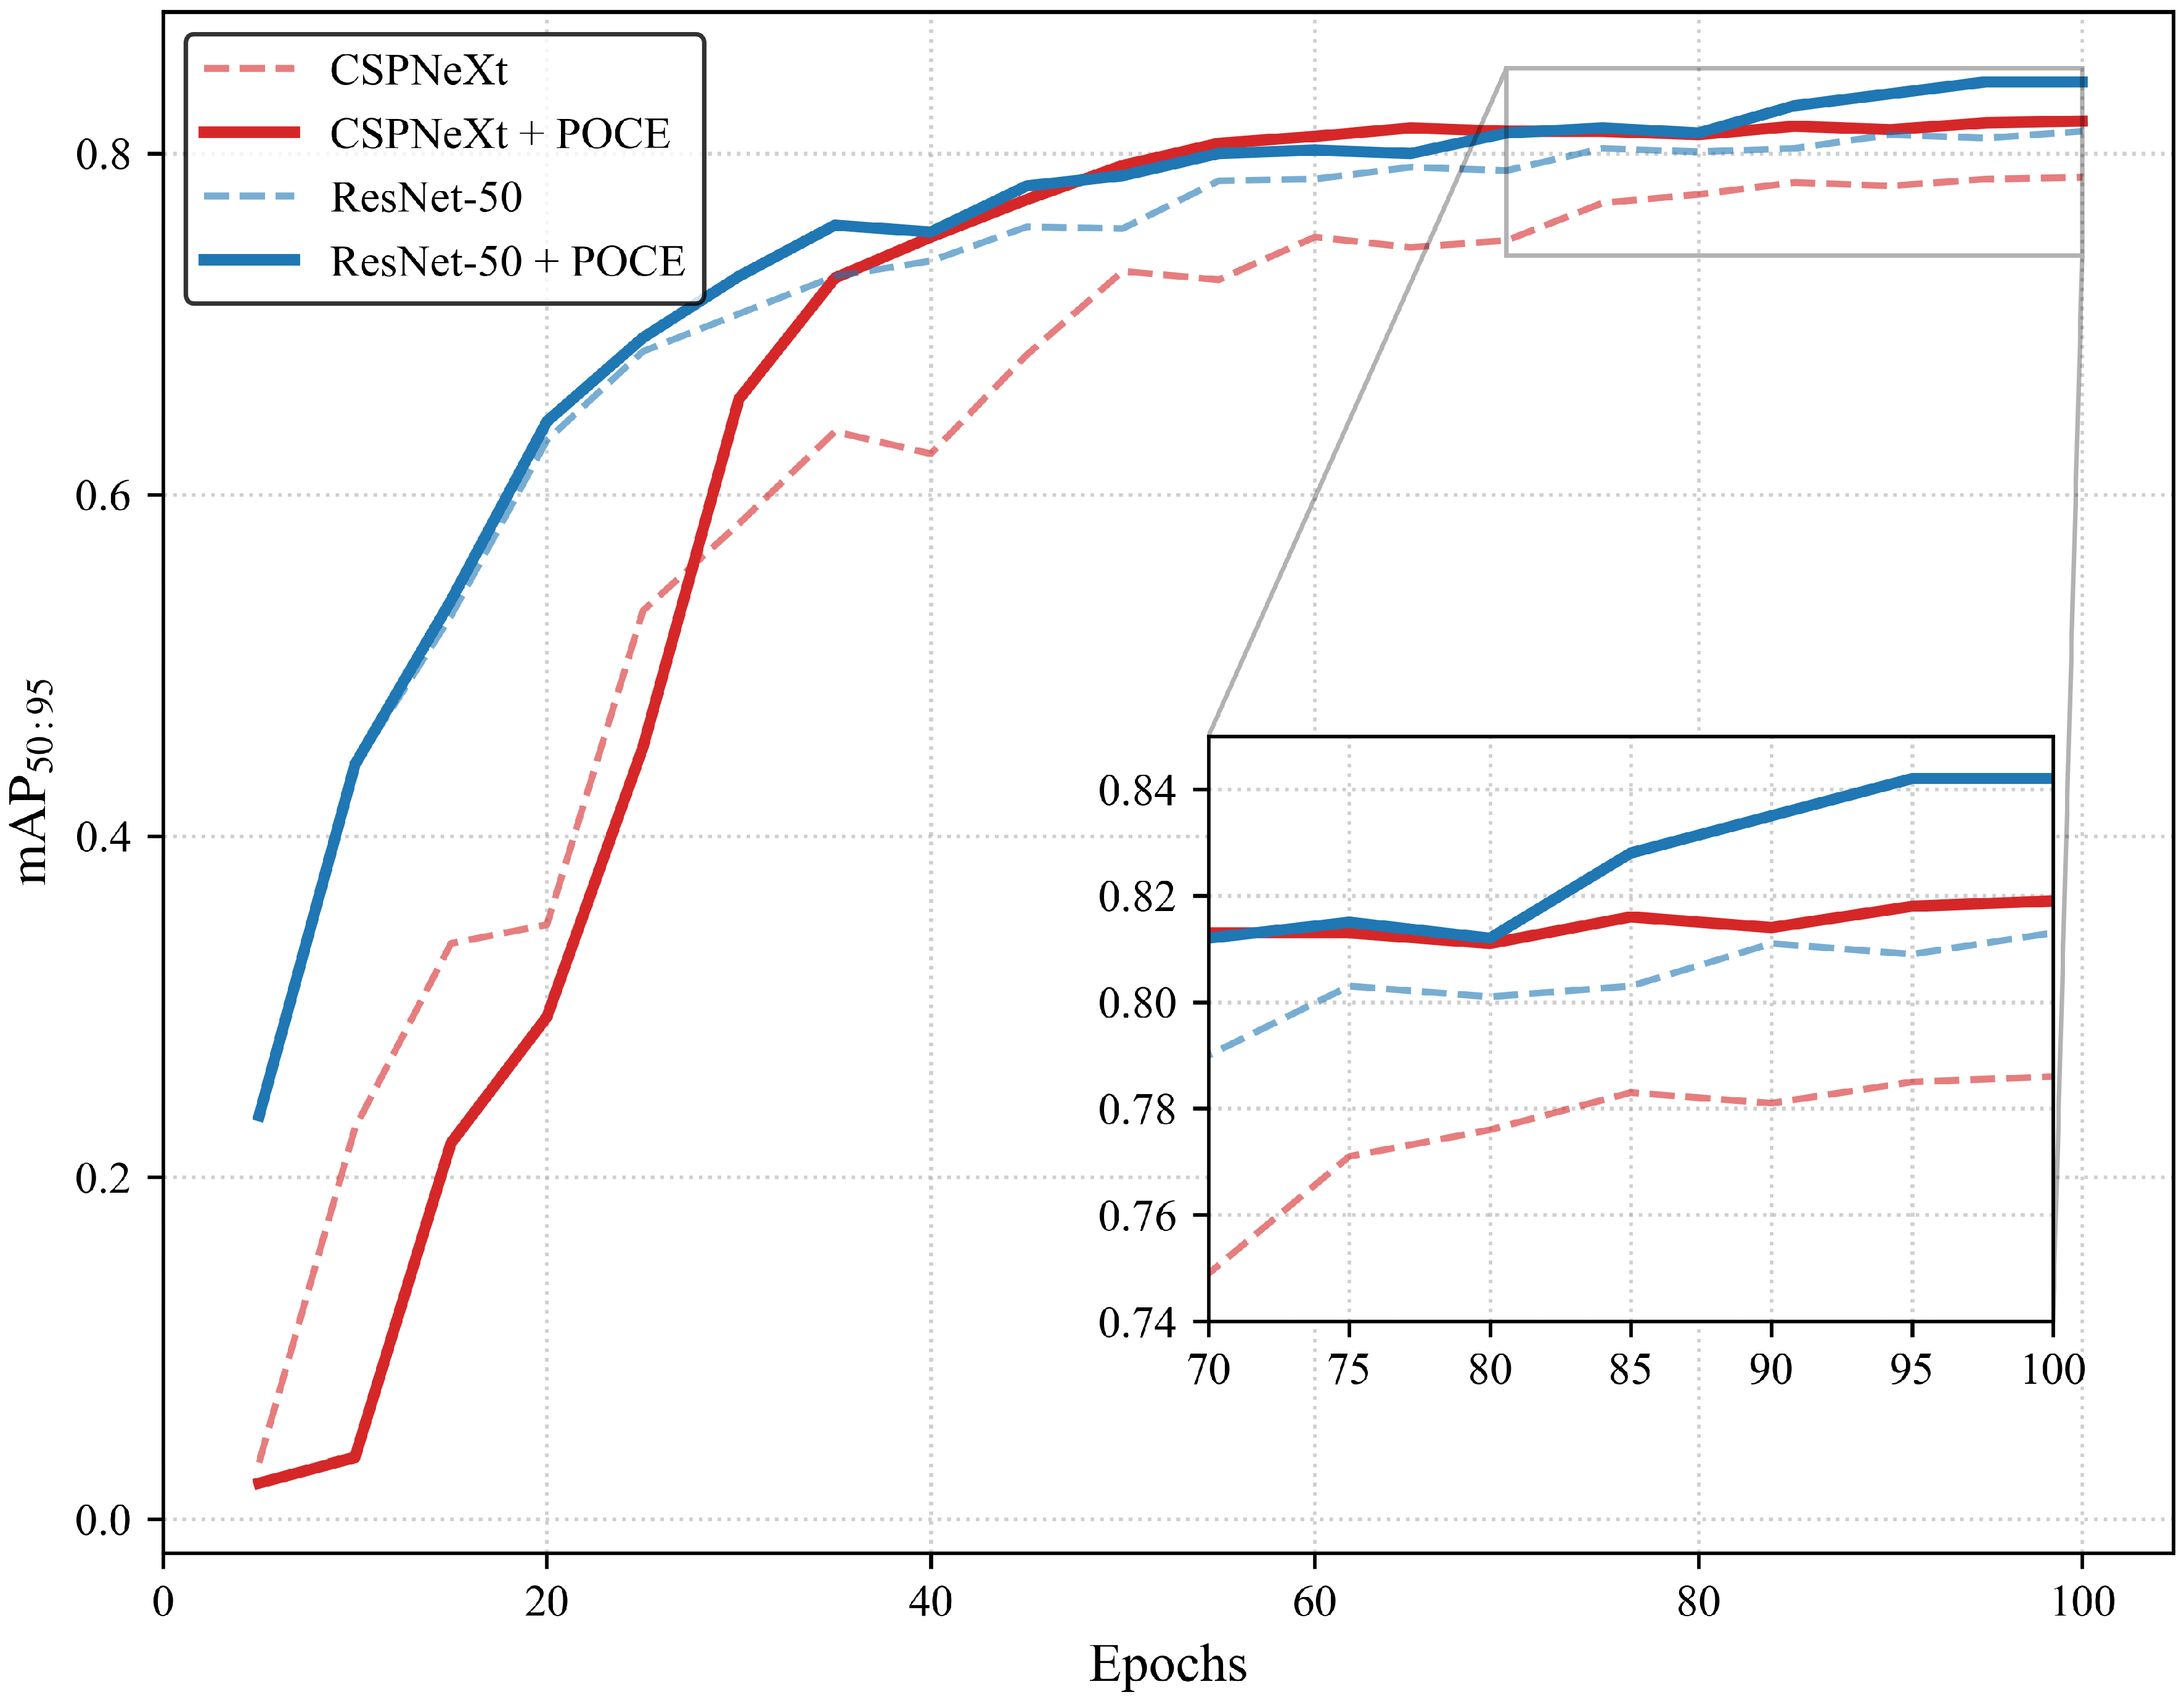
Figure 7.
Large-scale simulated airport scenes and corresponding detection results. For each set, the two images on the right represent the magnified ROI detection results. The top-right displays results of PGD, and the bottom-right shows results of PACE-Det. Green boxes indicate the predicted bounding boxes that match the ground truth with an IoU exceeding 0.8. Red boxes denote the ground truth boxes of the targets correctly classified under a relaxed IoU threshold, but their predicted boxes are discarded here for failing to meet the 0.8 IoU criterion.
Figure 7.
Large-scale simulated airport scenes and corresponding detection results. For each set, the two images on the right represent the magnified ROI detection results. The top-right displays results of PGD, and the bottom-right shows results of PACE-Det. Green boxes indicate the predicted bounding boxes that match the ground truth with an IoU exceeding 0.8. Red boxes denote the ground truth boxes of the targets correctly classified under a relaxed IoU threshold, but their predicted boxes are discarded here for failing to meet the 0.8 IoU criterion.
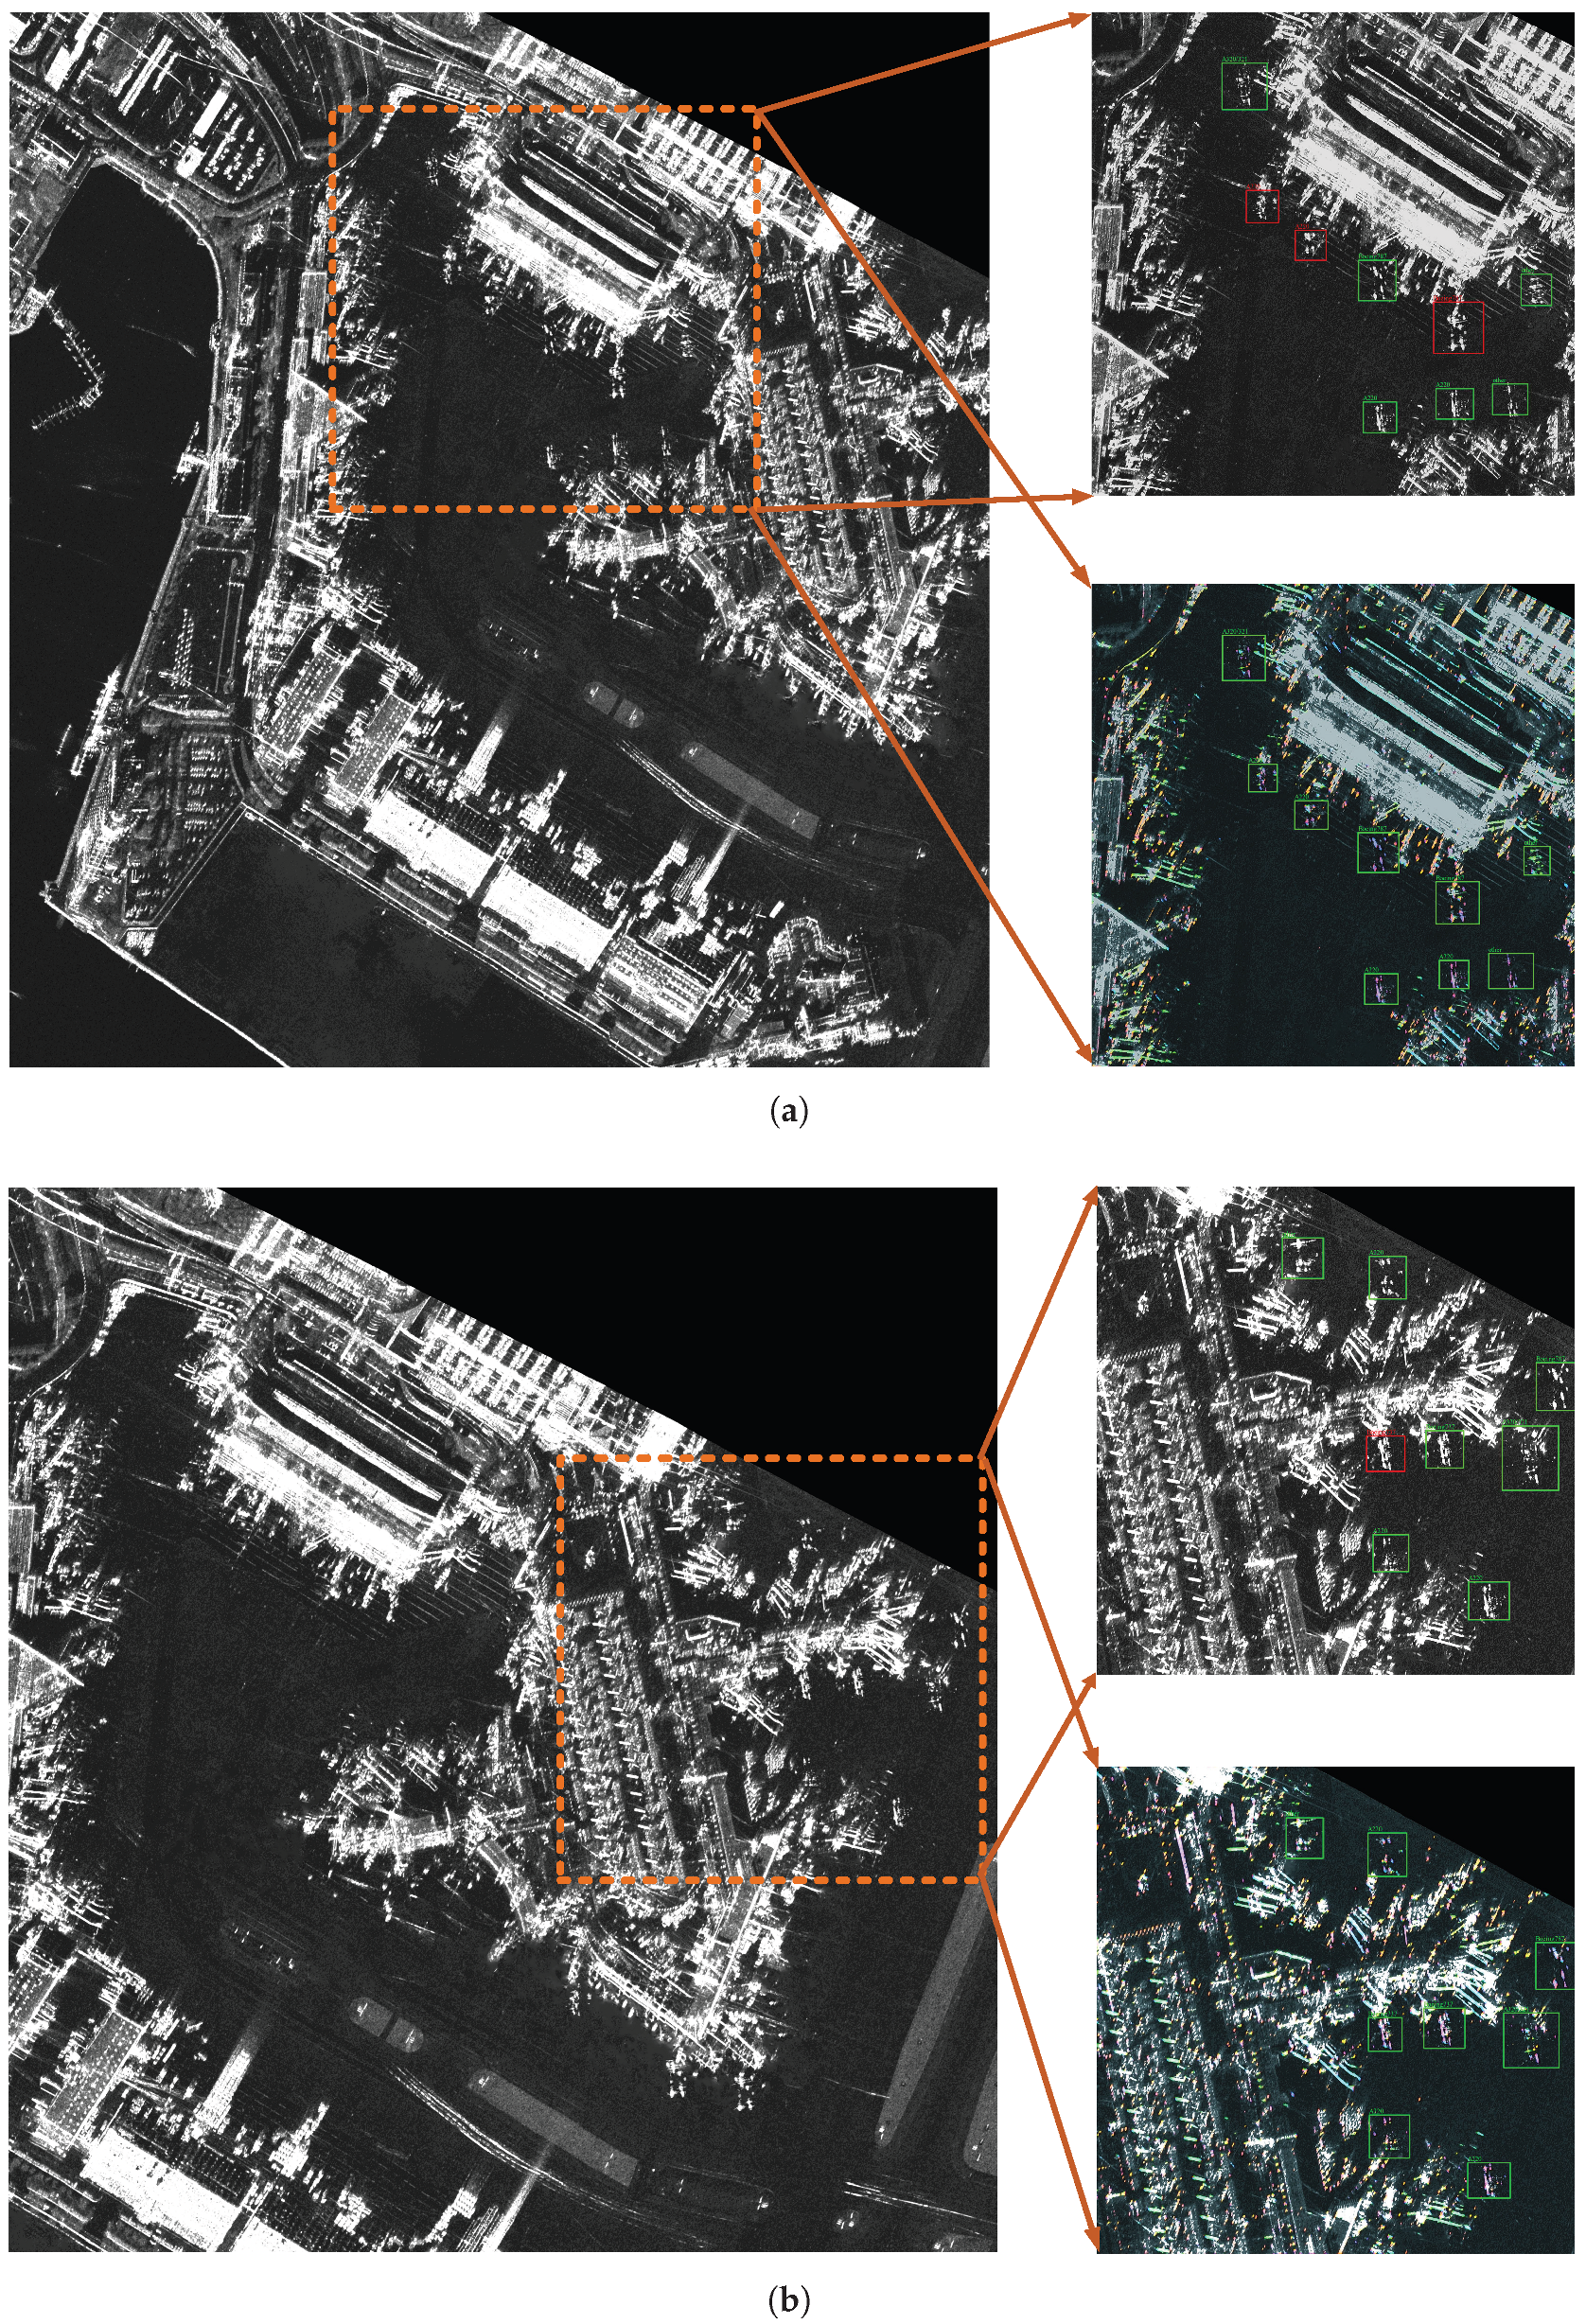

Table 1.
Categories, Instances, and Visual Characteristics of CSAD
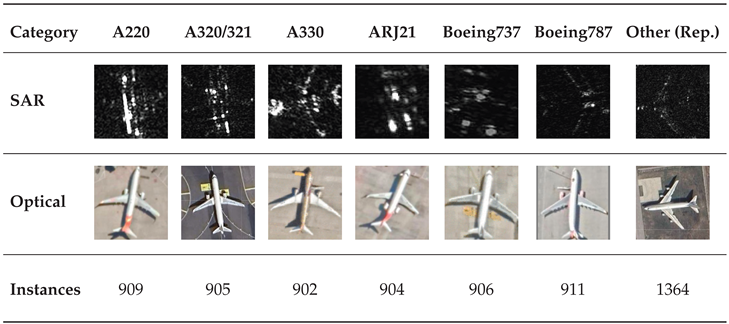 |
Table 2.
Detection Performance by under Different Settings across Both Backbones
| Backbone | |||||||
|---|---|---|---|---|---|---|---|
| 0 | 0.1 | 0.2 | 0.5 | 1.0 | 2.0 | 5.0 | |
| ResNet-50 | 0.817 | 0.829 | 0.831 | 0.821 | 0.842 | 0.842 | 0.825 |
| CSPNeXt | 0.795 | 0.806 | 0.810 | 0.823 | 0.819 | 0.803 | 0.808 |
Table 3.
Ablation Study of the Proposed Modules on the CSAD
| Backbone | POCE | MSCC | ||||
|---|---|---|---|---|---|---|
| ResNet-50 | × | × | 0.813 | 0.973 | 0.916 | 0.462 |
| × | 0.842 | 0.976 | 0.925 | 0.523 | ||
| × | 0.820 | 0.979 | 0.938 | 0.496 | ||
| 0.851 | 0.984 | 0.948 | 0.561 | |||
| CSPNeXt | × | × | 0.786 | 0.984 | 0.959 | 0.305 |
| × | 0.819 | 0.984 | 0.959 | 0.541 | ||
| × | 0.802 | 0.988 | 0.963 | 0.460 | ||
| 0.836 | 0.988 | 0.971 | 0.557 |
Table 4.
Efficiency Comparison of the Proposed Architectures
| Method | Params (M) | FLOPs (G) | FPS |
|---|---|---|---|
| ResNet-50 | 47.552 | 284.0 | 7.4 |
| PACE-Det (ResNet-50) | 47.699 | 287.7 | 6.5 |
| CSPNeXt | 52.260 | 205.0 | 11.9 |
| PACE-Det (CSPNeXt) | 52.407 | 208.7 | 10.8 |
Table 5.
Quantitative Performance Comparison of Different Detection Methods on the CSAD
| Architectural Paradigm | Method | ||||
|---|---|---|---|---|---|
| Two-Stage Framework | Faster R-CNN | 0.784 | 0.953 | 0.893 | 0.408 |
| Cascade R-CNN | 0.802 | 0.967 | 0.911 | 0.417 | |
| Single-Stage Model | TOOD | 0.815 | 0.964 | 0.913 | 0.411 |
| YOLOv8m | 0.835 | 0.992 | 0.935 | 0.462 | |
| Transformer-Based | Deformable DETR | 0.776 | 0.932 | 0.844 | 0.357 |
| Align-DETR | 0.817 | 0.965 | 0.924 | 0.396 | |
| SAR-Specialized | PGD | 0.790 | 0.973 | 0.920 | 0.392 |
| SFRE-Net | 0.753 | 0.941 | 0.817 | 0.355 | |
| Proposed Method | PACE-Det | 0.851 | 0.984 | 0.948 | 0.561 |
Disclaimer/Publisher’s Note: The statements, opinions and data contained in all publications are solely those of the individual author(s) and contributor(s) and not of MDPI and/or the editor(s). MDPI and/or the editor(s) disclaim responsibility for any injury to people or property resulting from any ideas, methods, instructions or products referred to in the content. |
© 2026 by the authors. Licensee MDPI, Basel, Switzerland. This article is an open access article distributed under the terms and conditions of the Creative Commons Attribution (CC BY) license (http://creativecommons.org/licenses/by/4.0/).
Copyright: This open access article is published under a Creative Commons CC BY 4.0 license, which permit the free download, distribution, and reuse, provided that the author and preprint are cited in any reuse.


