

Submitted:
07 July 2026
Posted:
08 July 2026
You are already at the latest version
Abstract
Early identification of academic risk remains a major challenge in public higher education, where institutional data are often fragmented and underused. This study proposes a multi-output deep learning model to predict five formative indicators during the semester: assignment performance, missing assignments, procrastination rate, exam performance, and exam accuracy. The dataset included 4,230 student-course records and 26 features extracted from learning and assessment platforms. A multitask regression architecture with shared and task-specific layers was optimized through Bayesian search and regularization. The model achieved strong predictive performance (R² = 0.9803; MAE = 0.0239; RMSE = 0.0404), outperforming traditional machine learning baselines. SHAP analysis identified temporality and engagement variables as the most influential predictors. Additional ordinal and clustering analyses revealed engagement profiles useful for early feedback and support. Results highlight the value of multi-output learning analytics for timely and privacy-aware academic intervention.
Keywords:
academic risk prediction
; formative assessment
; learning analytics
; multi-task deep learning
; self-regulated learning
1. Introduction
Higher education institutions face persistent challenges in identifying and supporting students at academic risk, particularly in Latin America where dropout rates remain high and completion is uneven [1,2,3]. Despite the expansion of Learning Analytics (LA) and Artificial Intelligence (AI), predictive research continues to rely predominantly on summative outcomes such as final grades or completion status, limiting its value for timely, pedagogically grounded intervention [4]. Moreover, reducing academic risk to a single target variable may oversimplify the multidimensional nature of student learning, engagement, and self-regulated behavior, restricting the interpretability and pedagogical usefulness of predictive models. At the Universidad de Colima (UCOL), a Mexican public institution, extensive student data are routinely generated through two platforms: Educ, a Learning Management System (LMS), and Evpraxis, an Online Assessment Platform (OAP) [5,6,7]; however, these systems operate independently and lack coordinated strategies to transform data into actionable intelligence [8,9], limiting the potential of LA to enhance student retention and support.
Grounded in self-regulated learning (SRL) theory, LA enables researchers to examine how students plan, monitor, and reflect on their learning [10,11], revealing behavioral patterns linked to achievement [12,13]. Yet most predictive models remain confined to end-of-course outcomes, overlooking formative indicators that could guide earlier pedagogical actions [4]. Recent advances in explainable and prescriptive ML show how predictive models can support formative assessment and SRL [13,14,15,16,17]: formative assessment provides ongoing feedback to guide learning [18], feedback literacy emphasizes students’ ability to interpret and act on feedback [19], and explainable AI makes predictions interpretable [14]. Together, these approaches expand the formative potential of predictive models by linking analytics with learner agency [20].
This study introduces a multi-task deep learning model with a shared architecture and task-specific heads trained on in-term data. The model predicts five formative indicators of student performance:
- average assignment score,
- number of missing assignments,
- assignment procrastination rate,
- average exam score, and
- exam accuracy.
These indicators are pedagogically interpretable, observable during the semester, and aligned with formative assessment principles that promote timely feedback and self-regulation [11,21,22]. Their early prediction enables real-time advising and intervention [12,20]. The model draws on three complementary frameworks: SRL theory (learning as a cyclical process of forethought, performance, and reflection), formative assessment (actionable feedback to close performance gaps [18,22]), and feedback literacy (learners’ ability to interpret and act upon feedback [19,21])—together positioning predictive analytics as a pedagogically purposeful and student-centered approach.
By enabling real-time prediction of assignment and assessment behaviors, the model can be integrated into dashboards to trigger alerts and guide personalized support before critical outcomes occur. Benchmarking against classical ML models uses R2 and MAE; a review of 55 studies (2018–2025) shows that few address multi-target prediction or generate formative, interpretable outputs aligned with educational practice.
This study addresses three research questions:
- RQ1.
- How accurately can a multi-output deep learning model predict formative indicators using in-term LMS and assessment data?
- RQ2.
- How does it compare with traditional and state-of-the-art approaches?
- RQ3.
- How can predicted indicators inform formative feedback, self-regulation, and decision-making?
By addressing these questions, this work contributes a replicable, ethical, and pedagogically grounded framework for predictive modeling in higher education, with relevance to underrepresented contexts in the Global South, where empirical studies on formative and multi-output prediction remain scarce.
1.1. Related Work and Conceptual Foundations
Learning Analytics combines computational and pedagogical approaches to understand and enhance learning through data, evolving along two interrelated paths: technical advances in machine and deep learning for educational prediction, and conceptual developments grounded in SRL, formative assessment, and feedback literacy. These perspectives converge on the notion that predictive accuracy alone is insufficient unless model outputs can meaningfully inform teaching and learning.
1.1.1. Machine Learning for Predictive Learning Analytics
In the past decade, LA has widely adopted machine learning (ML) to predict performance, identify dropout risk, and personalize interventions. Early work relied on supervised algorithms such as decision trees, logistic regression, support vector machines, random forests, and ensembles [23,24], trained on LMS traces like logins, forum posts, and submission timestamps [25,26,27]. Although effective, many studies emphasized summative outcomes (final grades or dropout status) rather than formative indicators observable during instruction [28,29]. As a result, they offered limited pedagogical value for early intervention and neglected the interplay of cognitive, behavioral, and motivational dimensions [29].
Model interpretability also proved challenging. Ensemble and boosting methods often acted as “black boxes,” producing opaque predictions that educators could not easily interpret [30]. Limited transparency reduced trust and practical adoption, prompting calls for explainable and pedagogically aligned analytics that transform model outputs into actionable insights [31,32]. Despite these challenges, traditional ML established the groundwork for richer models that integrate behavioral and temporal features to capture how students engage with learning platforms over time [31,33], paving the way for deep learning.
1.1.2. Deep Learning and Multi-Output Modeling
Deep learning introduced a major methodological advance in educational prediction. Neural architectures such as multilayer perceptrons (MLPs), convolutional (CNNs), and recurrent networks (RNNs) have modeled performance and engagement patterns [15,16]. They capture sequential data such as weekly participation or clickstreams, revealing temporal dependencies often missed by classical models [34]. While deep models typically outperform traditional ML in accuracy [16,35], they remain difficult to interpret [32].
Most models target a single variable (usually a grade or risk score) despite the multidimensionality of learning. Recent studies have underscored behavioral aspects like procrastination, assignment delay, and completion risk [15,16], showing the need for integrated models that consider their interrelations. Multi-output or multi-task architectures address this by predicting several outcomes simultaneously, enhancing both generalization and educational relevance [36]. In education, such models can concurrently predict engagement, persistence, and accuracy, offering a more holistic view of learning progress [15,16].
However, real-world applications remain scarce, especially in Latin American public universities, where dropout rates are high and data resources limited. Existing research mostly derives from high-income contexts [4,35], raising questions about equity and transferability. The present study addresses this gap by applying a deep learning model trained on authentic LMS and assessment data from a large Latin American university to predict five formative indicators (assignment score, missing tasks, procrastination rate, exam score, and exam accuracy) representing academic risk and SRL behaviors.
1.1.3. Self-Regulated Learning and Formative Assessment
While ML offers computational capacity, its educational significance emerges through SRL and formative assessment. Rooted in social-cognitive theory, SRL conceptualizes learning as a cyclical process of planning, performance, and reflection [10,11], where learners set goals, monitor progress, and adapt strategies based on feedback. Each predicted indicator aligns with SRL dimensions: procrastination reflects time management, missing assignments behavioral regulation, and exam accuracy self-evaluation. Modeling these aspects enables early detection of self-regulatory difficulties and timely support [14,15,32].
Formative assessment, in turn, focuses on using evidence to guide learning [18]. Predictive analytics, when interpretable, can serve as formative feedback signaling emerging challenges [20]. This approach aligns with feedback literacy, emphasizing students’ ability to interpret and act upon feedback [19,21]. In digital settings, predictive indicators reveal latent engagement patterns that inform instructional decisions and foster reflective learning.
1.1.4. Feedback Literacy and Student Agency
Feedback literacy, the ability to interpret and apply feedback effectively [19], positions predictive analytics as a pedagogical rather than merely diagnostic tool. Molloy et al. [21] frame feedback as a learner-centered process emphasizing agency, the capacity to act upon insights. Predictive indicators such as procrastination or task completion can thus function as self-regulatory cues that encourage behavioral awareness [21,37]. When embedded in dashboards or advising systems, these signals help students connect data patterns with study habits, promoting active engagement. Framed ethically, analytics should empower rather than label students, supporting agency and growth [19].
1.1.5. Integrating Technical and Pedagogical Perspectives
These perspectives converge in this study’s aim: to integrate multi-output deep learning with pedagogical constructs that render predictions educationally meaningful. Technically, the model advances beyond single-target prediction by jointly modeling multiple formative indicators [15,16]. Pedagogically, it links predictive outputs to interpretable feedback that supports self-regulation [31,32], bridging computational precision with educational purpose in a Latin American public university—an underrepresented yet vital educational context [4,35].
2. Institutional Context and Data Sources
The UCOL is a public Mexican institution serving over 30,000 students across upper-secondary, undergraduate, and graduate levels, enrolling 13,781 higher education and 1,010 graduate students across five regional campuses throughout the state of Colima in Mexico [38]. Educ and Evpraxis are the institution’s official Learning Management and Online Assessment platforms; by 2024, Educ hosted over 1,500 courses annually and Evpraxis administered nearly 95,000 exams [39,40].
This study focuses on undergraduate courses using both platforms (February 2020–June 2024). Data were extracted from institutional MySQL databases capturing behavioral and performance variables at the student-course level; Educ contributed assignment, delay, and access data, while Evpraxis provided exam scores, attempts, and session metadata. Variable selection was guided by 55 empirical studies from a systematic review on Learning Analytics and AI in higher education [4]. Student identifiers were anonymized through irreversible hash functions applied to institutional emails and course codes, consistent with privacy-aware AI design emphasizing data minimization and pseudonymization [41]. The resulting dataset comprises 33 variables per student-course record: two anonymized identifiers, five target variables, and 26 engineered features.
3. Data Processing and Feature Construction
The data processing pipeline comprised four sequential stages, from variable identification to model training (Figure 1). This section describes the first three: data retrieval, cleaning, and feature construction, designed to maximize pedagogical relevance and predictive value. All procedures were implemented in Python (v3.10) using pandas, NumPy, and matplotlib in Google Colab.
The initial extraction generated four datasets (assignments, exams, forum activity, and LMS access), capturing distinct aspects of student interaction. After preprocessing, pseudonymization, and consistency filtering, 4,230 unique student-course records were retained. The datasets were merged into an integrated table of 61 behavioral variables, from which 26 predictive features, five targets, and two anonymized identifiers were ultimately selected.
3.1. Variable Identification and Data Retrieval
The first stage translated empirical and theoretical insights into a structured feature framework. The systematic review [4] synthesized 55 studies on academic-performance prediction in higher education, grouping variables into twelve conceptual categories. Figure 2 shows their prevalence and variability: LMS interaction, student demographics, and prior academic history show the highest averages but also large standard deviations, while exam and assignment performance appear more consistent. The dataset is available in Supplementary Appendix A to ensure transparency and reproducibility.
Institutional data from Evpraxis and Educ were mapped to this schema. Each source contributed complementary behavioral streams (exams, assignments, LMS access, and forums) linked through pseudonymized student–course identifiers. Table 1 summarizes these data sources and behavioral dimensions forming the basis for subsequent modeling stages.
Data were retrieved from MySQL databases through parameterized SQL queries filtered by academic period (2020–2024), delivery mode, and validity. Identifiers were irreversibly hashed to comply with privacy regulations. The resulting CSV files supported composite behavioral indicators such as procrastination rate, participation density, and exam completion ratio, representing temporal, motivational, and cognitive engagement dimensions.
3.2. Data Cleaning and Consolidation
3.2.1. Raw Data Preprocessing
Each dataset underwent normalization and semantic cleaning. Missing values were contextually treated: non-submitted assignments were pedagogically meaningful and recorded as zero, flagged as missing_assignments. Outliers were capped using interquartile range methods, while invalid durations or corrupted entries were corrected or discarded. Reused courses were separated from first-time runs.
3.2.2. Feature Engineering
A total of 26 behavioral indicators were derived from assignment and exam interactions, including:
- Assignments: min_assignment_score, max_assignment_score, avg_assignment_delay, assignment_submit_rate, assignment_procrast_rate, missing_assignments, late_assignments, ungraded_assignments.
- Exams: avg_exam_score, exam_accuracy, exam_incidents, avg_exam_incidents, ex-am_correct_answers, exam_submit_rate, incomplete_exams.
- Consistency/Effort: graded_assignments, total_assignments, min_exam_time, min_exam_score, max_exam_score.
All were computed at the student-course level to capture effort, timeliness, and consistency. Boolean flags (no_exam_data, no_forum_data, missing_access_data) denoted missing modalities, functioning both as interpretable predictors and quality indicators.
3.2.3. Data Integration and Anonymization
Datasets were merged using composite anonymized keys (uid_hash and course_hash). Only students active on both platforms were retained, yielding 4,230 records from 165 undergraduate courses (2020–2024) across diverse disciplines (engineering, health sciences, social sciences, arts, and tourism). Intermediate CSV exports ensured traceability through validation scripts, and aggregating to the student-course level produced one enriched record per student per course, reducing redundancy while preserving behavioral patterns.
3.3. Statistical Validation and Key Variable Selection
Initial exploratory analyses considered a single composite academic-risk target variable. However, statistical inspection showed that the institutional indicators represented heterogeneous and only partially overlapping dimensions of academic behavior. The problem was therefore reformulated as a multi-output prediction task using complementary formative indicators, preserving their pedagogical specificity while capturing interdependencies through a shared learning architecture.
3.3.1. Distribution Assessment and Normality Testing
Each numerical variable underwent a Kolmogorov–Smirnov test, consistently rejecting normality (p < 0.05). Skewness appeared in procrastination and missing assignment indicators, while exam-related features showed bounded distributions. Given the large sample (n = 4,230), small deviations were significant but typical of educational datasets. Robust or nonparametric preprocessing was therefore adopted to mitigate outlier effects.
3.3.2. Feature Scaling
Scaling harmonized magnitudes and avoided bias toward large-range variables. Min-Max Scaling (0–1) was applied to moderately variable features (total_assignments, avg_assignment_score, submitted_assignments, exam_correct_answers), while Robust Scaling (IQR-based) was used for skewed ones (avg_assignment_delay, total_time_spent_on_exams, avg_exam_time). Binary variables (e.g., no_exam_data, no_forum_data) were One-Hot Encoded to distinguish disengagement from absence, and proportion-based metrics (submit rates, procrastination, exam accuracy) were kept unscaled to retain their pedagogical meaning. Pearson correlation filtering removed redundant features (|r| > 0.9) and near-zero variance features were dropped, ensuring each variable contributed unique informative variance.
The validated dataset comprised 4,230 student-course records from 2,823 students across 165 courses (Table 2). A hybrid approach combined Pearson correlation filtering and LassoCV regression (tuned α) to select a stable subset of 26 features capturing effort, consistency, and timeliness without overfitting. Table 3 illustrates representative cases where statistical diagnostics prompted targeted adjustments—for instance, extreme assignment_delay values exposed reused LMS shells.
Through this multistep validation, the dataset achieved internal consistency, statistical reliability, and pedagogical interpretability. The resulting features capture meaningful engagement dynamics and provide a robust foundation for the multi-output predictive models detailed in Section 4.
4. Model Design and Optimization
Building on the validated dataset described in Section 3, this stage translated statistically curated, pedagogically meaningful variables into a predictive model for actionable use in higher education. The model was designed to detect early academic risk profiles before final assessments while mitigating “black box” limitations, following three principles: capturing non-linear interactions among behavioral and performance indicators, maintaining stability across disciplines and cohorts, and preventing overfitting. In the overall pipeline (Figure 1), Stage 4 covers tuning, training, and evaluation.
4.1. Multi-Output Prediction Strategy
The predictive task was defined as supervised multi-output regression, where each record represented a unique student–course instance. A multi-task learning structure with a shared trunk and task-specific heads replaced separate models, capturing interdependencies among outcomes while allowing specialization. This design reflects the interconnected nature of engagement, procrastination, and accuracy.
The five target variables (Table 4) represent complementary pedagogical dimensions: achievement (average assignment and exam scores), engagement (missing assignments), temporal consistency (assignment procrastination rate), and evaluation quality (exam accuracy).
Modeling these jointly enables nuanced profiling, such as identifying students with strong exam results but decreasing engagement, supporting early, pedagogically grounded interventions.
4.2. Model Architecture
Implemented in TensorFlow/Keras, the model used a multi-task deep neural network for multi-output regression. The input layer received 26 engineered features from assignments, exams, forums, and LMS logs. The shared trunk employed ReLU activations, Batch Normalization, and Dropout, followed by five task-specific heads, each ending in one neuron (sigmoid for normalized proportions, linear otherwise).
Figure 3 illustrates the tunable architecture of this multi-task model, showing the shared trunk and the five specialized output heads optimized for different learning targets. The architecture was defined as a tunable search space: trunk depth (1–3 layers, 128–512 to 64–256 units), dropout (0.3–0.5 and 0.2–0.4), L2 regularization (10−2–10−3), head width (32–128), and learning rate ({1e−3, 5e−4, 1e−4}). This balanced shared representation learning with task-specific specialization.
4.3. Hyperparameter Optimization
Bayesian optimization (Keras Tuner) minimized validation loss over 40 trials (10 random initializations), balancing exploration and exploitation within defined ranges. Loss functions were fixed per target (MSE for most, Huber for missing_assignments). Batch size was 64, and early stopping (patience = 6) limited overfitting. This systematic search, rather than manual tuning, ensured reproducibility and generalizability.
4.4. Training Procedure
Using the best parameters, the final model was retrained on the combined training and validation sets with conservative early stopping to ensure convergence, using EarlyStopping (patience = 12, restoring best weights), ReduceLROnPlateau (factor = 0.5, patience = 6, min = 1e−6), ModelCheckpoint (saving best weights), and CSVLogger (recording training logs).
Figure 4 depicts the complete training workflow, summarizing how early stopping, learning rate scheduling, and checkpointing interact to ensure reproducibility and stable convergence. Predictors were scaled with RobustScaler to reduce outlier effects.
4.5. Evaluation and Interpretability Checks
The optimized model’s learning curve (Figure 5) shows rapid error reduction within 15–20 epochs, then stable convergence with minimal fluctuation, indicating absence of overfitting. Early stopping and adaptive scheduling ensured robustness.
To provide a detailed account of predictive accuracy, we report both global and per-target metrics, including MAE, RMSE, and R2 with bootstrap confidence intervals. These extended results are summarized in Table 5.
Ordinal analyses confirmed pedagogical validity, with strong discriminative capacity and high quadratic weighted kappa (QWK) across outcomes (Table 6).
Interpretability was examined using the SHAP Kernel Explainer on a stratified test sample. Figure 6 summarizes the most informative SHAP pattern for missing_assignments; the remaining SHAP plots are provided in Supplementary Appendix C. Temporal and delay-related features dominate the other targets, reflecting students’ self-regulation habits.
4.5.1. Pedagogical Interpretation
Each predicted indicator carries distinct instructional implications:
- Assignments (avg_assignment_score, missing_assignments, assignment_procrast_rate) reflect self-regulation and engagement. Consistent task completion proved more predictive than isolated high grades, underscoring the importance of continuous feedback and workload balance in preventing procrastination [10,11].
Together, these findings confirm that the model yields high predictive accuracy and pedagogically actionable insights linking behavioral and performance dimensions.
4.5.2. Predicted vs. Actual Analysis
Figure 7 displays the representative predicted-versus-actual plot for avg_assignment_score; the remaining prediction plots are provided in Supplementary Appendix C.
These results demonstrate that the proposed multi-output DNN generalizes effectively across diverse performance dimensions while maintaining statistical rigor and pedagogical interpretability. The model therefore constitutes a reliable decision-support tool for early, actionable detection of academic risk in higher education.
5. Evaluation and Comparative Analysis
The dataset was divided into training (80%) and test (20%) subsets. The final multi-output DNN achieved a Mean Absolute Error (MAE) of 0.0239 and an R-squared (R2) of 0.9803, indicating robust predictive accuracy across all targets.
5.1. Baseline Models
To contextualize the performance of the proposed DNN, we implemented three widely used regression baselines using the same training data: Linear Regression (LR), Decision Tree Regression (DT), and Random Forest Regression (RF). Results are summarized in Table 7. The only exception is missing_assignments, where RF (R2 = 0.9970) marginally outperforms the DNN (R2 = 0.9774), likely due to RF’s ensemble averaging being effective for this variable’s highly skewed, zero-inflated distribution.
5.2. Literature Benchmark Comparison
To situate the proposed model within the current state of research, we compared its predictive performance with that of recent peer-reviewed studies in predictive learning analytics (2018–2025). Table 8 summarizes representative regression-based works including model type, prediction targets, and reported metrics (R2, MAE, RMSE). Four studies were excluded from this comparison as their focus was not on academic risk prediction but on feedback generation, methodological comparisons, or collaborative support.
Most prior studies employed classification settings (e.g., dropout prediction with accuracy or F1-score), which are not directly comparable with regression-based outcomes. For this reason, Table 8 focuses on regression-based models, while Supplementary Appendix B provides a comprehensive overview of all 51 studies, including classification-oriented works.
By contrast, our multi-output deep neural network simultaneously achieved R2 = 0.9803 across five pedagogically relevant and interrelated targets: average assignment score, number of missing assignments, assignment procrastination rate, average exam score, and exam accuracy.
This constitutes a dual contribution:
- Methodological: Exploiting inter-target correlations enables the model to capture richer patterns of student behavior, surpassing single-task approaches.
- Practical: Predictions are generated on actionable indicators during the course, enabling formative interventions instead of retrospective evaluations.
Beyond regression accuracy, our model also achieved strong performance in derived pedagogical classifications, with F1-macro values up to 0.94 and QWK values up to 0.98 (see Table 6 in Section 4.5). These results highlight not only the predictive power but also the ability to provide interpretable and actionable insights, an aspect rarely addressed in prior single-output studies.
6. Robustness Analysis
6.1. Quantitative Robustness
The v3.4 model was tested under variations in feature subsets (top-10, top-15, and all variables), test ratios (10%, 20%, 30%), and scaling methods (MinMax, Robust). Results (Table 9) showed high stability: with all features, the model achieved a median R2 of 0.970; with top-15 features, R2 = 0.958; and with ten predictors, R2 = 0.857—still explaining substantial variance. This consistency suggests that early-warning systems would remain dependable even with partial institutional data.
To control potential data leakage, seven redundant variables were removed (six by naming, one by correlation: ungraded_assignments). The model still reached R2 = 0.9566 and MAE = 0.0340, with per-target R2 values between 0.906 and 0.993. These results confirm that predictions relied on meaningful behavioral and performance signals rather than trivial proxies. Overall, the model remained robust across partitions, preprocessing methods, and feature sets, supporting its adaptability to diverse educational contexts.
6.2. Behavioral Robustness: Nuanced Profiles of Self-Regulated Engagement
Complementing quantitative tests, exploratory clustering identified distinct behavioral patterns of self-regulated engagement. Combining the five target indicators with SHAP-derived features (submission rates, assignment delay, completion proportions), k-means and hierarchical (Ward) clustering yielded consistent seven-cluster structures, validated by Elbow, Silhouette, and Davies–Bouldin indices.
Figure 8 shows the resulting seven-cluster configuration through a two-dimensional PCA projection, illustrating partial overlaps that indicate transitional zones of engagement and support a continuum model of self-regulation. The detailed cluster profiles are provided in Supplementary Appendix C.
7. Practical Application
The proposed model is intended as a decision-support tool for institutional early-warning systems or student dashboards, providing interpretable risk indicators that inform timely human intervention rather than automated decision-making. Predicted risk scores can prioritize follow-up actions when thresholds are exceeded; for instructors, outputs can guide targeted feedback, reminders, or workload redistribution; and for students, visualizations of behavioral trends may support metacognitive reflection and planning.
7.1. Pedagogical Alignment and Educational Use
The model supports formative assessment by generating diagnostic indicators before high-stakes evaluations and provides behavioral proxies for SRL through variables such as task submission timing, interaction regularity, and exam accuracy, offering indirect evidence of planning, monitoring, and performance regulation.
Early detection may also support equity-oriented interventions by identifying disengagement soon enough for proactive resource allocation—particularly for first-year or historically underserved students—while avoiding deterministic interpretations of risk scores. At the instructional design level, aggregated cohort patterns can inform course redesign decisions such as pacing adjustments, workload calibration, and feedback scheduling.
7.2. Operationalizing Predictions Within the Formative Assessment Cycle
The educational value of the model depends on how predicted indicators are embedded in formative practice. From the first graded activity, the system can generate an initial predictive “snapshot.” Each new assignment or exam enables recalculation of indicators based on accumulated evidence, producing updated signals throughout the semester. Figure 9 illustrates this snapshot-based formative cycle.
At each checkpoint, instructors interpret predictions through an SRL lens: high predicted procrastination may indicate time-management difficulties, while low predicted exam accuracy may reflect weaknesses in self-evaluation [10,11]. Subsequent snapshots allow comparison between predicted and observed behaviors, supporting iterative, theory-informed monitoring aligned with formative assessment cycles [18,22].
7.3. Prototype Deployment Scenario: LARC Interface
To demonstrate the practical applicability of the proposed multi-output predictive model beyond benchmark metrics, it was integrated into an institutional prototype named Learning Analytics Rescue Console (LARC). The prototype translates predictive outputs into an interpretable instructor-facing environment for early academic monitoring in real educational settings.
LARC operationalizes the five predicted dimensions generated by the model: assignment performance, missing assignments, procrastination patterns, examination performance, and exam accuracy. Rather than presenting isolated numerical outputs, the interface organizes predictions into academic signals, recent behavioral summaries, contextual indicators relative to the course group, and short-term projected risk levels.
The prototype was designed to prioritize clarity and pedagogical usefulness. Instructors can identify whether projected risk is associated mainly with weak task engagement, unstable performance, delayed submissions, or assessment-related difficulties. This multidimensional perspective may support earlier and more targeted interventions than approaches based only on final grade prediction.
LARC also incorporates descriptive contextual analytics that compare individual patterns with aggregated course tendencies, helping instructors interpret whether observed behaviors are isolated cases or part of broader cohort dynamics. Although the present study focuses on predictive model development and validation, the prototype illustrates how advanced learning analytics models can be embedded into actionable institutional tools while preserving human judgment as the basis for pedagogical action (Figure 10).
8. Ethical Considerations
Predictive learning analytics requires explicit safeguards to ensure that analytical benefits do not undermine student rights, autonomy, or trust, integrating legal compliance, pedagogical responsibility, and transparent governance.
8.1. Data Protection and Anonymization
Educational data processing must comply with applicable regulatory frameworks: GDPR and Mexican data-protection law [44] require lawful processing, purpose limitation, data minimization, and institutional accountability. While anonymization and privacy-by-design are foundational safeguards [41], they may constrain personalization potential [45], requiring institutions to balance analytical granularity with proportionality and risk minimization.
8.2. Non-Punitive and Support-Oriented Use
Predictive indicators should not function as mechanisms of surveillance or sanction. Consistent with international ethical guidance [46], risk classifications should trigger supportive rather than disciplinary action.
8.3. Transparency and Explainability
Opaque algorithmic decision-making can erode institutional trust. Interpretability techniques such as SHAP therefore remain necessary to make model outputs understandable and accountable [47].
8.4. Consent and Governance
9. Discussion
This study demonstrates that multi-output deep learning can equal or surpass traditional models while revealing a multidimensional view of student learning. By jointly predicting five interrelated indicators—from academic outcomes (average exam score, accuracy) to behavioral dimensions (procrastination rate)—the model captures cognitive, metacognitive, motivational, and behavioral facets of learning [10], integrating SRL, formative assessment, and feedback literacy into predictive modeling.
An important implication of these findings is that academic risk may not be adequately represented through a single global indicator. The strong performance of the multi-output approach suggests that preserving differentiated behavioral and performance dimensions provides a more pedagogically meaningful representation of student learning processes.
Each predicted indicator aligns with a specific SRL phase [10,11]: assignment procrastination corresponds to time-management behaviors during performance, while exam accuracy informs self-evaluation in reflection. These mappings provide actionable insights throughout the semester, supporting formative feedback cycles [18] before high-stakes exams and enabling instructional adjustments to pacing and content.
Clustering analyses enriched interpretation by identifying engagement profiles along a continuum, which supports context-sensitive interventions rather than one-size-fits-all responses [18,22,48,49].
Interpretable visual outputs can enhance students’ feedback literacy, but their effect still depends on learners’ motivation and capacity to act on feedback [19,21,37].
Equity remains a central concern. Because the model relies on LMS and assessment data, students with limited connectivity or digital literacy may leave incomplete traces that bias predictions. Outputs must therefore be interpreted contextually and complemented with instructors’ qualitative insights; transferability will also require adaptation to local assessment structures and LMS designs.
Integrating predictive outputs into instructional and advising workflows can shift academic support from reactive to proactive through a cycle of detection, interpretation, intervention, and monitoring [10,18].
Despite promising results, limitations remain. The dataset stems from a single institution, SHAP explanations still require participatory validation with instructors and students, and the proposed ethical framework has yet to be operationalized institutionally. Collaborative multi-institutional studies are needed to strengthen both validity and applicability.
Overall, this work shows that multi-output, formative-oriented modeling is feasible and educationally valuable in a Latin American public university.
10. Conclusion and Future Work
This research presents a scalable and interpretable approach to academic-risk prediction using institutional data from a Mexican public university. Beyond predictive accuracy, it merges technical rigor with pedagogical interpretability, demonstrating that effective early-warning frameworks can be implemented through existing data infrastructures in resource-limited settings and showing how analytics can move beyond forecasting toward equity and data-informed support.
10.1. Future Work
The dataset’s institutional specificity limits generalization because results may not fully transfer to institutions with different calendars, pedagogical models, or technological infrastructures. Future research should therefore test adaptation across diverse settings to evaluate robustness and external validity.
Future research will extend this framework toward temporal modeling using event-based sequences and architectures such as LSTM, GRU, or Transformers to capture learning dynamics and identify optimal intervention points.
Future developments of LARC will focus on improving the accessibility and pedagogical usability of the explainability outputs already generated by the predictive model. Although the current system API returns feature-level explanations associated with each prediction, these technical outputs are not yet fully integrated into the instructor-facing interface.
A next step is to incorporate Generative AI as an explanation mediation layer capable of transforming raw XAI outputs into concise and understandable natural-language interpretations, indicating which recent behaviors, engagement patterns, or assessment indicators most influenced the projected risk level.
Generative AI may also support short evidence-based summaries of each student’s academic situation and optional pedagogical response suggestions tailored to the identified risk profile. These suggestions should function strictly as decision-support proposals requiring explicit instructor review and approval.
Overall, this line of work aims to connect predictive accuracy, transparent reasoning, and actionable educational support within a human-centered learning analytics environment.
Supplementary Materials
Supplementary Materials associated with this article are publicly available at Zenodo: https://doi.org/10.5281/zenodo.20060485. The repository includes three files: Supplementary Appendix A, Dataset Variables and Feature Definitions; Supplementary Appendix B, Supplementary Methodological Details; and Supplementary Appendix C, Extended Analyses, SHAP Visualizations, and Behavioral Clustering Results.
Author Contributions
Conceptualization, L.E.A.-R. and P.C.S.-M.; methodology, P.C.S.-M.; validation, P.C.S.-M.; formal analysis, M.Á.R.-O.; investigation, M.Á.R.-O., L.E.A.-R. and P.C.S.-M.; data curation, M.Á.R.-O.; writing—original draft preparation, M.Á.R.-O.; writing—review and editing, L.E.A.-R. and P.C.S.-M.; project administration, L.E.A.-R. All authors have read and agreed to the published version of the manuscript.
Funding
This research was partially funded by the R+D+i project PID2023-147396OB-I00, funded by MCIN/AEI/10.13039/501100011033 and by ERDF, EU.
Institutional Review Board Statement
Ethical review and approval were waived for this study because it used retrospective institutional academic data obtained under authorization from Universidad de Colima institutional platforms, permit 1I.1.2/205000/611/2025. The data were processed for research purposes under institutional authorization and were anonymized before analysis.
Informed Consent Statement
Informed consent was waived because the study used retrospective institutional academic records and no direct intervention with participants was conducted. The data were anonymized before analysis.
Data Availability Statement
The data supporting the reported results were obtained from Universidad de Colima institutional platforms under permit 1I.1.2/205000/611/2025. Raw data cannot be shared due to privacy and institutional policies. An anonymized version may be available from the corresponding author upon reasonable request, subject to institutional authorization. Supplementary Materials associated with this study are publicly available at Zenodo: https://doi.org/10.5281/zenodo.20060485.
Acknowledgments
The authors thank the General Coordination of Information Technologies at the Universidad de Colima for granting access to the institutional data required for this research. During the preparation of this manuscript, the authors used OpenAI ChatGPT for language refinement and code-refactoring support. The authors have reviewed and edited the output and take full responsibility for the content of this publication.
Conflicts of Interest
The authors declare no conflicts of interest. The funders had no role in the design of the study; in the collection, analyses, or interpretation of data; in the writing of the manuscript; or in the decision to publish the results.
Abbreviations
The following abbreviations are used in this manuscript:
| AI | Artificial Intelligence |
| DNN | Deep Neural Network |
| DT | Decision Tree |
| GenAI | Generative Artificial Intelligence |
| IQR | Interquartile Range |
| KS | Kolmogorov–Smirnov |
| LA | Learning Analytics |
| LARC | Learning Analytics Rescue Console |
| LMS | Learning Management System |
| LR | Linear Regression |
| MAE | Mean Absolute Error |
| ML | Machine Learning |
| OAP | Online Assessment Platform |
| PCA | Principal Component Analysis |
| QWK | Quadratic Weighted Kappa |
| RF | Random Forest |
| RMSE | Root Mean Square Error |
| SHAP | SHapley Additive exPlanations |
| SRL | Self-Regulated Learning |
| UCOL | Universidad de Colima |
| XAI | Explainable Artificial Intelligence |
References
- Chiarino, N.; Rodríguez Enríquez, C.; Curione, K.; Machado, A.; Bonilla, M.; Aspirot, L.; Garófalo, L.; Olveira, B. Abandono y permanencia estudiantil en universidades de Latinoamérica y el Caribe: Una revisión sistemática mixta. Act. Inv. En. Educ. 2024, 24, 1–37. [Google Scholar] [CrossRef]
- OECD Education at a Glance 2022: OECD Indicators; Education at a Glance; OECD: Paris, France, 2022; ISBN 978-92-64-58258-3.
- UNESCO-IESALC Informe Anual 2024; Organización de las Naciones Unidas para la Educación, la Ciencia y la Cultura (UNESCO): París, Francia; Caracas, Venezuela, 2025; p. 82.
- Rodríguez-Ortiz, M.Á.; Santana-Mancilla, P.C.; Anido-Rifón, L.E. Machine Learning and Generative AI in Learning Analytics for Higher Education: A Systematic Review of Models, Trends, and Challenges. Appl. Sci. 2025. [Google Scholar] [CrossRef]
- Universidad de Colima EvPraxis - Sistema de Evaluación En Línea 2024.
- Universidad de Colima Informe Institucional de Labores 2024; Universidad de Colima: Colima, México, 2024.
- Universidad de Colima Educ - Sistema Para La Gestión Del Aprendizaje En Línea 2024.
- Ponce-López, J.L.; Vicario-Solórzano, C.M.; López-Valencia, F. Estado Actual de las Tecnologías Educativas en las Instituciones de Educación Superior en México.; Asociación Nacional de Universidades e Instituciones de Educación Superior (ANUIES): México, 2021. [Google Scholar]
- Ponce-López, J.L.; Vicario-Solórzano, C.M.; López-Valencia, F. Estado actual de las tecnologías educativas en las instituciones de educación superior en México. In Estudio 2024; Asociación Nacional de Universidades e Instituciones de Educación Superior (ANUIES): México, 2024. [Google Scholar]
- Panadero, E. A Review of Self-Regulated Learning: Six Models and Four Directions for Research. Front. Psychol. 2017, 8. [Google Scholar] [CrossRef] [PubMed]
- Zimmerman, B.J. Becoming a Self-Regulated Learner: An Overview. Theory Into Pract. 2002, 41, 64–70. [Google Scholar] [CrossRef] [PubMed]
- Roll, I.; Winne, P.H. Understanding, Evaluating, and Supporting Self-Regulated Learning Using Learning Analytics. Learn. Anal. 2015, 2, 7–12. [Google Scholar] [CrossRef]
- Wu, J.-Y. Learning Analytics on Structured and Unstructured Heterogeneous Data Sources: Perspectives from Procrastination, Help-Seeking, and Machine-Learning Defined Cognitive Engagement. Comput. Educ. 2021, 163, 104066. [Google Scholar] [CrossRef]
- Afzaal, M.; Nouri, J.; Zia, A.; Papapetrou, P.; Fors, U.; Wu, Y.; Li, X.; Weegar, R. Explainable AI for Data-Driven Feedback and Intelligent Action Recommendations to Support Students Self-Regulation. Front. Artif. Intell. 2021, 4, 723447. [Google Scholar] [CrossRef] [PubMed]
- Imhof, C.; Comsa, I.-S.; Hlosta, M.; Parsaeifard, B.; Moser, I.; Bergamin, P. Prediction of Dilatory Behavior in eLearning: A Comparison of Multiple Machine Learning Models. IEEE Trans. Learn. Technol. 2022, 16, 648–663. [Google Scholar] [CrossRef]
- Mai, T.T.; Bezbradica, M.; Crane, M. Learning Behaviours Data in Programming Education: Community Analysis and Outcome Prediction with Cleaned Data. Future Gener. Comput. Syst. 2022, 127, 42–55. [Google Scholar] [CrossRef]
- Ramaswami, G.; Susnjak, T.; Mathrani, A. Supporting Students’ Academic Performance Using Explainable Machine Learning with Automated Prescriptive Analytics. BDCC 2022, 6, 105. [Google Scholar] [CrossRef]
- Black, P.; Wiliam, D. Developing the Theory of Formative Assessment. Educ. Asse Eval. Acc. 2009, 21, 5–31. [Google Scholar] [CrossRef]
- Carless, D.; Boud, D. The Development of Student Feedback Literacy: Enabling Uptake of Feedback. Assess. Eval. High. Educ. 2018, 43, 1315–1325. [Google Scholar] [CrossRef]
- Jivet, I.; Scheffel, M.; Specht, M.; Drachsler, H. License to Evaluate: Preparing Learning Analytics Dashboards for Educational Practice. In Proceedings of the Proceedings of the 8th International Conference on Learning Analytics and Knowledge, March 7 2018; ACM: Sydney New South Wales Australia; pp. 31–40. [Google Scholar]
- Molloy, E.; Boud, D.; Henderson, M. Developing a Learning-Centred Framework for Feedback Literacy. Assess. Eval. High. Educ. 2020, 45, 527–540. [Google Scholar] [CrossRef]
- Nicol, D.J.; Macfarlane-Dick, D. Formative Assessment and Self-regulated Learning: A Model and Seven Principles of Good Feedback Practice. Stud. High. Educ. 2006, 31, 199–218. [Google Scholar] [CrossRef]
- Crivei, L.M.; Ionescu, V.-S.; Czibula, G. An Analysis of Supervised Learning Methods for Predicting Students’ Performance in Academic Environments 2019. [CrossRef] [PubMed]
- Kostopoulos, G.; Kotsiantis, S.; Pierrakeas, C.; Koutsonikos, G.; Gravvanis, G.A. Forecasting Students’ Success in an Open University. IJLT 2018, 13, 26. [Google Scholar] [CrossRef]
- Moreno-Marcos, P.M.; Alario-Hoyos, C.; Munoz-Merino, P.J.; Kloos, C.D. Prediction in MOOCs: A Review and Future Research Directions. IEEE Trans. Learn. Technol. 2019, 12, 384–401. [Google Scholar] [CrossRef]
- Nuankaew, P. Dropout Situation of Business Computer Students, University of Phayao. Int. J. Emerg. Technol. Learn. 2019, 14, 115. [Google Scholar] [CrossRef]
- Polyzou, A.; Karypis, G. Feature Extraction for Next-Term Prediction of Poor Student Performance. IEEE Trans. Learn. Technol. 2019, 12, 237–248. [Google Scholar] [CrossRef]
- Fateh Allah, A.G. USING MACHINE LEARNING TO SUPPORT STUDENTS’ ACADEMIC DECISIONS. J. Theor. Appl. Inf. Technol. 2020, 98. [Google Scholar]
- Wakelam, E.; Jefferies, A.; Davey, N.; Sun, Y. The Potential for Student Performance Prediction in Small Cohorts with Minimal Available Attributes. Br. J. Educ. Technol. 2020, 51, 347–370. [Google Scholar] [CrossRef]
- Abou Gamie, E.; Abou El-Seoud, S.; A. Salama, M. Comparative Analysis for Boosting Classifiers in the Context of Higher Education. Int. J. Emerg. Technol. Learn. 2020, 15, 16. [Google Scholar] [CrossRef]
- Ayouni, S.; Hajjej, F.; Maddeh, M.; Al-Otaibi, S. A New ML-Based Approach to Enhance Student Engagement in Online Environment. PLoS ONE 2021, 16, e0258788. [Google Scholar] [CrossRef] [PubMed]
- Deho, O.B.; Joksimovic, S.; Li, J.; Zhan, C.; Liu, J.; Liu, L. Should Learning Analytics Models Include Sensitive Attributes? Explaining the Why. IEEE Trans. Learn. Technol. 2023, 16, 560–572. [Google Scholar] [CrossRef]
- Cui, Y.; Chen, F.; Shiri, A.; Fan, Y. Predictive Analytic Models of Student Success in Higher Education: A Review of Methodology. ILS 2019, 120, 208–227. [Google Scholar] [CrossRef]
- Qushem, U.B.; Oyelere, S.S.; Akçapınar, G.; Kaliisa, R.; Laakso, M.-J. Unleashing the Power of Predictive Analytics to Identify At-Risk Students in Computer Science. Tech Know Learn 2023. [Google Scholar] [CrossRef]
- Mubarak, A.A.; Cao, H.; Zhang, W. Prediction of Students’ Early Dropout Based on Their Interaction Logs in Online Learning Environment. Interact. Learn. Environ. 2022, 30, 1414–1433. [Google Scholar] [CrossRef]
- Talamás-Carvajal, J.A.; Ceballos, H.G. A Stacking Ensemble Machine Learning Method for Early Identification of Students at Risk of Dropout. Educ. Inf. Technol. 2023, 28, 12169–12189. [Google Scholar] [CrossRef]
- Winstone, N.E.; Nash, R.A.; Parker, M.; Rowntree, J. Supporting Learners’ Agentic Engagement With Feedback: A Systematic Review and a Taxonomy of Recipience Processes. Educ. Psychol. 2017, 52, 17–37. [Google Scholar] [CrossRef]
- Universidad de Colima Numeralia Institucional 2024; Universidad de Colima: Colima, México, 2024.
- Universidad de Colima Informe de labores 2024: Dirección General de Recursos Educativos Digitales (DGRED); Universidad de Colima: Colima, México, 2024.
- Universidad de Colima Informe de labores 2024: Dirección General de Tecnologías Informacionales (DGTI); Universidad de Colima: Colima, México, 2024.
- Álvarez Magallán, B.A.; Acosta-Díaz, R.; Morales-Vanegas, E.A. Privacy-Aware Artificial Intelligence: A Review of Design Principles and Applications. Av. En. IHC 2024, 9, 209–213. [Google Scholar] [CrossRef]
- Moreno-Marcos, P.M.; Muñoz-Merino, P.J.; Alario-Hoyos, C.; Estévez-Ayres, I.; Delgado Kloos, C. Analysing the Predictive Power for Anticipating Assignment Grades in a Massive Open Online Course. Behav. Inf. Technol. 2018, 37, 1021–1036. [Google Scholar] [CrossRef]
- Liao, C.-H.; Wu, J.-Y. Deploying Multimodal Learning Analytics Models to Explore the Impact of Digital Distraction and Peer Learning on Student Performance. Comput. Educ. 2022, 190, 104599. [Google Scholar] [CrossRef]
- Diario Oficial de la Federación Ley General de Protección de Datos Personales en Posesión de Sujetos Obligados. 2025.
- Karunaratne, T. For Learning Analytics to Be Sustainable under GDPR—Consequences and Way Forward. Sustainability 2021, 13, 11524. [Google Scholar] [CrossRef]
- UNESCO Recommendation on the Ethics of Artificial Intelligence 2022.
- Oye, E.; Frank, E.; Owen, J. Ethical Considerations in AI-Driven Education 2024. [CrossRef] [PubMed]
- Bråten, I.; Olaussen, B.S. Profiling Individual Differences in Student Motivation: A Longitudinal Cluster-Analytic Study in Different Academic Contexts. Contemp. Educ. Psychol. 2005, 30, 359–396. [Google Scholar] [CrossRef]
- Koopman, M.; Beijaard, D. Nuances and Details in Student Approaches to Learning in Innovative Secondary Education Using Profiles. Int. J. Educ. Res. Open 2024, 6, 100316. [Google Scholar] [CrossRef]
Figure 1.
Data processing and modeling pipeline based on real institutional data.
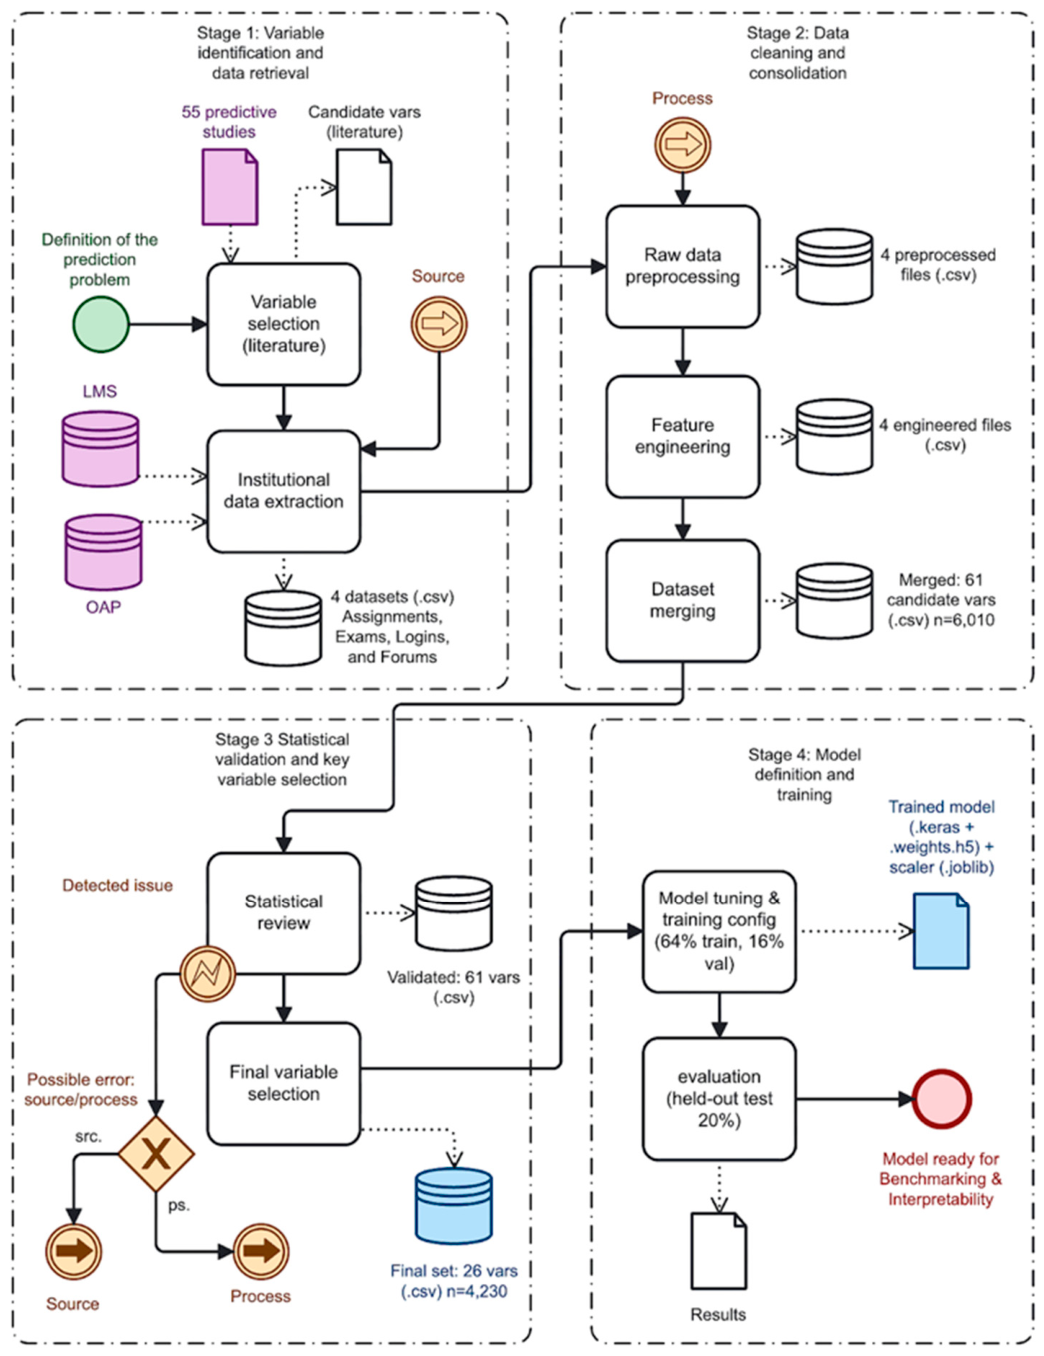
Figure 2.
Average and variability of variable categories across 55 empirical studies on academic-performance prediction.
Figure 2.
Average and variability of variable categories across 55 empirical studies on academic-performance prediction.
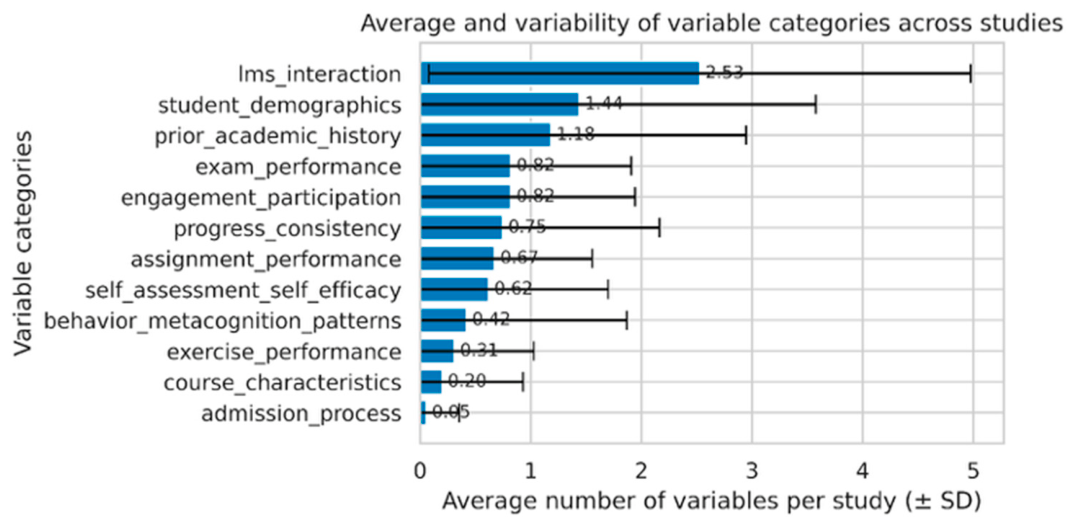
Figure 3.
Search space of the multi-task DNN with tunable depth, width, dropout, and L2 regularization feeding five task-specific heads.
Figure 3.
Search space of the multi-task DNN with tunable depth, width, dropout, and L2 regularization feeding five task-specific heads.
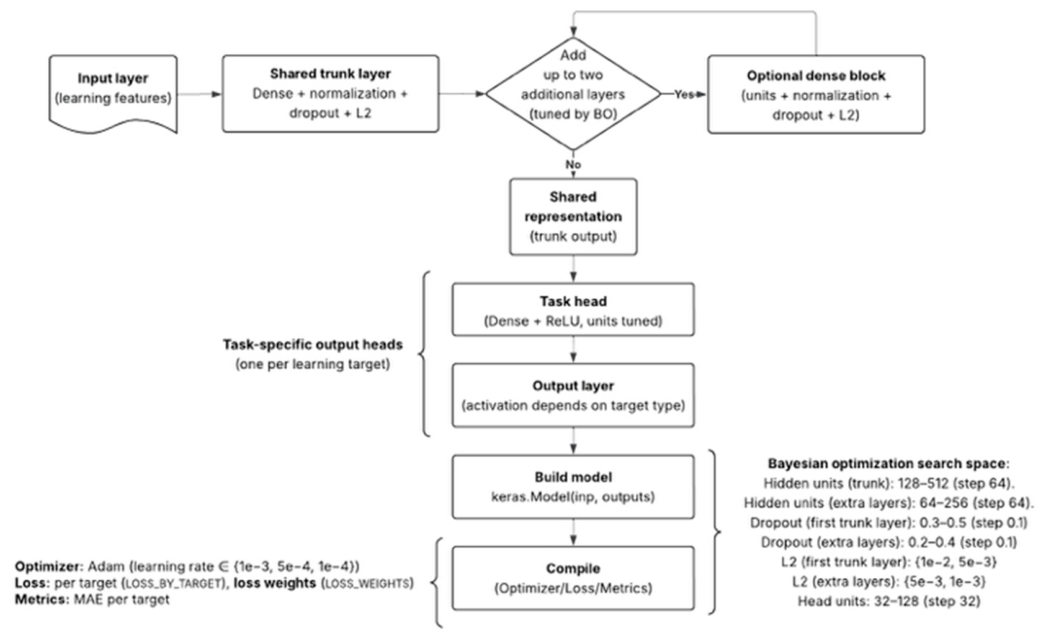
Figure 4.
Training workflow integrating early stopping, adaptive learning rate, and checkpointing for reproducible convergence.
Figure 4.
Training workflow integrating early stopping, adaptive learning rate, and checkpointing for reproducible convergence.
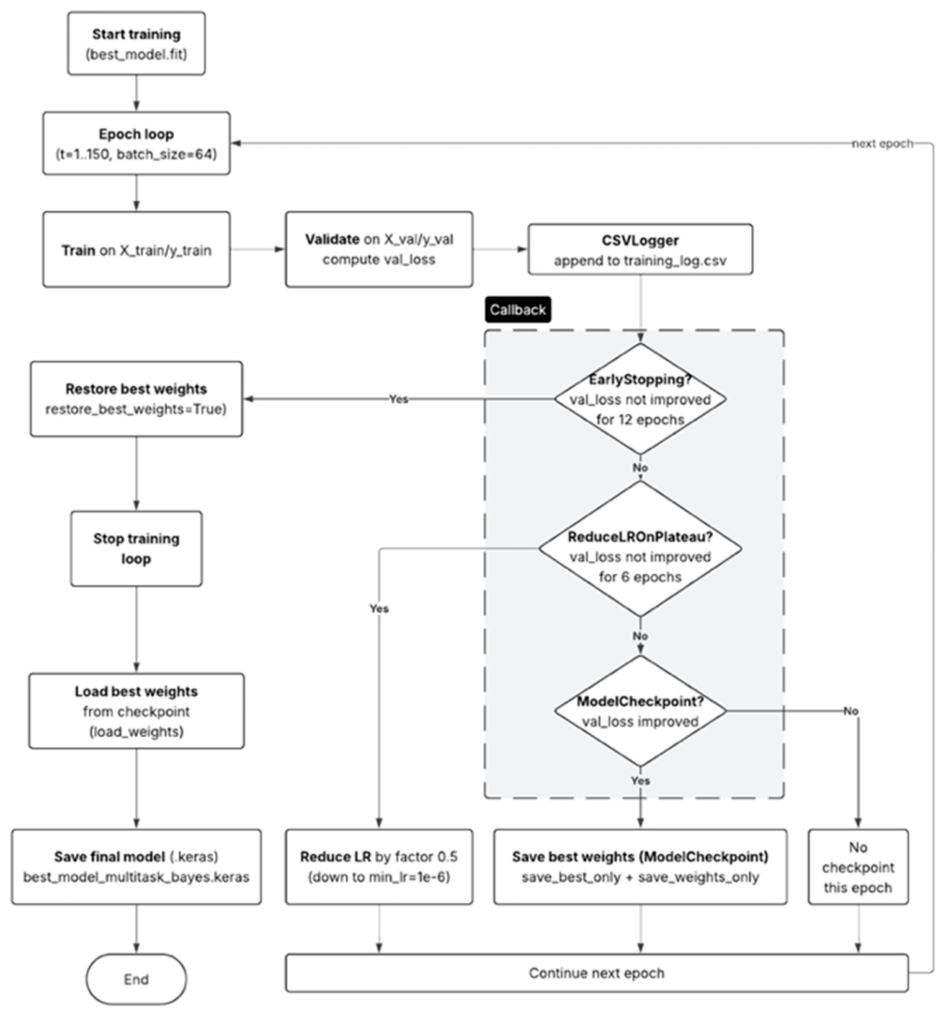
Figure 5.
Converging training and validation loss curves for the optimized model.
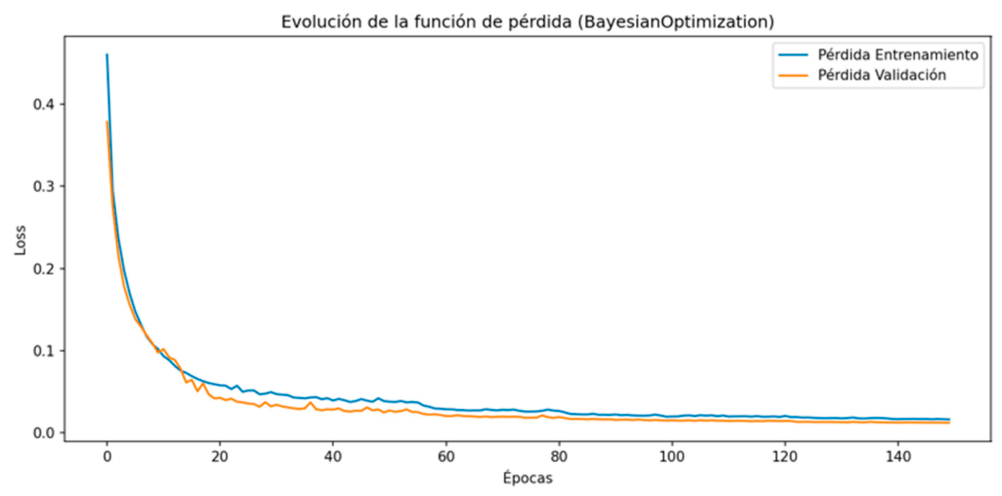
Figure 6.
SHAP summary plot for missing_assignments, showing that total, ungraded, and submitted assignments are key predictors, with workload and feedback delays linked to higher missing rates.
Figure 6.
SHAP summary plot for missing_assignments, showing that total, ungraded, and submitted assignments are key predictors, with workload and feedback delays linked to higher missing rates.
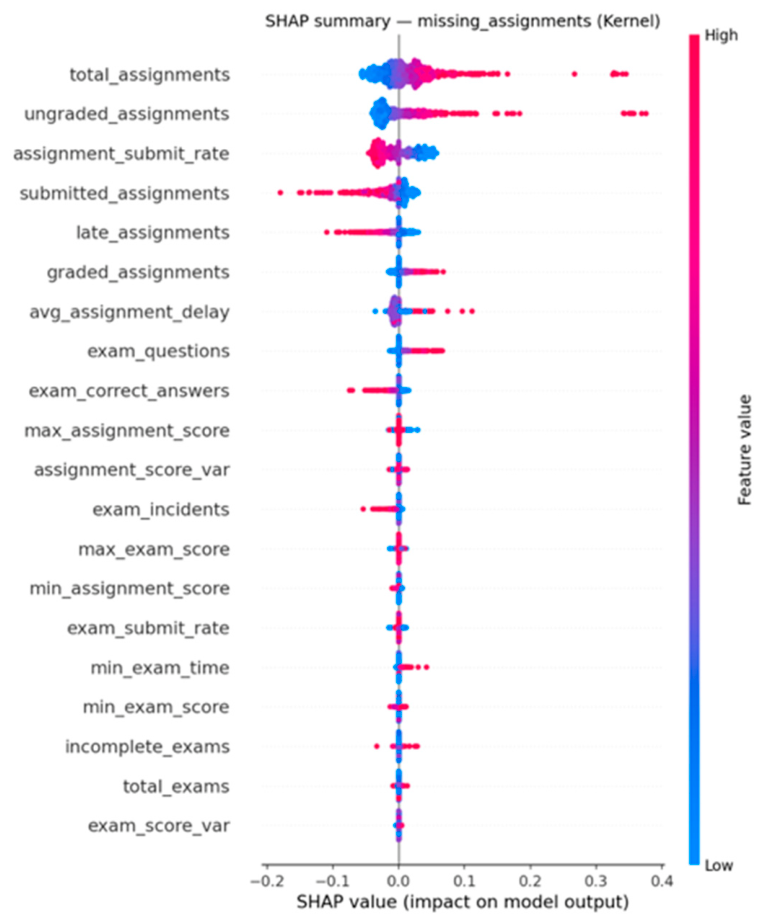
Figure 7.
Predicted vs. actual values for avg_assignment_score.
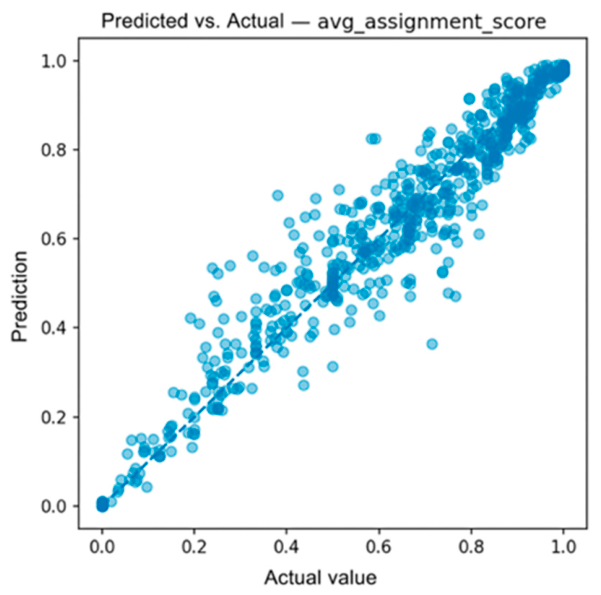
Figure 8.
Two-dimensional PCA projection of the seven clusters, showing partial overlaps that represent transitional zones of engagement and support a continuum model of self-regulation.
Figure 8.
Two-dimensional PCA projection of the seven clusters, showing partial overlaps that represent transitional zones of engagement and support a continuum model of self-regulation.
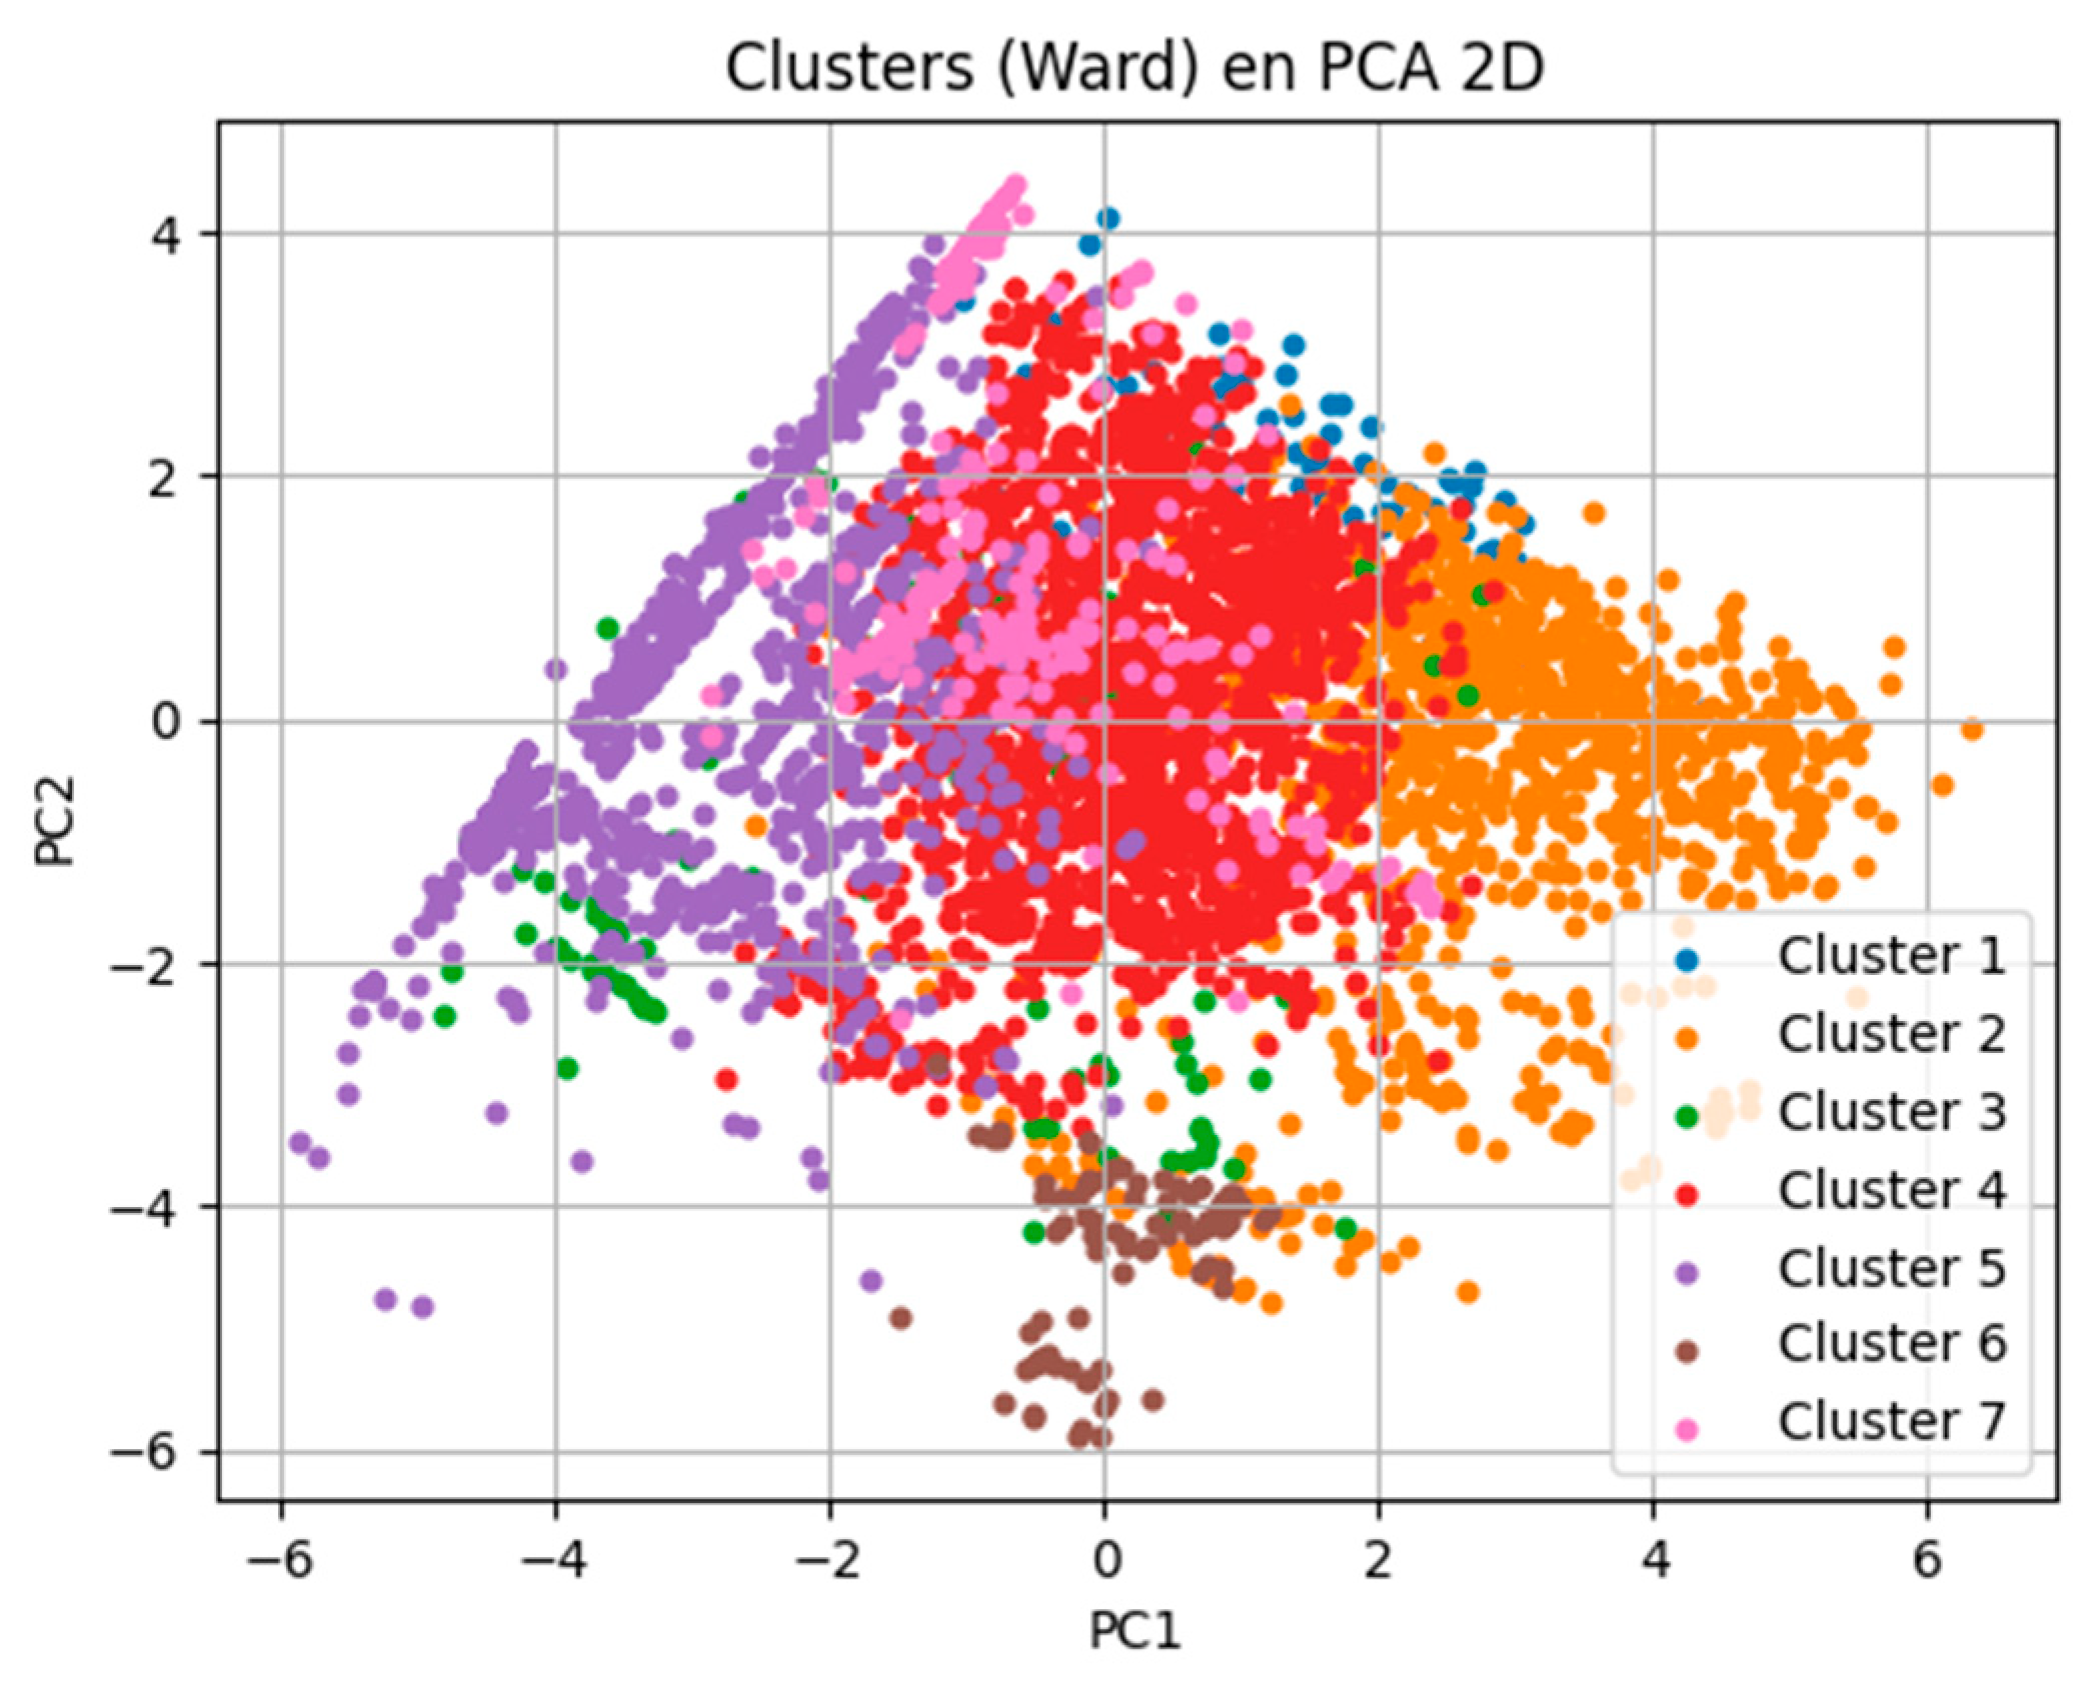
Figure 9.
Snapshot-based operationalization of multi-output predictions within a formative assessment cycle.
Figure 9.
Snapshot-based operationalization of multi-output predictions within a formative assessment cycle.
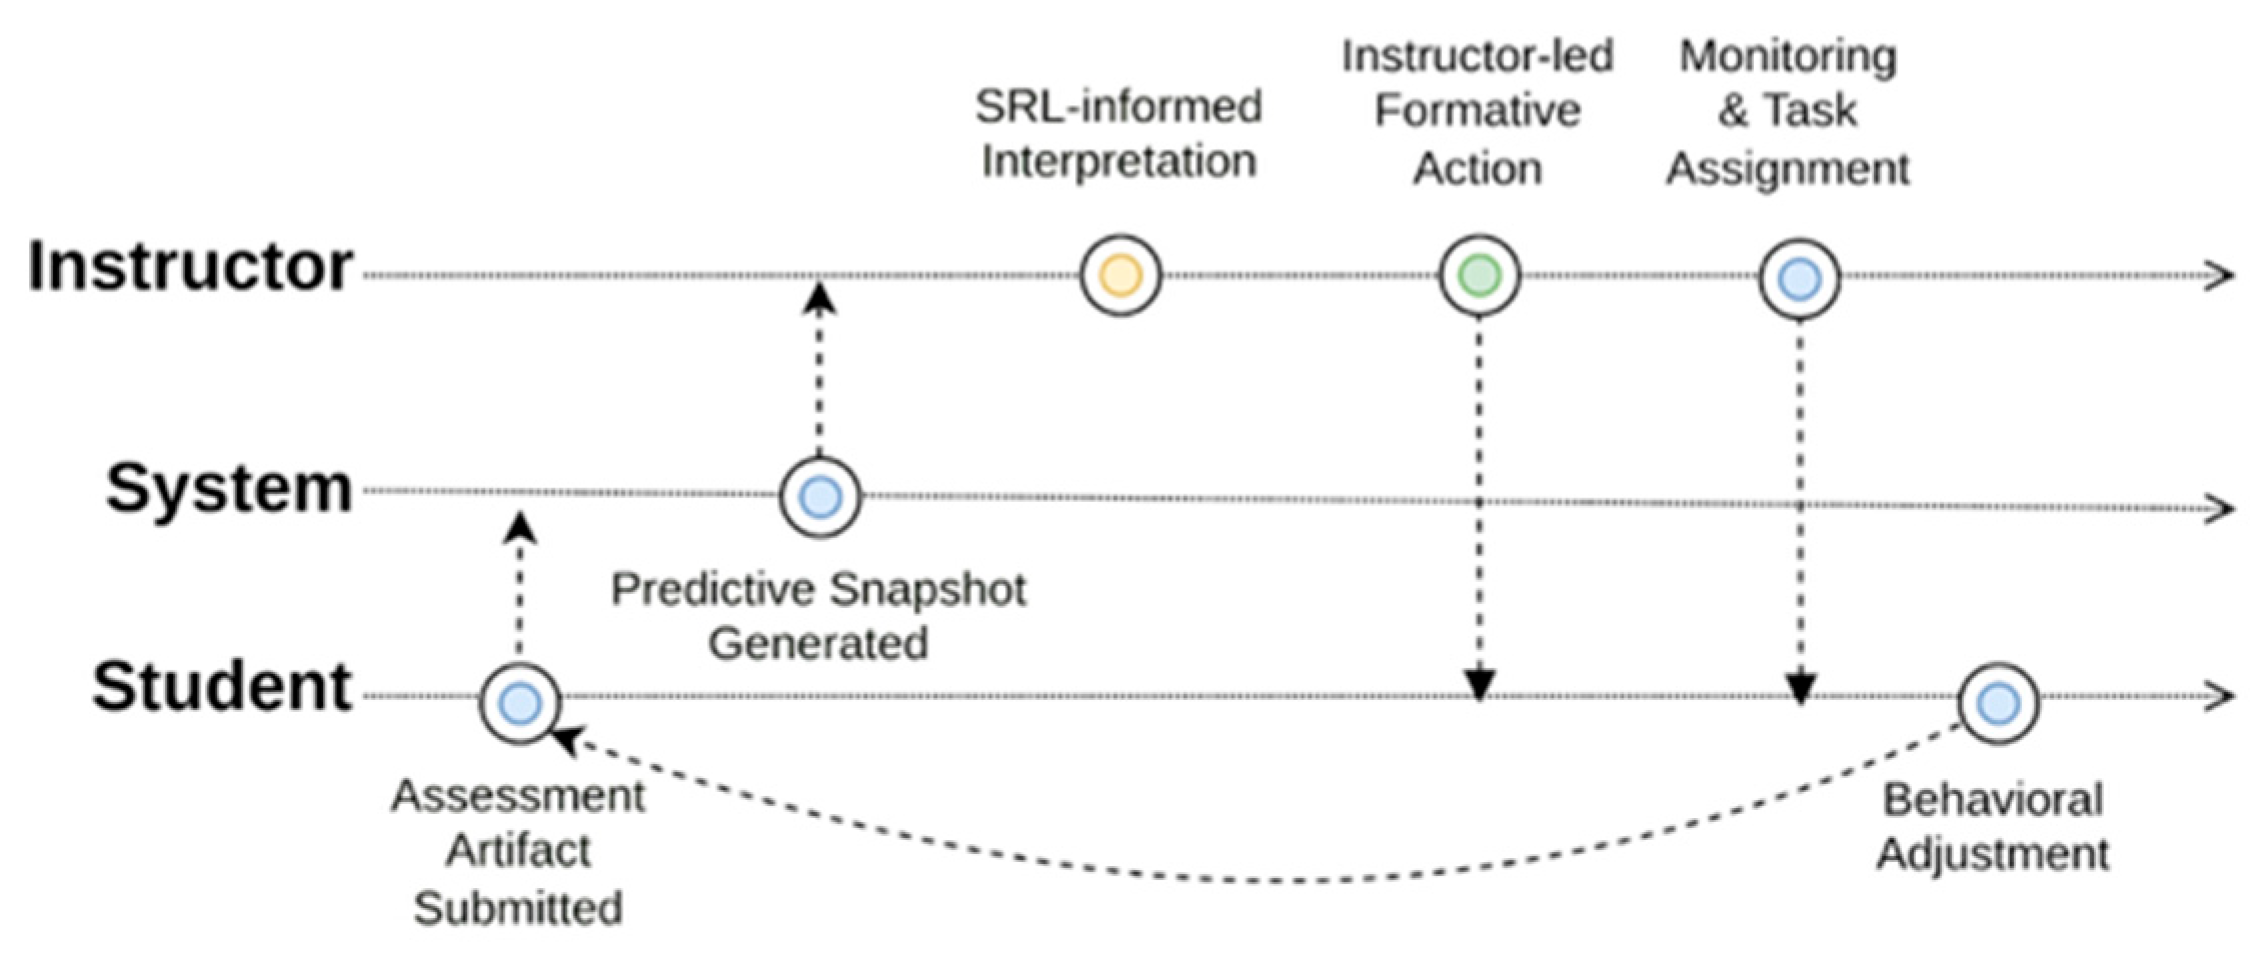
Figure 10.
LARC prototype interface displaying multidimensional academic profiling based on the proposed predictive model, including current signals, contextual indicators, and short-term projected academic risk. All student names and identifiers shown in the interface are fictitious and generated for demonstration purposes only.
Figure 10.
LARC prototype interface displaying multidimensional academic profiling based on the proposed predictive model, including current signals, contextual indicators, and short-term projected academic risk. All student names and identifiers shown in the interface are fictitious and generated for demonstration purposes only.
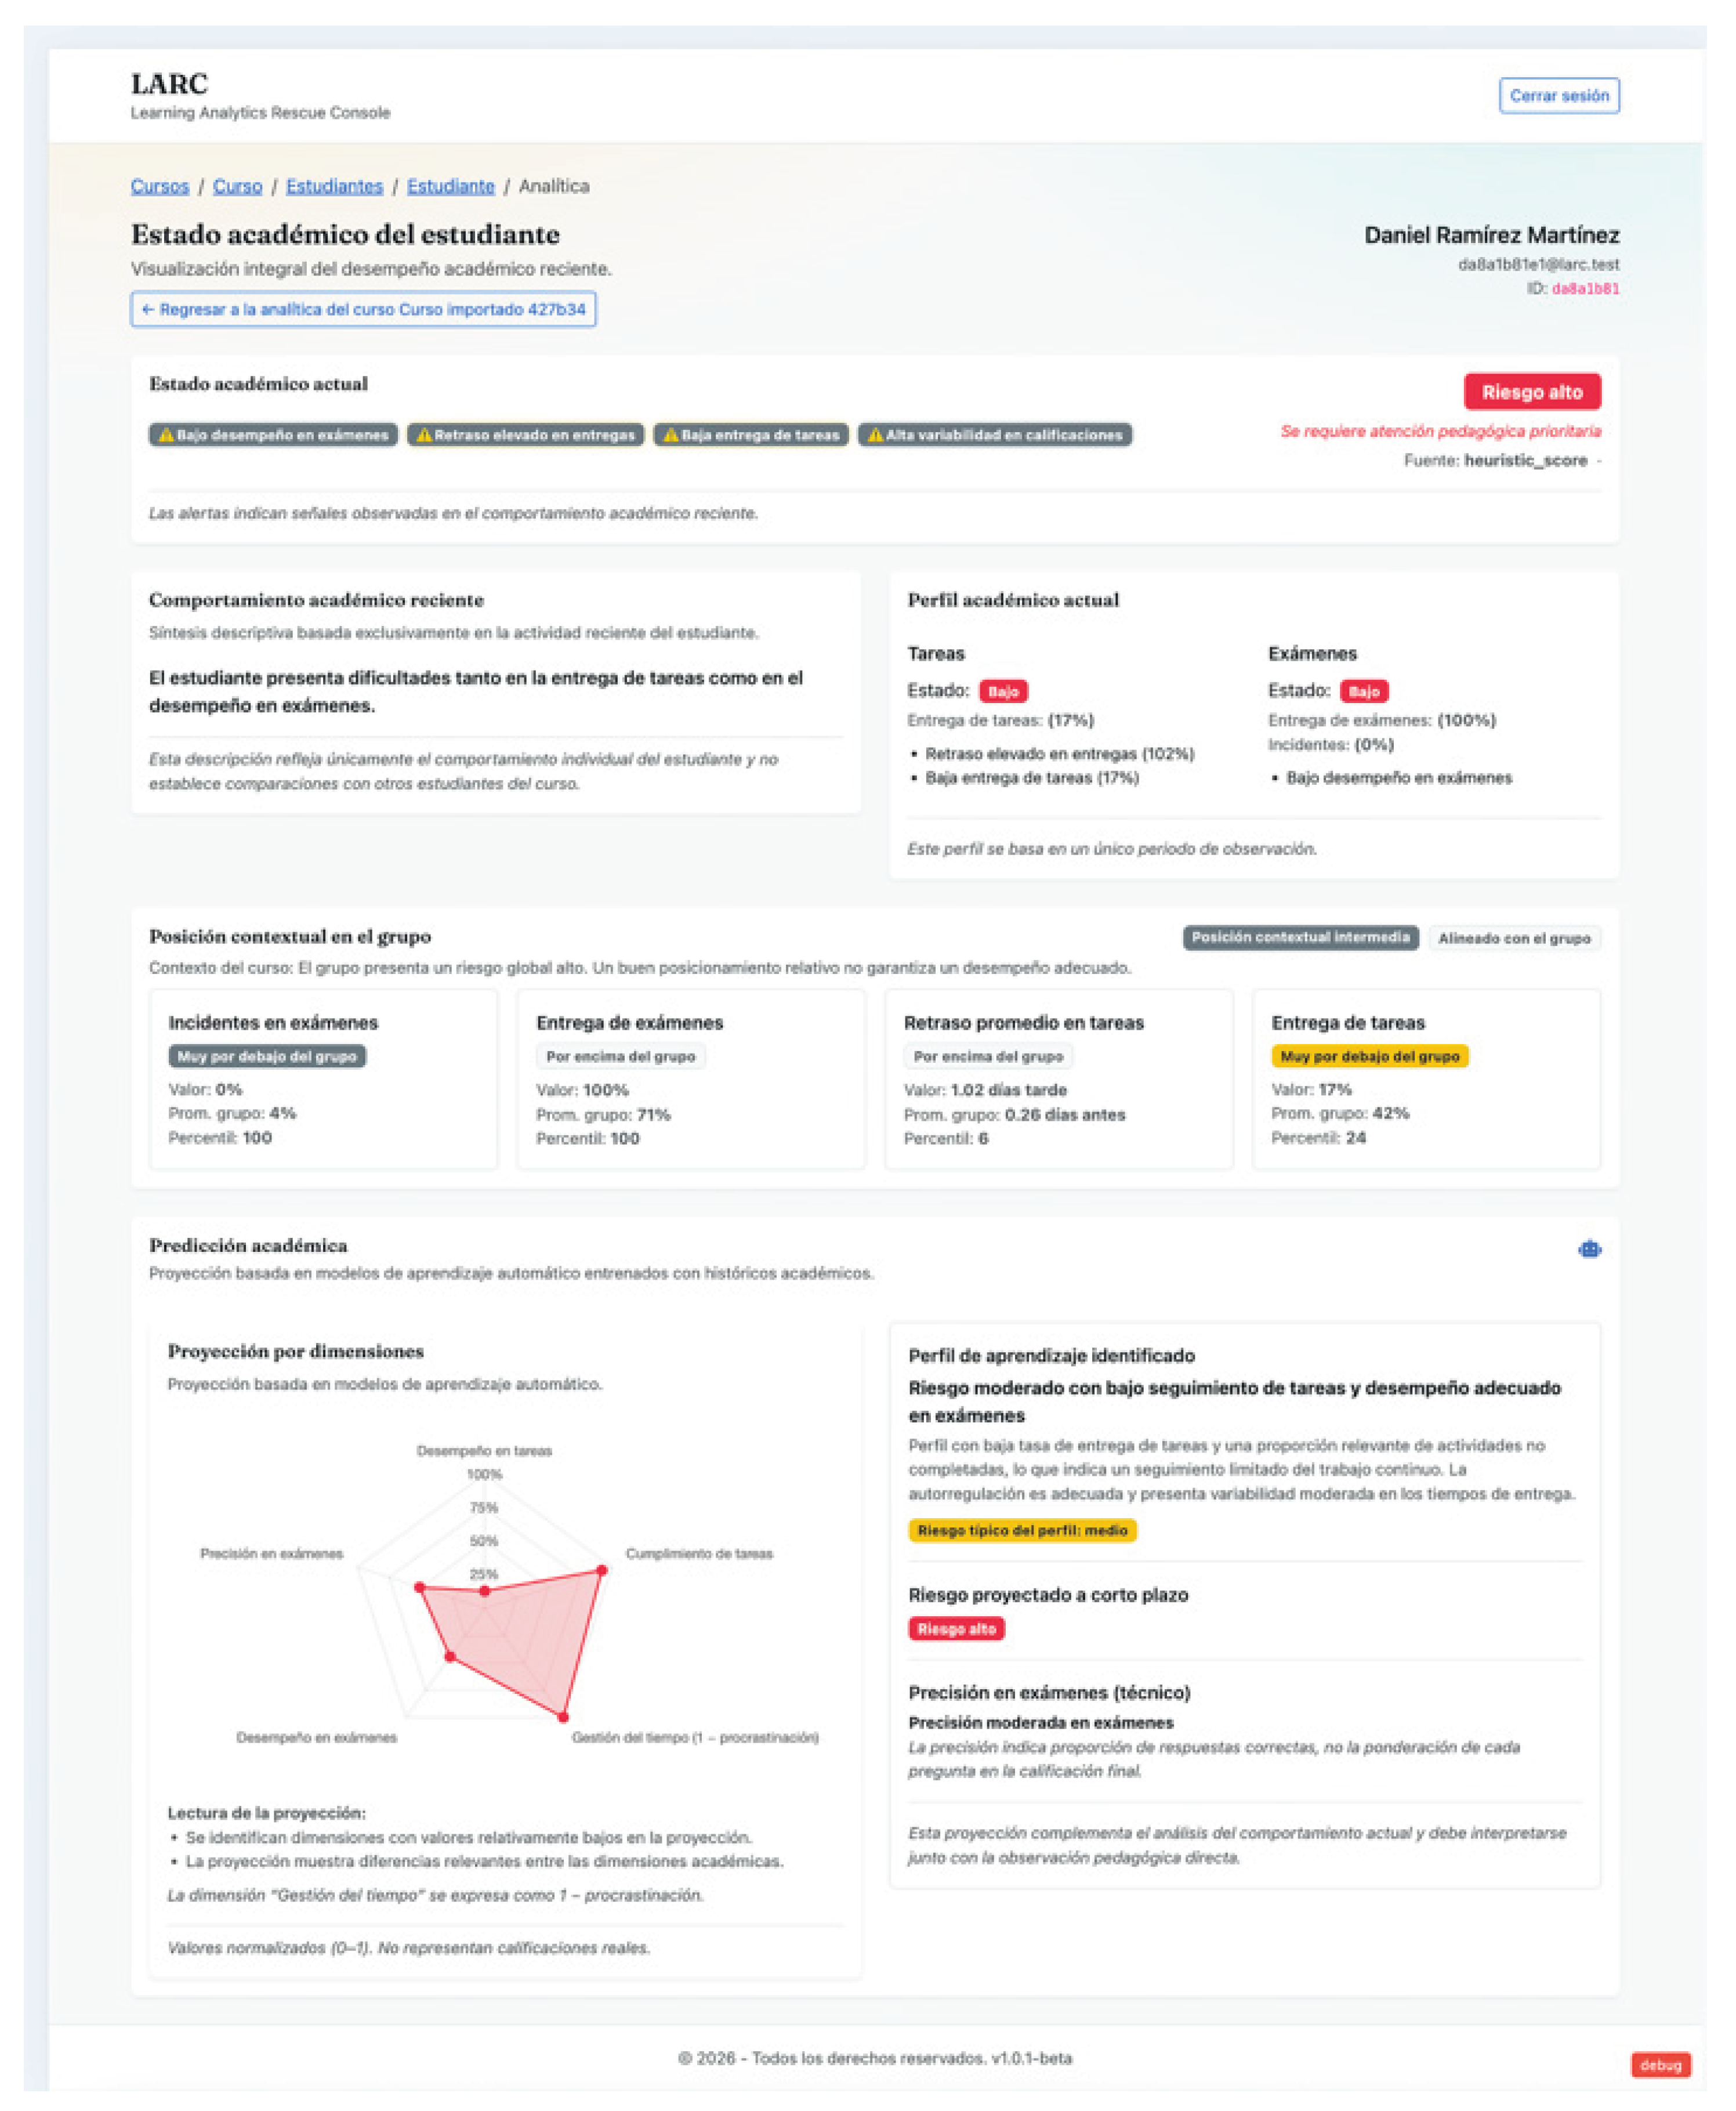

Table 1.
Summary of Data Sources and Behavioral Dimensions.
| Category | Source | Description |
|---|---|---|
| Exam performance | Evpraxis | Final exam score, relative score (%), time spent, and incident reports (e.g., interruptions or restarts). 838,597 records. |
| Assignment performance | Educ | Average grades and delivery status (on-time or late). 97,514 records. |
| LMS access behavior | Educ | Session counts, frequency, and duration. 372,672 records, with some missing data due to platform logging loss. |
| Forum participation | Educ | Posts, replies, and timestamps. 15,914 records; not all courses used forums. |
Table 2.
Summary statistics of selected features and target variables (N = 4,230).
| Variable | Mean | Median | Std. Dev. | Min | Max |
|---|---|---|---|---|---|
| avg_assignment_score | 0.547 | 0.634 | 0.347 | 0.000 | 1.000 |
| missing_assignments | 0.124 | 0.074 | 0.131 | 0.000 | 1.000 |
| assignment_procrast_rate | 0.561 | 0.632 | 0.377 | 0.000 | 1.000 |
| avg_exam_score | 0.472 | 0.469 | 0.270 | 0.000 | 1.000 |
| exam_accuracy | 0.409 | 0.416 | 0.287 | 0.000 | 1.000 |
| assignment_submit_rate | 0.520 | 0.583 | 0.317 | 0.000 | 1.000 |
| exam_submit_rate | 0.708 | 0.750 | 0.326 | 0.000 | 1.000 |
| min_exam_time | 0.612 | 0.000 | 1.245 | 0.000 | 45.571 |
| avg_assignment_delay | 1.099 | 0.000 | 7.199 | -48.469 | 57.246 |
Table 3.
Examples of statistics-driven feature decisions.
| Feature(s) | Test/Check | Result | Decision | Justification |
|---|---|---|---|---|
| avg_assignment_delay | KS test | KS statistic = 0.30721; p < 0.0001 | Keep + RobustScaler | Skewed distribution with extreme values → robust scaling to reduce influence of outliers |
| exam_incidents | KS test | KS statistic = 0.24661; p < 0.0001 | Keep + Min-Max Scaling (0–1) | Right-skewed bounded distribution → Min-Max scaling to preserve proportionality |
| exam_questions | Descriptive statistics | Unusually high max/mean/median values | Triggered data audit | Outliers led to the discovery of mislinked exams (same evpraxis group but different course) → recaptured data |
| assignment_delay | Descriptive statistics + distribution | Extreme delay values in a few courses | Triggered data audit | Detected reused course shells in LMS with outdated deadlines → affected records discarded or corrected |
Table 4.
Pedagogical dimensions and target variables.
| Dimension | Target variable(s) | Primary meaning |
|---|---|---|
| Achievement | avg_assignment_score, avg_exam_score | Performance in assignments and exams |
| Engagement | missing_assignments | Number of assignments not submitted |
| Temporal consistency | assignment_procrast_rate | Proportion of assignments submitted late |
| Evaluation quality | exam_accuracy | Precision in answering exam questions |
Table 5.
Extended metrics of model performance.
| Target variable | MAE | RMSE |
|---|---|---|
| Global Metrics | 0.0239 | 0.0404 |
| avg_assignment_score | 0.0412 | 0.0652 |
| missing_assignments | 0.0124 | 0.0182 |
| assignment_procrast_rate | 0.0182 | 0.0313 |
| avg_exam_score | 0.0271 | 0.0385 |
| exam_accuracy | 0.0203 | 0.0331 |
Table 6.
Post-hoc derived classification results.
| Target variable | F1-macro | QWK |
|---|---|---|
| avg_assignment_score | 0.7010 | 0.9295 |
| missing_assignments | 0.9410 | 0.9585 |
| assignment_procrast_rate | 0.9422 | 0.9766 |
| avg_exam_score | 0.9039 | 0.9758 |
| exam_accuracy | 0.7892 | 0.9346 |
Table 7.
Comparative performance of baseline models versus proposed DNN.
| Target variable | Linear Regression | Decision Tree | Random Forest |
|---|---|---|---|
| Global mean | MAE = 0.0836 RMSE = 0.1105 R2 = 0.8389 |
MAE = 0.0238 RMSE = 0.0528 R2 = 0.9668 |
MAE = 0.0199 RMSE = 0.0387 R2 = 0.9824 |
| avg_assignment_score | MAE = 0.0926 RMSE = 0.1170 R2 = 0.8867 |
MAE = 0.0388 RMSE = 0.0837 R2 = 0.9421 |
MAE = 0.0303 RMSE = 0.0571 R2 = 0.9730 |
| missing_assignments | MAE = 0.0000 RMSE = 0.000 R2 = 1.000 |
MAE = 0.0027 RMSE = 0.0088 R2 = 0.9947 |
MAE = 0.0030 RMSE = 0.0066 R2 = 0.9970 |
| assignment_procrast_rate | MAE = 0.1691 RMSE = 0.2183 R2 = 0.6558 |
MAE = 0.0252 RMSE = 0.0690 R2 = 0.9656 |
MAE = 0.0278 RMSE = 0.0546 R2 = 0.9785 |
| avg_exam_score | MAE = 0.0457 RMSE = 0.0611 R2 = 0.9497 |
MAE = 0.0202 RMSE = 0.0412 R2 = 0.9772 |
MAE = 0.0159 RMSE = 0.0320 R2 = 0.9862 |
| exam_accuracy | MAE = 0.1105 RMSE = 0.1563 R2 = 0.7024 |
MAE = 0.0322 RMSE = 0.0612 R2 = 0.9543 |
MAE = 0.0225 RMSE = 0.0432 R2 = 0.9772 |
Table 8.
Comparative performance of representative regression-based predictive learning analytics models (2018-2025).
Table 8.
Comparative performance of representative regression-based predictive learning analytics models (2018-2025).
| Reference | Model(s) | Prediction Target | R2 | MAE | RMSE |
|---|---|---|---|---|---|
| Moreno-Marcos et al. [42] | Regression, SVM, Decision Tree, Random Forest | End-of-course (final grade) & in-term (assignment scores) | - | - | 0.126 |
| Kostopoulos et al. [24] | Ensemble (REPTree + M5’ Rules regression) | End-of-course (final exam grade 5–10) | - | 0.55 | - |
| Crivei et al. [23] | Random Forest, ANN, SVM, Decision Tree | End-of-course (final exam grade) | - | - | 1.22 |
| Fateh Allah [28] | Gradient Boosted Trees, Random Forest, DL | End-of-course GPA (major, concentration, course) | - | - | 0.18 |
| Liao & Wu [43] | Ensemble (RF, SVM, FCNN, LSTM, etc.) | End-of-course (final grade) | 0.58 | - | - |
| Imhof et al. [15] | Comparison of 8 ML algorithms (NB, KNN, RBFN…) | Assignment delay (days, LMS + questionnaires) | - | 7.27 | - |
| This study (DNN) | Multi-output Deep Neural Network | Assignments, Exams, Engagement (5 targets) | 0.9803 | 0.0239 | 0.0404 |
Note. Values reported correspond to the main outcome/best value variable in each study.
Table 9.
Robustness: Median (and IQR when available) across configurations.
| Condition | Median R2 (IQR) | Median MAE (IQR) | Notes |
|---|---|---|---|
| All features | 0.970 (0.962–0.971) | 0.032 (0.032–0.036) | Baseline configuration |
| Top-15 features | 0.958 (0.955–0.963) | 0.038 (0.035–0.039) | Compact subset, stable |
| Top-10 features | 0.857 (0.849–0.863) | 0.063 (0.060–0.065) | Noticeable reduction |
| Test 10% | 0.961 | 0.037 | Median by split ratio |
| Test 20% | 0.951 | 0.041 | — |
| Test 30% | 0.957 | 0.038 | — |
| MinMax scaler | 0.952 | 0.041 | Median by scaler |
| Robust scaler | 0.964 | 0.034 | Slightly superior |
Disclaimer/Publisher’s Note: The statements, opinions and data contained in all publications are solely those of the individual author(s) and contributor(s) and not of MDPI and/or the editor(s). MDPI and/or the editor(s) disclaim responsibility for any injury to people or property resulting from any ideas, methods, instructions or products referred to in the content. |
© 2026 by the authors. Licensee MDPI, Basel, Switzerland. This article is an open access article distributed under the terms and conditions of the Creative Commons Attribution (CC BY) license (http://creativecommons.org/licenses/by/4.0/).
Copyright: This open access article is published under a Creative Commons CC BY 4.0 license, which permit the free download, distribution, and reuse, provided that the author and preprint are cited in any reuse.


