

Submitted:
05 July 2026
Posted:
08 July 2026
You are already at the latest version
Abstract
Background: Data analysis plays a pivotal role in transforming raw data into findings that are transparent, reproducible, and clinically meaningful and useful, which is critical when analyzing insulin-related data for diabetes studies. Failing to do so will make subsequent analysis of insulin data irrelevant due to inaccuracies. Objective: Describe the end-to-end pre-processing steps used for assessing the T1DEXI dataset and why these steps are necessary before moving to data analysis. Methods: Standardize and harmonize the raw datasets, including comparing devices and adjusting per-device pre-processing steps; mitigating gaps in data; accounting for extended insulin delivery that is articulated as single timestamp records as well as similarly accounting for suspension of insulin delivery, taking into account the periods of time in which insulin was or was not delivered. Results: Insulin-related data is transformed to uniform per-5-minute intervals and is able to be used for subsequent analysis and event-based interpretation. Conclusions: As it relates to insulin delivery, pre-processing should be used to make sure that insulin delivery is uniformly analyzed down to 5-minute intervals so that all insulin delivery event types, whether those be manual up-front boluses; basal or temporary basal rates; and extended bolus events (such as square or dual/square wave boluses) and suspend events are correctly documented as a timeseries such that subsequent analysis will be accurate based on the duration of insulin activity.
Keywords:
CGM
; continuous glucose monitoring
; glucose
; data
; insulin
; diabetes
; type 1 diabetes
; T1DEXI
; exercise
1. Introduction
The management of type 1 diabetes (T1D) represents a complex interplay between lifestyle factors, technological interventions, and physiological responses [1]. Individual behaviors such as exercise can provide short-term and long-term challenges for glycemic management and has been an ongoing area of exploration by diabetes researchers [2]. One of the challenges for researchers historically has been a lack of high-quality datasets where glycemic-related measures, including insulin delivery, as well as exercise, are specifically recorded [3]. The Type 1 Diabetes Exercise Initiative (T1DEXI) [1] was initiated to address some of these challenges and represents a significant real-world investigation into the impact of structured and real-world exercise regimes on individuals with T1D, leveraging modern technology to track exercise, nutritional intake, insulin dosing, and physiological responses. The T1DEXI dataset includes users with commercial Automated Insulin Delivery (AID) systems alongside users with other types of insulin delivery modalities (standalone insulin pumps and multiple daily injections) and offers valuable insights into the intricate interplay between user behavior related to exercise and glycemic outcomes [4].
Given our previous research in evaluating large, complex diabetes datasets [5], which necessitated developing data-cleaning and pre-processing streams, including deduplication across multiple datasets, we began to work with the T1DEXI dataset and apply similar methods to exploring, documenting, as well as pre-processing and cleaning the dataset, including sharing open-source code to assist other researchers leveraging such datasets in the future. As an example, extrapolation of why data cleaning is a critical step for research implementations of such datasets, we provide an introduction to the concept of net Insulin on Board (netIOB) as a fundamental metric for understanding insulin activity in a more nuanced way [7]. Particularly in the modern era of automated insulin delivery systems with an increase in insulin delivery records as compared to traditional insulin delivery methods, we provide the methods and processing strategies with open-source code to calculate netIOB from commercial AID datasets, exemplified through the T1DEXI dataset.
We have observed significant variance in how each commercial insulin delivery system records data uniquely, which necessitates careful understanding of how insulin is delivered by each device type to accurately examine and standardize the processing of insulin data in such a way that insulin is then recorded uniformly down to 5-minute intervals matching typical CGM data timing. This influences the ability for research teams to explore and analyze the data and draw accurate conclusions related to hypotheses regarding insulin delivery, whether that be amounts, types of delivery, and/or the timing of delivery in relation to other behavioral or situational events. Accurately aligning insulin dosing data with exercise, nutritional intake, and glycemic outcomes is critical to understanding and improving real-world diabetes management. In clinical settings, inconsistent or incomplete insulin records or missing carbohydrate records can obscure the true drivers of hypoglycemia or hyperglycemia or mask effective treatment strategies.
Based on this work, we sought to provide a set of generalizable principles and best practices for processing and analyzing diabetes data at scale, recognizing that there may be lessons to apply to research fields outside of diabetes as well for analyzing larger medical and health-related datasets. We aim to provide insights into diabetes devices’ behavior regarding insulin delivery in real-world settings; the implications for understanding the makeup of the T1DEXI dataset and other datasets with insulin dosing activity from commercial devices; and offer recommendations for other research teams to optimize the use of this type of diabetes data from any diabetes-related dataset.
1.1. netIOB as a Driver for Re-Evaluating Insulin Delivery in the T1DEXI Dataset
Commercial insulin pumps, and subsequently commercial AID systems which leverage these insulin pumps, have historically used bolus insulin to derive “insulin on board” (IOB) calculations. Bolus insulin doses were historically always manually delivered, but in the advent of AID systems, both bolus and basal (baseline insulin delivery rates) insulin dosing can be frequently adjusted, as often as every five minutes, in concert with available continuous glucose monitoring (CGM) data both by the user and by the automated system. As a result, where there were previously less than a few dozen insulin records per day per user (and often less than a dozen), there are now hundreds of insulin records per day per user with AID systems.
When open-source automated insulin delivery (OSAID) systems were developed, to aid users in understanding how insulin delivery was increased or decreased relative to the fixed basal insulin delivery they would otherwise get, a calculation of “net” insulin on board (netIOB) was developed. Depending on basal modulations, netIOB often (but not always) differs from traditional bolus-only IOB. Further, netIOB can become net “negative” if insulin delivery is reduced or suspended by the user or system for a period of time [7]. This occurs when there is less insulin in the body than typical and can drive glucose up, due to less than typical insulin activity in the body, as compared to a positive IOB that would eventually put pressure to drive glucose downward. Specifically in the context of exercise, a decreasing netIOB level or negative netIOB level can provide an indicator to users that they may not need to consume carbohydrates (or as many) in advance of or during exercise, whereas historically people with diabetes have often needed to consume carbohydrates to balance out existing insulin activity in the body at time of exercise. Thus, netIOB is a useful calculation, but only used currently in OSAID systems. As a result, we sought to evaluate whether we could calculate netIOB retrospectively on the T1DEXI dataset, to further improve our ability to assess patterns and develop predictive tools to decrease the risk of hypoglycemia related to exercise.
1.2. Why Insulin Delivery Records Require Careful Review and Re-Processing Prior to Analysis
The netIOB calculation results from OSAID systems, which originally used older generation insulin pumps (although more modern pumps are now commonly used in OSAID). Traditionally, insulin pumps are programmed to have baseline insulin delivery rates that deliver in the background (basal rates) and the ability to give short-term bursts of insulin (boluses). Users could also set temporary basal rates to replace the fixed basal rates, over a period of time (e.g. instead of 1 unit per hour, deliver zero units per hour for thirty minutes, such as when disconnecting for a shower.) Older generation pumps had unique characteristics, such as the fact that temporary basal rates could not be issued manually or automatically while an extended bolus (known as a square wave, or a dual/square wave when combined with an upfront bolus) was running for a fixed duration. Consequently, the original netIOB calculation code lacked provisions for dual/square or square wave bolus types, and we needed to explore a method for addressing this. Further, in the commercial AID datasets including T1DEXI, a dual/square or square wave bolus is originally recorded as the amount of bolus at a single timestamp, as well as has a variable for duration of the extended bolus. Researchers less familiar with diabetes and insulin dosing might overlook the fact that the total insulin is delivered at a fixed rate across the stated duration, rather than at the initial timestamp alone. This can lead to overestimation of insulin activity early in the bolus window and underestimation later, ultimately skewing calculations and event-based analysis of glycemic trends.
To determine whether square wave or dual/square wave boluses were worth coding, we first analyzed the T1DEXI dataset to determine whether we should simply disregard days with those events, if they were rare in the commercial AID dataset. However, we found that they were relatively common. For example, in T1DEXI, 47% of pump users used square or dual/square wave boluses at least once within the dataset. As a result, this represents a significant amount of user days and was worth exploring a solution for so that any researcher approaching the T1DEXI dataset, or indeed, any future diabetes dataset with commercial AIDs, could use an accurate, reproducible method for correctly assigning insulin delivery over time for square and dual/square wave boluses, thus improving the representation of insulin timing and the effects in the dataset. Similarly, ‘suspend’ insulin events are translated into the equivalent of 0u/hr basal rates.
The subsequent sections discuss more details on the methods for analyzing specific cases of these insulin delivery data nuances and examples for different AID and insulin pump systems.
2. Methods
2.1. Data Analysis of Different Commercial Diabetes Insulin Delivery System Records
We conducted an in-depth analysis of data from the two most common AID systems in the T1DEXI dataset: the Medtronic MiniMedÔ 670G (n=33) and the Tandem Control-IQ (n=187). Subsequent examination of the Medtronic MiniMedÔ 770G (n=2) confirmed further distinct data discrepancies in insulin delivery recording. This analysis involved scrutinizing patterns of basal insulin delivery, the prevalence of automated or temporary versus scheduled insulin records and identifying gaps or anomalies in data timestamps. Our findings highlight significant differences in recorded insulin delivery among these devices, with implications for future analyses of temporal insulin activity.
2.2. Basal Insulin Delivery Record Analysis Necessitates Per-Device Pre-Processing
The basal insulin delivery is recorded differently in every AID system and needs to be processed accordingly.
For the MiniMedÔ 670G pump data, we examined instances of ‘scheduled’ (default expected) basal insulin and the ‘automated’ insulin delivery data, which is how temporary adjustments to scheduled basal delivery are noted in approximately 5-minute intervals when they occur.
In contrast, for Tandem Control-IQ pump data, we analyzed ‘temp’ basal deliveries, which is how the ~5-minute interval insulin delivery is logged, and ‘scheduled’ basal rates to determine the actual basal insulin delivered.
For MiniMedÔ 770G pump data, we determined that while basal rate and total basal amount over time are recorded, there already exist discrete 5-minute time intervals with logged insulin delivery. However, those are defined as boluses rather than basals, likely confounding many viewers of the dataset analyzing high-level patterns of basal and bolus delivery and relative proportions of type of insulin delivery methods.
In order to recalculate netIOB, we determined that we needed to categorize insulin delivery events separately for each of these insulin pump device types, rather than re-using the netIOB code as-is which exists with certain assumptions about a single, unified pump type. This will involve steps described below to pre-process each device type based on their unique reporting structure of insulin delivery.
2.3. Differences in Device Types for Basal Records
- Medtronic MiniMedÔ 670G:
For MiniMed 670G users, analysis revealed that ‘scheduled’ basal insulin delivery occurred infrequently and irregularly. Instances of ‘scheduled’ delivery sometimes preceded what appeared to be gaps in timestamps, but are usually explained by an extended duration, indicating that this basal rate ran without any adjustments to this rate for that duration of time. This time period could be several hours. As a result, this ‘scheduled’ rate needed to be recalculated for the amount of duration indicated and divided into 5-minute interval segments, so that the insulin delivery could correctly be calculated over time rather than the initial timestamp. This method was also used for “suspend” events which indicate 0 u/hr basal delivery and also was divided into 5-minute time interval segments. Our methodology for assessing basal insulin delivery then involved aggregating ‘automated’ delivery amounts (typically already 5-minute intervals) as well as the newly processed 5-minute intervals of scheduled basal and suspended insulin delivery.
- Tandem Control-IQ:
For Control-IQ users, data analysis indicated a more straightforward interpretation of ‘scheduled’ and ‘temp’ basal deliveries. ‘Scheduled’ deliveries reflected the user’s typical expected (default profile) basal rate schedule, with ‘temp’ basal adjustments providing a clear record of the device’s automated insulin delivery adjustments that differ from the scheduled basal rate. This system more often records ‘scheduled’ basal, indicating it is using the default profile basal rate more frequently in the dataset. (However, this often occurs for only 5-minute intervals so while it appears with greater frequency, this is not necessarily a reflection of accuracy of the default basal rate.) This makes it slightly easier than the 670G to infer the baseline basal profile, for use in calculating deviations from net “0” (neutral basal) for netIOB. Summing the insulin deliveries based on the derived 5-minute intervals similarly to the 670G approach also allows for an accurate assessment of basal insulin delivered, with less variability and fewer anomalies observed in the sample datasets compared to the 670G data.
- Medtronic MiniMedÔ 770G:
For MiniMed 770G users, data analysis shows a simplistic record of basal rate and total basal amount over duration for which the basal ran. Further, there already exists discrete 5-minute time intervals with logged insulin delivery representing the duration that the basal insulin delivery covers. However, those are defined as boluses rather than basals, likely confounding many viewers of the dataset. To understand what insulin was delivered, the ‘bolus’ increments need to be added up for any given hour bucket and recategorized as attributable to basal insulin delivery. Separately, any boluses over a certain threshold should remain categorized as bolus. This threshold may eventually change when more users with 770G data are available. However, for the version of T1DEXI provided, only two users exist, and a ≥0.5u bolus threshold was chosen due to this likely reflecting manual boluses by both users. All other boluses are instead recategorized as basal insulin delivery.
2.4. Gaps in Data, Often Due to Manual Mode (Non-AID Time) in AID Systems, True of All Device Types
Each device type often has insulin delivery records as often as 5-minute intervals. However, sometimes there are longer gaps. When processing a temporal history of insulin, unifying the records down to five-minute intervals is useful for ensuring that no insulin delivery is missed due to oddities of the record keeping within a particular device. While some delays can occur, such that the intervals are not all exactly five minutes, we determined that the majority are within 5-6 minutes of each other and thus created a cutoff of when records are greater than 7 minutes apart.
When there are >7 minute gaps between timestamps, the basal insulin delivered will be inferred based on the `scheduled` basal type for either device, with the duration divided into 5 minute buckets to determine how much and when that insulin was divided, so that the adjusted dataset has basal insulin records every <7 minutes or so.
For instance, if there is a 1 hour and 45 minutes (105 minutes) duration in basal delivery records, and the scheduled basal rate is reported as 1.8 units per hour, we first calculate the total insulin expected to be delivered during this period (1.8 units/hour * 1.75 hours = 3.15 units). We calculate the total duration and insulin delivered down to 1 second precision (i.e., we calculate the ‘number of seconds in duration’ and ‘insulin delivered per second’). The duration is then divided into 5-minute intervals (105*60 seconds / 5 = 21 5-minute intervals), and then the total insulin delivered (3.15) is divided by the number of intervals (21), resulting in a delivery estimate of 0.15 units per 5-minute interval. The precision down to 1 second helps with the cases where the buckets are not precise 5 minutes. If the duration is 1 hour 46 minutes, the intervals would come out to be 21 total 5-minute intervals + 1 minute to spare. Here we multiply insulin-per-second by the number of seconds to spare (60 seconds in this case). These new timestamps are created and inserted into the record with the allocated insulin delivery amount to fill in the gap in insulin delivery records.
2.5. Adjusting Extended Boluses (Dual, Square Wave, or Dual/Square Wave) to Correctly Match when Insulin Was Delivered
As described previously, numerous users leverage extended bolus capabilities which are recorded in the dataset based on the initiation timestamp and may be misinterpreted without chunking the insulin records across the duration of the extended bolus.
Ultimately, the approach to processing square wave and dual/square wave boluses mirrors the handling of normal bolus and a scheduled basal rate that runs for a period of time (per above) >7 minutes, unifying the records down to better match how the insulin is delivered over that timeframe.
For a dual/square wave bolus, it is composed of two parts, a bolus delivered up front (no extended duration), and a second bolus amount with a time duration. A square wave bolus is the same, a bolus with a time duration, without the upfront normal bolus amount. The total square amount delivered should be divided into 5-minute chunks (calculated by n = duration / 5), therefore distributing the insulin delivery across the duration of the square wave bolus. These five-minute chunks are given a new variable type (AMTPI, representing “amount per interval”) and assigned a type of “square-chunk” in their own record row (with “FADTC + n*5” as the new record timestamps for as many n= total chunks that are derived from duration / 5).
Make note that basal records during this time period are not replaced by these new bolus records, as there may also be basal records of insulin delivered for 5-minute time intervals throughout the square wave period.
Thus, the logic for assessing insulin delivery per hour then adds up for the hour the sum of all basal insulin delivered (e.g. scheduled or temp or automated, per above) as well as sums the new 5 minute chunks from the square wave insulin delivered, alongside normal boluses, in order to calculate what insulin (basal or bolus) was delivered when.
Figure 1. Pre-processing of an extended (dual/square wave) bolus, showing the insulin delivery records before and after chunking the bolus into 5-minute “square-chunk” intervals.
2.6. Accounting for Suspension of the Insulin Pump (e.g., no Insulin Delivery)
Similarly, we also needed to write additional code that takes the time between the ‘suspend’ timestamp and the next available basal timestamp and calculates it as 0.0 u of insulin of basal for each 5-minute time segment in between. This allows these events to be logged as 0u/hr basal insulin, which is the correct interpretation of a ‘suspend’ when zero basal insulin is delivered.
2.7. Duplicate Record Analysis
For all insulin pump device types, there are typically two records of insulin delivery for every timestamp within the T1DEXI dataset. One usually indicates the rate in units per hour of insulin delivery, whereas the basal variable with an attribute of ‘scheduled’, ‘temp’, or ‘automated’ indicates the absolute amount in units of insulin that was delivered for that time between the timestamp and the subsequent basal timestamp.
(This was cross-checked by adding up the amounts of insulin delivered with the attribute variables for an hour time bucket and confirming this matches the ‘scheduled’ basal rates for either device type, and/or is around the average of the rates for each of the blank attribute basal rates (u/hr) for that hour.)
It is also notable that in some cases, there are triplicate or quadruple records with the same timestamp. This often occurs when there is a bolus delivery recorded for one of the timestamps, possibly indicating the system internally pausing automated mode and resuming it, usually immediately, but in some cases, it indicates the user has manually switched to manual mode instead of using automated insulin delivery.
2.8. All Insulin Pre-Processing Steps Matter for Accurate Analysis
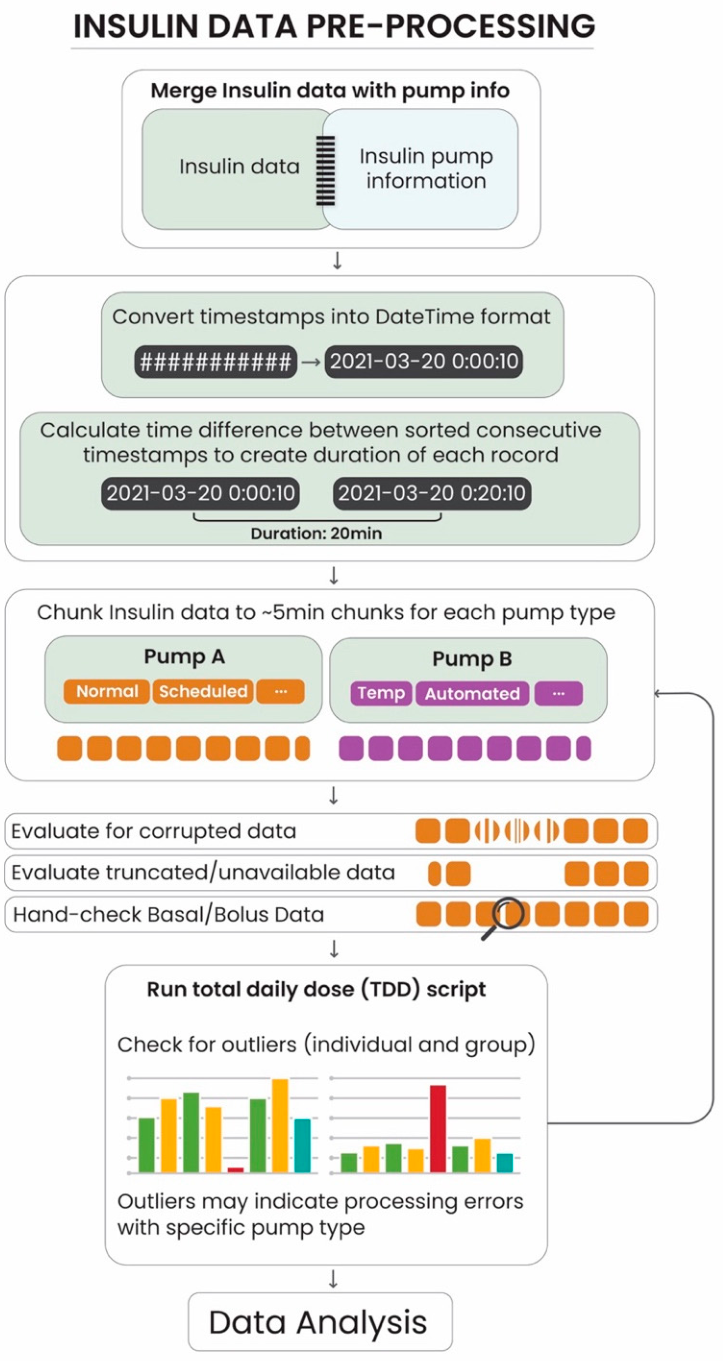
Collectively, this pre-processing of insulin records (illustrated in Figure 2) down to more precise ~5 minute intervals, along with the netIOB code taking into account duration of insulin activity, will allow for the better understanding of insulin activity over time with more accuracy as a result of the different combination of basal and bolus deliveries instigated both by the user and the AID system.
3. Implications and Tips for Other Researchers Leveraging the T1DEXI Datasets or Other Large Health Datasets for Temporal Analysis
We have provided open-source processing scripts, which are available here[6] to make our code for pre-processing the data available to other researchers (including individual citizen scientists) who are accessing the T1DEXI datasets (broken into adult and pediatric datasets). These scripts provide for an updated netIOB assessment that supports commercial AID systems, adding to the existing open-source AID systems that already by default leverage netIOB for user-facing needs and retrospective analysis.
Researchers should be aware of the nuances of the data described in the previous sections when they approach analyzing this dataset, as these are currently attempted to be resolved for in our code and we wish others to not have to reinvent the wheel on debugging these errors and generate inaccurate assumptions about insulin delivery. These also apply to other diabetes datasets.
An example checklist of areas to watch for when analyzing and using diabetes-related datasets with insulin delivery include:
- Using the rate with the blank variable attribute of insulin type instead of the amount delivered with scheduled/temp/automated every 5 min may result in inaccurate recalculations of insulin delivery.
- Not looking at the difference between timestamps to see when there are gaps and/or ignoring the duration variable.
- Not calculating the insulin delivered in manual mode, correctly spread over the duration for when this insulin delivery occurred.
- Not calculating the timing impact of dual/square or square wave boluses over time, similar to the above, correctly spreading the insulin dosing over the indicated duration, which likely has a large effect on gross/traditional IOB as well as netIOB.
- Possibly replacing instead of adding dual/square or square calculated insulin over additional basal insulin delivery during the square wave window if attempting to spread out the dual/square or square wave insulin activity.
- Be aware that some AID system types record insulin delivered as bolus (e.g. 770G) segmented over the hours of time that also have the default basal rate indicated. Amounts do not necessarily add up to the basal expected to be delivered, for example when the user is experiencing hyperglycemia, additional insulin to correct has been delivered and thus these amounts do not add up to the basal amount indicated for the duration. Thus, the basal flow rate and/or basal amount as baseline during that time period can be used as a reference but not as a definitive record of how much insulin was delivered for any time period.
- Cross-check device categorization as AID/non-AID based on actual insulin delivery patterns, as some AID system users may use their system in manual mode for a majority of time, influencing outcomes in sub-group analyses. For example, someone with a device labeled as an insulin pump when it has auto-mode or other automation features and is used with automated insulin delivery should instead be re-categorized into a closed loop or AID system group, as they are using AID therapy for the majority of their insulin delivery.
- Determine whether systems with partial automation features such as predictive low glucose suspend (PLGS) or low glucose suspend (LGS) are categorized as manual insulin pump; automated insulin delivery systems; or if they warrant, depending on the analysis, their own category.
- Be aware that converting the T1DEXI dataset to CSV may result in errors related to the date in the timestamp if the data is originally pre-processed as having / in the dates rather than “-“ as date separators. This may be a non-issue for some teams who do not convert the data to CSV but is worth mentioning that conversion across formats can result in oddities related to date, even after the date/time is converted from the original epoch in T1DEXI.
4. Conclusions
Datasets such as the T1DEXI dataset provide a wealth of data for diabetes research. However, like any dataset, attention must be paid to the underlying structure of the data. As it relates to insulin delivery, pre-processing should be used to make sure that insulin delivery is uniformly analyzed down to 5-minute intervals so that all insulin delivery event types, whether those be manual up-front boluses; basal or temporary basal rates; and extended bolus events (such as square or dual/square wave boluses) and suspend events are correctly documented as a timeseries such that subsequent analysis will be accurate based on the duration of insulin activity. Open-source code can aid any researcher interested in using the T1DEXI dataset, and this code can also be extrapolated to analyze these core device types in other diabetes datasets, which likely have similar data recording oddities that need addressing.
We encourage other researchers to similarly share their code open source to benefit and expedite the work of all diabetes researchers, which ultimately expedites the insights and solutions available to improve the lives of people living with diabetes worldwide.
Author Contributions
Conceptualization, A.Z., A.So., D.M.L., A.Sh.; methodology, A.Z., A.So., D.M.L., A.Sh.; software, A.Z., A.So., D.M.L., A.Sh.; validation, A.Z., A.So., D.M.L., A.Sh.; formal analysis, A.Z., A.So., D.M.L., A.Sh.; investigation, D.M.L. and A.Sh.; resources, D.M.L. and A.Sh.; data curation, A.Z., A.So., D.M.L., A.Sh.; writing—original draft preparation, A.Z., D.M.L., A.Sh.; writing—review and editing, A.Z., A.So., D.M.L., A.Sh.; visualization, A.Z., A.So., D.M.L., A.Sh.; supervision, D.M.L. and A.Sh.; project administration, A.Sh.; funding acquisition, D.M.L., A.Sh., R.L., D.P.Z. All authors have read and agreed to the published version of the manuscript.
Funding
This work was performed under a grant from The Leona M. and Harry B. Helmsley Charitable Trust (Grant #: 2407-07175).
Institutional Review Board Statement
Ethics approval is granted by UCD’s Human Research Ethics Committee – Sciences (HREC-LS) with reference number LS-LRSD-23-264-Shahid which meets the criteria for a low-risk study involving secondary data.
Informed Consent Statement
Not applicable.
Data Availability Statement
All programming scripts and tools developed for the analysis in this paper are made public and online, cited within the manuscript. All data comes from the T1DEXI dataset, available on the Vivli Platform Repository (ID: T1-DEXI; dataset name: Type 1 Diabetes EXercise Initiative (T1DEXI): The Effect of Exercise on Glycemic Control in Type 1 Diabetes Study; https://doi.org/10.25934/PR00008428). The data package can be requested at https://doi.org/10.25934/PR00008428.1.
Conflicts of Interest
All authors declare no financial conflict of interest. The funders had no role in the design of the study; in the analyses, or interpretation of data; in the writing of the manuscript; or in the decision to publish the results.
Abbreviations
The following abbreviations are used in this manuscript:
| T1D | Type 1 Diabetes |
| T1DEXI | Type 1 Diabetes Exercise Initiative |
| netIOB | Net insulin on board |
| IOB | Insulin on board (traditionally bolus-only) |
| CGM | Continuous glucose monitor |
| AID | Automated Insulin Delivery |
| OSAID | Open Source Automated Insulin Delivery |
| PLGS | Predictive Low Glucose Suspend |
| LGS | Low Glucose Suspend |
| LGS | Low Glucose Suspend |
References
- Riddell MC, Li Z, Gal RL, et al. Examining the Acute Glycemic Effects of Different Types of Structured Exercise Sessions in Type 1 Diabetes in a Real-World Setting: The Type 1 Diabetes and Exercise Initiative (T1DEXI). Diabetes Care 2023; 46: 704–713.
- Bergford S, Riddell MC, Jacobs PG, et al. The Type 1 Diabetes and EXercise Initiative: Predicting Hypoglycemia Risk During Exercise for Participants with Type 1 Diabetes Using Repeated Measures Random Forest. Diabetes Technol Ther 2023; 25: 602–611.
- Moser O, Zaharieva DP, Adolfsson P, et al. The use of automated insulin delivery around physical activity and exercise in type 1 diabetes: a position statement of the European Association for the Study of Diabetes (EASD) and the International Society for Pediatric and Adolescent Diabetes (ISPAD). Diabetologia 2025; 68: 255–280.
- Turner L V, Marak MC, Gal RL, et al. Associations between daily step count classifications and continuous glucose monitoring metrics in adults with type 1 diabetes: analysis of the Type 1 Diabetes Exercise Initiative (T1DEXI) cohort. Diabetologia 2024; 67: 1009–1022.
- Shahid A, Lewis DM. Large-Scale Data Analysis for Glucose Variability Outcomes with Open-Source Automated Insulin Delivery Systems. Nutrients 2022; 14: 1906.
- Zafar A, Solanke A, Lewis DM, et al. netIOB. https://gitlab.com/CeADARIreland_Public/netiob (2024, accessed 13 April 2025).
- Riddell MC, Lewis DM, Turner L V, et al. Refining Insulin on Board with netIOB for Automated Insulin Delivery. J Diabetes Sci Technol 2024; 19322968241267820.
Figure 2.
Pipeline for merging, cleaning and 5-minute chunking of insulin pump data prior to total daily dose analysis.
Figure 2.
Pipeline for merging, cleaning and 5-minute chunking of insulin pump data prior to total daily dose analysis.
Disclaimer/Publisher’s Note: The statements, opinions and data contained in all publications are solely those of the individual author(s) and contributor(s) and not of MDPI and/or the editor(s). MDPI and/or the editor(s) disclaim responsibility for any injury to people or property resulting from any ideas, methods, instructions or products referred to in the content. |
© 2026 by the authors. Licensee MDPI, Basel, Switzerland. This article is an open access article distributed under the terms and conditions of the Creative Commons Attribution (CC BY) license (http://creativecommons.org/licenses/by/4.0/).
Copyright: This open access article is published under a Creative Commons CC BY 4.0 license, which permit the free download, distribution, and reuse, provided that the author and preprint are cited in any reuse.