

Submitted:
07 July 2026
Posted:
08 July 2026
You are already at the latest version
Abstract
Background/Objectives:Whole-genome duplication (WGD) and transposed duplication (TRD) are two principal evolutionary drivers of plant genome expansion, yet the molecular mechanisms underlying their divergent co-expression patterns remain poorly characterized. Methods:Integrating transcriptomic profiling, ATAC-seq, H3K27ac ChIP-seq, whole-genome bisulfite sequencing (WGBS), and SNP data, we performed a multi-layered analysis of co-expression divergence across 4,071 WGD and 10,174 TRD gene pairs in tea plant (Camellia sinensis). Results:WGD gene pairs exhibited significantly higher co-expression rates (44.3%) than TRD pairs (33.0%), with gene length and sequence similarity exerting synergistic threshold effects on co-expression maintenance. Chromatin accessibility and H3K27ac modification cooperatively promoted co-expression in both duplicate classes; however, TRD gene expression remained systematically attenuated under equivalent chromatin accessibility conditions, attributable to coordinated CG, CHG, and CHH methylation collectively establishing a persistent epigenetic repression barrier. Promoter-proximal SNPs exerted disproportionately disruptive effects on TRD co-expression, demonstrating that genetic variation and epigenetic repression synergistically amplify transcriptional divergence. Weighted gene co-expression network analysis (WGCNA) revealed that WGD genes promote non-esterified catechin accumulation (EC, GC, EGC) via conserved MYB–bHLH–ERF networks, whereas TRD genes regulate esterified catechin biosynthesis (EGCG, ECG) through M-type MADS-box, WOX, and bZIP transcription factors. Conclusions:This study systematically elucidates the hierarchical regulatory mechanisms governing duplicate gene co-expression divergence in tea plant, providing mechanistic insights into catechin metabolic regulation and candidate targets for metabolite-directed breeding.
Keywords:
whole-genome duplication
; transposed duplication
; epigenetics
; chromatin accessibility
; DNA methylation
; transcription factors
; catechins
# These authors contributed equally to this work.
1. Introduction
Gene duplication is one of the most important mechanisms driving plant genome expansion and the evolution of novel biological functions[1,2]. Whole-genome duplication (WGD) simultaneously produces copies of all genes through genome-wide polyploidization, and approximately 75% of angiosperm species have ancestral WGD events in their evolutionary history[3,4]. Transposed duplication (TRD), by contrast, relocates parental genes to new genomic positions via RNA-mediated retroposition or DNA-mediated transposition, generating gene pairs consisting of ancestral loci and new insertion sites[5,6]. These two duplication modes differ fundamentally in their genomic positional effects: WGD-retained copies reside within the same chromatin topological environment as their parental genes and are subject to strong dosage balance constraints [7], whereas TRD copies are "transplanted" to entirely new genomic locations, disengaging from the ancestral cis-regulatory landscape and acquiring the structural basis for expression divergence. Comparative studies in Arabidopsis thaliana and Oryza sativa have demonstrated that WGD genes generally exhibit higher conservation in expression levels and patterns than TRD genes[8,9]; however, the molecular mechanisms driving the divergent co-expression fates of these two duplicate types—specifically how chromatin accessibility, DNA methylation, and genetic variation act cooperatively—have not been systematically elucidated in polyploid crop genomes.
Tea plant (Camellia sinensis) leaves are the raw material for the most widely consumed non-alcoholic beverage worldwide [10]. The catechin compounds enriched in tea leaves (comprising 18%–36% of dry weight) not only impart the distinctive flavor of tea but also confer significant health-promoting effects, including antioxidant activity [11,12]. Multiple high-quality chromosome-level genome assemblies of tea plant cultivars have been released in recent years, including C. sinensis var. assamica (CSA, YK10), C. sinensis var. sinensis (CSS, Shuchazao, Biyun, Longjing 43, Tieguanyin, Huangdan), and ancient tea trees (DASZ). Genomic analyses have indicated that tea plant underwent a WGD event approximately 30–40 million years ago [13,14], and the genome harbors abundant TRD genes [15]. The co-occurrence of ancient WGD and active TRD events in tea plant, combined with deeply characterized catechin metabolic pathways, quantifiable phenotypes, and publicly available multi-tissue transcriptomic, epigenomic, and three-dimensional genomic datasets [16], makes tea plant an ideal system for systematically dissecting the differential regulatory mechanisms of these two duplicate gene types.
Chromatin accessibility profiled by ATAC-seq marks open regulatory regions accessible to transcription factors across the genome[17];H3K27ac acetylation modification serves as a molecular signature of active enhancers and promoters [18]; and DNA methylation in CG, CHG, and CHH sequence contexts plays critical roles in transposable element silencing and gene expression repression in plants [19]. Whether these regulatory layers act in a differential manner on WGD versus TRD duplicate genes constitutes a key scientific question for understanding the divergence of duplicate gene transcriptional fates—a question that has yet to receive a systematic answer in the literature.
Using the YK10 tea plant genome as a research framework and integrating transcriptomic, ATAC-seq, H3K27ac ChIP-seq, whole-genome bisulfite sequencing (WGBS), and SNP data, the present study aims to address the following core scientific questions: (1) What are the differences in genome-wide co-expression rates between WGD and TRD gene pairs in Camellia sinensis? (2) What structural, epigenetic, and genetic factors drive the divergent co-expression patterns between WGD and TRD gene pairs—specifically, how do gene length, sequence similarity, chromatin accessibility, DNA methylation, and promoter-region SNPs act individually and cooperatively to determine co-expression fates? (3) Through what differential transcription factor regulatory networks do the two duplicate gene types cooperatively drive diversified catechin accumulation? The results of this study will provide new mechanistic insights into the evolutionary dynamics of duplicate genes in plants and offer candidate molecular targets for tea plant catechin quality improvement.
2. Materials and Methods
2.1. Identification of Wgd and Trd Gene Pairs
Camellia sinensis (YK10) was used as the research subject. Duplicate gene identification and classification followed the methodology proposed by Qiao et al. [20]. Amborella trichopoda was used as an outgroup to identify duplicate genes derived from different duplication events, including whole-genome duplication (WGD), transposed duplication (TRD), proximal duplication (PD), tandem duplication (TD), and dispersed duplication (DSD) (Tables S1, S2).
2.2. Quality Control and Processing of Multi-Omics Data
All datasets used in this study were obtained from public databases (see Data Availability Statement) and evaluated for quality and reliability using multiple approaches. First, RNA-seq data quality was assessed using FastQC, followed by filtering and trimming with fastp using default parameters [21]. Clean reads were aligned to the YK10 reference genome using HISAT2 [22], and gene-level quantification was performed using featureCounts [23]. Gene expression levels were normalized using the TPM method. The processed RNA-seq data exhibited high alignment rates and uniform coverage, indicating accurate transcript quantification. Second, ATAC-seq and H3K27ac ChIP-seq datasets were quality-checked using FastQC and fastp [21]. Clean reads were aligned to the YK10 genome using Bowtie2 [24], and low-quality alignments (Q < 10) were removed using SAMtools [25]. Duplicate reads were filtered with Picard, and peak calling was performed using MACS2 [26]. Peak reproducibility across biological replicates was evaluated with DeepTools, and peaks were successfully annotated to duplicate genes using BEDTools [27], confirming the reliability of chromatin accessibility and histone modification datasets. Third, WGBS raw data were filtered with fastp, reads were aligned to the YK10 genome using the BatMeth2 pipeline [28], and 5-methylcytosine (5mC) sites were identified with methylation levels calculated. Bigwig files were generated using batmeth2_to_bigwig.py, and methylation levels upstream and downstream of peaks were computed with methyGff. Finally, promoter regions (2 kb upstream of the transcription start site) were submitted to the PlantCARE database for cis-regulatory element identification, and transcription factors were predicted using PlantTFDB v5.0 (Table S4) [29,30]. GO annotation was obtained using the eggNOG-mapper database [31].
2.3. Randomization Test
A simulation study was performed using the R programming language based on the complete YK10 genome. In each iteration, two genes were randomly selected from the gene category and their Pearson correlation coefficient was calculated from TPM values. The number of gene pairs sampled in each simulation corresponded to the number of duplicate gene pairs within each length category. The proportion of co-expressed gene pairs (gene pairs with Pearson r > 0.5 were defined as co-expressed, and the remainder were classified as non-co-expressed) was recorded per run. This process was repeated 100,000 times, and the frequency distribution of co-expression proportions across all iterations was subsequently analyzed.
2.4. Weighted Gene Co-Expression Network Construction
Weighted gene co-expression networks were constructed using the WGCNA R package (v4.3.2). To avoid redundancy, a non-overlapping gene set was used: after removing genes appearing in multiple pairs, 7,313 independent WGD genes and 14,285 TRD genes were retained for network construction, along with six catechin accumulation levels [14,32]. Signed networks were constructed based on Pearson correlation coefficients. The soft-thresholding power was set to 14, the minimum module size to 30, and the module merging threshold to 0.25, with other parameters at default settings. Network modules were visualized using Cytoscape (v3.9.0).
2.5. Statistical Analysis
All statistical analyses were performed in R (v4.3.2). Differences between two independent samples were assessed using the Mann-Whitney U test (wilcox.test function). All tests were two-sided with a significance threshold of P < 0.05. Bootstrap resampling was used to robustly estimate error bars for proportions in bar charts. Specifically, for each group of binary observations, 1,000 bootstrap iterations with replacement were performed, each generating a bootstrap sample of the same size as the original dataset. The proportion of positive cases was calculated for each resampled dataset, and the standard deviation of these 1,000 proportions was used as the standard error for constructing error bars in figures.
3. Results
3.1. Wgd and Trd Genes Display Markedly Different Co-Expression Patterns
To systematically characterize the expression patterns and functional divergence of WGD and TRD gene pairs during tea plant development, we performed expression clustering analyses for both gene types based on transcriptomic data from eight tissues. Both gene types were partitioned into four clusters with distinct expression profiles (Figure 1a,b), indicating significant tissue-specific expression divergence in both WGD and TRD genes. A substantial proportion of gene pairs within the same cluster displayed coordinated high expression, suggesting shared transcriptional regulatory mechanisms. At the overall co-expression level, WGD gene pairs (44.3%) showed significantly higher co-expression rates than TRD gene pairs (33.0%; Mann-Whitney U test, p < 0.001; Figure 1c), indicating stronger expression coordination between WGD duplicate copies. Within individual clusters, the co-expression rates of WGD gene pairs (46.94%, 45.45%, 28.76%, and 43.84% for Clusters 1-4, respectively) were consistently higher than the corresponding TRD values (34.76%, 25.31%, 35.82%, and 34.12%). The proportion of WGD gene pairs exhibiting expression divergence (fold change ≥ 2) across tissues (42.94%–56.77%; mean 51.3%) was also lower than that of TRD gene pairs (58.50%–65.74%; mean 65.5%; Figure S1a,b), further supporting the stronger expression divergence tendency in TRD duplicate copies.
GO enrichment analysis revealed systematic differences in functional specialization between the two duplicate gene types (Figure 1d,e). WGD duplicate genes were primarily enriched in photosynthetic systems and core metabolism: Cluster 1 was significantly enriched in thylakoid membrane, chloroplast thylakoid, and other photosynthetic components, and at the molecular function level in transition metal ion binding, iron-sulfur cluster binding, and ribosomal structural constituents, suggesting central roles in light energy capture, electron transfer, and protein synthesis; Clusters 2 and 3 were co-enriched in primary metabolic processes, protein metabolic regulation, and organic nitrogen compound metabolism, with protein binding and signal receptor binding as primary molecular functions; Cluster 4 was specifically enriched in dephosphorylation, plant-type cell wall modification, and pyrophosphatase activity, indicating key roles in phosphorylation signaling and cell wall remodeling. In contrast, TRD duplicate genes exhibited more pronounced functional specialization while retaining partial core metabolic functions: Cluster 1 was specifically enriched in long-chain fatty acid metabolism and organic phosphate metabolism; Cluster 2 was enriched in morphogenesis regulation and mRNA binding, reflecting dual roles in organogenesis and post-transcriptional regulation; Cluster 3 was primarily enriched in broad membrane system components including membrane-bounded organelles; most notably, Cluster 4 was highly specifically enriched in phosphatidylinositol-3,4,5-trisphosphate 5-phosphatase, phosphatidylinositol-4,5-bisphosphate phosphatase, and trehalose phosphatase activities—functional categories entirely absent from WGD duplicate genes—indicating significant neofunctionalization of TRD duplicates through the phosphatidylinositol signaling pathway. Overall, WGD genes tend to maintain conserved co-expression associated with core cellular functions, whereas TRD genes undergo greater functional specialization and expression divergence.
3.2. Gene Length Is Negatively Correlated with Co-Expression
We first calculated Pearson correlation coefficients between gene pairs and their average gene lengths to investigate factors influencing the divergent co-expression of the two gene types. The analysis revealed a slight negative correlation trend between gene length and co-expression strength (Figure S1c,d).
Length distribution analysis showed that TRD genes had a slightly higher distribution peak than WGD genes (Figure S2a), indicating that TRD genes tend to have longer gene bodies overall. To further evaluate the effect of gene length on co-expression patterns, all gene pairs were classified into three groups based on average length: short (≤ 4 kb; WGD: n = 1,285, TRD: n = 2,746), medium (4–8 kb; WGD: n = 1,504, TRD: n = 3,893), and long (≥ 8 kb; WGD: n = 1,282, TRD: n = 3,535). Co-expression rates were inversely related to gene length. Specifically, the co-expression rates of WGD gene pairs decreased progressively along the length gradient: short (51.4%) > medium (42.6%) > long (39.3%); TRD gene pairs showed a similar trend: short (38.0%) > medium (31.9%) > long (30.4%); these differences were statistically significant (Mann-Whitney U test, p < 0.05; Figure 2a,b). Notably, WGD co-expression rates exceeded TRD rates in all length categories. To determine whether these observations could be attributed to random factors, a randomization test was performed in which the same number of gene pairs were randomly sampled and co-expression rates calculated, repeated 100,000 times. Co-expression rate frequencies in the randomized groups were markedly lower than those observed empirically (Mann-Whitney U test, p < 2.2 × 10⁻¹⁶; Figure 2c,d), confirming that the length effect on co-expression represents a genuine biological phenomenon rather than sampling bias.
3.3. Sequence Similarity Is Negatively Correlated with Expression Divergence
To elucidate the role of sequence similarity in regulating co-expression of gene pairs, we calculated BLAST-based sequence identity percentages for all WGD and TRD gene pairs. Density distribution analysis of BLAST similarity revealed fundamentally different distribution patterns between the two gene types (Figure 3a). WGD gene pairs showed a relatively concentrated distribution in the 70%–90% similarity range with a unimodal distribution, whereas TRD gene pairs exhibited a broader distribution (40%–100%) with a relatively flat profile. Association analysis with expression divergence revealed a pronounced non-linear relationship between BLAST similarity and expression divergence: across the entire similarity range (30%–100%), both gene types displayed a similar basic trend of slightly decreasing expression divergence with increasing BLAST similarity (Figure 3b).
The most biologically significant finding was that when BLAST similarity exceeded 90% combined with gene length below 4 kb, a significant and synergistic enhancement of co-expression rates was observed in both gene types (Figure 3c,d). Quantitatively, among WGD gene pairs, those with high similarity (>90%) and short genes (<4 kb) had a co-expression rate of 54.0%, representing a 2.6 percentage point increase over all high-similarity gene pairs (51.4%). Among TRD gene pairs, the corresponding group showed a co-expression rate of 47.1%, an increase of 1.8 percentage points over all high-similarity TRD pairs (45.3%). Most notably, the “high similarity + short gene” group for WGD (54.0%) was significantly higher than the corresponding TRD group (47.1%), with a difference of 7.0 percentage points (Mann-Whitney U test, p < 0.001). This threshold effect indicates that sequence similarity and gene length exert synergistic constraints on co-expression, and this synergistic effect is more pronounced in WGD genes. These findings suggest that a “dual gatekeeping” mechanism may govern co-expression maintenance: high sequence conservation ensures functional constraint (i.e., both copies still perform similar biochemical functions under similar selection pressure), while shorter gene body length reduces the probability of introducing transcriptional noise during elongation—both conditions are necessary.
3.4. Atac-Seq and H3k27ac Peaks Enhance Transcriptional Expression and Co-Expression of Duplicate Genes
Given that non-coding intergenic regions are enriched with diverse transcriptional regulatory elements, genome-wide analysis of these elements is essential for understanding their effects on transcriptional activity. Publicly available ATAC-seq and H3K27ac ChIP-seq raw datasets from recent studies were processed (see Section 2). Peaks in both datasets were identified using MACS2, and only peaks reproducibly detected across biological replicates were retained (Figure S2b).
To investigate whether the presence of ATAC-seq or H3K27ac peaks correlates with elevated gene expression, both gene types were annotated with ATAC-seq and H3K27ac signals. WGD and TRD genes with ATAC peaks both showed significantly elevated expression levels. WGD genes with ATAC peaks displayed a median expression value of 4.05 [log₂(TPM+1)], substantially higher than genes without peaks (2.39). Similarly, TRD genes with ATAC peaks showed a median expression of 3.54 versus 2.34 for those without peaks (Figure 4a). Critically, the presence of accessible chromatin not only enhanced gene expression but also increased co-expression rates between duplicate gene pairs. Among WGD gene pairs, those in which both genes contained ATAC peaks showed a co-expression rate of 55.1%, significantly higher than pairs without ATAC peaks (43.8%). The same pattern was observed in TRD genes, with ATAC peak-positive pairs reaching 43.2% co-expression versus 32.5% for ATAC peak-negative pairs (Mann-Whitney U test, p < 0.001; Figure 4b).
To further validate these findings, we examined H3K27ac modification. Consistent with ATAC-seq results, gene pairs with H3K27ac marks showed higher expression levels (WGD: 3.77 vs. 2.20; TRD: 3.62 vs. 2.13; Figure 4c) and higher co-expression rates (Figure 4d). These results indicate that open chromatin and active histone modifications cooperatively promote coordinated expression of duplicate gene pairs, and this regulatory effect is more pronounced in WGD genes than TRD genes, suggesting that WGD genes may possess more complete cis-regulatory networks for maintaining co-expression.
3.5. Dna Methylation Displays Distinct Patterns in Wgd and Trd Genes
To dissect the epigenetic basis of expression differences between WGD and TRD genes, we systematically analyzed three types of DNA methylation levels, gene density, and repetitive element density across all 15 chromosomes of the tea plant genome using 1-Mb windows. The genome-wide methylation map showed significantly elevated methylation in regions with high repetitive element density, whereas gene-enriched regions exhibited relatively lower methylation levels (Figure 5a). Chromosomal distribution analysis indicated that WGD genes tend to cluster in gene-dense regions of chromosome arms, while TRD genes are more dispersedly distributed.
Methylation comparisons across gene bodies and flanking regions revealed that TRD genes had higher methylation levels in all three contexts than WGD genes. Both gene types showed methylation troughs around the TSS and TTS with the lowest methylation in gene bodies (Figure 5b). Notably, in contrast to the pattern of CG and CHG methylation gradually decreasing from flanking regions toward the TSS, CHH methylation displayed the opposite trend—rising markedly from flanking regions toward the TSS - revealing a unique epigenetic feature of CHH islands in tea plant gene flanking regions. To our knowledge, this characteristic is rarely reported in plant genome methylation studies, suggesting that tea plant may have evolved a specialized RNA-directed DNA methylation (RdDM) targeting mechanism for gene boundary regions, warranting further investigation.
Stratified analysis dividing genes into low, medium, and high expression groups further revealed dynamic methylation regulatory patterns. In the low-expression group, TRD gene CG and CHG methylation were markedly higher than WGD; as expression levels increased, the inter-group differences in non-CG methylation progressively narrowed, while the differential repression of TRD genes by CG methylation persisted; in the high-expression group, CHG and CHH methylation converged, but TRD gene CG methylation remained at relatively elevated levels. This demonstrates that CG methylation constitutes the most persistent epigenetic barrier to TRD gene expression repression, most resistant to reversal by transcriptional activation signals.
In summary, WGD genes are in an epigenetically open state with low levels of all three methylation modifications, favoring stable high-level transcription, whereas TRD genes suffer cooperative repression by triple CG, CHG, and CHH methylation, highly complementary to chromatin accessibility analysis results, collectively constituting the core epigenetic regulatory axis driving expression divergence between WGD and TRD genes in tea plant.
3.6. Acr Number Regulates Expression of Wgd and Trd Genes
To investigate the differential effects of accessible chromatin region (ACR) number on expression regulation of WGD and TRD genes, we systematically analyzed the correlation between ACR number in gene bodies and promoter regions and gene expression levels. Using log₂(TPM+1) as the expression metric, expression levels in both WGD and TRD genes increased significantly with increasing ACR number in gene bodies and promoters (Figure 6a,b), consistent with the classical regulatory model that open chromatin facilitates transcription factor binding and drives gene expression. Further comparison of expression differences between WGD and TRD genes under equivalent ACR numbers revealed significantly different regulatory patterns. When gene body ACR number was 0, TRD gene expression (2.09) was significantly lower than WGD gene expression (2.22); when gene body ACR number increased to 1 or 2, TRD gene expression remained significantly lower than WGD, suggesting that WGD genes exhibit higher basal transcriptional activity under equivalent chromatin accessibility. Similar patterns were observed in promoter ACR analyses (Mann-Whitney U test, p < 0.001; Figure 6c,d). This systematic expression difference between TRD and WGD genes under equivalent chromatin accessibility conditions can be fundamentally attributed to the residual CG methylation maintained in TRD genes - even when chromatin accessibility converges, persistent CG methylation continues to suppress TRD gene transcription.
3.7. Differential Effects of Snp Variation on Wgd and Trd Gene Expression and Co-Expression
To systematically evaluate the contribution of SNP variation to regulatory divergence between WGD and TRD genes, we conducted a comprehensive analysis of genome-wide SNP distribution patterns and their effects on gene expression and co-expression. Heatmap visualization showed significant regional heterogeneity in SNP distribution across the 15 tea plant chromosomes, with high-density regions primarily concentrated in the mid-arms and some terminal regions of chromosomes, while pericentromeric regions showed relatively low density (Figure 7a), consistent with the general pattern of low recombination rates and high sequence conservation in plant genome centromeric regions.
Gene pairs were categorized into gene body SNP and promoter SNP groups (Figure 7b). Expression level comparisons revealed that in both WGD and TRD genes, the median expression values of the SNP-free groups (WGD: 2.49; TRD: 2.42) were significantly higher than those of SNP-containing groups (WGD: 2.29; TRD: 2.22), with the repressive effect of SNPs on expression significantly stronger in TRD genes than WGD genes (Figure 7c,d). In co-expression rate analyses, among all gene pairs containing SNPs, WGD gene pairs maintained a co-expression rate (40.5%) significantly higher than TRD (31.1%), with a difference of 9.4 percentage points (Figure 7e), indicating that WGD gene pairs retain a higher degree of coordinated expression even under sequence variation. Among gene pairs with promoter SNPs, the co-expression rates of both WGD (14.9%) and TRD (9.9%) dropped substantially compared to pairs with all SNP types (Figure 7f), revealing that promoter-region SNPs exert particularly disruptive effects on coordinated gene pair expression. In conclusion, SNP variation—particularly in promoter regions—is a key genetic factor driving duplicate gene expression divergence and co-expression network remodeling, with effects more pronounced in TRD genes.
3.8 Weighted Gene Co-Expression Network Analysis Reveals Tissue-Specific Modules
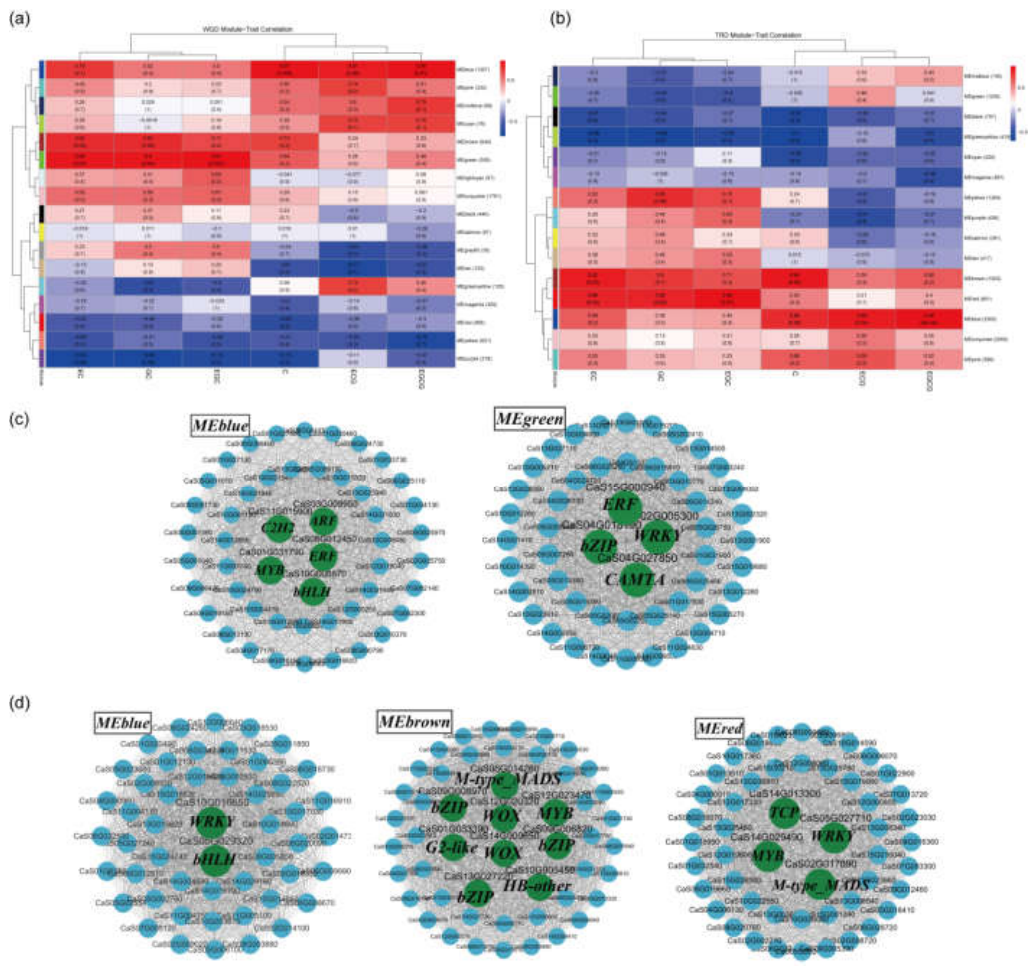
Weighted gene co-expression network analysis (WGCNA) is a highly robust method for classifying genes through hierarchical clustering of gene co-expression networks. To investigate the functional contributions of both duplicate gene types to catechin metabolic regulation, we constructed separate weighted co-expression networks for WGD and TRD genes and correlated module eigengenes with catechin accumulation levels (Figure S2c,d). A total of 17 modules were identified from WGD genes, of which two were highly correlated with metabolites (r ≥ 0.9, p < 0.05). Specifically, the MEblue module contained 1,357 genes and was highly significantly positively correlated with epigallocatechin gallate (EGCG) and catechin (C). The MEgreen module contained 559 genes (7.6%) and was significantly positively correlated with epigallocatechin (EGC), epicatechin (EC), and gallocatechin (GC) (Figure 8b, left). WGCNA analysis of TRD genes identified 15 modules, of which three were highly correlated with metabolites (r ≥ 0.8, p < 0.05). The MEbrown module contained 1,933 genes (13.5%) and was significantly positively correlated with epicatechin (EC) and catechin (C). The MEred module contained 801 genes (5.6%) and was highly significantly positively correlated with epigallocatechin (EGC). The MEblue module contained 2,300 genes (16.1%) and was highly significantly positively correlated with both EGCG and epicatechin gallate (ECG) (Figure 8b, right), suggesting that these gene networks share similar regulatory features involved in catechin biosynthesis.
Hub genes within modules are generally considered to represent the biological function of those modules. We therefore constructed co-expression networks based on the 50 genes with the highest module membership values (KME, connectivity based on key module eigengenes) in each of the five modules, with transcription factors (TFs) selected as key hub genes. Five TFs were identified in the WGD MEblue module: C2H2, ARF, ERF, MYB, and bHLH; four TFs were identified in the MEgreen module: ERF, bZIP, WRKY, and CAMTA (Figure 8c). These TFs are highly co-expressed with catechin accumulation modules, suggesting they may serve as candidate regulatory factors in catechin biosynthesis, though their specific regulatory relationships await functional experimental validation. The TRD hub gene network revealed WRKY and bHLH in the MEblue module, potentially cooperatively regulating EGCG and ECG accumulation; the MEbrown module was enriched with multiple TF families including M-type MADS, bZIP, MYB, G2-like, WOX, and HB-other, representing the most complex regulatory network composition; the MEred module contained four TFs: TCP, WRKY, MYB, and M-type MADS (Figure 8d). Most notably, M-type
MADS-box transcription factors have previously been reported primarily in floral organ development and endosperm function; their potential role in catechin biosynthesis regulation has not been systematically reported and represents one of the most exploration-worthy novel findings of this study, awaiting validation through EMSA, yeast one-hybrid, and genetic transformation approaches. Taken together, WGD key modules were primarily associated with simple catechin (EC, GC, EGC) accumulation, while TRD key modules showed stronger associations with esterified catechins (ECG, EGCG), revealing the evolutionary mechanism by which WGD and TRD duplicate genes cooperatively drive diversified catechin accumulation through differential transcriptional regulatory networks.
4. Discussion
4.1. Do the Regulatory Factors Underlying Divergent Co-Expression Directly Drive Functional Differentiation of Wgd and Trd Genes?
A deeper question underlying our multi-layered findings is whether the structural, epigenetic, and genetic regulatory differences identified here simultaneously drive functional divergence between WGD and TRD gene pairs. Converging lines of evidence suggest these two processes are intimately linked. By integrating transcriptomic and methylomic datasets, Chen et al. directly demonstrated that CG and CHH methylation levels at CsLAR and CsSCPL1A loci are highly concordant with stage-specific transcript abundance across leaf developmental stages and significantly correlated with the accumulation of corresponding catechin monomers [33], indicating that methylation-driven expression divergence directly shapes the partitioning of metabolic flux through the catechin biosynthetic pathway. From an evolutionary perspective, WGD gene pairs are subject to strong dosage-balance constraints that favor expression conservation and functional redundancy, whereas TRD copies, having been transposed to novel genomic loci, disengage from their ancestral cis-regulatory landscapes and thereby acquire the structural prerequisite for accelerated functional divergence [34]. Studies of WGD duplicate gene pairs in soybean further demonstrate that gain or loss of flanking regulatory sequences constitutes the primary driver of transcriptional divergence [35], and recent analyses of allotetraploid cotton confirm that subgenome asymmetries in chromatin accessibility directly determine homeolog expression bias, establishing chromatin structural dynamics as a central determinant of cis-regulatory landscape evolution and duplicate gene expression divergence in polyploids [36]. Future experiments employing CRISPR-dCas9 - mediated targeted demethylation at the promoter of the CsLAR-TRD copy will provide a direct causal test of whether methylation-driven expression suppression is sufficient to drive functional fate transition.
4.2. Putative Mechanisms by Which M-Type Mads-Box and Wox Transcription Factors Regulate Esterified Catechin Biosynthesis
WGCNA identified enrichment of M-type MADS-box and WOX transcription factors in TRD co-expression modules that are strongly correlated with EGCG and ECG accumulation. M-type MADS-domain proteins have conventionally been regarded as regulators of gametophyte development and reproductive organ specification , with roles in plant secondary metabolism rarely documented[37]. Nevertheless, HbMADS4 in Hevea brasiliensis has been shown to negatively regulate the rubber particle protein gene HbSRPP [38], and MIKC*-type MADS-box genes have been implicated in the transcriptional regulation of carotenoid accumulation in fruit [39], collectively suggesting that the functional repertoire of the MADS family in specialized metabolism warrants substantial re-evaluation. In Camellia sinensis, the galloylation of catechin precursors to yield EGCG and ECG is catalyzed by a two-component system comprising the acyltransferase CsSCPL4 and its non-catalytic chaperone paralog CsSCPL5 [40], and amino acid variation within the catalytic triad has been shown to directly determine EGCG yield [41]. We therefore hypothesize that M-type MADS-box or WOX factors enriched in TRD modules may regulate esterified catechin biosynthesis either by directly binding the promoters of SCPL1A-clade genes or by assembling regulatory complexes with the functionally validated activator CsWRKY57like [42]. In parallel, the well-characterized MYB–bHLH co-regulatory network driving simple catechin biosynthesis in WGD modules is supported by direct molecular evidence: CsMYB2 and CsMYB26 are positively correlated with CsF3′H and CsLAR transcript levels, respectively, and modulate flavonol metabolic flux through physical interaction with bHLH partners [43], providing strong functional support for the module-level assignments made in this study. All proposed regulatory relationships involving M-type MADS-box and WOX factors must be validated through yeast one-hybrid assays, electrophoretic mobility shift assays (EMSA), and chromatin immunoprecipitation sequencing (ChIP-seq) before mechanistic conclusions can be drawn.
4.3. Future Directions
Two fundamental limitations constrain the current analytical framework and define the most productive avenues for future investigation. First, causal relationships among regulatory layers remain unresolved. The hierarchical ordering of promoter-region SNPs, CG methylation, and chromatin accessibility—specifically, whether SNP-mediated disruption of methyltransferase recognition sequences precedes and promotes CG methylation establishment, or vice versa—cannot be determined from correlational multi-omics data alone. Allele-specific expression (ASE) analysis and CRISPR-dCas9 epigenome editing represent the most direct experimental strategies for dissecting these causal relationships. The observation that genome-wide methylation levels in tea plant new shoots undergo seasonal oscillations that are synchronized with catechin accumulation dynamics provides a naturally occurring system amenable to ASE profiling across developmental time points[44]. Furthermore, the persistence of differential chromatin accessibility between neo- and evolved autopolyploid Arabidopsis arenosa following whole-genome duplication supports the incorporation of time-resolved ATAC-seq into future experimental designs as a sensitive readout of early regulatory divergence[45]. Second, single-cultivar scope limits generalizability. The present study is based exclusively on the YK10 accession, and the conservation versus cultivar-specificity of the TRD gene hypermethylation patterns identified here remains uncharacterized across C. sinensis germplasm. Comparative methylome analysis spanning publicly available multi-cultivar genome assemblies (Shuchazao, Longjing 43, Tieguanyin, et al.) would enable the systematic identification of cultivar-specific differentially methylated regions (DMRs) residing within TRD promoter-associated ACRs, which represent high-priority targets for precision EGCG-enrichment breeding. Coupling such genomic targeting with CRISPRa-mediated transcriptional activation of selected TRD copies offers a transgene-free strategy for fine-tuning the ratio of esterified to non-esterified catechins in elite tea cultivars [46].
5. Conclusions
Gene duplication provides the raw material for species functional innovation, but the regulatory mechanisms governing whether duplicate genes follow expression conservation or divergence—and divergent co-expression—remain unclear in polyploid crops. Using Camellia sinensis as a model, this study constructed a multi-layered framework of WGD and TRD duplicate gene transcriptional divergence integrating structural constraints, epigenetic regulation, and transcription factor networks, directly linking this to the diversified accumulation of catechin metabolites.
At the structural level, gene length and sequence similarity exert synergistic constraints on duplicate gene co-expression: longer gene body length correlates with lower co-expression; higher sequence similarity correlates with less expression divergence. These factors do not act independently but collectively maintain duplicate gene co-expression, providing new perspectives for understanding the structural determinants of duplicate gene retention and divergence.
At the epigenetic level, the dynamic balance between activation and repression signals determines the transcriptional fate of duplicate genes. Chromatin accessibility (ATAC-seq signals) and H3K27ac modification cooperatively activate duplicate gene transcription, with the activation effect significantly stronger when both are present versus either alone, primarily driving WGD gene co-expression. TRD genes suffer multi-layered repressive regulation: promoter-region CG methylation constitutes a persistent transcriptional repression barrier; simultaneously, promoter SNPs further exacerbate TRD gene expression divergence by disrupting cis-regulatory element integrity. These results indicate that WGD and TRD genes exist in differential epigenetic landscapes—the former dominated by activation signals, the latter subject to additional methylation and genetic variation barriers.
At the functional level, by integrating co-expression networks with metabolite accumulation data, we identified multiple key transcription factors involved in catechin biosynthesis and revealed functional division of labor among duplicate genes: WGD genes maintain stable output of simple catechin (EC, GC, EGC) biosynthesis pathways through conserved transcription factors MYB, bHLH, and ERF; TRD genes rely on dynamic factors M-type MADS, WOX, and bZIP to finely regulate esterified catechin (especially EGCG) accumulation. The two duplicate gene types cooperatively drive catechin component diversification in tea plant through differential transcriptional regulatory strategies.
In summary, this study proposes a duplicate gene expression divergence model integrating structural, epigenetic, and transcriptional regulation, systematically elucidating the formation mechanism of metabolic diversity in the ancient polyploid genome of tea plant. This framework not only deepens understanding of plant duplicate gene evolutionary dynamics but also provides clear molecular targets for precision breeding centered on EGCG enrichment, including SNP sites within accessible chromatin regions (ACRs) in promoters, differentially methylated regions (DMRs), and key transcription factor nodes such as MADS-box and bZIP. These candidate targets provide theoretical foundations and actionable entry points for subsequent integrated applications based on epigenome editing (e.g., CRISPRa/dCas9) and molecular-assisted breeding.
Supplementary Materials
Figure S1:(a) Proportion of gene pairs with expression divergence in WGD and TRD genes across eight tissues. (b) Proportion of co-expressed gene pairs in WGD and TRD genes across four clusters. (c) Scatter plot showing the relationship between WGD average gene length and Pearson correlation coefficient. (d) Scatter plot showing the relationship between TRD average gene length and Pearson correlation coefficient. Figure S2:(a) Sequence similarity density distribution plot. (b) Bar chart showing ATAC and H3K27ac peak numbers. (c) Correlation plot of WGD module eigengenes with catechin accumulation levels. (d) Correlation plot of TRD module eigengenes with catechin accumulation levels. Table S1:Gene IDs of WGD gene pairs. Table S2:Gene IDs of TRD gene pairs. Table S3:Sources of transcriptomic and epigenomic data used in this study. Table S4:Summary of predicted transcription factors.
Author Contributions
S.L. and H.F. implemented the algorithms and carried out the experiments. S.L. and H.F. drafted the manuscript. S.L. and H.H. designed the study and analyzed the results. S.L., H.F., H.H., L.Z. contributed to data collection and analysis. K.G. and W.Z. participated in discussion. All authors have read and agreed to the published version of the manuscript.
Funding
This work was supported by the Special Plan for Key Scientific Research Projects of Higher Education Institutions in Henan Province to Serve Industrial Development (25CY032).
Institutional Review Board Statement
Not applicable.
Informed Consent Statement
Not applicable.
Data Availability Statement
All data used in this study were obtained from public databases. The high-quality reference genome of Camellia sinensis cultivar YK10 is available from TeaBase [47]. RNA-seq datasets are deposited in the NCBI Sequence Read Archive (SRA) under accession numbers PRJNA381277 and PRJCA574928 [48,49]. ATAC-seq and H3K27ac ChIP-seq datasets are available from the National Genomics Data Center (NGDC) under project number PRJCA017759. The WGBS dataset is available under project number PRJCA014523 [16]. Detailed sample information is provided in Table S3. SNP data for tea plant (YK10) were downloaded from TeaGVD (http://www.teaplant.top/teagvd)[50].
Acknowledgments
Authors thank anonymous reviewers for their comments on the manuscript.
Conflicts of Interest
The authors declare that they have no conflicts of interest.
Abbreviations
WGD Whole-genome duplication
TRD transposed duplication
GC gallocatechin
EGCG epigallocatechin gallate
ECG epicatechin gallate
EGC epigallocatechin
EC epicatechin
C catechin
KME key module eigengene-based connectivity
References
- Panchy, N.; Lehti-Shiu, M.; Shiu, S. H. Evolution of Gene Duplication in Plants. Plant Physiol. 2016, 171(4), 2294–2316. [Google Scholar] [CrossRef] [PubMed]
- Flagel, L. E.; Wendel, J. F. Gene duplication and evolutionary novelty in plants. New Phytol. 2009, 183(3), 557–564. [Google Scholar] [CrossRef] [PubMed]
- Jiao, Y.; Wickett, N. J.; Ayyampalayam, S.; Chanderbali, A. S.; Landherr, L.; Ralph, P. E.; Tomsho, L. P.; Hu, Y.; Liang, H.; Soltis, P. S.; Soltis, D. E.; Clifton, S. W.; Schlarbaum, S. E.; Schuster, S. C.; Ma, H.; Leebens-Mack, J.; dePamphilis, C. W. Ancestral polyploidy in seed plants and angiosperms. Nature 2011, 473(7345), 97–100. [Google Scholar] [CrossRef] [PubMed]
- Soltis, D. E.; Albert, V. A.; Leebens-Mack, J.; Bell, C. D.; Paterson, A. H.; Zheng, C.; Sankoff, D.; Depamphilis, C. W.; Wall, P. K.; Soltis, P. S. Polyploidy and angiosperm diversification. Am. J. Bot. 2009, 96(1), 336–348. [Google Scholar] [CrossRef] [PubMed]
- Jiang, N.; Bao, Z.; Zhang, X.; Eddy, S.R.; Wessler, S.R. Pack-MULE transposable elements mediate gene evolution in plants. Nature 2004, 431(7008), 569–573. [Google Scholar] [CrossRef] [PubMed]
- Wang, Y.; Wang, X.; Tang, H.; et al. Modes of gene duplication contribute differently to genetic novelty and redundancy, but show parallels across divergent angiosperms. PLoS ONE 2011, 6(12), e28150. [Google Scholar] [CrossRef] [PubMed]
- Birchler, J.A.; Veitia, R.A. Gene balance hypothesis: connecting issues of dosage sensitivity across biological disciplines. Proc. Natl. Acad. Sci. USA 2012, 109(37), 14746–14753. [Google Scholar] [CrossRef] [PubMed]
- Ganko, E.W.; Meyers, B.C.; Vision, T.J. Divergence in expression between duplicated genes in Arabidopsis. Mol. Biol. Evol. 2007, 24(10), 2298–2309. [Google Scholar] [CrossRef] [PubMed]
- Wang, Y.; Tan, X.; Paterson, A. H. Different patterns of gene structure divergence following gene duplication in Arabidopsis. BMC Genom. 2013, 14, 652. [Google Scholar] [CrossRef] [PubMed]
- Yang, C.S.; Hong, J. Prevention of chronic diseases by tea: possible mechanisms and human relevance. Annu Rev. Nutr. 2013, 33, 161–181. [Google Scholar] [CrossRef] [PubMed]
- Chen, D.; Chen, G.; Sun, Y.; Zeng, X.; Ye, H. Physiological genetics, chemical composition, health benefits and toxicology of tea (Camellia sinensis L.) flower: a review. Food Res. Int. 2020, 137, 109584. [Google Scholar] [CrossRef] [PubMed]
- Qu, Z.; Liu, A.; Li, P.; et al. Advances in physiological functions and mechanisms of (-)-epicatechin. Crit. Rev. Food Sci. Nutr. 2021, 61, 211–233. [Google Scholar] [CrossRef] [PubMed]
- Xia, E.; Tong, W.; Hou, Y.; et al. The reference genome of tea plant and resequencing of 81 diverse accessions provide insights into its genome evolution and adaptation. Mol. Plant. 2020, 13(7), 1013–1026. [Google Scholar] [CrossRef] [PubMed]
- Wei, C.; Yang, H.; Wang, S.; et al. Draft genome sequence of Camellia sinensis var. sinensis provides insights into the evolution of the tea genome and tea quality. Proc. Natl. Acad. Sci. USA 2018, 115, E4151–E4158. [Google Scholar] [CrossRef] [PubMed]
- Ye, T.; Li, S.; Li, Y.; Xiao, S.; Yuan, D. Impact of polyploidization on genome evolution and phenotypic diversity in oil-tea Camellia. Ind. Crops Prod. 2024, 218, 118928. [Google Scholar] [CrossRef]
- Kong, W.; Yu, J.; Yang, J.; Zhang, Y.; Zhang, X. The high-resolution three-dimensional (3D) chromatin map of the tea plant (Camellia sinensis). Hortic. Res. 2023, 10, uhad179. [Google Scholar] [CrossRef] [PubMed]
- Buenrostro, J.; Giresi, P.; Zaba, L.; et al. Transposition of native chromatin for fast and sensitive epigenomic profiling of open chromatin, DNA-binding proteins and nucleosome position. Nat. Methods 2013, 10, 1213–1218. [Google Scholar] [CrossRef] [PubMed]
- Creyghton, M.P.; Cheng, A.W.; Welstead, G.G.; et al. Histone H3K27ac separates active from poised enhancers and predicts developmental state. Proc. Natl. Acad. Sci. USA 2010, 107(50), 21931–21936. [Google Scholar] [CrossRef] [PubMed]
- Law, J.; Jacobsen, S. Establishing, maintaining and modifying DNA methylation patterns in plants and animals. Nat. Rev. Genet. 2010, 11, 204–220. [Google Scholar] [CrossRef] [PubMed]
- Qiao, X.; Li, Q.; Yin, H.; et al. Gene duplication and evolution in recurring polyploidization-diploidization cycles in plants. Genome Biol. 2019, 20, 38. [Google Scholar] [CrossRef] [PubMed]
- Chen, S.; Zhou, Y.; Chen, Y.; Gu, J. fastp: an ultra-fast all-in-one FASTQ preprocessor. Bioinformatics 2018, 34, i884–i890. [Google Scholar] [CrossRef] [PubMed]
- Kim, D.; Langmead, B.; Salzberg, S.L. HISAT: a fast spliced aligner with low memory requirements. Nat. Methods 2015, 12, 357–360. [Google Scholar] [CrossRef] [PubMed]
- Liao, Y.; Smyth, G.K.; Shi, W. featureCounts: an efficient general purpose program for assigning sequence reads to genomic features. Bioinformatics 2014, 30, 923–930. [Google Scholar] [CrossRef] [PubMed]
- Langmead, B.; Salzberg, S.L. Fast gapped-read alignment with Bowtie 2. Nat. Methods 2012, 9, 357–359. [Google Scholar] [CrossRef] [PubMed]
- Danecek, P.; Bonfield, J.K.; Liddle, J.; et al. Twelve years of SAMtools and BCFtools. GigaScience 2021, 10, giab008. [Google Scholar] [CrossRef] [PubMed]
- Zhang, Y.; Liu, T.; Meyer, C.A.; et al. Model-based analysis of ChIP-Seq (MACS). Genome Biol. 2008, 9, R137. [Google Scholar] [CrossRef] [PubMed]
- Quinlan, A.R.; Hall, I.M. BEDTools: a flexible suite of utilities for comparing genomic features. Bioinformatics 2010, 26, 841–842. [Google Scholar] [CrossRef] [PubMed]
- Zhou, Q.; Lim, J.Q.; Sung, W.K.; Li, G. An integrated package for bisulfite DNA methylation data analysis with Indel-sensitive mapping. BMC Bioinform. 2019, 20, 47. [Google Scholar] [CrossRef] [PubMed]
- Lescot, M.; Dehais, P.; Thijs, G.; et al. PlantCARE, a database of plant cis-acting regulatory elements and a portal to tools for in silico analysis of promoter sequences. Nucleic Acids Res. 2002, 30, 325–327. [Google Scholar] [CrossRef] [PubMed]
- Jin, J.; Tian, F.; Yang, D.C.; et al. PlantTFDB 4.0: toward a central hub for transcription factors and regulatory interactions in plants. Nucleic Acids Res. 2017, 45, D1040–D1045. [Google Scholar] [CrossRef] [PubMed]
- Cantalapiedra, C.P.; Hernandez-Plaza, A.; Letunic, I.; Bork, P.; Huerta-Cepas, J. eggNOG-mapper v2: functional annotation, orthology assignments, and domain prediction at the metagenomic scale. Mol. Biol. Evol. 2021, 38, 5825–5829. [Google Scholar] [CrossRef] [PubMed]
- Wu, W.; Lu, M.; Peng, J.; Lv, H.; Shi, J.; Zhang, S.; Liu, Z.; Duan, J.; Chen, D.; Dai, W.; Lin, Z. Nontargeted and targeted metabolomics analysis provides novel insight into nonvolatile metabolites in Jianghua Kucha tea germplasm (Camellia sinensis var. Assamica cv. Jianghua). Food Chem. X 2022, 13, 100270. [Google Scholar] [CrossRef] [PubMed]
- Chen, J.; Hu, Y.; Zhu, Z.; Zheng, P.; Liu, S.; Sun, B. Dynamic DNA methylation modification in catechins and terpenoids biosynthesis during tea plant leaf development. Hortic. Plant J. 2025, *11*(2), 906–920. [Google Scholar] [CrossRef]
- Kaessmann, H. Origins, evolution, and phenotypic impact of new genes. Genome Res. 2010, 20(10), 1313–1326. [Google Scholar] [CrossRef] [PubMed]
- Fang, C.; Yang, M.; Tang, Y.; Zhang, L.; Zhao, H.; Ni, H.; Chen, Q.; Meng, F.; Jiang, J. Dynamics of cis-regulatory sequences and transcriptional divergence of duplicated genes in soybean. Proceedings of the National Academy of Sciences of the United States of America 2023, 120(44), e2303836120. [Google Scholar] [CrossRef] [PubMed]
- Hu, G.; Grover, C. E.; Vera, D. L.; Lung, P. Y.; Girimurugan, S. B.; Miller, E. R.; Conover, J. L.; Ou, S.; Xiong, X.; Zhu, D.; Li, D.; Gallagher, J. P.; Udall, J. A.; Sui, X.; Zhang, J.; Bass, H. W.; Wendel, J. F. Evolutionary Dynamics of Chromatin Structure and Duplicate Gene Expression in Diploid and Allopolyploid Cotton. Mol. Biol. Evol. 2024, 41(5), msae095. [Google Scholar] [CrossRef] [PubMed]
- Masiero, S.; Colombo, L.; Grini, P. E.; Schnittger, A.; Kater, M. M. The emerging importance of type I MADS box transcription factors for plant reproduction. Plant Cell 2011, 23(3), 865–872. [Google Scholar] [CrossRef] [PubMed]
- Li, H. L.; Wei, L. R.; Guo, D.; Wang, Y.; Zhu, J. H.; Chen, X. T.; Peng, S. Q. HbMADS4, a MADS-box Transcription Factor from Hevea brasiliensis, Negatively Regulates HbSRPP. Front. Plant Sci. 2016, 7, 1709. [Google Scholar] [CrossRef] [PubMed]
- Liang, M.; Du, Z.; Yang, Z.; Luo, T.; Ji, C.; Cui, H.; Li, R. Genome-wide characterization and expression analysis of MADS-box transcription factor gene family in Perilla frutescens. Front. Plant Sci. 2024, 14, 1299902. [Google Scholar] [CrossRef] [PubMed]
- Yao, S.; Liu, Y.; Zhuang, J.; Zhao, Y.; Dai, X.; Jiang, C.; Wang, Z.; Jiang, X.; Zhang, S.; Qian, Y.; Tai, Y.; Wang, Y.; Wang, H.; Xie, D. Y.; Gao, L.; Xia, T. Insights into acylation mechanisms: co-expression of serine carboxypeptidase-like acyltransferases and their non-catalytic companion paralogs. Plant J. Cell Mol. Biol. 2022, 111(1), 117–133. [Google Scholar] [CrossRef] [PubMed]
- Chen, X.; Zhang, X.; Zhao, Y.; Gao, L.; Wang, Z.; Su, Y.; Zhang, L.; Xia, T.; Liu, Y. Deactivating mutations in the catalytic site of a companion serine carboxypeptidase-like acyltransferase enhance catechin galloylation in Camellia plants. Hortic. Res. 2024, 12(3), uhae343. [Google Scholar] [CrossRef] [PubMed]
- Luo, Y.; Huang, X. X.; Song, X. F.; Wen, B. B.; Xie, N. C.; Wang, K. B.; Huang, J. A.; Liu, Z. H. Identification of a WRKY transcriptional activator from Camellia sinensis that regulates methylated EGCG biosynthesis. Hortic. Res. 2022, 9, uhac024. [Google Scholar] [CrossRef] [PubMed]
- Wang, W. L.; Wang, Y. X.; Li, H.; Liu, Z. W.; Cui, X.; Zhuang, J. Correction to: Two MYB transcription factors (CsMYB2 and CsMYB26) are involved in flavonoid biosynthesis in tea plant [Camellia sinensis (L.) O. Kuntze]. BMC Plant Biol. 2019, 19(1), 36. [Google Scholar] [CrossRef] [PubMed]
- Han, M.; Lin, S.; Zhu, B.; Tong, W.; Xia, E.; Wang, Y.; Yang, T.; Zhang, S.; Wan, X.; Liu, J.; Niu, Q.; Zhu, J.; Bao, S.; Zhang, Z. Dynamic DNA Methylation Regulates Season-Dependent Secondary Metabolism in the New Shoots of Tea Plants. J. Agric. Food Chem. 2024, 72(8), 3984–3997. [Google Scholar] [CrossRef] [PubMed]
- Srikant, T.; Gonzalo, A.; Bomblies, K. Chromatin Accessibility and Gene Expression Vary Between a New and Evolved Autopolyploid of Arabidopsis arenosa. Mol. Biol. Evol. 2024, 41(10), msae213. [Google Scholar] [CrossRef] [PubMed]
- Yang, N.; Li, J. W.; Deng, Y. J.; Teng, R. M.; Luo, W.; Li, G. N.; Hu, Z. H.; Liu, H.; Xiong, A. S.; Zhang, J.; Yao, Q. H.; Zhuang, J. Ectopic biosynthesis of catechin of tea plant can be completed by co-expression of the three CsANS, CsLAR, and CsANR genes. Hortic. Res. 2024, 12(2), uhae304. [Google Scholar] [CrossRef] [PubMed]
- Li, X.; Shen, Z.; Ma, C.; Yang, L.; Duan, S.; Lv, Y.; Yang, L.; Lei, Y.; Dong, Y.; Sheng, J. Teabase: A comprehensive omics database of Camellia. Plant Commun. 2023, 4(5), 100664. [Google Scholar] [CrossRef] [PubMed]
- Suo, A.; Lan, Z.; Lu, C.; Zhao, Z.; Pu, D.; Wu, X.; Jiang, B.; Zhou, N.; Ding, H.; Zhou, D.; Liao, P.; Sunkar, R.; Zheng, Y. Characterizing microRNAs and their targets in different organs of Camellia sinensis var. assamica. Genomics 2021, 113 1 Pt 1, 159–170. [Google Scholar] [CrossRef] [PubMed]
- Xia, E. H.; Zhang, H. B.; Sheng, J.; Li, K.; Zhang, Q. J.; Kim, C.; Zhang, Y.; Liu, Y.; Zhu, T.; Li, W.; Huang, H.; Tong, Y.; Nan, H.; Shi, C.; Shi, C.; Jiang, J. J.; Mao, S. Y.; Jiao, J. Y.; Zhang, D.; Zhao, Y.; Gao, L. Z. The Tea Tree Genome Provides Insights into Tea Flavor and Independent Evolution of Caffeine Biosynthesis. Mol. Plant 2017, 10(6), 866–877. [Google Scholar] [CrossRef] [PubMed]
- Chen, J. D.; He, W. Z.; Chen, S.; Chen, Q. Y.; Ma, J. Q.; Jin, J. Q.; Ma, C. L.; Moon, D. G.; Ercisli, S.; Yao, M. Z.; Chen, L. TeaGVD: A comprehensive database of genomic variations for uncovering the genetic architecture of metabolic traits in tea plants. Front. Plant Sci. 2022, 13, 1056891. [Google Scholar] [CrossRef] [PubMed]
Figure 1.
Divergent co-expression patterns of WGD and TRD duplicate gene pairs in Camellia sinensis. (a, b) Heatmaps of differential expression patterns of WGD and TRD gene pairs across eight tissues, respectively. (c) Genome-wide co-expression rate comparison between WGD and TRD gene pairs. (d, e) GO enrichment analysis of WGD and TRD gene clusters, respectively. Error bars, bootstrapped standard errors. Significance values were determined by the Mann–Whitney U test (*p < 0.05, **p < 0.01, ***p < 0.001).
Figure 1.
Divergent co-expression patterns of WGD and TRD duplicate gene pairs in Camellia sinensis. (a, b) Heatmaps of differential expression patterns of WGD and TRD gene pairs across eight tissues, respectively. (c) Genome-wide co-expression rate comparison between WGD and TRD gene pairs. (d, e) GO enrichment analysis of WGD and TRD gene clusters, respectively. Error bars, bootstrapped standard errors. Significance values were determined by the Mann–Whitney U test (*p < 0.05, **p < 0.01, ***p < 0.001).
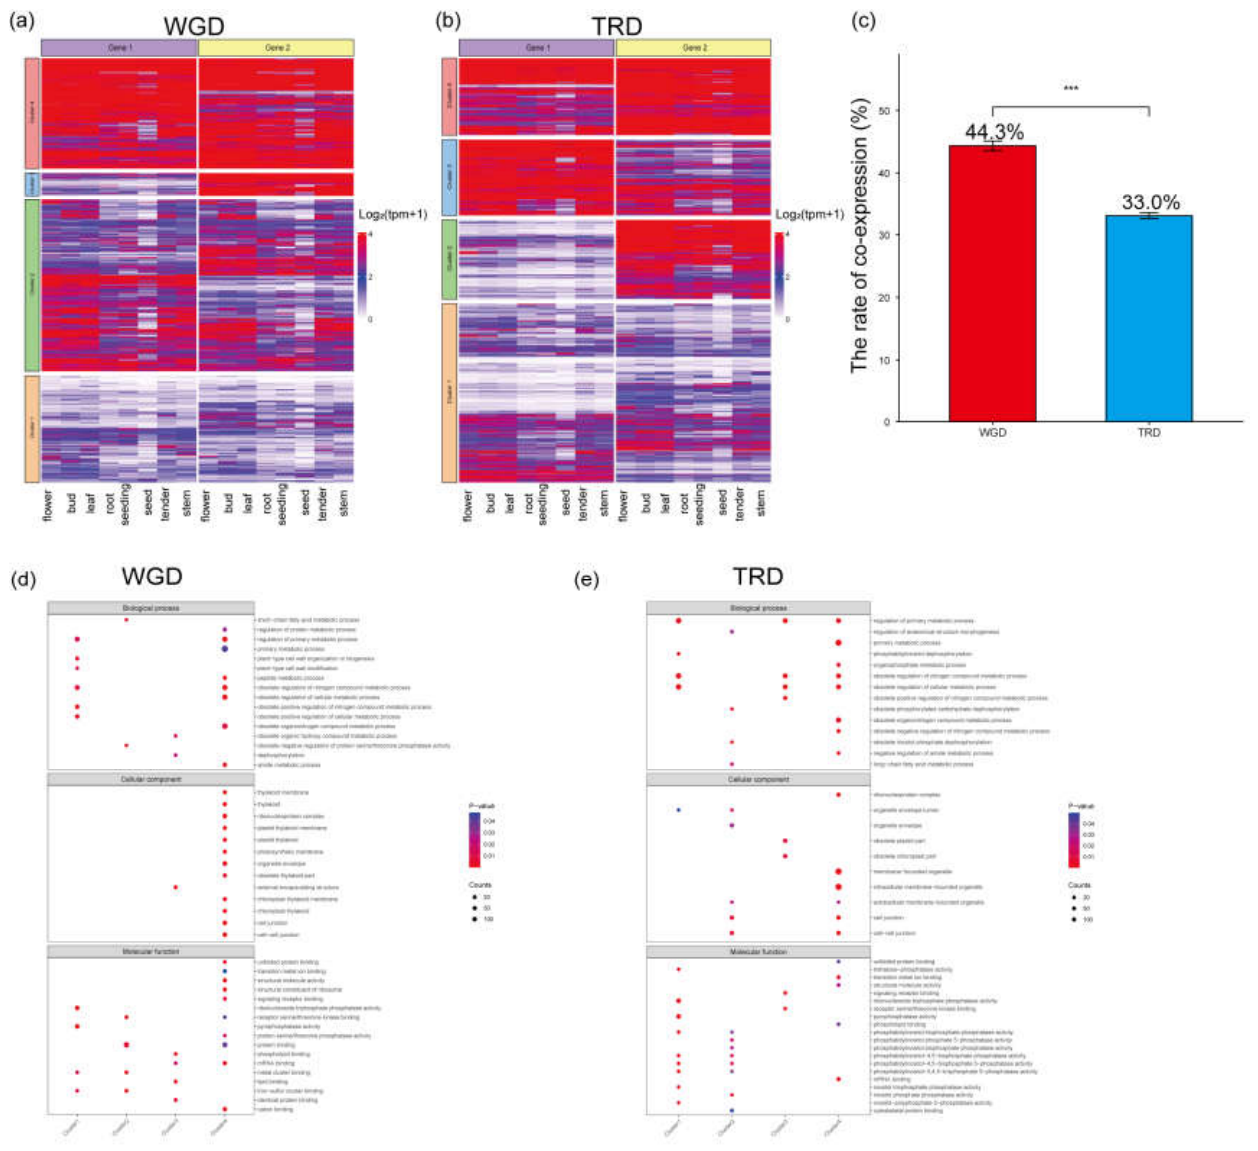
Figure 2.
Effect of gene length on co-expression rates of WGD and TRD gene pairs. (a, b) Co-expression rate comparison of WGD and TRD gene pairs stratified by gene length groups, respectively. (c, d) Frequency distributions of co-expression ratios from 100,000 randomization experiments across three gene length ranges for WGD and TRD gene pairs, respectively. Each iteration sampled the same number of gene pairs as the empirical dataset. Error bars, bootstrapped standard errors. Significance values were determined by the Mann–Whitney U test (*p < 0.05, **p < 0.01, ***p < 0.001).
Figure 2.
Effect of gene length on co-expression rates of WGD and TRD gene pairs. (a, b) Co-expression rate comparison of WGD and TRD gene pairs stratified by gene length groups, respectively. (c, d) Frequency distributions of co-expression ratios from 100,000 randomization experiments across three gene length ranges for WGD and TRD gene pairs, respectively. Each iteration sampled the same number of gene pairs as the empirical dataset. Error bars, bootstrapped standard errors. Significance values were determined by the Mann–Whitney U test (*p < 0.05, **p < 0.01, ***p < 0.001).
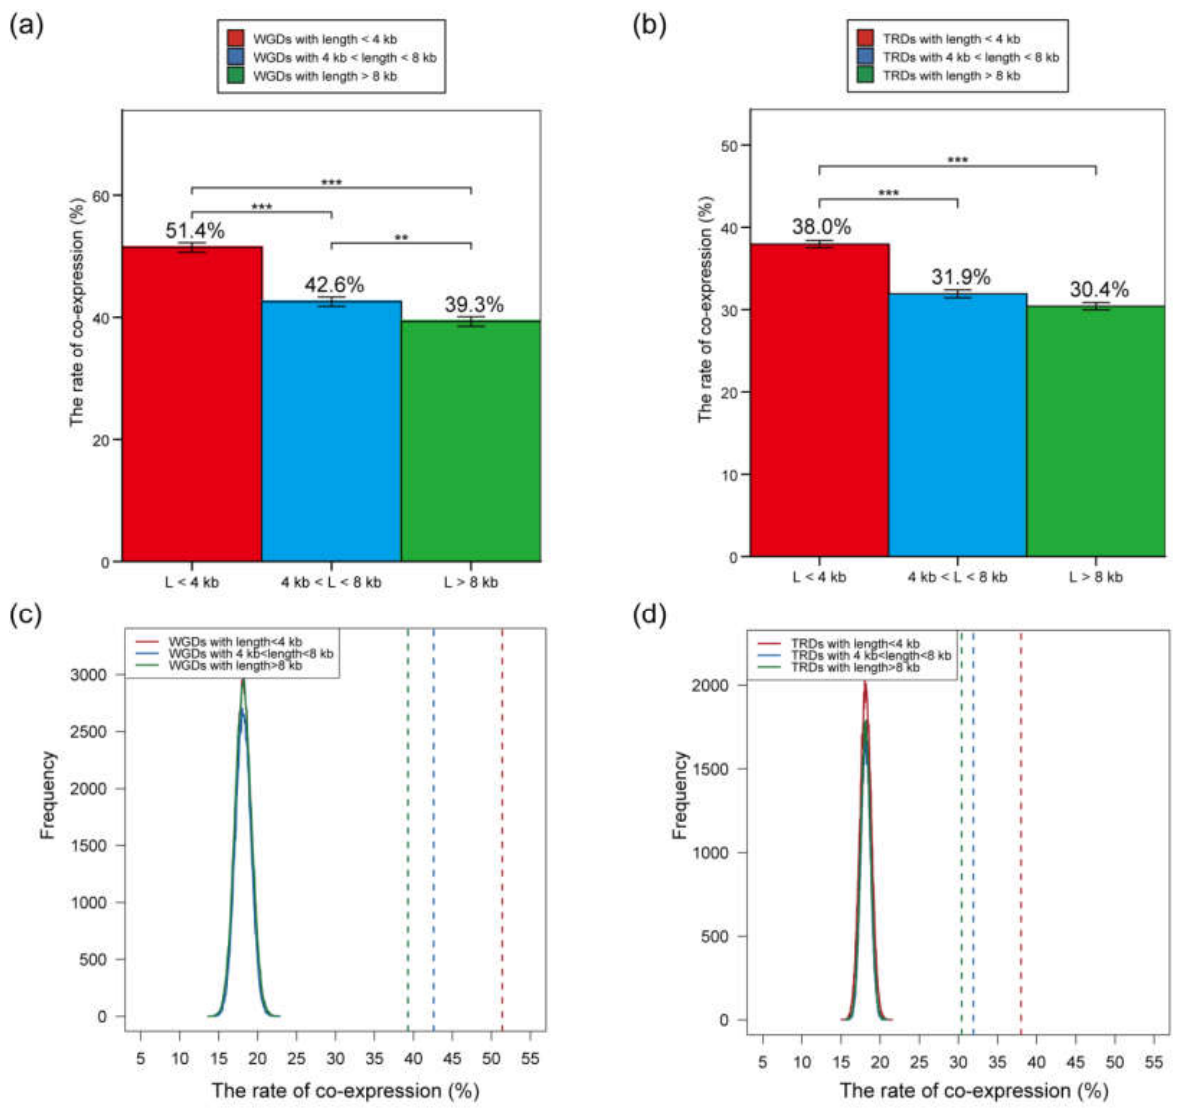
Figure 3.
Synergistic effects of sequence similarity and gene length on co-expression of WGD and TRD gene pairs. (a) Kernel density distribution of BLAST sequence similarity for WGD and TRD gene pairs. (b) Association between BLAST sequence similarity and expression divergence. (c, d) Co-expression rates of WGD and TRD gene pairs, respectively, under conditions of high sequence similarity and short gene length. Error bars, bootstrapped standard errors. Significance values were determined by the Mann–Whitney U test (*p < 0.05, **p < 0.01, ***p < 0.001).
Figure 3.
Synergistic effects of sequence similarity and gene length on co-expression of WGD and TRD gene pairs. (a) Kernel density distribution of BLAST sequence similarity for WGD and TRD gene pairs. (b) Association between BLAST sequence similarity and expression divergence. (c, d) Co-expression rates of WGD and TRD gene pairs, respectively, under conditions of high sequence similarity and short gene length. Error bars, bootstrapped standard errors. Significance values were determined by the Mann–Whitney U test (*p < 0.05, **p < 0.01, ***p < 0.001).
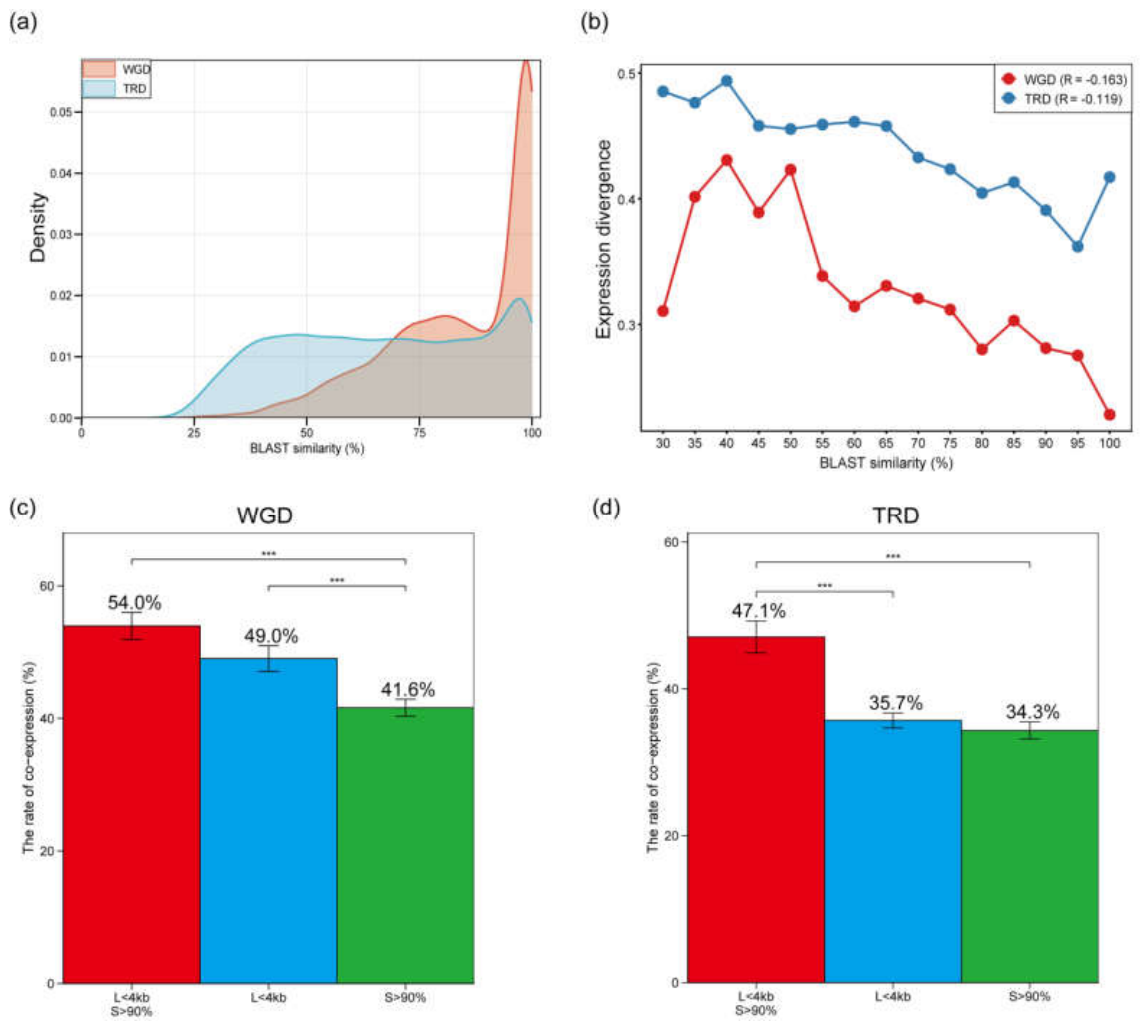
Figure 4.
Chromatin accessibility and H3K27ac modification promote expression and co-expression of WGD and TRD gene pairs. (a, c) Expression levels of WGD and TRD genes with versus without ATAC-seq and H3K27ac peak annotation, respectively. (b, d) Co-expression rates of gene pairs stratified by ATAC-seq and H3K27ac peak annotation status, respectively. Error bars, bootstrapped standard errors. Significance values were determined by the Mann–Whitney U test (*p < 0.05, **p < 0.01, ***p < 0.001).
Figure 4.
Chromatin accessibility and H3K27ac modification promote expression and co-expression of WGD and TRD gene pairs. (a, c) Expression levels of WGD and TRD genes with versus without ATAC-seq and H3K27ac peak annotation, respectively. (b, d) Co-expression rates of gene pairs stratified by ATAC-seq and H3K27ac peak annotation status, respectively. Error bars, bootstrapped standard errors. Significance values were determined by the Mann–Whitney U test (*p < 0.05, **p < 0.01, ***p < 0.001).
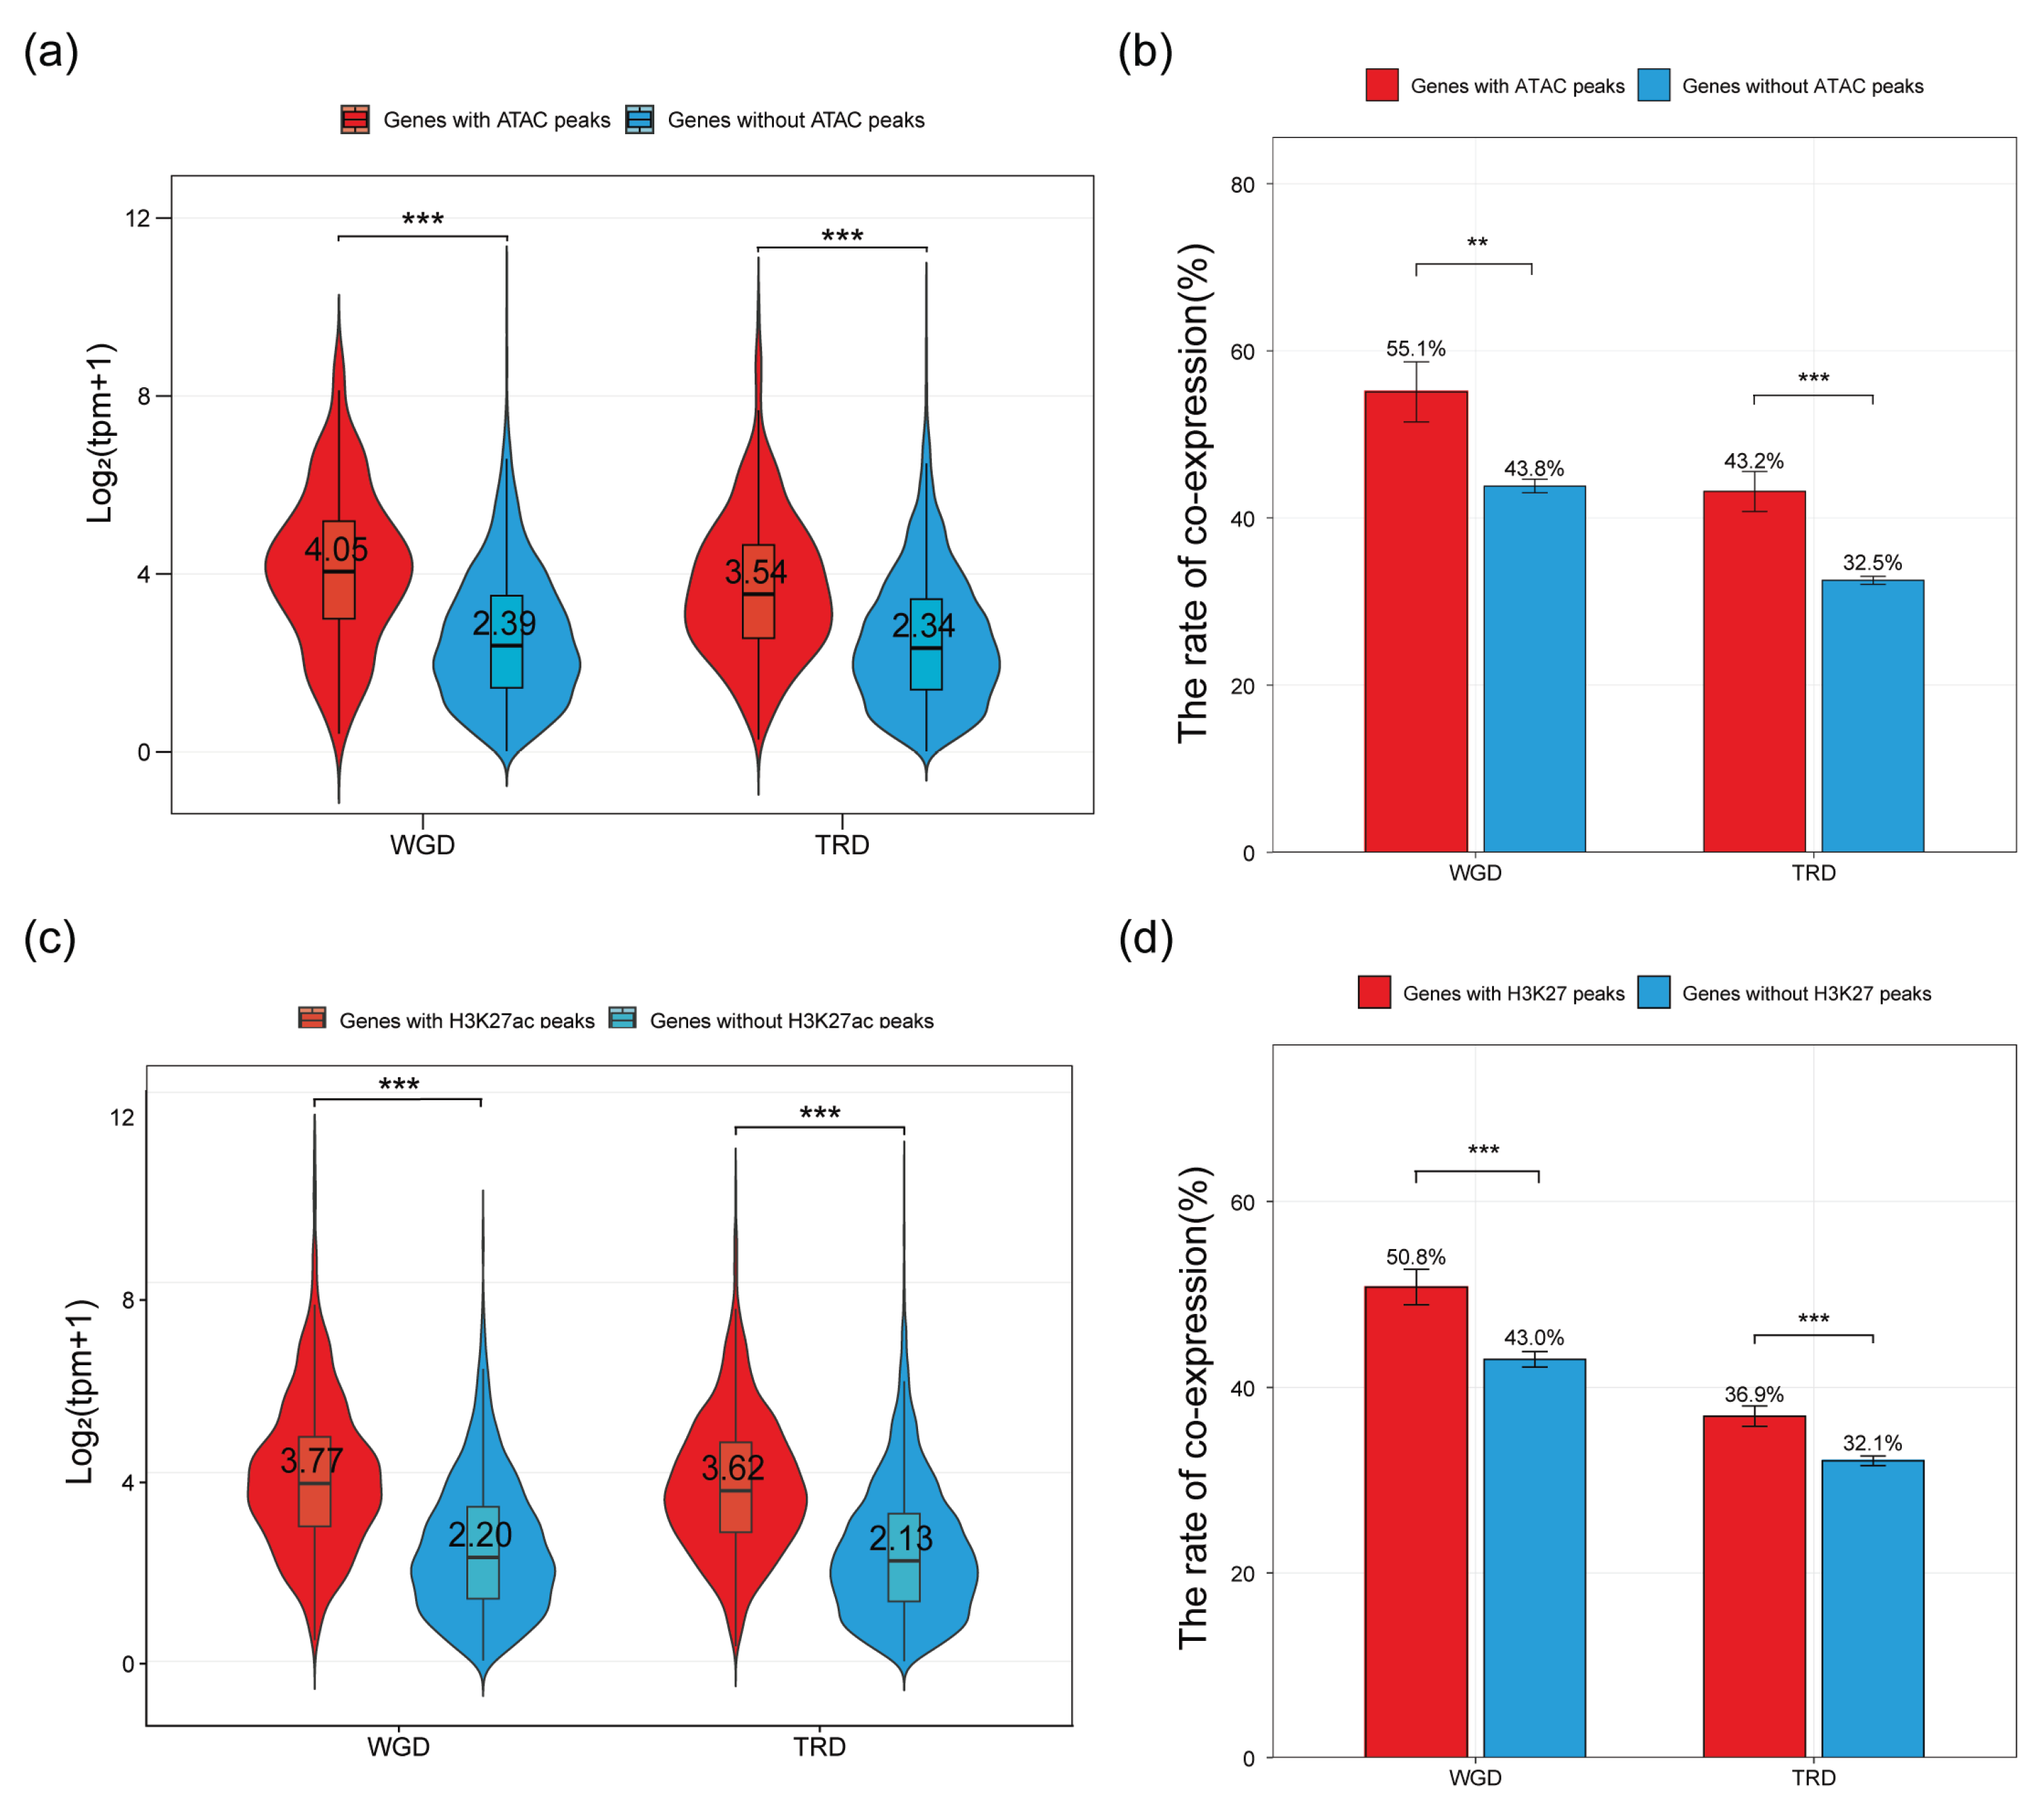
Figure 5.
DNA methylation landscape of the tea plant genome. (a) Genome-wide distribution of CG, CHG, and CHH methylation across 15 chromosomes, with tracks for whole-genome density, WGD gene density, TRD gene density, and methylation levels per context (1-Mb windows). (b) Methylation profiles across gene bodies and 2-kb flanking regions of WGD and TRD genes in three sequence contexts. TSS, transcription start site; TTS, transcription termination site. (c) Methylation levels of WGD and TRD genes stratified by expression level (low, medium, high) in three sequence contexts.
Figure 5.
DNA methylation landscape of the tea plant genome. (a) Genome-wide distribution of CG, CHG, and CHH methylation across 15 chromosomes, with tracks for whole-genome density, WGD gene density, TRD gene density, and methylation levels per context (1-Mb windows). (b) Methylation profiles across gene bodies and 2-kb flanking regions of WGD and TRD genes in three sequence contexts. TSS, transcription start site; TTS, transcription termination site. (c) Methylation levels of WGD and TRD genes stratified by expression level (low, medium, high) in three sequence contexts.
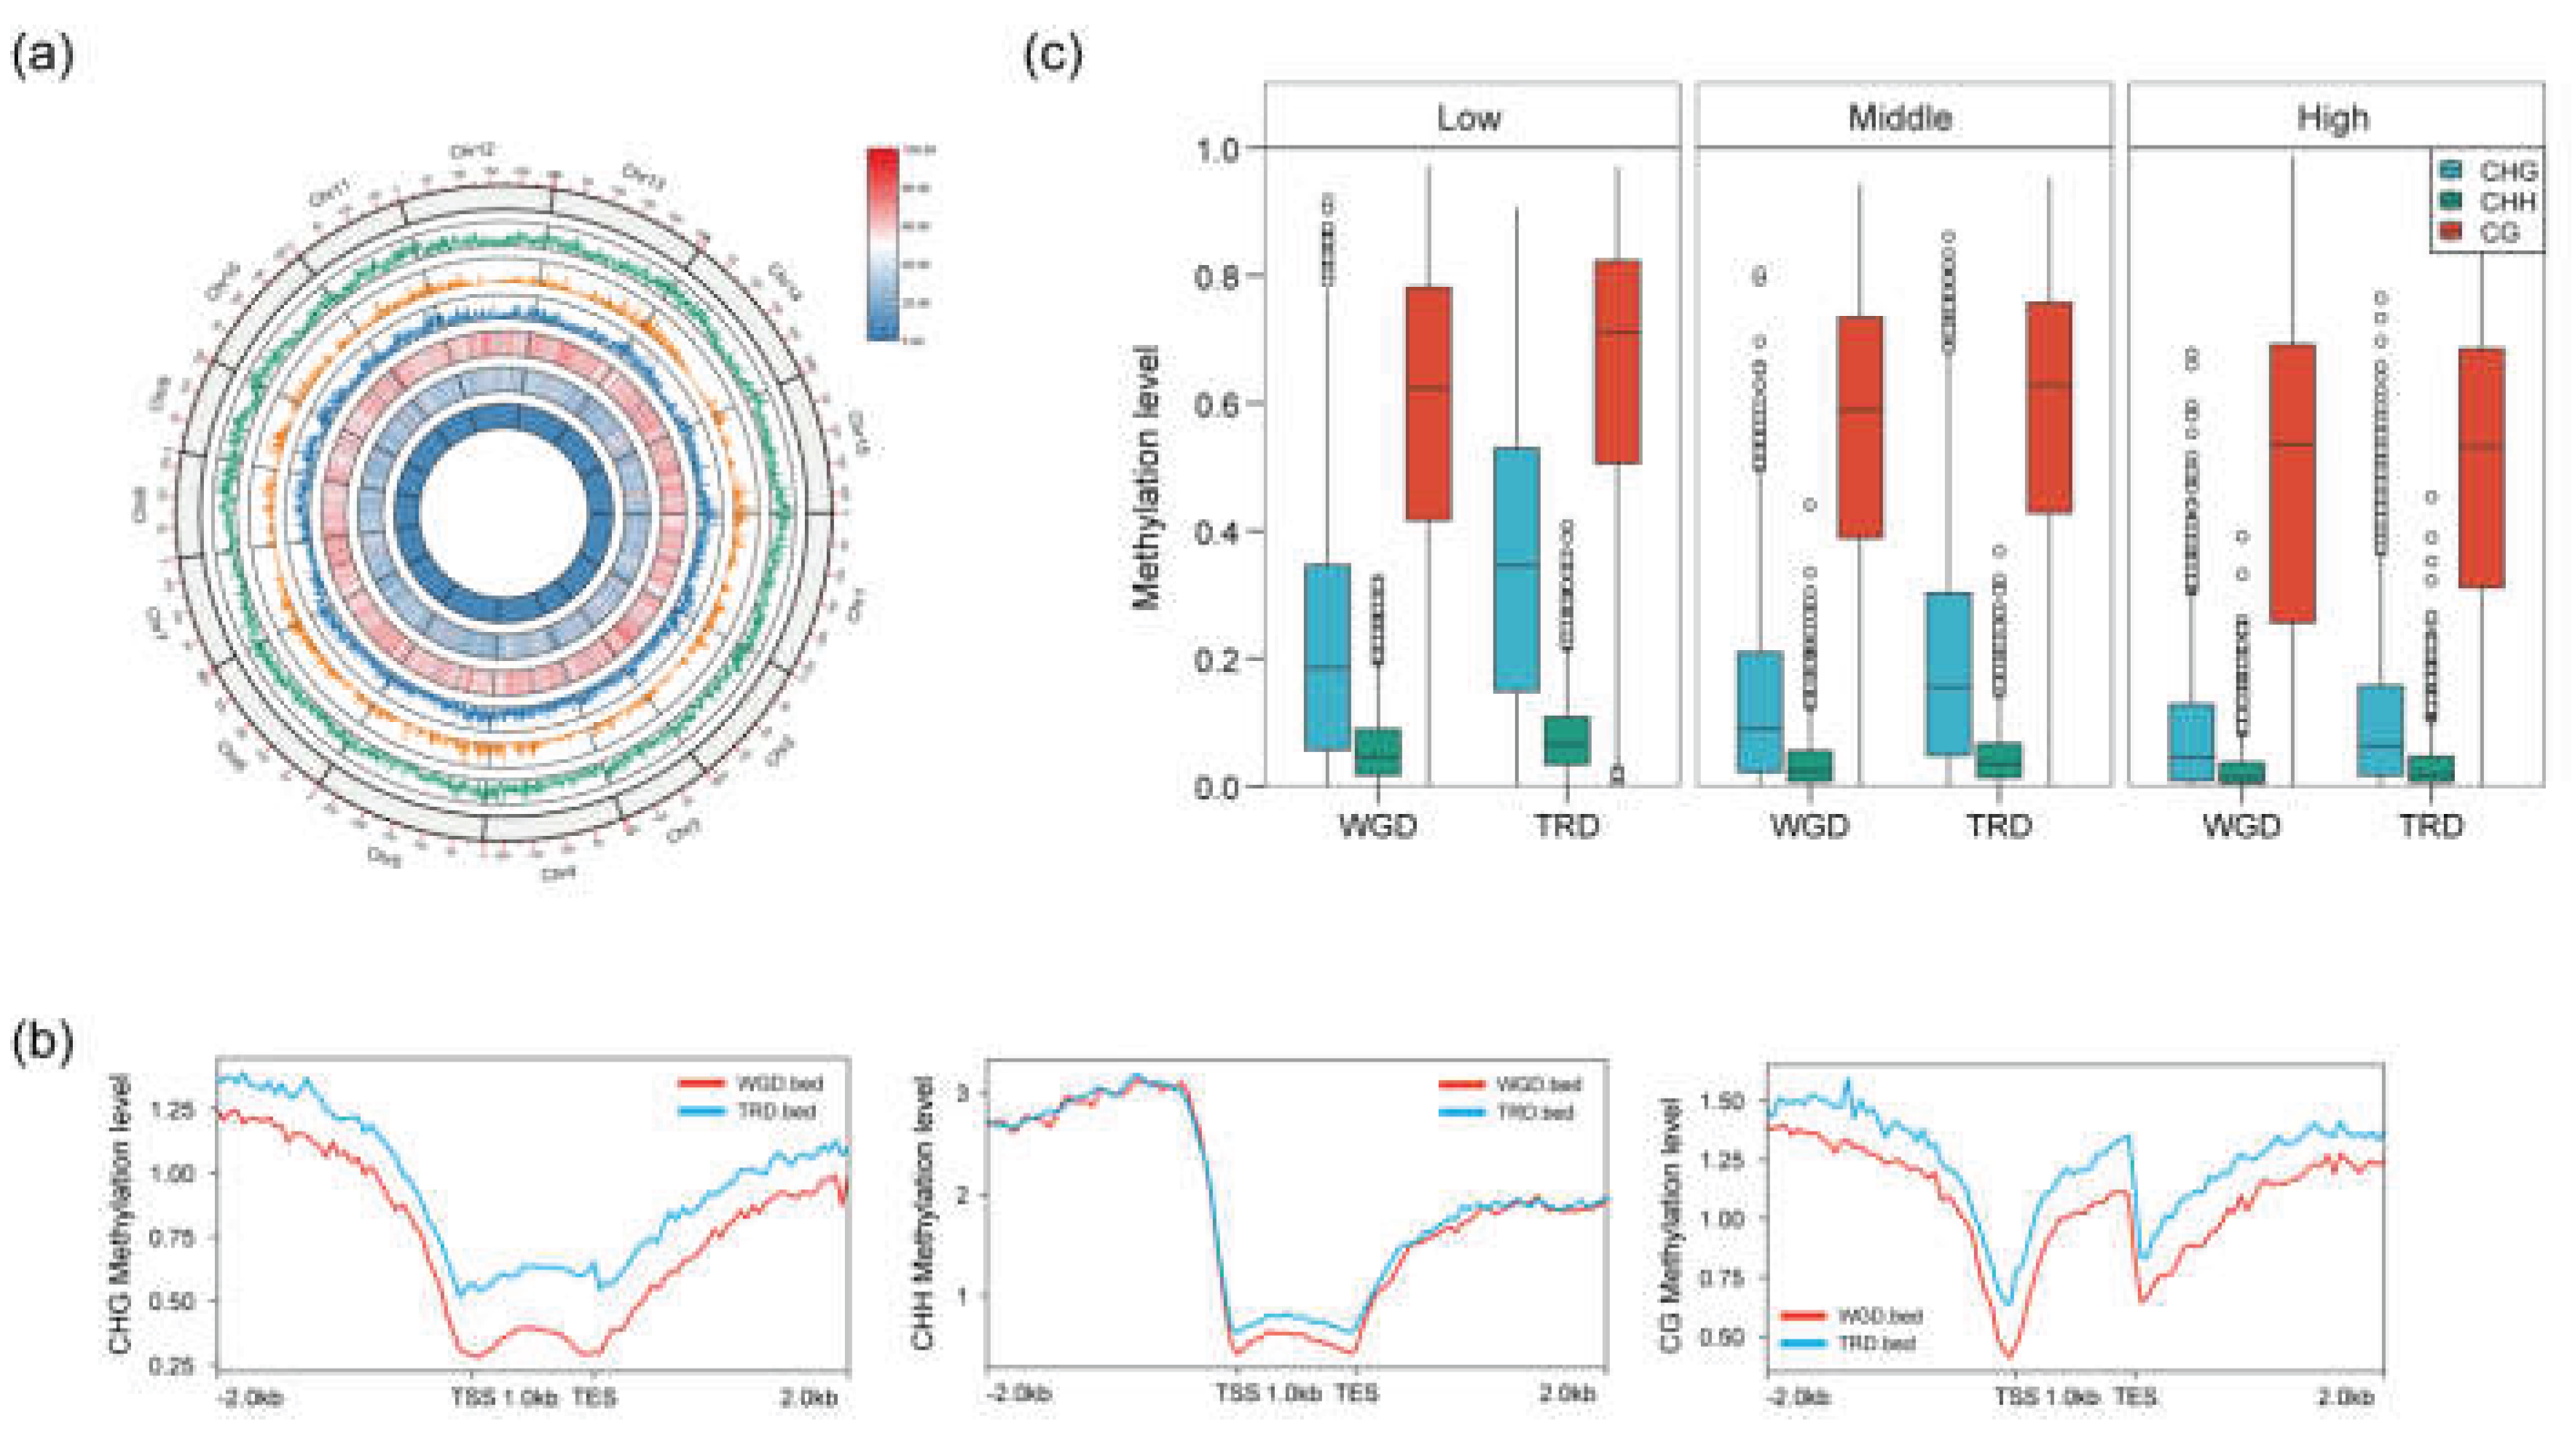
Figure 6.
Dose-dependent regulation of gene expression by ACR number in WGD and TRD genes. (a, b) Expression level distributions of WGD and TRD genes across gene body ACR number categories, respectively. (c, d) Expression level comparisons between WGD and TRD genes within the same gene body and promoter ACR number categories, respectively. Significance values were determined by the Mann–Whitney U test (*p < 0.05, **p < 0.01, ***p < 0.001).
Figure 6.
Dose-dependent regulation of gene expression by ACR number in WGD and TRD genes. (a, b) Expression level distributions of WGD and TRD genes across gene body ACR number categories, respectively. (c, d) Expression level comparisons between WGD and TRD genes within the same gene body and promoter ACR number categories, respectively. Significance values were determined by the Mann–Whitney U test (*p < 0.05, **p < 0.01, ***p < 0.001).
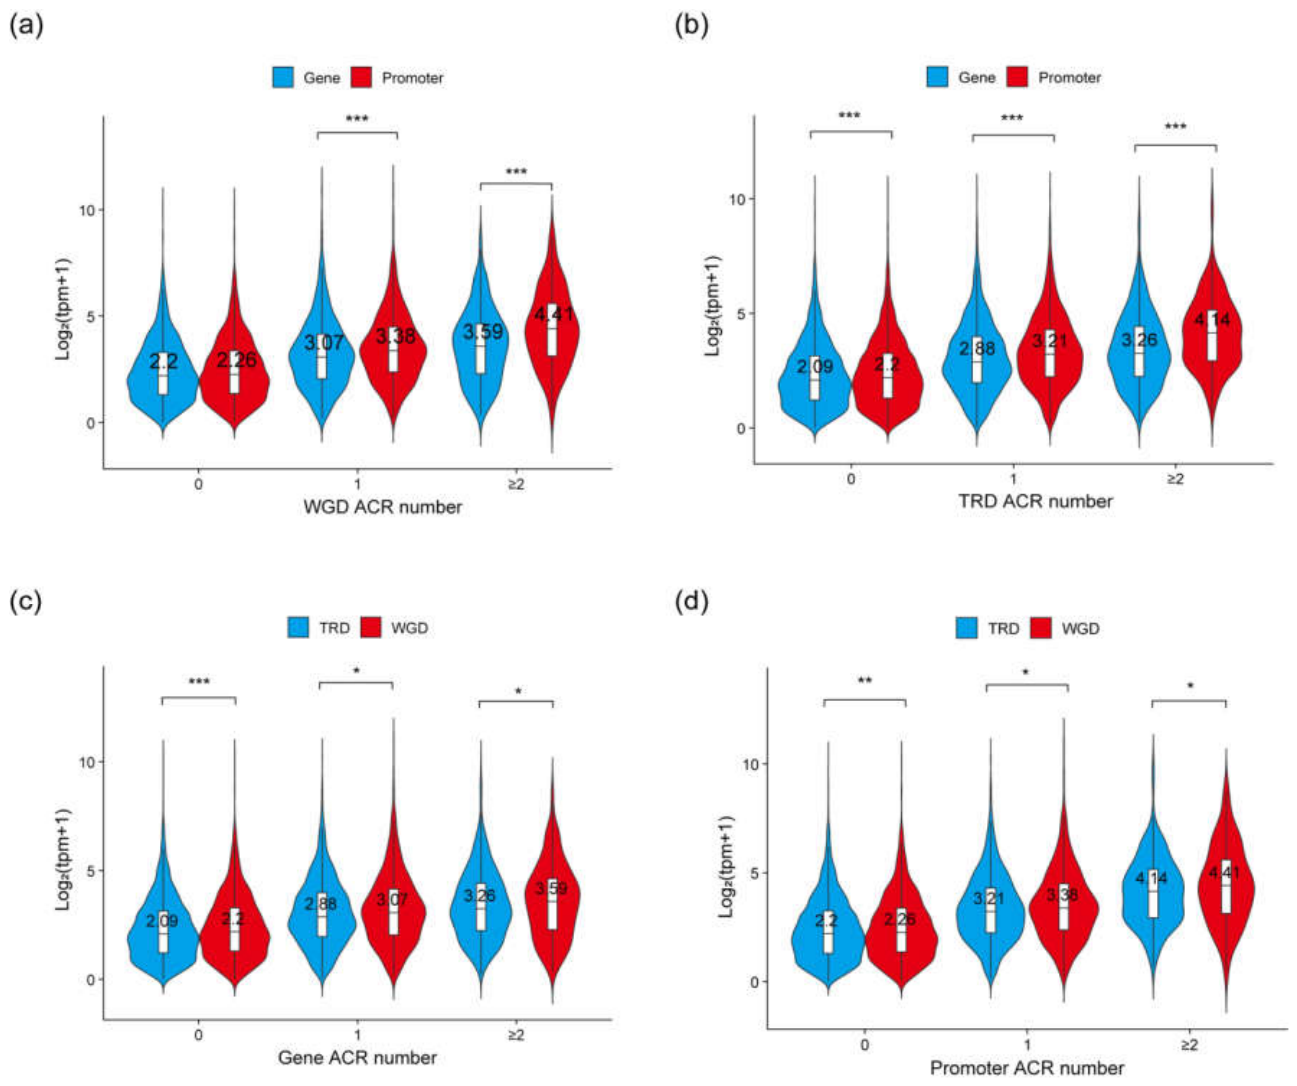
Figure 7.
Differential effects of SNP variation on expression and co-expression of WGD and TRD genes. (a) Genome-wide SNP density heatmap across 15 chromosomes. (b) Gene body and promoter SNP counts in WGD and TRD gene pairs. (c, d) Expression levels of WGD and TRD genes with versus without SNP loci, respectively. (e, f) Co-expression rates of WGD and TRD gene pairs harboring gene body and promoter-region SNPs, respectively. Error bars, bootstrapped standard errors. Significance values were determined by the Mann–Whitney U test (*p < 0.05, **p < 0.01, ***p < 0.001).
Figure 7.
Differential effects of SNP variation on expression and co-expression of WGD and TRD genes. (a) Genome-wide SNP density heatmap across 15 chromosomes. (b) Gene body and promoter SNP counts in WGD and TRD gene pairs. (c, d) Expression levels of WGD and TRD genes with versus without SNP loci, respectively. (e, f) Co-expression rates of WGD and TRD gene pairs harboring gene body and promoter-region SNPs, respectively. Error bars, bootstrapped standard errors. Significance values were determined by the Mann–Whitney U test (*p < 0.05, **p < 0.01, ***p < 0.001).
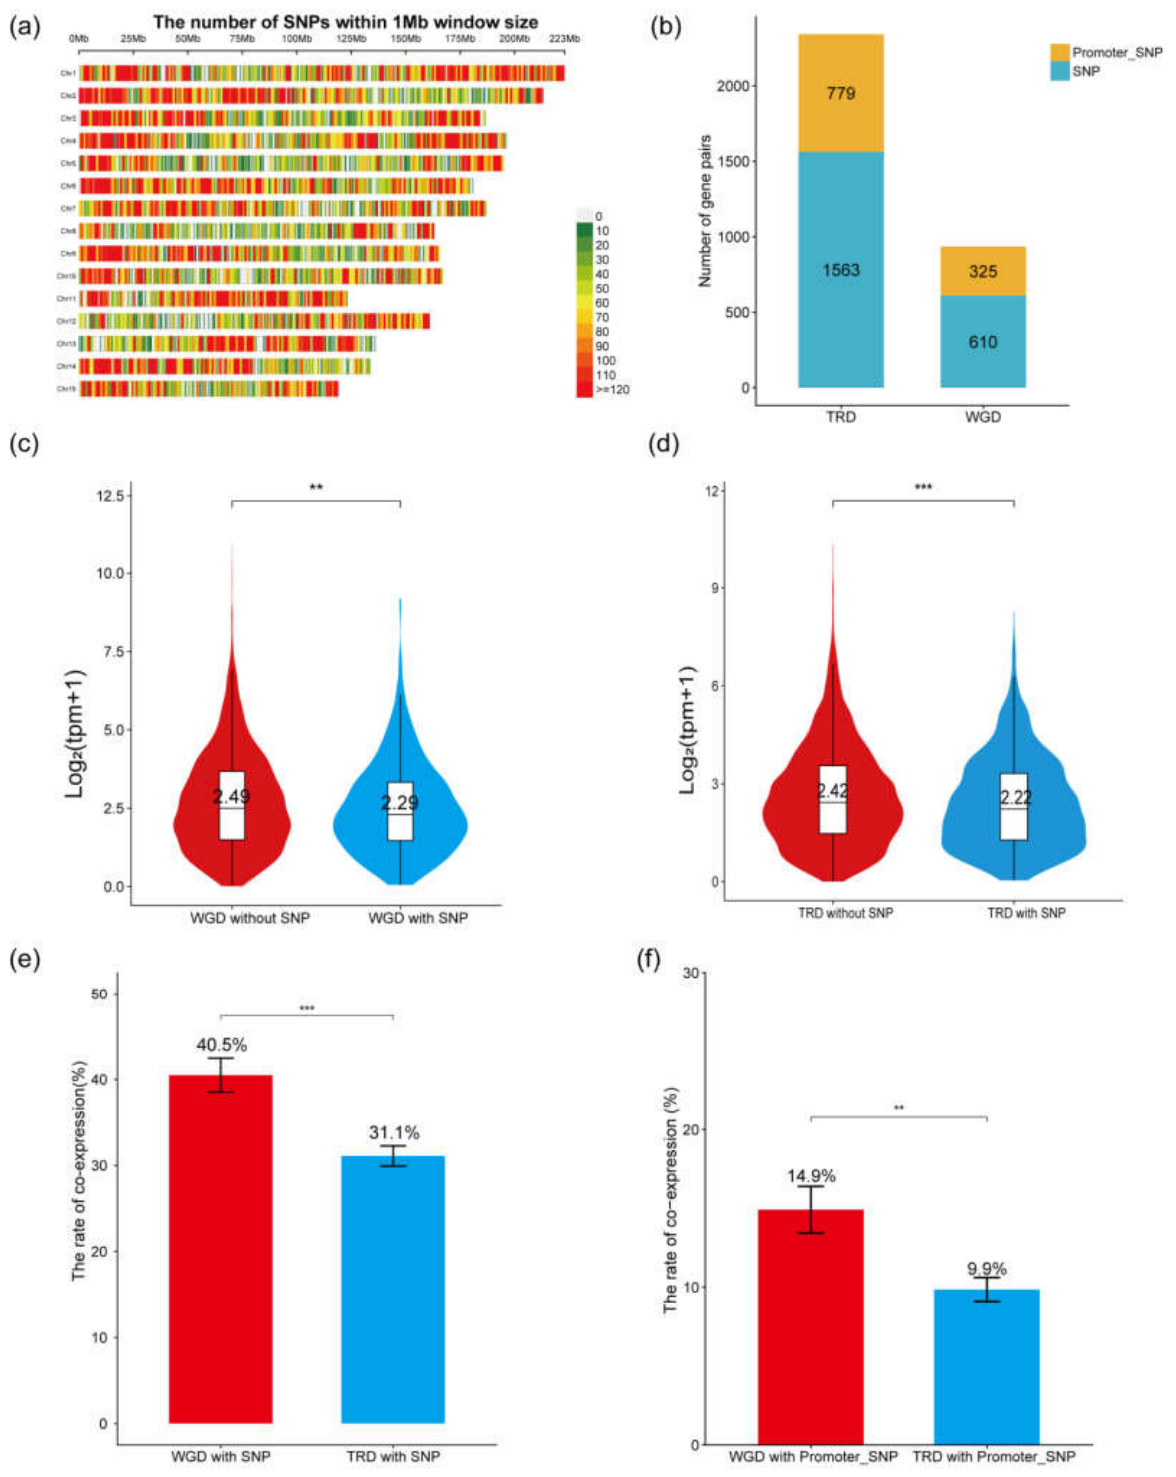
Figure 8.
WGCNA-based co-expression network analysis and catechin-associated transcription factor networks of WGD and TRD genes. (a, b) Module–trait correlation heatmaps between WGD and TRD WGCNA modules and six catechin metabolite accumulation levels, respectively. Pearson r and p-values are shown at intersections; parenthetical numbers indicate gene counts per module. (c, d) Network visualizations of hub genes from key WGD and TRD modules, respectively, with predicted transcription factors (TFs) highlighted.
Figure 8.
WGCNA-based co-expression network analysis and catechin-associated transcription factor networks of WGD and TRD genes. (a, b) Module–trait correlation heatmaps between WGD and TRD WGCNA modules and six catechin metabolite accumulation levels, respectively. Pearson r and p-values are shown at intersections; parenthetical numbers indicate gene counts per module. (c, d) Network visualizations of hub genes from key WGD and TRD modules, respectively, with predicted transcription factors (TFs) highlighted.
Disclaimer/Publisher’s Note: The statements, opinions and data contained in all publications are solely those of the individual author(s) and contributor(s) and not of MDPI and/or the editor(s). MDPI and/or the editor(s) disclaim responsibility for any injury to people or property resulting from any ideas, methods, instructions or products referred to in the content. |
© 2026 by the authors. Licensee MDPI, Basel, Switzerland. This article is an open access article distributed under the terms and conditions of the Creative Commons Attribution (CC BY) license (http://creativecommons.org/licenses/by/4.0/).
Copyright: This open access article is published under a Creative Commons CC BY 4.0 license, which permit the free download, distribution, and reuse, provided that the author and preprint are cited in any reuse.


