
Preprint
Article

This version is not peer-reviewed.

Development and Validation of an HPLC-DAD Method for the Quantification of a Melatonin- Furanochalcone Hybrid: A Pilot Biodistribution Study and Potential Therapeutic Strategy Against Colorectal Cancer

Submitted:

06 July 2026

Posted:

07 July 2026

You are already at the latest version

Abstract
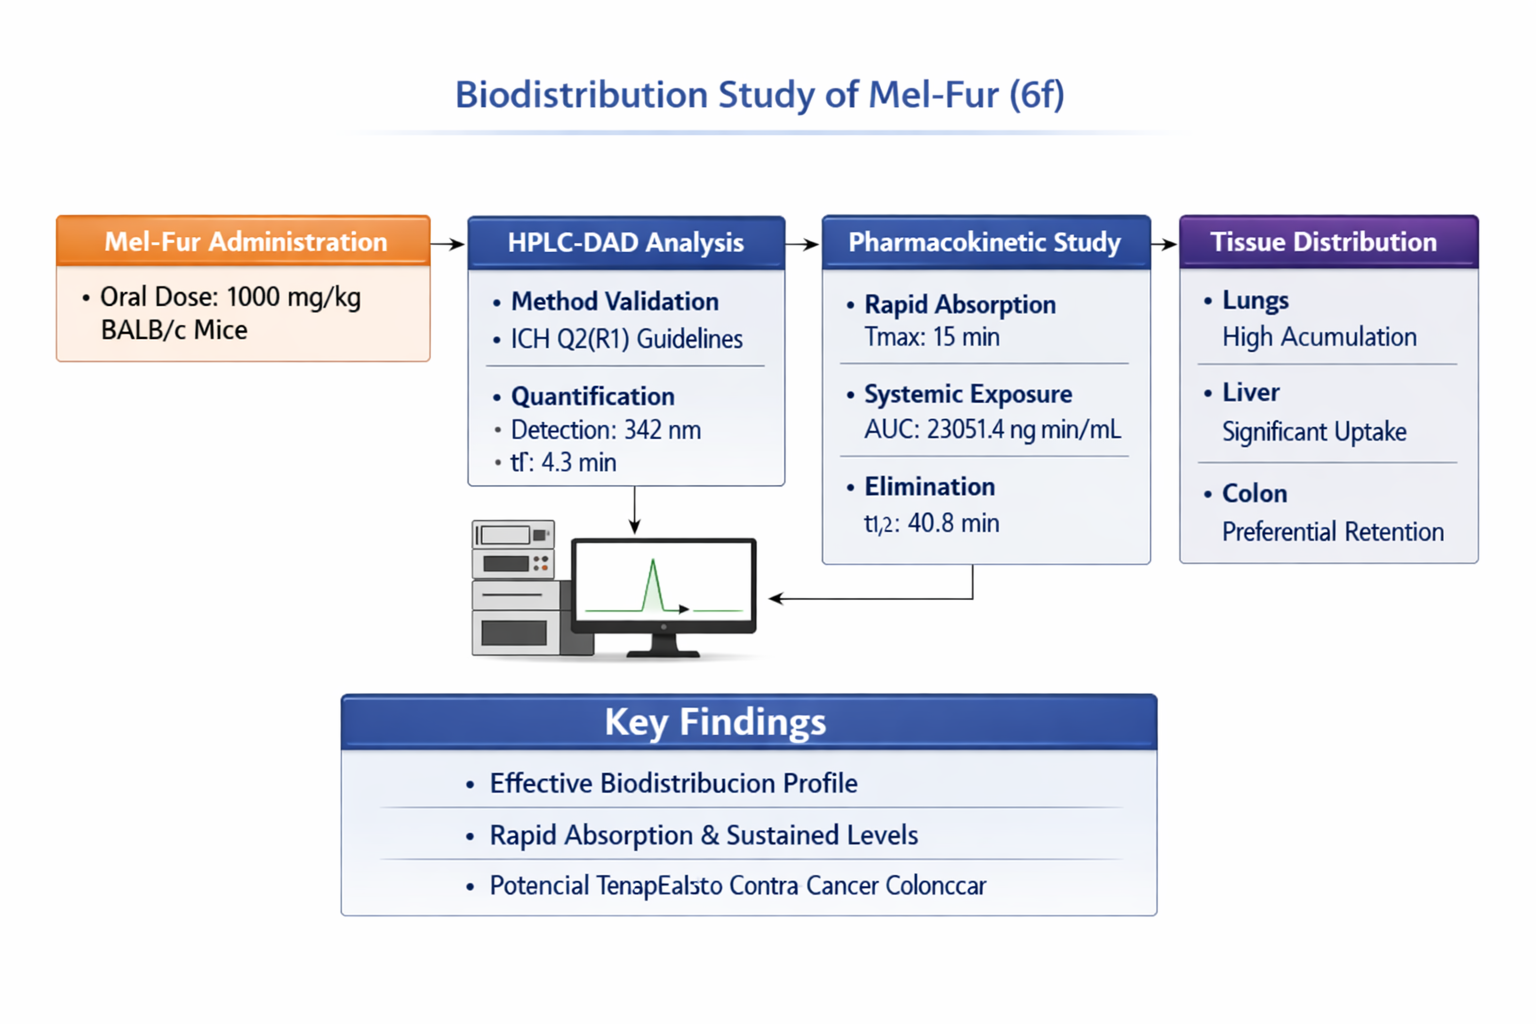
Background: Colorectal cancer (CRC) remains a major cause of cancer-related mortality worldwide and ranks third in Colombia. Despite therapeutic advances, limitations such as reduced efficacy, adverse effects, and drug resistance persist. In the search for novel ther-apeutic strategies, molecular hybridization of melatonin and furanochalcone—compounds with antioxidant and antitumor properties—led to the synthesis of a novel hybrid mole-cule Mel-Fur (6f), a promising candidate for CRC treatment. Objectives: The aim of this study was to develop and validate an HPLC-DAD analytical method for quantification of Mel-Fur in serum and murine organ matrices. Methods: Chromatographic analysis used an Agilent Series 1200 system with a diode array detector and a C30 column under opti-mized conditions: acetonitrile: water (85:15, v/v) as mobile phase, flow rate 0.8 mL/min, detection at 342 nm, retention time 4.3 min. Results: The method fulfilled ICH Q2 (R1) and FDA validation guidelines, showing high selectivity, excellent linearity (R² > 0.999), sensitivity, precision, accuracy (RE% and CV% < 15%), recovery above 93%, and analyte stability for up to 8 days. The validated method was applied in a pilot in vivo biodistribu-tion study. Following oral administration of a single dose of Mel-Fur (1000 mg/kg) in BALB/c mice, rapid absorption and elimination were observed, with measurable systemic exposure and effective distribution into peripheral tissues. Pharmacokinetic analysis re-vealed preferential accumulation in lungs and liver, with sustained presence in colon. Conclusions: These findings provide a robust analytical tool and preliminary pharmaco-kinetic insights supporting further preclinical development of Mel-Fur as a potential therapeutic candidate for CRC.
Keywords: 
;  ;  ;  ;  

1. Introduction

Colorectal cancer (CRC) is one of the leading causes of mortality worldwide and represents a major public health challenge. According to the World Health Organization [1] it is classified as the third most common type of cancer and constitutes approximately 10% of all cancer cases. CRC is also the second leading cause of death related to this disease globally in Colombia [1]. The Global Cancer Observatory (2024) reported more than 11,163 new cases and around 5,640 deaths per year from CRC. In addition, it is estimated that by 2040 the incidence of this neoplasm will increase by 70%, if effective prevention, early diagnosis, and timely treatment measures are not implemented [2].
As for treatments for CRC, they are mainly based on surgery, chemotherapy, radiotherapy, targeted therapies and immunotherapy, depending on the stage and molecular characteristics of the tumor. Although surgery is effective in early stages, in advanced stages it is required to be combined with chemotherapy and radiotherapy, generating side effects and risk of recurrence. Targeted therapies and immunotherapy have improved management in metastatic cases or those with specific genetic profiles, but their access is limited by cost and availability [3,4]. Globally and in Colombia, the main difficulty continues to be late diagnosis and low coverage of screening programs, followed by drug resistance and adverse drug reactions (ADRs) [5,6], which reduces the effectiveness of treatments and worsens survival. Therefore, this entails the search for new treatments that offer greater effectiveness and safety for patients with CRC.
In the search for new complementary strategies, the molecular hybridization of compounds with anticancer and antiproliferative activity, capable of overcoming resistance to cancer drugs and improving their pharmacokinetic properties, has been explored as a promising strategy [7]. In this context, [8] designed, synthesized, and evaluated in vitro the antiproliferative potential of hybrid molecules of chalcone and melatonin based on the biological properties reported for them; melatonin, a pineal hormone with oncostatic, antioxidant, and immunomodulatory effects [9,10] and chalcones, precursors of flavonoids, widely studied for their antitumor, anti-inflammatory, and antiproliferative activities [11,12]. The combination of both was presented as a strategy for the design of anticancer agents with greater efficacy and better pharmacokinetic profiles. From this study, compound 6f stands out, which was not only reported to have a potential antiproliferative effect against the SW480 cell line (human CRC) and non-cytotoxic effect on CHO-K1 (non-malignant), but also a possible relative oral absorption resulting from in silico pharmacokinetic modeling, reinforcing its potential as a therapeutic candidate.
It should be noted that, in order to advance in the development of molecules with therapeutic potential, it is also necessary to carry out pharmacokinetic studies of them at a preclinical level [13]. In these, different biological matrices are used to quantify the compound or molecule to be evaluated; thus, murine models are essential due to their genetic and physiological similarity to humans, as well as their ease of manipulation [14], which makes them key tools for studying pharmacokinetics in controlled environments. Likewise, it is essential to have robust, sensitive and reproducible analytical methods that enable accurate quantification in complex biological matrices, such as plasma, tissues or urine. In this sense, several analytical approaches have been developed, such as High Performance Liquid Chromatography with Diode Array Detection (HPLC-DAD). This technique has positioned itself as reliable and versatile, widely used in pharmacokinetic studies due to its high sensitivity, selectivity, specificity and reproducibility [15].
In this context, the present study aimed to develop, standardize and validate an HPLC-DAD method for the quantification of the hybrid compound melatonin-furanochalcone (6f) in mouse biological matrices; once validated, using serum and supernatants from the maceration of key organs, it was subsequently applied to a pilot pharmacokinetic and biodistribution study after the administration of a single oral dose of Mel-Fur to BALB/c mice. This procedure is a tool that seeks to support future pharmacokinetic research, biodistribution studies and clinical trials, aimed at the design of more effective and safer therapeutic strategies against colorectal cancer.

2. Results

2.1. Standardization and SST of the HPLC Method for Melatonin-Furanochalcone

The best chromatographic conditions for the determination of Mel-Fur in diluent solution, serum and organs were obtained under the parameters shown in Table 1. Similarly, the SST criteria were met in their entirety (Table 2). The main usefulness of evaluating the TSS lies in the fact that, based on the parameters of efficiency (N), resolution (Rs) and retention factor (k'), the selectivity (α) of the method is determined. The acceptance criteria established for this parameter is α > 1.1; consequently, it is confirmed that the procedure applied for the determination of Mel-Fur in biological matrices presents an adequate chromatographic selectivity, associated with analytical efficiency under the defined experimental conditions.

2.2. Validation of the Bioanalytical Methodology

2.2.1. Selectivity

The selectivity of the chromatographic analytical method was demonstrated by the fact that the chromatograms of three target samples of both the diluent solution (Figure 1, panel a-b) and the different biological matrices evaluated (Figure 1, panel c-j) did not show visible, quantifiable, or interfering signals in the retention interval of the analyte, attributable to endogenous compounds.

2.2.2. Calibration curves

Highly reproducible calibration curves were obtained for Mel-Fur in diluent, serum and organs, with seven standard concentrations distributed between 40 and 2560 ng/mL (Figure 2, panel a); prepared in triplicate (diluent solution and serum) and in duplicate (organs) and analyzed according to the experimental protocol. The equations of the lines (Figure 2, panel B) obtained from the calibration curves were used to calculate experimental concentrations (Table 3, panel a). All curves had correlation coefficients greater than 0.999 and ER% and CV% values of less than 15% (Table 3), complying with the acceptance criteria of the [16], which validates the applicability of the linear model.

2.2.3. Sensitivity (LOQ and LOD)

The sensitivity of the method was evaluated by extrapolating the calibration curve to zero concentration, using five points at low concentrations (30–50 ng/mL), with triplicate analysis in serum and organs. From this curve, the signal-to-noise ratio, the standard deviation of the signal and the slope were calculated. The LOQ and LOD values are presented in Table 4.

2.2.4. Accuracy and Precision

These parameters were evaluated at the interassay level in serum (triplicate) and organs (doubled) for three consecutive days, with three concentrations: low (80 ng/mL), medium (320 ng/mL) and high (1280 ng/mL). The values of ER%, for accuracy, and CV%, for precision, were less than 15% (Table 5), meeting the acceptance criteria of the ICH guideline Q2(R1) [16].

2.2.4. Recovery Percentage

This parameter was evaluated at three concentrations of Mel-Fur (80, 320, and 1280 ng/mL) and calculated by comparing the peak area of the compound extracted from biological matrices with that obtained from the standard solution. The recovery percentages are shown in Table 6, with %CV values below 15%.

2.2.5. Sample Stability

This parameter was evaluated by monitoring standard solutions at three concentration levels (low, medium, and high), stored in the autosampler at room temperature. The compound areas extracted from biological matrices at different time intervals (1, 2, 3, and 8 days) were compared with the baseline matrix. Results were expressed as relative recovery percentages (RRB%). RRB% values remained within the acceptable range (89–107%), and coefficients of variation were less than 15% in serum and organs for all times evaluated (Supplementary Materials, Table S6), meeting the criteria of [16]. The validation results in seven additional matrices (heart, spleen, kidneys, stomach, small intestine, cecum, and brain) are presented in Supplementary Materials, Table S7. In gastrointestinal organs, quantification was only possible in the colon, since in the stomach, small intestine, and cecum the signals were unquantifiable due to oral administration.

2.3. Application to Pharmacokinetic Studies and Tissue Distribution

The validated HPLC-DAD method was applied to characterize the pharmacokinetic profile and tissue distribution of Mel-Fur after a single oral administration in mice. Plasma profiles and concentration–time curves in tissues are shown in Figure 3, while the corresponding plasma pharmacokinetic parameters are summarized in Table 7. Analysis of these parameters revealed a maximum plasma concentration (Cmax) of 172 ng/mL at 15 min (Tmax), indicating rapid absorption and transient systemic exposure, followed by distribution in peripheral tissues. Total exposure (AUC₀–∞ = 23051.4 ng·min/mL) suggests a measurable systemic presence. The apparent volume of distribution (Vd-F) was 2.55 L/kg, and clearance (CLF) was 43.4 mL/min/kg. The elimination half-life (t1/2) was 40.8 min, with an elimination rate constant (Ke) of 0.017 min⁻¹.
In tissue pharmacokinetic analysis, Mel-Fur showed tissue-specific distribution patterns. In the lungs, a peak concentration was observed at 10 minutes, followed by a marked decline and sustained stagnation, with higher concentrations compared to other matrices (Figure 3, panel b). In the liver, an initial high concentration was detected at 5 minutes, followed by a rapid decline and slower elimination (Figure 3, panel c). Progressive accumulation was observed in the colon up to 240 minutes (Figure 3, panel d).

3. Discussion

These chromatographic parameters coincide with those reported by [17], who established optimal conditions for the quantification of melatonin in plasma, and with methodologies validated by [18] and [19] in dietary supplements and biological matrices. The matching of parameters confirms the reproducibility of the RP-HPLC approach and supports its applicability in the determination of Mel-Fur in serum and organs. However, to date, no specific reports have been found on the quantification of furanochalcones by HPLC in biological matrices, highlighting the novelty of this study.
The absence of interfering signals in chromatograms of diluent solution and biological matrices confirm that endogenous compounds did not compromise analyte identification or quantification. This selectivity is crucial to guarantee applicability in real samples, minimizing the risk of false positives or erroneous quantifications.
The variability observed in sensitivity parameters is mainly associated with matrix effects in plasma and tissues, a phenomenon also reported in previous studies [20]. This consistency with earlier findings reinforces the robustness of the method. Moreover, the ability to detect and quantify low concentrations of the analyte in different biological matrices confirms the reliability of the procedure, which is particularly relevant for pharmacokinetic and tissue distribution studies, where analyte levels are typically very low.
The compliance of ER% and CV% values with ICH acceptance criteria demonstrates that the method can precisely and accurately quantify analytes across different biological matrices. This performance indicates that matrix-related variability does not significantly affect the reliability of the procedure over time. Consequently, the method is suitable for long-term pharmacokinetic and tissue distribution studies.
Although recovery is not a mandatory requirement in all validation guidelines, its inclusion as a complementary criterion strengthens the robustness of the method. The consistency of recovery values across concentrations, together with %CV below 15%, supports the reliability of the procedure to quantify Mel-Fur under real conditions. This indicates that the analyte does not undergo significant losses during extraction, which is particularly relevant for pharmacokinetic and tissue distribution studies where accurate quantification in complex biological matrices is essential.
The stability results confirm that under typical sample handling and storage conditions, the integrity of Mel-Fur is preserved, supporting its applicability in prolonged quantification studies. The consistency of RRB% values across multiple matrices demonstrates that the method is robust against degradation or matrix-related variability. Together, these findings reinforce the reliability of the HPLC-DAD method for long-term pharmacokinetic and tissue distribution analyses.
The pharmacokinetic profile demonstrates rapid absorption of Mel-Fur, as reflected by the short Tmax and relatively high Cmax. Although systemic exposure was measurable, the absence of intravenous data prevented the calculation of absolute bioavailability, a limitation associated with the solubility of the hybrid compound. The relatively high apparent volume of distribution (Vd-F) indicates extensive tissue distribution, consistent with previous murine studies [21], and supported by the tissue concentration profiles. Clearance values align with the efficient elimination typically observed in small mammals [21,22]. which is further reflected in the short half-life and elimination rate constant. Together, these findings confirm that Mel-Fur undergoes rapid systemic elimination while maintaining sufficient distribution to peripheral tissues, supporting its potential relevance in pharmacokinetic and tissue distribution studies.
The distribution profile suggests preferential retention in lung tissue, possibly related to its high perfusion and affinity [23]. The rapid decline in the liver is consistent with active metabolism, reducing the concentration of the intact analyte compared to accumulation tissues [24]. Sustained accumulation in the colon highlights biodistribution in the gastrointestinal tract and supports potential therapeutic relevance in colorectal cancer. These pharmacokinetic and biodistribution patterns resemble those reported for the individual components: melatonin shows rapid plasma decline and hepatic absorption [24], while chalcones exhibit gastrointestinal distribution [25]. The sustained accumulation in the colon may be associated with melatonin’s affinity for immunologically active tissues [26,27], as well as with the gastrointestinal distribution characteristic of chalcones. The limited availability of previous studies on furanochalcones in healthy models underscores the exploratory nature of this work. Taking together, these findings suggest that Mel-Fur could have therapeutic potential targeting the lung, liver, and colon.

4. Materials and Methods

4.1. Chemicals, Reagents & Instruments

4.1.1. Equipment & Instruments

An Agilent Series 1200 chromatographic system (Agilent Technologies-Germany) was used, consisting of a quaternary pump, and an Agilent SL diode array (UV-DAD) DE-TEC-TOR, for data acquisition the ChemStation Open Lab CDS software (Agilent, Germa-ny) was used. Other devices included: an E 60 H ultrasonic device (Elmasonic), Sorvall ST 8/8R C centrifuge (Thermo Scientific), FA2004 electronic analytical balance, Barnstead Ther-molyne Maxi Mix II vortex mixer, 10, 200 and 1000 μL micropipettes, gentleMACS™ Dis-sociator homogenizer and Milli Q Direct 16 equipment, Millipore™.

4.1.2. Estándares y Reactivos

The hybrid Melatonin-Furanochalcone 6f (Mel-Fur) was used as a standard product, as shown in Figure 4, supplied by Química de Plantas Colombianas research group of the University of Antioquia (Medellín, Antioquia). The study used Acetonitrile (HPLC-pure), Dimethyl Sulfoxide (DMSO) (Merck), PBS (Phosphate Buffered Saline) 1x Sterile (Thermo Scientific Chemicals), Sodium Chloride (NaCl), Solution 8.0 Ethylenediaminetetraacetic Acid (EDTA) 1.6 foot PH (RPI, Corp.), Tris base (Merck), Triton® X-100 CAS (Merck), Sodium Dodecyl Sulfate (SDS) (PanReac AppliCheam), PEG 400 (Polyethylene Glycol 400) (Merck), Cremophor (Merck), Ethanol (EtOH) (Merck) and ultrapure water type I 1 (Milli Q Direct 16 equipment, MilliporeTM).

4.2. Preparation of Standard Solutions

A primary standard was prepared by dissolving 10 mg of Mel-Fur in 1 mL of DMSO, stirred in vortex (1 min) and subjected to ultrasound (10 min), obtaining a stock solution of 10 mg/mL. From this, standard curves were elaborated in mobile phase (acetonitrile:water) and in biological matrices (serum and supernatants of murine organ macerate). From the stock solution, 32 μL were taken in 1 mL of mobile phase, from there a 1:10 dilution was made from this dilution 32 μl were taken, obtaining the point of highest concentration (2560 ng/mL). The other points were obtained by serial dilutions up to 40 ng/mL.

4.3. Animals

Male (23-27 g) and female (18-22 g) BALB/c mice, 8-10 weeks of age, were used; which were kept in the vivarium of the Corporación para Investigaciones Biológicas-CIB under controlled conditions (cycle 12 h light/12 h dark, 22 °C, 60–70% humidity), with permanent access to sterile acidified water (0.01% HCl) and specific diet for rodents (LabDiet).
All the procedures were approved by the Bioethics Committee of the University of Santander (UDES), within the framework of the Preclinical Project 92391 of Program 92332 endorsed by Minciencias, entitled "Progress in the development of preventive and therapeutic alternatives based on nanobioconjugates for the treatment of colorectal cancer in Colombia. NanoBioCancer 2.0 GAT 2", with institutional ethical support for its implementation in murine models for therapeutic purposes.

4.4. Biological Sample Collection and Processing

For the validation of the method by HPLC-DAD, pools of each biological matrix (serum and organs), normalized by weight, were prepared from individual samples, in order to obtain a homogeneous representation for the analytical assays. While, for the pharmacokinetic study, the biological matrices were processed individually.
Whole blood was obtained from each animal by cardiac puncture under anesthesia (ketamine 50 mg/kg + xylazine 20 mg/kg), followed by euthanasia for cervical dislocation and harvesting of major organs (brain, lungs, heart, kidneys, spleen, liver, stomach, small intestine, cecum and colon). Serum was obtained by centrifugation (12,000 rpm, 10 min) and organ samples were homogenized in lysis buffer (NaCl 150 mM, EDTA 5 mM, Tris 50 mM, Triton X-100 1% and SDS 0.1%) using a disintegrator, sonicated 10 min and centrifuged (13,000 rpm, 15 min). The supernatants and sera were stored at −20 °C until final processing, as shown in Figure 5.
Finally, for validation, serum samples and supernatants from organ maceration were doped with the compound of interest, treated with acetonitrile for protein precipitation (1:1 v/v), vortex agitation (30 s) and centrifugation (13,000 rpm, 15 min). The supernatant was filtered by a 0.45 μm membrane, transferred to vials and subsequently injected into the HPLC system for analysis.

4.5. Chromatographic Conditions

For the analytical separation, the HPLC-DAD technique was used with a Thermo Scientific Acclaim C30 column (4.6×150 mm, 5 μm). Standardization included the evaluation of conditions such as column type, mobile phase, flow, temperature, injection volume, wavelength, and run and detection time, optimized for the identification and quantification of the hybrid compound. Additionally, the suitability of the system was verified through System Suitability Test-SST (USP〈621〉) tests [28], considering parameters such as the number of theoretical dishes, resolution, retention factor and selectivity. In addition, tests were carried out on biological matrices to confirm the selectivity of the retention time of the method.

4.6. Validation of the Analytical Method

The developed method was validated in compliance with all the acceptance criteria established and recommended by the FDA, in accordance with the ICH Q2 (R1) guideline [16]. The parameters evaluated included linearity, selectivity, accuracy, precision, limit of detection (LOD), limit of quantification (LOQ), recovery, and stability of the sample.

4.7. Biodistribution Study (pilot): Pharmacokinetic Application

According to previous toxicological and experimental studies carried out at the CIB, the conditions of formulation and administration of the compound were optimized for its pharmacokinetic evaluation. The lethal dose 50 (LD₅₀) of the compound was greater than 2000 mg/kg, indicating low acute toxicity. A dose of 1000 mg/kg was selected for pharmacokinetic assays, considering solubility restrictions and previous tolerability data. A single oral dose of 1000 mg/kg, corresponding to a concentration of 125 mg/mL, was administered using the following formulation: PEG 400 (33.3%) [29], Cremophor® (20%) [30], and ethanol (EtOH, 46.7%) [31].
In this pilot trial, 9 female mice of 10 weeks of age were used, one for each time point: 0, 5, 7.5, 10, 15, 30, 60, 120 and 240 minutes. At each interval, blood and organ samples were collected, which were then processed and analyzed to assess the distribution of the compound in the different biological matrices, as detailed in section 4.4 (Figure 5).
Pharmacokinetic parameters were calculated using non-compartmental analysis in Microsoft Excel. The following parameters were determined: maximum plasma concentration (Cmax), time to reach Cmax (Tmax), area under the curve until the last measured time (AUC0-240 min), area under the curve extrapolated to infinity (AUC0-∞), elimination half-life (t1/2), elimination constant (Ke), absorption constant (Ka), clearance adjusted for bioavailability and body weight (CLF) and apparent volume of distribution adjusted for bioavailability (Vd-F).

4.8. Statistical Analysis

For the validation of the method, means, standard deviations (%SD), coefficients of variation (%CV) and relative percentage errors (RE) were calculated. In the pilot pharmacokinetic study, Mel-Fur concentrations were analyzed descriptively, as each time point corresponded to a single animal. This design, in which only one mouse was used per sampling time, prevents statistical inference and limits the assessment of variability between individuals, thus restricting the possibility of robust statistical analyses. Data analysis was performed using GraphPad Prism version 10 (GraphPad Software, San Diego, CA, USA).

5. Conclusions

The HPLC-DAD method developed and validated for the quantification of Mel-Fur in diluent solution, serum, and homogenates from murine organs met the FDA acceptance criteria, demonstrating high selectivity, sensitivity, accuracy, linearity, and stability. The optimized chromatographic conditions allowed the reliable detection of the analyte without endogenous interference, with excellent linearity (R² > 0.999), high recovery (>93%) and low variability (<15%), confirming its suitability for quantification and biodistribution studies in complex biological matrices.
The pilot pharmacokinetic study provided an initial characterization of the tissue distribution profile of Mel-Fur in serum, lungs, liver, and colon, offering preliminary information on its absorption, biodistribution, and elimination. The compound showed rapid absorption and elimination, measurable systemic exposure, preferential distribution in lungs and liver, and sustained presence in the colon, indicating matrix-dependent pharmacokinetic behavior.
Together, these findings establish a robust analytical platform and provide a fundamental understanding of the pharmacokinetic profile of Mel-Fur, supporting its development and optimization as a potential therapeutic agent, especially for applications affecting the lungs, liver, and colorectal tissues.

Supplementary Materials

The following supporting information can be downloaded at: https://www.mdpi.com/article/doi/s1, Figure S1: Representative chromatogram of the SST parameters. This chromatogram was used to demonstrate the suitability of the chromatographic method.; Table S1: Average organ weight of healthy female and male BALB/c mice; Figure S2: Representative chromatograms of white and Mel-Fur-doped samples at 320 ng/mL, respectively: (a), (b) heart; (c), (d) spleen; (e), (f) kidneys; (g), (h) stomach; (i), (j) small intestine; (k) (l) cecum and (m) (n) brain. These chromatograms were used to demonstrate the selectivity of the chromato-graphic method; Table S2: Results obtained from the linearity analysis according to the calibration curves performed for Mel-Fur in organs; Table S3: Analytical sensitivity parameters: limit of quantification (LOQ) and limit of detection (LOD) in organs; Table S4: Evaluation of organ precision and accuracy for three consecutive days; Table S5: Percentage of recovery of Mel-Fur in serum and organs; Table S6: Results of the stability of Mel-Fur in serum and key organs according to time spent in the injector; Table S7: Evaluation of the stability of Mel-Fur in organs according to time spent in the injector.

Author Contributions

Conceptualization, Estefany DJ Silva-G and JD Zapata; methodology, Estefany DJ Silva-G, JD Zapata, Andrés F. Yépez, Wilson Cardona-G and Tonny W. Naranjo; validation, Estefany DJ Silva-G and JD Zapata; formal analysis, Estefany DJ Silva-G, JD Zapata and Tonny W. Naranjo; investigation, Estefany DJ Silva-G, JD Zapata, Andrés F. Yépez, Wilson Cardona-G and Tonny W. Naranjo; resources, Tonny W. Naranjo; data curation, Juan D. Zapata and Tonny W. Naranjo; writing—original draft preparation, Estefany DJ Silva-G and JD Zapata; writing—review and editing, Estefany DJ Silva-G, JD Zapata and Tonny W. Naranjo; visualization, Estefany DJ Silva-G and JD Zapata; supervision, Tonny W. Naranjo; project administration, Juan D. Za-pata and Tonny W. Naranjo; funding acquisition, Tonny W. Naranjo. All authors have read and agreed to the published version of the manuscript.

Funding

This research was funded by THE MINISTRY OF SCIENCE, TECHNOLOGY AND INNOVATION (MINCIENCIAS), by Preclinical Project No. 92391, under Program No. 92332, within the framework of the project entitled “Progress in the development of preventive and therapeutic alternatives based on nanobioconjugates for the treatment of colorectal cancer in Colombia” (NanoBioCancer 2.0 GAT 2.0), Code 121092092332, Contract No. 621-2022.

Institutional Review Board Statement

The study was conducted in accordance with the Declaration of Helsinki and approved by the Ethics Committee of Universidad de Santander (UDES), Medellín, Colombia (Protocol Code: VII-FT-012-UDES; Date of Approval: 17 May 2022).

Data Availability Statement

Data Availability Statement: The data presented in this study are available from the corresponding author upon reasonable request.

Acknowledgments

Corporación para Investigaciones Biológicas (CIB), United of Micología Médica y Experimental, Medellín, Colombia. Universidad de Antioquia, Medellín, Colombia. Universidad Pontificia Bolivariana (CIDI-UPB). Preclinical Project 92391, belonging to Program 92332, endorsed by the Ministry of Sciences.

Conflicts of Interest

The authors declare no conflict of interest.

Abbreviations

The following abbreviations are used in this manuscript:
ADRs Adverse Drug Reactions
AUC Area under the curve
AUC₀₋∞ Sum of AUC₀₋t + AUCt₋∞
AUC₀₋t Area under the curve from time zero to the last point measured
AUCt₋∞ Area under the curve extrapolated to infinity
CCR Colorectal cancer
CLF Clearance
Cmax Maximum concentration
CHO-K1 Chinese hamster ovary cell line
CV Coefficient of variation
FDA Food and Drug Administration
HPLC-DAD High-Performance Liquid Chromatography with Diode-Array Detection
ICH International Conference on Harmonisation
ICH Q2 (R1) Analytical validation guide
Ka Absorption constant
Ke Elimination ocnstant
LD50 Lethal dose 50
LOD Detection limit
LOQ Limit of quantification
RE Relative percentage rrror
SST System suitability test
SW480 Human colorectal cancer cell line
Tmax Time to reach maximum concentration
t1/2 Elimination half-life
USP United States Pharmacopeia
VDF Apparent volume of distribution

References

  1. World Health Organization. Colorectal cancer [Internet]. Geneva: WHO; 2023 [cited 2026 Jan 25]. Available from: https://www.who.int/es/news-room/fact-sheets/detail/colorectal-cancer.
  2. Ferlay, J.; Ervik, M.; Lam, F.; Laversanne, M.; Colombet, M.; Mery, L. Global Cancer Observatory: Cancer Today [Internet]. Lyon (FR): International Agency for Research on Cancer; 2024 [cited 2026 Feb 2].
  3. Fadlallah, H.; El Masri, J.; Fakhereddine, H.; Youssef, J.; Chemaly, C.; Doughan, S.; et al. Colorectal cancer: recent advances in management and treatment. World J. Clin. Oncol. 2024, 15(9), 1136–56. [Google Scholar] [CrossRef] [PubMed]
  4. Kumar, A.; Gautam, V.; Sandhu, A.; Rawat, K.; Sharma, A.; Saha, L. Current and emerging therapeutic approaches for colorectal cancer: a comprehensive review. World J. Gastrointest. Surg. 2023, 15(4), 495–519. [Google Scholar] [CrossRef] [PubMed]
  5. Montané, E.; Santesmases, J. Adverse drug reactions. Med. Clin. (Barc) 2020, 154(5), 178 84. [Google Scholar] [CrossRef] [PubMed]
  6. National Library of Medicine (US). Carcinoid syndrome [Internet]. MedlinePlus; 2016 [cited 2026 Feb 5].
  7. Laza Loaces, D.; Rodríguez Luis, I.; Sardiña Cabrera, G. Descubrimiento y desarrollo de agentes anticancerígenos derivados de plantas medicinales [Discovery and development of anticancer agents derived from medicinal plants]. Rev. Cuba. Plant Med. [Internet] 2003, 8(3). [Google Scholar]
  8. Yepes, A.F.; Arias, J.D.; Cardona-G, W.; Herrera-R, A.; Moreno, G. New class of hybrids based on chalcone and melatonin: a promising therapeutic option for the treatment of colorectal cancer. Med. Chem. Res. 2021, 30(10), 1807–20. [Google Scholar] [CrossRef]
  9. Reiter, R.J.; Tan, D.X.; Manchester, L.C.; Tamura, H. Melatonin defeats neurally-derived free radicals and reduces the associated neuromorphological and neurobehavioral damage. J. Physiol. Pharmacol. 2007, 58 (Suppl 6), 5–22. [Google Scholar] [PubMed]
  10. Li, Y.; Li, S.; Zhou, Y.; Meng, X.; Zhang, J.J.; Xu, D.P.; et al. Melatonin enhances radiofrequency-induced NK antitumor immunity, causing cancer metabolism reprogramming and inhibition of multiple pulmonary tumor development. Signal Transduct. Target Ther. 2021, 6, 330. [Google Scholar] [CrossRef] [PubMed]
  11. Pasquale, G.A.; Ruiz, D.M. Métodos de síntesis de chalconas. Inv Joven Available from: https://revistas.unlp.edu.ar/InvJov/article/download/14090/12939/51142. 2022, 9(1), 1–10. [Google Scholar]
  12. Nowakowska, Z. A review of anti-infective and anti-inflammatory chalcones. Eur. J. Med. Chem. 2007, 42(2), 125–37. [Google Scholar] [CrossRef] [PubMed]
  13. Noda Albelo, A.L.; Vidal Tallet, A. Farmacocinética y farmacodinamia, implicación en un uso más racional de los antimicrobianos. Rev. Cub Farm. 2010, 44(4), 533–46. [Google Scholar]
  14. Rosenthal, N.; Brown, S. The mouse ascending: perspectives for human-disease models. Nat. Cell Biol. 2007, 9(9), 993–9. [Google Scholar] [CrossRef] [PubMed]
  15. Ahmed, R. High-Performance Liquid Chromatography (HPLC): principles, applications, versatility, efficiency, innovation and comparative analysis in modern analytical chemistry and in pharmaceutical sciences. Clin. Invest (Lond) 2024, 14(9), 524–35. [Google Scholar] [CrossRef]
  16. International Conference on Harmonisation. Validation of analytical procedures: text and methodology Q2(R1) [Internet]. Geneva: ICH; 2005.
  17. Martins, L.G.; Mainardes, R.M. Application of a validated HPLC-PDA method for the determination of melatonin content and its release from poly (lactic acid) nanoparticles. J. Pharm. Anal. 2017, 7(6), 388–93. [Google Scholar] [CrossRef] [PubMed]
  18. Peikova, L.; Tzankova, D.; Stancheva-Zlatkova, M.; Zlatkov, A. Development of RP-HPLC methods for the analysis of melatonin alone and in combination with sleep-enhancing dietary supplements. Pharmacia 2024, 71, 1–7. [Google Scholar] [CrossRef]
  19. Smerikarova, M.; Bozhanov, S.; Maslarska, V. Simultaneous determination of pentoxifylline and melatonin in spiked plasma samples by reverse phase high performance liquid chromatography method. Indian J. Pharm. Sci. 2022, 84(6), 1312–18. [Google Scholar] [CrossRef]
  20. Lorenzett, A.K.P.; Babinski, T.P.; Peczek, S.H.; Tartari, A.P.; Ziebarth, J.; Zago, A.; et al. A validated UPLC-MS/MS method for monitoring temozolomide and perillyl alcohol metabolites in biological matrices: insights from a preclinical pharmacokinetic study. BioMed Chromatogr. 2025, 39(12), e70253. [Google Scholar] [CrossRef] [PubMed]
  21. Singh, Y.; AkkiReddy, R.; Sahu, D.; Bilagi, G.; Thykandy, T.; Hingole, P.; et al. Intersex and interspecies pharmacokinetics of metoprolol after oral and intravenous dose administration in rats and mice. Int. J. Pharmacokinet. 2022, 5(1), 1–13. [Google Scholar] [CrossRef]
  22. Beconi, M.G.; Howland, D.; Park, L.; Lyons, K.; Giuliano, J.; Dominguez, C.; et al. Pharmacokinetics of memantine in rats and mice. PLoS Curr. 2011, 3, RRN1291. [Google Scholar] [CrossRef] [PubMed]
  23. Le, J.; Vivian, E.M. Distribución del fármaco en los tejidos [Internet]. Manual MSD de farmacología clínica. 2024 [cited 2026 Mar 20]. Available from: https://www.msdmanuals.com/es/professional/farmacolog%C3%ADa-cl%C3%ADnica/farmacocin%C3%A9tica/distribuci%C3%B3n-del-f%C3%A1rmaco-en-los-tejidos.
  24. Prado, N.J. Protección cardiovascular aguda y crónica con melatonina en modelos experimentales murinos [Tesis doctoral]. Mendoza (AR): Universidad Nacional de Cuyo, Facultad de Ciencias Médicas; 2019.
  25. Arzola Sierra, S. Chalconas, bioactividad y aplicaciones sintéticas [Tesis de maestría]. San Cristóbal de La Laguna (ES): Universidad de La Laguna, Facultad de Ciencias, Sección de Química; 2020.
  26. Plumed Velilla, M. El papel de la melatonina en el carcinoma colorrectal [Trabajo Fin de Grado]. Zaragoza: Universidad de Zaragoza, Facultad de Medicina; 2022.
  27. Gómez Corvera, A. Síntesis de melatonina en el sistema inmune en diferentes modelos murinos y desarrollo de un modelo celular knockout condicional para melatonina [Tesis doctoral]. Sevilla (ES): Universidad de Sevilla, Facultad de Medicina, Departamento de Bioquímica Médica y Biología Molecular; 2007.
  28. United States Pharmacopeia. 〈621〉 Chromatography. In: United States Pharmacopeia. 2022 Dec 1;2022. Available from: https://www.usp.org/harmonization%20standards/pdg/excipients/chromatography.
  29. Merck, KGaA. Safety Data Sheet: Polyethylene glycol 400 for synthesis [Internet]. Darmstadt (DE): Merck KGaA; 2017. Available from: https://www.merckgroup.com.
  30. Sigma-Aldrich Brasil Ltda. Safety Data Sheet: Cremophor EL® [Internet]. Cajamar (BR): Sigma-Aldrich; 2023. Available from: https://www.sigmaaldrich.com.
  31. Sigma-Aldrich. Material Safety Data Sheet: Ethanol [Internet]. St. Louis (MO): Sigma-Aldrich; 2024. Available from: https://www.sigmaaldrich.com/safety-data-sheet/ethanol.
Figure 1. Representative chromatograms of white and Mel-Fur-doped samples at 320 ng/mL, respectively: (a), (b) diluent solution; (c), (d) serum; (e), (f) colon (g), (h) liver; and (i), (j) lungs. These chromatograms were used to demonstrate the selectivity of the chromatographic method.
Preprints 221880 g001
Figure 2. Evaluation of Mel-Fur linearity in diluent solution (acetonitrile: water). A) Chromatogram representative of the calibration curve for Mel-Fur in diluent solution. B) Graphical representation of the average of the calibration curve, with linear equation (y= 0.1708x - 0.568) and coefficient of determination (R2=1).
Preprints 221880 g002
Figure 3. Concentrations of Mel-Fur in serum and organs of BALB/c mice at the time after oral administration at a dose of 1000 mg/kg. a) serum, b) Lungs, c) Liver and d) Colon. Each point represents an animal by time evaluated.
Preprints 221880 g003
Figure 4. Chemical structure of the analyte of interest: melatonin-furanochalcone hybrid 6f (Mel-Fur).
Preprints 221880 g004
Figure 5. Diagram of the experimental protocol of the biodistribution study and pharmacokinetic analysis of Mel-Fur in female BALB/c mice. One mouse was used for each sampling point. * Each organ was collected and processed in its entirety and analyzed by HPLC to determine the experimental concentration (ng/g). Figure created with BioRender.com.
Preprints 221880 g005
Table 1. Chromatographic conditions for the determination of Mel-Fur in serum and murine organs.
Parameter Feature
Method Isocratic
Mobile phase Acetonitrile: Water (85:15)
Flow 0.8 mL/min
Injection volume 50 μL
Detection UV: 342 nm
Column C30 (4,6 × 150mm, 5µm)
Pre-column C30 (20 × 4,6 mm)
Column temperature 25 °C
Units of concentration ng/mL
Retention time in minutes 4.3 (serum) *
Runtime 10 minutes
* The different matrices presented variations in retention times (see figure 8), with values ranging from 3.3 to 4.3 minutes. According to the guidelines of USP Chapter <621>, a variation of up to 2 minutes in the retention time is allowed, which supports the acceptability of the results obtained.
Table 2. Parameters of suitability of the chromatographic system for the determination of Mel-Fur.
Parameter Acceptance criteria Mel-Fur
Retention time (min) Proper to the method 4.3
Theoretical plates (N) >2000 2245
Tailing factor (Tf) <2 1.67
Resolution (Rs) >2 7.77
Retention Factor (k´) 1 ≤ k´ ≤ 10 1.03
Selectivity (α) >1.1 2.86
Table 3. Linearity parameters according to the calibration curves performed for Mel-Fur applied acetonitrile diluent solution: water (a) and biological matrices (b).
(a) Diluent solution calibration curve results
Concentration
standard
(ng/mL)
Mean peak
area ratio
Mean
concentration
experimental
(ng/mL)
Mean
RE %
Mean
CV %
40 6.1 41.7 12.1 14.4
80 13.1 82.8 0.4 8.2
160 27.6 168.7 3.6 4.9
320 53.3 319.7 -1.3 4.8
640 107.5 639.0 -1.1 1.4
1280 215.8 1276.8 -0.2 1.2
2560 433.8 2561.5 0.1 0.2
Mean (RE%) 1.9 5.0
(b) Parameters of the linear equations of matrices
Parameter Serum Colon Liver Lungs
m 0.1639 0.1802 017922 0.1633
b - 1.2835 0.8647 2.7247 0.6932
0.9999 0.9997 0.9997 0.9996
r 0.9999 0.9998 0.9998 0.9998
Mean (RE%) 1.7 0.3 0.2 1.3
Mean (CV%) 4.1 4.3 3.0 6.7
The parameters of the average curve of the aftershocks are presented; three for serum and two for organs. In linear equations, m represents the slope, b the intercept, R² the coefficient of determination, and r the correlation coefficient. ER%: relative percentage error; CV%: coefficient of variation.
Table 4. Mel-Fur limit of quantification (LOQ) and limit of detection (LOD) in biological matrices.
Biological matrix LOQ (ng/mL) LOD (ng/mL)
Serum 16.4 3.5
Colon 32.5 3.7
Liver 8.8 1.8
Lungs 16.7 4.3
Table 5. Results of Mel-Fur's precision and accuracy in serum and organs over three consecutive days.
Inter-assay precision and accuracy
Concentration
theoretical
Concentration
experimental
Serum Colon Liver Lungs
Low
(80 ng/mL)
Mean (ng/mL) 71.2 79.5 82.5 75.9
CV (%) 7.2 2.5 2.2 9.2
RE (%) -11.0 -0.6 3.2 -5.1
Media
(320 ng/mL)
Mean (ng/mL) 316.8 309.3 315.2 326.1
CV (%) 9.4 3.5 2.0 4.7
RE (%) -1.0 -3.3 -1.5 1.9
High
(1280 ng/mL)
Mean (ng/mL) 1342.5 1261.6 1217.6 1208.9
CV (%) 4.4 1.5 1.6 9.7
RE (%) 4.9 -1.4 -4.9 -5.6
The data corresponds to the average of three trials per triplicate in serum (n = 9) and duplicate in organs, per concentration. ER%: relative percentage error; CV%: coefficient of variation.
Table 6. Results of the percentage of recovery of Mel-Fur in serum and organs.
Theoretical concentration Mean Serum Colon Liver Lungs
Low (80 ng/mL) %R 928 93.8 88.7 98.4
Media (320 ng/mL) 92.9 103.5 97.1 92.0
High (1280 ng/mL) 95.4 107.6 105.4 79.4
Mean %R 93.7 101.6 97.1 89.9
%CV 6.2 7.2 8.6 11.2
R%: percentage of recovery. CV%: coefficient of variation. The results correspond to three trials carried out in triplicate.
Table 7. Pharmacokinetic parameters obtained in serum after single oral administration of Mel-Fur in BALB/c mice.
Parameter Magnitude
Cmax (ng/mL) 172
Tmax (min) 15
AUC0-240min (ng·min/mL) 19398.5
AUC240-∞ (ng·min/mL) 3652.9
AUC0-∞ (ng·min/mL) 23051.4
t1/2 (min) 40.8
Ke (min-1) 0.017
Ka (min-1) 0.037
CLF (mL/min/kg) 43.4
Vd-F (L/kg) 2.5
Disclaimer/Publisher’s Note: The statements, opinions and data contained in all publications are solely those of the individual author(s) and contributor(s) and not of MDPI and/or the editor(s). MDPI and/or the editor(s) disclaim responsibility for any injury to people or property resulting from any ideas, methods, instructions or products referred to in the content.
Copyright: This open access article is published under a Creative Commons CC BY 4.0 license, which permit the free download, distribution, and reuse, provided that the author and preprint are cited in any reuse.
Prerpints.org logo

Preprints.org is a free preprint server supported by MDPI in Basel, Switzerland.

Subscribe

© 2026 MDPI (Basel, Switzerland) unless otherwise stated

Accessibility

Disclaimer

Terms of Use

Privacy Policy

Privacy Settings