

Submitted:
06 July 2026
Posted:
07 July 2026
You are already at the latest version
Abstract
Digital technologies increasingly shape how cultural tourists discover, evaluate, and select heritage experiences, yet Indigenous cultural tourism remains unevenly visible across online marketing systems and official tourism data. This exploratory study reframes Indigenous tourism development through a cultural-tourism marketing and consumer-behavior lens. It compares 12 Indigenous cultural tourism cases across Oceania, North America, Europe, Asia, Latin America, Southeast Asia, and the Philippines using publicly available secondary data from tourism agencies, Indigenous tourism organizations, official destination websites, heritage sources, public reports, and Google Trends. Three indicators were constructed: a Digital Visibility Index, a Tourism Growth Evidence Score, and a Sustainability Support Index. Results show that globally recognized heritage brands such as Chichen Itza/Maya tourism and Cordillera Indigenous tourism achieved high digital visibility, but digital visibility was only weakly associated with tourism-growth evidence (r = 0.022). Cases such as Native American tourism, Indigenous tourism Canada, Maori tourism, and Aboriginal tourism Australia showed stronger overall development because they combined sector-specific tourism evidence with institutional support and sustainability safeguards. The study concludes that cultural tourism marketing in the digital age should move beyond search visibility and promote ethical, community-controlled, data-informed, and culturally accountable consumer engagement.
Keywords:
cultural tourism
; Indigenous tourism
; digital marketing
; consumer behavior
; digital visibility
; Google Trends
; destination marketing
; online search
; sustainable cultural tourism
; heritage tourism
1. Introduction
Cultural tourism is increasingly experienced through digital information environments. Before tourists arrive at a cultural destination, they often encounter it through search engines, official tourism portals, destination websites, online travel media, social media narratives, and platform-based recommendations. These digital touchpoints influence awareness, perceived authenticity, destination image, expectations, and eventual travel decision-making. In this context, cultural tourism marketing is no longer limited to promotional messages; it also shapes the ways consumers interpret heritage, communities, landscapes, and cultural experiences.
Indigenous cultural tourism is especially important in this discussion because it connects destination marketing with questions of cultural authority, representation, community benefit, and responsible consumption. Indigenous tourism may support livelihoods, cultural education, entrepreneurship, and regional development, but it may also expose communities to misrepresentation, commodification, over-visitation, and weak control over cultural narratives (Harbor & Hunt, 2021; Taylor, 2017). Digital visibility therefore matters not only as a marketing outcome but also as a consumer-behavior and sustainability issue.
The Special Issue on Cultural Tourism in the Digital Age emphasizes the interaction of digital marketing strategies, consumer behavior, and cultural tourism, including the roles of online platforms, digital tools, user engagement, destination decision-making, sustainability, and digitally empowered consumers. This study responds to that scope by using secondary data to examine how selected Indigenous cultural tourism destinations and sectors are digitally visible, how such visibility relates to tourism-growth evidence, and how sustainability and ethical-support systems are represented in public data environments.
Existing Indigenous tourism studies often provide deep community-specific or country-specific insights, while global tourism datasets commonly report national arrivals or heritage-site visitor counts without isolating Indigenous tourism. This creates a methodological and practical gap. Cultural tourists may encounter Indigenous heritage online, yet researchers and tourism planners may lack comparable evidence showing whether digital visibility is connected to Indigenous-specific tourism outcomes, institutional support, or sustainability safeguards. This gap is relevant for digital marketing and consumer behavior because online visibility can influence awareness and destination choice even when the data behind the promoted experience are incomplete.
This study develops a comparative secondary-data framework for 12 Indigenous cultural tourism cases. It treats Google Trends and official online tourism presence as indicators of digital visibility and potential consumer information-search interest, not as direct measures of tourist arrivals or attitudes. It then compares these visibility indicators with tourism-growth evidence and sustainability-support indicators. The analysis is exploratory rather than causal, but it provides a practical basis for understanding how cultural tourism is represented in the digital age.
The study is guided by three research questions: (1) How are selected Indigenous cultural tourism cases digitally positioned across global search and official marketing systems? (2) How does digital visibility relate to the availability of tourism-growth evidence and sustainability or ethical support? (3) What marketing and consumer-behavior implications emerge for responsible cultural tourism in the digital age?
2. Materials and Methods
2.1. Research Design
This study used an exploratory global comparative secondary-data design. The approach was appropriate because the objective was to identify broad patterns in digital visibility, tourism-growth evidence, and sustainability support using publicly available data rather than primary surveys or interviews. The design combines descriptive comparative analysis, index construction, and source-quality assessment.
The study is positioned within cultural tourism marketing and consumer-behavior research. Digital visibility was interpreted as an upstream signal in the consumer decision process, especially during destination awareness and information search. However, the study does not claim to measure individual attitudes, motivations, satisfaction, or purchase intention. Instead, it uses online search interest and official tourism presence as public secondary indicators of how Indigenous cultural tourism cases appear within digital tourism marketing environments.
2.2. Unit of Analysis and Case Selection
The unit of analysis was the Indigenous cultural tourism destination, sector, or culturally defined tourism case. Cases were selected purposively using four criteria: (1) the case had an identifiable Indigenous cultural tourism context; (2) at least one public secondary source was available; (3) the case contributed to geographic diversity; and (4) the case provided a digital visibility, tourism-growth, economic, policy, or sustainability indicator.
The dataset included 12 cases: Maori tourism in Aotearoa New Zealand; First Nations or Aboriginal tourism in Australia; Indigenous tourism in Canada; Native American, Alaska Native, and Native Hawaiian tourism in the United States; Sami tourism in Sapmi; Ainu tourism in Japan; Indigenous tourism in Taiwan; Quechua/Andean tourism in Peru; Maya tourism in Mexico/Yucatan; Aymara/Quechua community tourism in Bolivia; Cordillera Indigenous cultural and mountain tourism in the Philippines; and Orang Asli/Orang Asal tourism in Malaysia.

Table 1.
Secondary-data sample and special-issue alignment.
| No. | Case | Country/Region | Current data role | Marketing / consumer-behavior relevance |
|---|---|---|---|---|
| 1 | Maori tourism | Aotearoa New Zealand | Indigenous tourism sector / economic contribution | Cultural-brand and Indigenous-sector marketing |
| 2 | First Nations tourism | Australia | Trips incorporating First Nations activities | Experience-based cultural tourism demand |
| 3 | Indigenous tourism Canada | Canada | National Indigenous tourism revenues and jobs | Sector-level cultural tourism positioning |
| 4 | Native American / AIANNH tourism | United States | Indigenous tourism business contribution | Consumer engagement with Indigenous communities |
| 5 | Sami tourism | Sapmi / Nordic Arctic | Ethical tourism guidelines and policy support | Ethical cultural representation |
| 6 | Ainu tourism | Japan | Official Ainu cultural destination | Cultural interpretation and destination awareness |
| 7 | Taiwan Indigenous tourism | Taiwan | National tourism recovery and Indigenous tourism context | Cultural destination discovery |
| 8 | Quechua / Andean tourism | Peru | Machu Picchu / Andean heritage tourism proxy | Heritage-brand search visibility |
| 9 | Maya tourism | Mexico / Yucatan | Chichen Itza visitor count and Maya heritage tourism | Archaeological destination branding |
| 10 | Aymara / Quechua community tourism | Bolivia | Community-based tourism and national arrivals proxy | Community-based cultural tourism visibility |
| 11 | Cordillera Indigenous tourism | Philippines / Cordillera | Regional mountain and cultural tourism proxy | Landscape, culture, and domestic/international discovery |
| 12 | Orang Asli / Orang Asal tourism | Malaysia | Ecotourism and national tourism data-source proxy | Ecocultural tourism marketing potential |
2.3. Data Sources
The study used only public secondary data. Sources included national tourism agencies, Indigenous tourism organizations, official tourism websites, government statistical portals, heritage or cultural agencies, policy documents, and publicly accessible reports. Google Trends was used as a search-interest source because it provides a standardized public indicator of relative online interest across selected keywords and time periods (Google, n.d.).
Because Indigenous tourism data are not consistently reported as a separate statistical category, the dataset distinguished between Indigenous-specific indicators and proxy indicators. Indigenous-specific indicators included measures such as trips incorporating First Nations activities, Indigenous tourism revenues, Indigenous tourism business contribution, official Indigenous tourism portals, or ethical tourism guidelines. Proxy indicators included country-level visitor arrivals, regional tourism arrivals, or destination-level heritage-site visitor counts when Indigenous-specific tourism statistics were not publicly available. Proxy indicators were retained only when clearly labeled and interpreted cautiously.
2.4. Variables and Measures
The dataset contained three main variable groups. First, digital visibility indicators measured whether a case had an official Indigenous tourism portal, an official national tourism page or campaign, a defined Google Trends keyword, and an average search-interest score. Second, tourism-growth indicators measured available visitor, trip, revenue, economic contribution, employment, or policy-based evidence. Third, sustainability-support indicators measured the presence of ethical tourism guidelines, sustainability policies, heritage management mechanisms, protected-area status, certification schemes, or authenticity standards.
The Digital Visibility Index was designed to capture how visible each case was in digital cultural tourism marketing environments. Google Trends scores were extracted using consistent settings: Worldwide coverage, Web Search, all categories, and the period 1 January 2021 to 31 December 2025. The values were treated as normalized search-interest indicators rather than absolute tourist counts. The Tourism Growth Evidence Score assessed the strength and specificity of available tourism evidence. The Sustainability Support Index assessed whether the tourism system was supported by ethical, heritage, cultural, or sustainability safeguards. The Overall Development Score combined digital visibility, tourism-growth evidence, and sustainability support for diagnostic comparison.
2.5. Data Analysis
The analysis proceeded in five stages. First, descriptive profiling summarized the 12 cases by region, Indigenous cultural tourism context, destination type, primary metric, data confidence, and marketing relevance. Second, the Digital Visibility Index was used to identify cases with stronger or weaker online visibility. Third, tourism-growth indicators were grouped by metric type to avoid inappropriate comparison of unlike units, such as visitor counts, trips, revenues, and policy indicators. Fourth, sustainability-support indicators were compared to identify whether public tourism systems contained ethical or cultural safeguards. Fifth, correlation and typology analyses explored relationships among digital visibility, tourism-growth evidence, sustainability support, and overall development.
Regression analysis was not used because the sample was small and the indicators were not sufficiently comparable for causal modeling. The analysis therefore provides exploratory patterns for cultural tourism marketing and consumer-behavior interpretation rather than causal estimates of digital marketing effects.
2.6. Ethical Considerations and Interpretation Boundary
The study used only publicly available secondary data and did not involve human participants, interviews, surveys, private community knowledge, or non-public Indigenous cultural information. Nevertheless, public availability does not automatically justify unrestricted interpretation. The study recognizes Indigenous data governance principles, including authority to control, collective benefit, responsibility, and ethical use (Carroll et al., 2019, 2020).
The study avoids ranking Indigenous peoples or cultures. It ranks public tourism data environments, digital visibility signals, and institutional-support indicators. A high score therefore does not mean that one Indigenous culture is more valuable or more authentic than another. It means that the public tourism system around that case provides stronger visibility, more codeable evidence, or more visible sustainability support under the selected measures.
3. Results
Note on data treatment: Google Trends values were extracted as average normalized scores using consistent settings across cases. Replacement terms and destination-level proxy terms were documented in the source notes when original Indigenous tourism search terms returned insufficient data. Results should be interpreted as exploratory because indicators are not fully standardized across countries.
3.1. Profile of Selected Indigenous Cultural Tourism Cases
The dataset covered 12 Indigenous cultural tourism cases across Oceania, North America, Europe, East Asia, Latin America, Southeast Asia, and the Philippines. The cases varied in the strength and specificity of secondary data. Some cases provided Indigenous-specific or Indigenous-sector tourism statistics, including Maori tourism, Aboriginal tourism in Australia, Indigenous tourism in Canada, and Native American tourism. Other cases relied on destination-level or national/regional proxy indicators, including Chichen Itza, Machu Picchu, Taiwan, Bolivia, the Cordillera Administrative Region, and Malaysia. This variation reflects the uneven global availability of standardized Indigenous cultural tourism statistics.
Table 2.
Profile of the 12 Indigenous cultural tourism cases.
| Case | Country/Region | Primary metric | Value and unit | Year | Data confidence |
|---|---|---|---|---|---|
| Maori tourism | Aotearoa New Zealand | Contribution of Maori tourism to GDP / Te Ohanga Maori | 1.2 NZD billion | 2023 | High |
| Aboriginal tourism Australia | Australia | Trips incorporating a First Nations activity | 3 million trips | 2023-2024 | High |
| Indigenous tourism Canada | Canada | Indigenous tourism sector revenues | 3.7 CAD billion revenues | 2023 | High |
| Native American tourism | United States | Overseas visitors engaging with American Indigenous communities | 1.6 million overseas visitors | 2023 | High |
| Sami tourism | Sapmi / Finland-Norway-Sweden | Ethical Sami tourism guidelines / Indigenous policy indicator | 1 official policy exists | 2018; active 2026 | Medium |
| Ainu/Upopoy tourism | Japan | Upopoy annual attendance | 316,398 visitors | FY2024 | Medium |
| Taiwan Indigenous tourism | Taiwan | Inbound visitor arrivals to Taiwan | 7,857,686 inbound visitors | 2024 | Medium |
| Machu Picchu/Quechua tourism | Peru | Visitors to Machu Picchu in first bimestre / official tourism report | 191,351 visitors | Jan-Feb 2025 | Medium |
| Chichen Itza/Maya tourism | Mexico / Yucatan | Chichen Itza visitors before New Year | 2,200,000 visitors by 26 Dec | 2024 | Medium-High |
| Bolivia Indigenous tourism | Bolivia | Foreign visitor arrivals to Bolivia | 991,184 foreign visitors | 2024 | Medium |
| Cordillera Indigenous tourism | Philippines / Cordillera | Cordillera total tourist arrivals | 1,983,511 tourist arrivals | 2024 | Medium-High |
| Orang Asli tourism | Malaysia | International visitor arrivals to Malaysia | 25.02 million international visitors | 2024 | Medium |
3.2. Digital Visibility Patterns
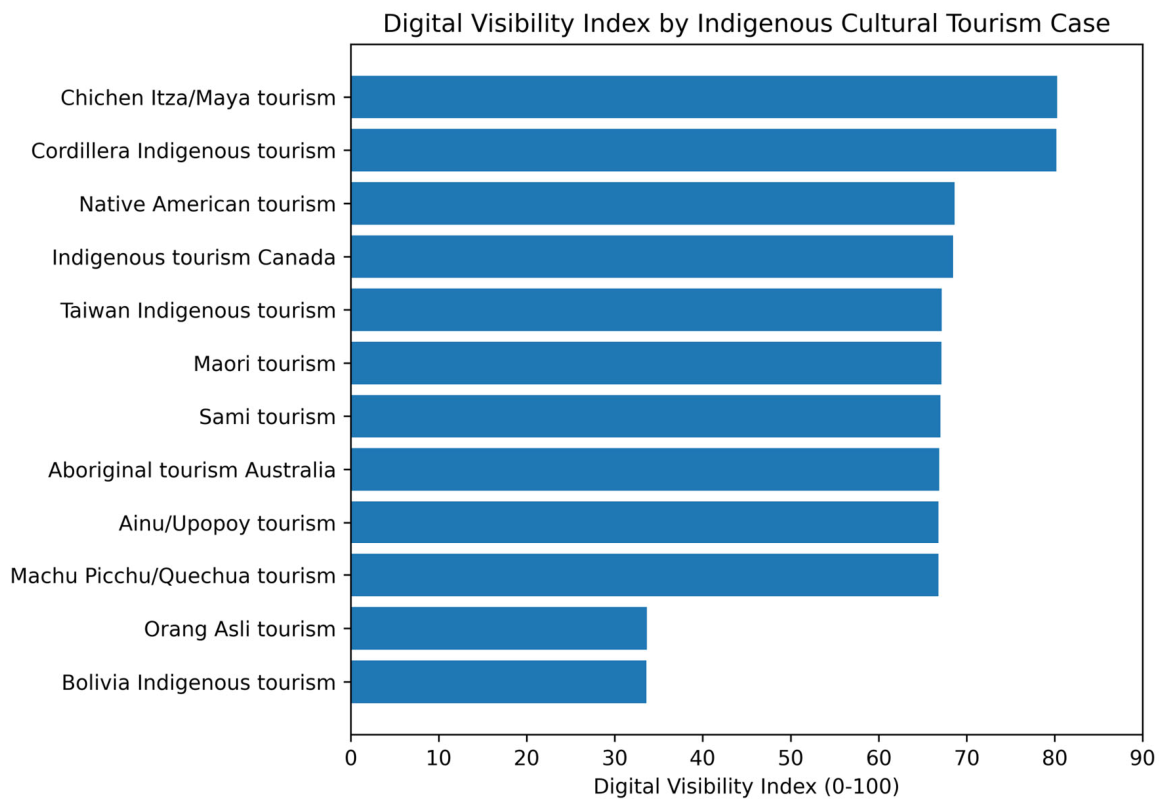
The Digital Visibility Index showed moderate variation across cases, with a mean of 63.88, a minimum of 33.59, and a maximum of 80.28. The highest-ranked cases were Chichen Itza/Maya tourism and Cordillera Indigenous tourism, both of which used destination-level search terms that showed stronger Google Trends visibility. The lowest-ranked cases were Bolivia Indigenous tourism and Orang Asli tourism, mainly because they had weaker Indigenous-specific official tourism portal visibility and lower Google Trends scores under the selected global search settings.
Table 3.
Digital visibility ranking.
| Rank | Case | Google Trends average | Digital Visibility Index |
|---|---|---|---|
| 1 | Chichen Itza/Maya tourism | 40.84 | 80.28 |
| 2 | Cordillera Indigenous tourism | 40.61 | 80.20 |
| 3 | Native American tourism | 5.85 | 68.62 |
| 4 | Indigenous tourism Canada | 5.37 | 68.46 |
| 5 | Taiwan Indigenous tourism | 1.52 | 67.17 |
| 6 | Maori tourism | 1.38 | 67.13 |
| 7 | Sami tourism | 1.07 | 67.02 |
| 8 | Aboriginal tourism Australia | 0.64 | 66.88 |
| 9 | Machu Picchu/Quechua tourism | 0.38 | 66.79 |
| 10 | Ainu/Upopoy tourism | 0.38 | 66.79 |
| 11 | Orang Asli tourism | 0.96 | 33.65 |
| 12 | Bolivia Indigenous tourism | 0.76 | 33.59 |
Figure 1.
Digital Visibility Index by Indigenous cultural tourism case.
3.3. Tourism-Growth Evidence
The Tourism Growth Evidence Score had a mean of 75.00. The strongest evidence category included cases with Indigenous-specific or Indigenous-sector statistics, such as Maori tourism, Aboriginal tourism in Australia, Indigenous tourism in Canada, and Native American tourism. Destination- or national-proxy cases were retained for global comparison but were interpreted cautiously because the indicators did not always isolate Indigenous-led tourism activity.
Table 4.
Tourism-growth evidence ranking.
| Rank | Case | Tourism Growth Evidence Score | Indicator type | Primary metric |
|---|---|---|---|---|
| 1 | Maori tourism | 100 | Economic contribution | Contribution of Maori tourism to GDP / Te Ohanga Maori |
| 2 | Aboriginal tourism Australia | 100 | Tourism growth | Trips incorporating a First Nations activity |
| 3 | Indigenous tourism Canada | 100 | Economic contribution | Indigenous tourism sector revenues |
| 4 | Native American tourism | 100 | Tourism growth | Overseas visitors engaging with American Indigenous communities |
| 5 | Taiwan Indigenous tourism | 75 | Country tourism growth proxy | Inbound visitor arrivals to Taiwan |
| 6 | Chichen Itza/Maya tourism | 75 | Destination visitor count | Chichen Itza visitors before New Year |
| 7 | Bolivia Indigenous tourism | 75 | Country tourism growth proxy | Foreign visitor arrivals to Bolivia |
| 8 | Cordillera Indigenous tourism | 75 | Regional tourism growth proxy | Cordillera total tourist arrivals |
| 9 | Orang Asli tourism | 75 | Country tourism growth proxy | International visitor arrivals to Malaysia |
| 10 | Ainu/Upopoy tourism | 50 | Destination visitor count | Upopoy annual attendance |
| 11 | Machu Picchu/Quechua tourism | 50 | Destination visitor count | Visitors to Machu Picchu in first bimestre / official tourism report |
| 12 | Sami tourism | 25 | Sustainability/policy | Ethical Sami tourism guidelines / Indigenous policy indicator |
3.4. Sustainability Support Patterns
The Sustainability Support Index was generally high across the dataset, with a mean of 97.92. Most cases had official policy, heritage, or sustainability-related support indicators, although not all had certification or authenticity schemes. The Sami tourism case was distinct because it was coded through official ethical tourism guidelines, but comparable numeric visitor data were weaker than in the other Indigenous-sector cases.
Figure 2.
Sustainability Support Index by Indigenous cultural tourism case.
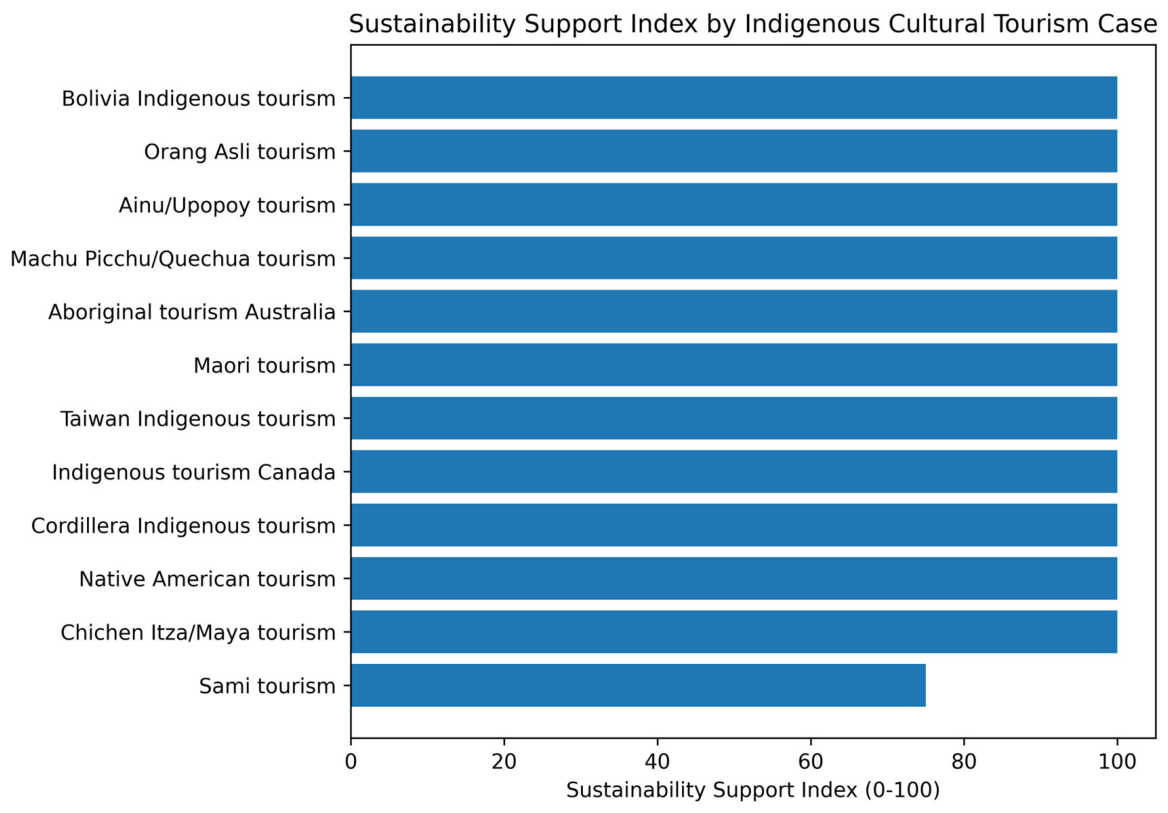
Table 5.
Sustainability and overall development ranking.
| Rank | Case | Sustainability Support Index | Tourism Growth Evidence Score | Overall Development Score |
|---|---|---|---|---|
| 1 | Native American tourism | 100.0 | 100 | 89.54 |
| 2 | Indigenous tourism Canada | 100.0 | 100 | 89.49 |
| 3 | Maori tourism | 100.0 | 100 | 89.04 |
| 4 | Aboriginal tourism Australia | 100.0 | 100 | 88.96 |
| 5 | Chichen Itza/Maya tourism | 100.0 | 75 | 85.09 |
| 6 | Cordillera Indigenous tourism | 100.0 | 75 | 85.07 |
| 7 | Taiwan Indigenous tourism | 100.0 | 75 | 80.72 |
| 8 | Machu Picchu/Quechua tourism | 100.0 | 50 | 72.26 |
| 9 | Ainu/Upopoy tourism | 100.0 | 50 | 72.26 |
| 10 | Orang Asli tourism | 100.0 | 75 | 69.55 |
| 11 | Bolivia Indigenous tourism | 100.0 | 75 | 69.53 |
| 12 | Sami tourism | 75.0 | 25 | 55.67 |
3.5. Exploratory Relationships Among Digital Visibility, Tourism Growth, and Sustainability
The exploratory correlation analysis indicated a weak relationship between the Digital Visibility Index and the Tourism Growth Evidence Score (r = 0.022). The relationship between digital visibility and sustainability support was also weak and slightly negative (r = -0.066), largely because sustainability support was high for most cases while digital visibility varied more widely. The association between Tourism Growth Evidence and Sustainability Support was stronger (r = 0.661), suggesting that cases with stronger institutional or sector-level tourism evidence also tended to have stronger sustainability-support indicators. Given the small sample size and mixed indicator types, these results should be interpreted as exploratory associations rather than causal effects.
Figure 3.
Digital visibility and tourism-growth evidence.
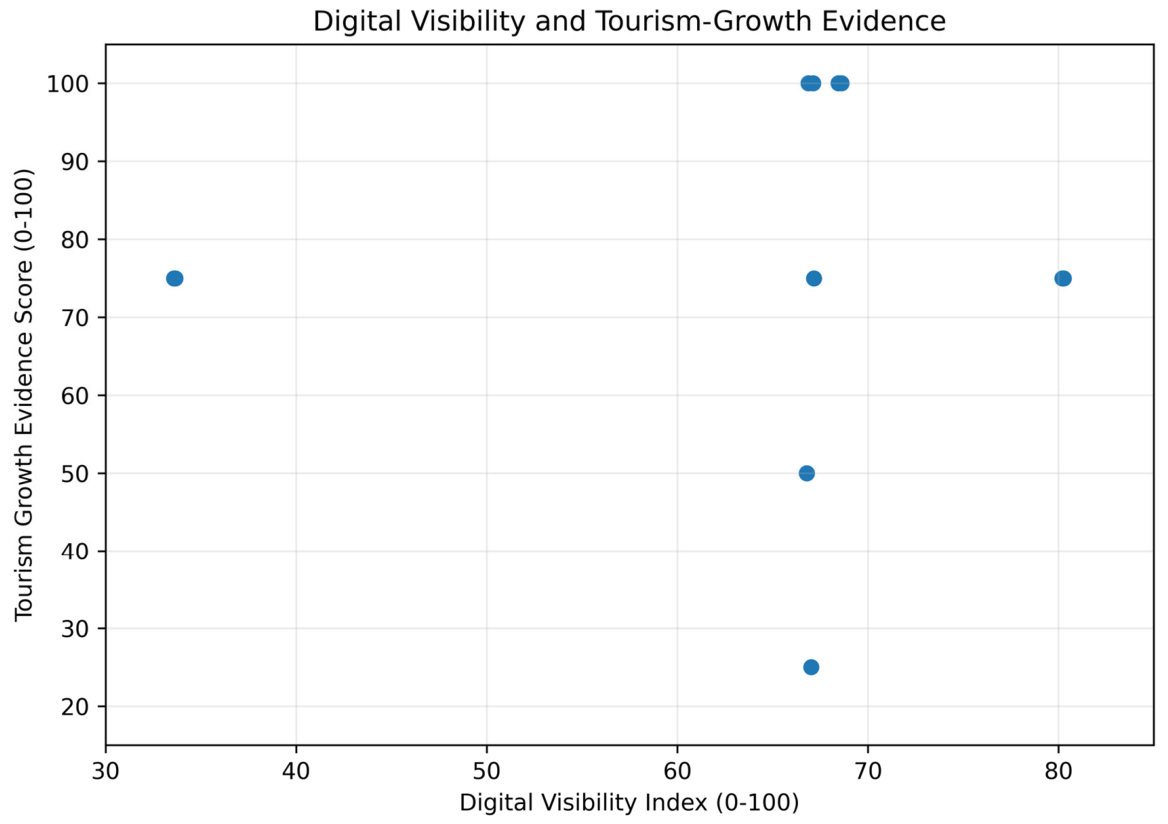
Table 6.
Correlation matrix.
| Variable | Digital Visibility Index | Tourism Growth Evidence Score | Sustainability Support Index | Overall Development Score |
|---|---|---|---|---|
| Digital Visibility Index | 1.000 | 0.022 | -0.066 | 0.459 |
| Tourism Growth Evidence Score | 0.022 | 1.000 | 0.661 | 0.883 |
| Sustainability Support Index | -0.066 | 0.661 | 1.000 | 0.671 |
| Overall Development Score | 0.459 | 0.883 | 0.671 | 1.000 |
3.6. Typology of Indigenous Cultural Tourism Development Patterns
Using the sample mean as the cutoff, the typology grouped cases according to digital visibility and sustainability support. Most cases fell into the high digital visibility / high sustainability support category, while Bolivia Indigenous tourism and Orang Asli tourism were classified as low digital visibility / high sustainability support. The Sami tourism case was classified as high digital visibility / low sustainability support only because the certification/authenticity component was coded as still in development; its ethical tourism guidelines remain important evidence of sustainability orientation. No case fell into the low digital visibility / low sustainability support category.
Figure 4.
Digital visibility-sustainability typology.
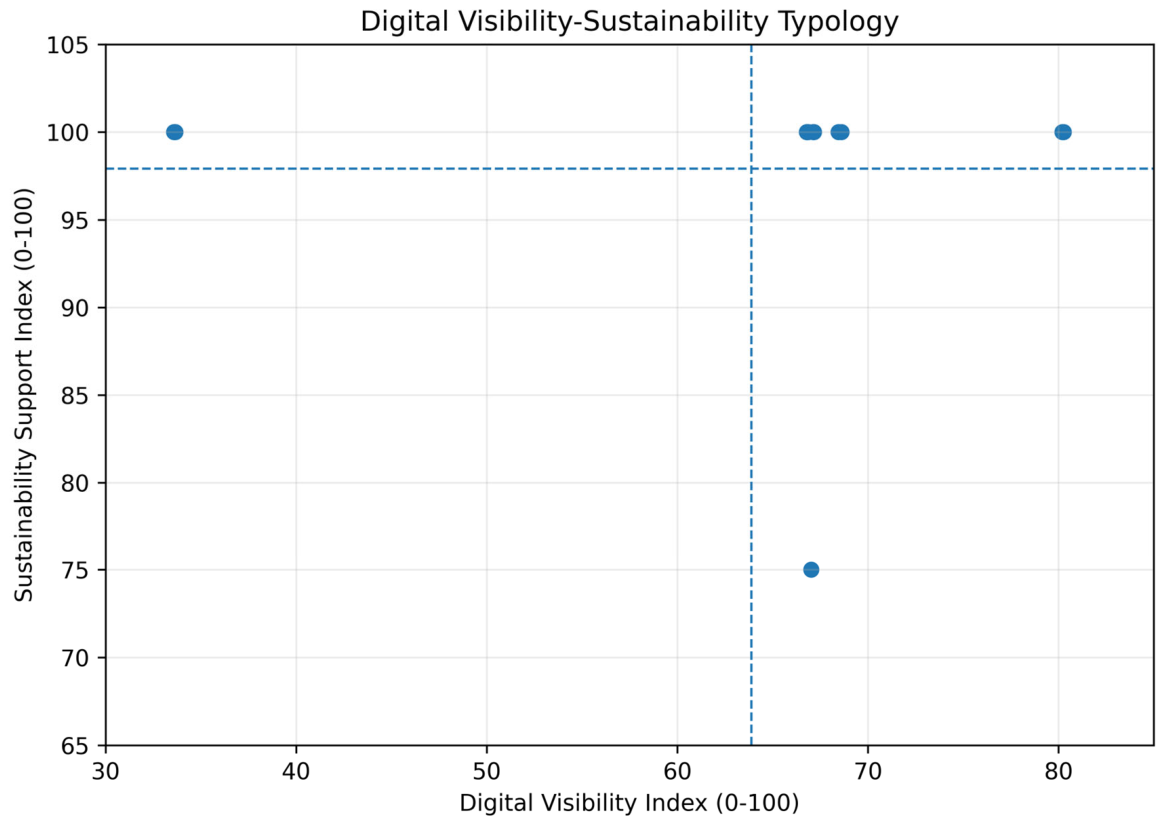
Table 7.
Indigenous cultural tourism development typology.
| Case | Digital Visibility Index | Sustainability Support Index | Tourism Growth Evidence Score | Overall Development Score | Typology |
|---|---|---|---|---|---|
| Native American tourism | 68.62 | 100.0 | 100 | 89.54 | High DVI / high SSI |
| Indigenous tourism Canada | 68.46 | 100.0 | 100 | 89.49 | High DVI / high SSI |
| Maori tourism | 67.13 | 100.0 | 100 | 89.04 | High DVI / high SSI |
| Aboriginal tourism Australia | 66.88 | 100.0 | 100 | 88.96 | High DVI / high SSI |
| Chichen Itza/Maya tourism | 80.28 | 100.0 | 75 | 85.09 | High DVI / high SSI |
| Cordillera Indigenous tourism | 80.20 | 100.0 | 75 | 85.07 | High DVI / high SSI |
| Taiwan Indigenous tourism | 67.17 | 100.0 | 75 | 80.72 | High DVI / high SSI |
| Machu Picchu/Quechua tourism | 66.79 | 100.0 | 50 | 72.26 | High DVI / high SSI |
| Ainu/Upopoy tourism | 66.79 | 100.0 | 50 | 72.26 | High DVI / high SSI |
| Orang Asli tourism | 33.65 | 100.0 | 75 | 69.55 | Low DVI / high SSI |
| Bolivia Indigenous tourism | 33.59 | 100.0 | 75 | 69.53 | Low DVI / high SSI |
| Sami tourism | 67.02 | 75.0 | 25 | 55.67 | High DVI / low SSI |
3.7. Results Summary
Overall, the results suggest that Indigenous cultural tourism development is unevenly visible in digital search and public statistical systems. Heritage-brand destinations showed stronger digital visibility, while Indigenous-sector cases in Canada, the United States, Australia, and Aotearoa New Zealand showed stronger tourism evidence and institutional support. This pattern is directly relevant to cultural tourism marketing because the cases most visible to potential consumers online were not always the cases with the strongest Indigenous-specific data systems.
4. Discussion
4.1. Digital Visibility and the Consumer Awareness Stage in Cultural Tourism
The findings show that Indigenous cultural tourism development is unevenly represented in global digital search spaces. The highest Digital Visibility Index scores were recorded for Chichen Itza/Maya tourism and Cordillera Indigenous tourism, both of which relied on globally recognizable destination-level search proxies. This pattern suggests that online consumer awareness may be driven less by the visibility of Indigenous-led tourism enterprises and more by the strength of well-known heritage, archaeological, landscape, or regional destination brands.
This distinction is important for the Special Issue focus on digital marketing and consumer behavior. Search engines, social media, and online tourism portals influence what potential visitors encounter during early information search and destination evaluation (Xiang & Gretzel, 2010). However, a destination may be highly searchable because of its heritage reputation while Indigenous communities, cultural protocols, knowledge systems, and enterprises connected to that destination remain less visible in the digital tourism economy. Digital marketing should therefore distinguish destination-brand visibility from community-controlled Indigenous cultural tourism visibility.
4.2. Digital Visibility Does Not Automatically Translate into Tourism-Growth Evidence
The relationship between the Digital Visibility Index and the Tourism Growth Evidence Score was very weak in this exploratory sample (r = 0.022). This finding suggests that higher online search visibility is not necessarily associated with stronger documented tourism-growth evidence. Google Trends captures relative public search interest, whereas the tourism-growth evidence score captures the availability and quality of official or association-based tourism statistics.
For consumer-behavior research, this result matters because online search interest may reflect awareness, curiosity, or destination-brand salience, but not necessarily participation in Indigenous-led tourism experiences. Cases such as Canada, Australia, Aotearoa New Zealand, and the United States scored strongly on tourism-growth evidence because they had Indigenous-specific or Indigenous-sector statistical indicators. In contrast, highly visible heritage destinations sometimes depended on regional, destination, or national proxy indicators. Digital visibility and statistical visibility are therefore not the same.
4.3. Institutional Support and Indigenous-Specific Data Strengthen Responsible Marketing
The strongest overall development scores were observed among Native American tourism, Indigenous tourism Canada, Maori tourism, and Aboriginal tourism Australia. These cases were not necessarily the highest in Google Trends search interest, but they had stronger institutional support, clearer Indigenous tourism-sector representation, and stronger tourism-growth evidence. This pattern suggests that responsible cultural tourism marketing is more robust when digital promotion is supported by Indigenous tourism associations, government-recognized programs, official reporting systems, and sector-specific data.
The moderate positive association between the Tourism Growth Evidence Score and the Sustainability Support Index (r = 0.661) suggests that cases with stronger documented tourism metrics also tended to have stronger institutional or ethical support structures. This interpretation aligns with Indigenous data governance scholarship, which emphasizes that Indigenous peoples should have authority over data collection, ownership, interpretation, and use (Carroll et al., 2019, 2020). For cultural tourism marketing, the implication is that data-driven promotion should not be separated from cultural authority and ethical representation.
4.4. Sustainability Support as a Marketing Trust Signal
The Sustainability Support Index was high across most cases, indicating that the selected cases generally had some form of policy, ethical, heritage, cultural, or institutional support linked to sustainability. These support structures can function as trust signals for cultural tourists who seek authentic, respectful, and responsible experiences. However, a high sustainability score should not be interpreted as proof that sustainability is fully implemented on the ground.
In this study, sustainability support was measured through available secondary indicators such as ethical tourism guidelines, heritage recognition, policy support, certification or authenticity systems, and cultural landscape protection. These indicators show enabling structures but do not directly measure benefit distribution, community control over tourism narratives, visitor conduct, or protection from commodification. These issues remain central to Indigenous tourism scholarship because community benefit, justice, cultural continuity, and local control are often more meaningful than aggregate visitor numbers alone (Harbor & Hunt, 2021; Taylor, 2017).
4.5. Implications for Digital Marketing and Consumer Behavior in Cultural Tourism
The findings have several implications for cultural tourism stakeholders in the digital age. First, destination marketers should move beyond generic heritage branding and make Indigenous-led enterprises, cultural protocols, visitor responsibilities, and community benefits more visible in official online channels. Second, digital marketing should support informed consumer choice by explaining what makes an experience Indigenous-led, culturally respectful, and locally beneficial. Third, tourism agencies should connect online campaigns with clear data systems, so that visibility is matched by evidence of tourism participation, revenues, employment, and community outcomes.
Fourth, digital platforms, tourism businesses, and hospitality providers should integrate ethical tourism guidelines into booking paths, visitor education, itineraries, and destination content. The consumer decision process in cultural tourism should not be treated only as a conversion funnel; it should also be treated as an opportunity to shape respectful expectations and responsible behavior. Fifth, future marketing research should examine online reviews, ratings, user-generated content, social media storytelling, virtual or augmented cultural interpretation, and generational differences, especially among digitally native travelers such as Generation Z. These topics are directly aligned with the Special Issue focus but were beyond the scope of the present secondary-data study.
4.6. Practical Typology for Cultural Tourism Marketing
The typology can be used as a diagnostic tool for tourism planning. High digital visibility / high sustainability support cases can focus on improving Indigenous-specific data and ensuring that visible destination brands do not overshadow community narratives. Low digital visibility / high sustainability support cases may benefit from improved digital storytelling, search optimization, official tourism pages, and Indigenous-led destination branding. Cases with strong ethical guidelines but weaker comparable visitor evidence may prioritize public reporting systems that document outcomes without compromising cultural authority or data sovereignty.
The typology should not be read as a ranking of cultural quality or authenticity. Rather, it identifies where digital marketing systems, consumer-facing visibility, tourism evidence, and sustainability support are aligned or misaligned. This diagnostic use is especially relevant for cultural tourism in the digital age because digital visibility can attract attention quickly, while governance, trust, and responsible visitor behavior require longer-term institutional support.
4.7. Limitations and Future Research
The findings must be interpreted with caution. The study used only 12 cases and relied on publicly available secondary data. Indicators were not fully standardized across countries because Indigenous tourism is reported differently across national and regional systems. Some cases had Indigenous-specific economic or visitor statistics, while others required national, regional, destination-level, or heritage-site proxies. Google Trends data were also sensitive to keyword selection; in several cases, original Indigenous tourism search terms returned insufficient data and had to be replaced with broader cultural or destination-level terms.
The study also does not measure individual consumer behavior directly. It uses digital visibility as a proxy for potential online information-search interest, but it does not examine motivations, emotions, satisfaction, trust, loyalty, purchase intention, or generational differences. Future studies should combine secondary data with surveys, experiments, interviews, netnography, online review analysis, social media content analysis, and Indigenous-led validation of indicators. Any future mixed-methods extension should follow Indigenous data governance principles by clarifying consent, authority to control, collective benefit, responsibility, and ethical use of data (Carroll et al., 2019, 2020).
5. Conclusions
This study examined global patterns of Indigenous cultural tourism development by linking digital visibility, tourism-growth evidence, and sustainability support using secondary data from 12 cases. Reframed for cultural tourism in the digital age, the findings show that Indigenous cultural tourism is not equally visible across digital search and public statistical systems. Heritage-brand destinations such as Chichen Itza/Maya tourism and Cordillera Indigenous tourism showed strong digital visibility, but this visibility may reflect global recognition of destination brands rather than the visibility of Indigenous-led tourism systems.
The study found that digital visibility was weakly associated with tourism-growth evidence in this exploratory sample. This suggests that search visibility alone should not be treated as a reliable measure of Indigenous cultural tourism development or consumer engagement. More meaningful assessment requires attention to Indigenous-specific tourism statistics, community benefits, cultural governance, ethical visitor guidance, and sustainability safeguards.
The main contribution of the study is a comparative secondary-data framework that connects cultural tourism marketing, online search visibility, consumer decision pathways, tourism evidence, and sustainability support. The framework can help tourism agencies, Indigenous tourism organizations, and researchers identify whether digital marketing visibility is supported by credible data and responsible governance. Future research should expand the sample, incorporate online reviews and user-generated content, study Gen Z and other consumer groups, and validate indicators through Indigenous-led and community-based methods.
Overall, the study concludes that cultural tourism in the digital age should be not only searchable and marketable but also ethical, community-centered, data-informed, and culturally accountable. Digital visibility can attract attention, but responsible Indigenous cultural tourism requires stronger institutional support, better public data, and digital narratives that respect Indigenous peoples as living communities and cultural authorities.
Supplementary Materials
The following supporting information is available online: Table S1: Compiled secondary dataset and source log; File S1: Google Trends extraction notes; Figures S1-S4: High-resolution figure files.
Author Contributions
Conceptualization, K.R.M.D.; methodology, K.R.M.D.; validation, K.R.M.D.; formal analysis, K.R.M.D.; data curation, K.R.M.D.; writing - original draft, L.C.M.D.; writing - review and editing, K.R.M.D.; visualization, J.M.D.; project administration, L.C.M.D. All authors have read and agreed to the submitted version of the manuscript and agree to be accountable for all aspects of the work.
Funding
This research received no external funding. Institutional and academic support from Kalinga State University and O.P. Jindal Global University is acknowledged below. These institutions had no role in the design of the analysis, interpretation of results, or decision to submit the manuscript.
Institutional Review Board Statement
Not applicable. The study used aggregate publicly available secondary data and did not involve human participants, identifiable private information, or intervention.
Informed Consent Statement
Not applicable.
Data Availability Statement
The data presented in this study are included in the article and Supplementary Materials. The compiled secondary dataset, source log, Google Trends extraction notes, and figure files are provided as supplementary files. These data were derived from public domain resources listed in the references and source log.
Acknowledgments
The authors acknowledge the public agencies, Indigenous tourism organizations, and official tourism platforms whose publicly available data were used in this secondary-data study. During the preparation of this manuscript, the authors used ChatGPT (OpenAI) for manuscript organization, language refinement, tabular presentation, figure-caption drafting, and preliminary interpretation support. The authors reviewed and edited all AI-assisted outputs and take full responsibility for the content of this publication.
Conflicts of Interest
The authors declare no conflict of interest.
References
- American Indigenous Tourism Association. Economic impact of U.S. Indigenous tourism businesses 2024. 2024. Available online: https://americanindigenoustourism.org/research-reports/.
- Andina. Number of tourists visiting Machu Picchu grew 16.7% in January-February 2025. 2025. Available online: https://andina.pe/ingles/noticia-number-of-tourists-visiting-machu-picchu-grew-167-in-januaryfebruary-2025-1028349.aspx.
- BERL. The value of Maori tourism. 2025. Available online: https://berl.co.nz/sites/default/files/2025-02/Value%20of%20M%C4%81ori%20Tourism%20-%20Final%20%28web%29.pdf.
- Carroll, S. R.; Garba, I.; Figueroa-Rodriguez, O. L.; Holbrook, J.; Lovett, R.; Materechera, S.; Parsons, M.; Raseroka, K.; Rodriguez-Lonebear, D.; Rowe, R.; Sara, R.; Walker, J. D.; Anderson, J.; Hudson, M. The CARE Principles for Indigenous Data Governance. Data Sci. J. 2020, 19(1), Article 43. [Google Scholar] [CrossRef]
- Carroll, S. R.; Rodriguez-Lonebear, D.; Martinez, A. Indigenous Data Governance: Strategies from United States Native Nations. Data Sci. J. 2019, 18(1), Article 31. [Google Scholar] [CrossRef] [PubMed]
- de Bernardi, C. Authenticity as a compromise: A critical discourse analysis of Sami tourism websites. J. Herit. Tour. 2019, 14(3), 249–262. [Google Scholar] [CrossRef]
- Google. Google Trends. n.d. Available online: https://trends.google.com/trends/.
- Government of Canada. Supporting Indigenous tourism and businesses. 2025. Available online: https://www.canada.ca/en/innovation-science-economic-development/news/2025/02/supporting-indigenous-tourism-and-businesses.html.
- Harbor, L. C.; Hunt, C. A. Indigenous tourism and cultural justice in a Tz'utujil Maya community, Guatemala. J. Sustain. Tour. 2021, 29(2-3), 214–233. [Google Scholar] [CrossRef]
- Japan National Tourism Organization. National Ainu Museum and Park (Upopoy). n.d. Available online: https://www.japan.travel/en/spot/2038/.
- Kalia, P.; Mladenovic, D.; Acevedo-Duque, A. Decoding the trends and the emerging research directions of digital tourism in the last three decades: A bibliometric analysis. SAGE Open 2022, 12(4). [Google Scholar] [CrossRef]
- Philippine Information Agency. Cordillera tourism sees 17% increase, contributes PHP 10.7B to economy. 2025. Available online: https://pia.gov.ph/news/cordillera-tourism-sees-17-increase-contributes-%E2%82%B110-7b-to-economy/.
- Sami Parliament in Finland. Ethical guidelines for Sami tourism and responsible Sami tourism. 2018. Available online: https://samediggi.fi/en/areas-of-expertise/livelihoods-justice-and-environment/ethical-guidelines-for-sami-tourism/.
- Taiwan Tourism Administration. Annual report on tourism 2024: Tourism snapshot. 2025. Available online: https://admin.taiwan.net.tw/upload/contentFile/auser/b/annual_2024_htm/en/2024_Tourism_Snapshot.html.
- Taylor, S. R. Issues in measuring success in community-based Indigenous tourism: Elites, kin groups, social capital, gender dynamics and income flows. J. Sustain. Tour. 2017, 25(3), 433–449. [Google Scholar] [CrossRef]
- Tourism Malaysia. Malaysia tourism statistics. n.d. Available online: https://www.tourism.gov.my/statistics.
- Tourism Research Australia. First Nations tourism. 2024. Available online: https://www.tra.gov.au/en/research-reports/first-nations-tourism.
- World Bank. International tourism, number of arrivals - Bolivia. n.d. Available online: https://data.worldbank.org/indicator/ST.INT.ARVL?locations=BO.
- Xiang, Z.; Gretzel, U. Role of social media in online travel information search. Tour. Manag. 2010, 31(2), 179–188. [Google Scholar] [CrossRef]
Disclaimer/Publisher’s Note: The statements, opinions and data contained in all publications are solely those of the individual author(s) and contributor(s) and not of MDPI and/or the editor(s). MDPI and/or the editor(s) disclaim responsibility for any injury to people or property resulting from any ideas, methods, instructions or products referred to in the content. |
© 2026 by the authors. Licensee MDPI, Basel, Switzerland. This article is an open access article distributed under the terms and conditions of the Creative Commons Attribution (CC BY) license (http://creativecommons.org/licenses/by/4.0/).
Copyright: This open access article is published under a Creative Commons CC BY 4.0 license, which permit the free download, distribution, and reuse, provided that the author and preprint are cited in any reuse.


