
Submitted:
06 July 2026
Posted:
07 July 2026
You are already at the latest version
Abstract
Microplastic pollution has become an emerging threat to marine biodiversity, yet the developmental-stage-specific responses of endangered marine species remain poorly understood. Tachypleus tridentatus, a threatened marine arthropod of high ecological and conservation value, is exposed to microplastics in coastal habitats. In this study, five-instar-old and six-instar-old juvenile T. tridentatus were exposed to polystyrene microplastics (PS-MPs) with a diameter of 6 μm at environmentally relevant concentrations (0, 102, 104 particles/L) for 21 days. Fluorescence imaging revealed the accumulation of PS-MPs within the intestinal tract, with distinct retention characteristics among developmental stages. Transcriptome analysis revealed significant differential gene expression after exposure, with affected pathways related to energy metabolism, immune regulation, stress response, signal transduction, and development. Younger juveniles exhibited stronger transcriptional disturbances in metabolic and stress-related pathways, whereas older juveniles showed more coordinated regulation of homeostatic and adaptive genes. These findings suggest that juvenile T. tridentatus employs age-dependent molecular response strategies when confronted with microplastic exposure, reflecting developmental differences in stress sensitivity and adaptive capacity. Our study provides new insights into the molecular mechanisms underlying microplastic responses in an endangered marine species and highlights the importance of incorporating developmental-stage variation into ecological risk assessments and conservation strategies for horseshoe crabs in polluted coastal ecosystems.
Keywords:
Tachypleus tridentatus
; microplastics
; transcriptome
; age-dependent response
; biodiversity conservation
1. Introduction
Marine biodiversity is increasingly threatened by multiple anthropogenic stressors associated with global environmental change [1,2]. In addition to climate-related pressures such as ocean warming, acidification, and habitat degradation, emerging pollutants have become a growing concern because of their potential to alter species performance, ecological interactions, and ecosystem resilience. Understanding how marine organisms respond and adapt to these stressors has therefore become a central challenge for biodiversity conservation and marine ecosystem management [3,4]. Environmental change can affect biological systems across multiple levels of organization, from molecular and physiological processes to population dynamics and ecosystem functioning. Consequently, evaluating species vulnerability and adaptive capacity has become an important component of biodiversity conservation planning [5].
Among emerging pollutants, microplastics (MPs, <5 mm) have attracted considerable attention because of their widespread occurrence, persistence, and ecological risks in marine environments [6,7,8].Microplastics have been detected in coastal waters, estuaries, sediments, and marine food webs worldwide, where they are readily ingested by organisms across multiple trophic levels [9,10]. Exposure to MPs has been associated with oxidative stress, immune dysregulation, metabolic disturbances, developmental impairment, histopathological damage, and altered gene expression in diverse aquatic taxa [7,11,12].While these physiological and molecular effects are increasingly documented, considerably less attention has been paid to how chronic microplastic exposure influences adaptive capacity, resilience, and long-term population persistence in ecologically important or threatened marine species. In addition to direct biological effects, MPs may also modify sediment characteristics and habitat quality, thereby influencing benthic community structure and ecosystem functioning.
The tri-spine horseshoe crab, Tachypleus tridentatus, is an ancient marine arthropod of considerable ecological and evolutionary importance and is widely recognized as a “living fossil”. However, populations of T. tridentatus have declined substantially in recent decades due to habitat degradation, coastal development, overexploitation, and environmental pollution [13].The species was classified as “Endangered”by the International Union for Conservation of Nature (IUCN) in 2019 and has been listed as a nationally protected wildlife species in China since 2021. Juvenile horseshoe crabs mainly inhabit intertidal mudflats and mangrove wetlands, habitats that are increasingly recognized as hotspots of microplastic accumulation.In the critical nursery areas of T. tridentatus along the northern Gulf of Tonkin, the concentration of microplastics in the water environment ranges from 399 to 5531 particles per cubic meter, and the abundance of microplastics in mangrove sediments can reach up to 12852 particles per kilogram [14,15,16]. Recent investigations in the northern Gulf of Tonkin, one of the major nursery grounds for T. tridentatus, revealed substantial levels of microplastic contamination in both coastal waters and mangrove sediments, indicating increasing pollution pressure on juvenile habitats [17,18].
Previous studies have reported the presence of microplastics in the gastrointestinal tracts of wild juvenile T. tridentatus, suggesting a relatively high capacity for microplastic accumulation compared with many benthic invertebrates [19]. Experimental studies further demonstrated that nanoplastic exposure can induce oxidative stress and disrupt molting- and metabolism-related pathways in juvenile horseshoe crabs [20,21,22]. Nevertheless, current knowledge remains largely focused on embryonic or early juvenile stages, whereas the responses of older juveniles during critical developmental periods remain poorly understood. Five- and six-year-old juveniles represent important transitional stages characterized by rapid somatic growth, enhanced mobility, and increasingly mature physiological and metabolic systems [23]. Developmental differences may therefore influence microplastic accumulation, stress sensitivity, detoxification capacity, and molecular regulatory mechanisms.
The ability of organisms to tolerate environmental stress often varies across ontogeny. Differences in physiological requirements, energy allocation patterns, and developmental processes may result in stage-specific sensitivity and adaptive responses to environmental change. Increasing evidence suggests that molecular plasticity plays a key role in determining the resilience of marine organisms exposed to anthropogenic stressors. However, despite growing concern regarding microplastic pollution, little is known about whether juvenile horseshoe crabs at different developmental stages exhibit distinct molecular response strategies when exposed to MPs. Such information is essential for understanding how pollution may influence individual fitness, population recruitment, and ultimately the persistence of endangered horseshoe crab populations.
Transcriptomic approaches provide powerful tools for characterizing genome-wide responses to environmental stress and identifying molecular pathways involved in adaptation and resilience. By revealing changes in gene expression associated with metabolism, immunity, stress defense, and developmental regulation, transcriptome analyses can provide mechanistic insights into organismal responses to pollution. Nevertheless, transcriptomic evidence regarding developmental-stage-specific responses to microplastic exposure remains extremely limited in horseshoe crabs.
Therefore, the present study investigated intestinal accumulation and transcriptomic responses in five- and six-year-old juvenile T. tridentatus exposed to environmentally relevant polystyrene microplastics (PS-MPs). We hypothesized that: (1) PS-MPs accumulate within the digestive tract of juvenile horseshoe crabs; (2) exposure induces significant transcriptomic reprogramming associated with stress esponse, metabolism, and immune regulation; and (3) developmental stages exhibit distinct molecular response strategies, reflecting differences in sensitivity and daptive capacity to environmental stress. By linking microplastic exposure to age-dependent molecular responses, this study provides new insights into the mechanisms underlying resilience and vulnerability in an endangered marine arthropod and contributes to biodiversity conservation and ecological risk assessment in increasingly polluted coastal ecosystems.
2. Materials and Methods
2.1. Experimental Animals and Microplastic Preparation
Fluorescent-labelled and non-fluorescent polystyrene microplastics (PS-MPs; diameter: 6.0 µm) were purchased from Polysciences (Warrington, PA, USA), with a stock concentration of 2.10×10⁸ particles mL-1. Prior to exposure, the PS-MP stock suspension was vortexed to ensure homogeneous particle dispersion.
The five- and six-instar-old juvenile Tachypleus tridentatus used in the experiments were provided by the Guangxi Marine Research Institute (Breeding Certificate No.:(Gui) Aquatic Wildlife Breeding Certificate(2023)0503007. Prior to the experiments, the juvenile horseshoe crabs were acclimated in standard artificial seawater (filtered through a 0.22 μm filter) for one week. During acclimation, the culture conditions were maintained as follows: temperature 24-26°C, salinity 28-30, pH 8.3-8.6, dissolved oxygen ≥ 6 mg/L, and photoperiod 14 h light:10 h dark. Juveniles were fed newly hatched brine shrimp (Artemia sp.) daily, with a feeding amount of approximately 1-2% of their body weight.Residual feed and feces were removed daily to maintain water quality.
To minimize external microplastic contamination, all experimental containers and instruments were rinsed three times with filtered distilled water before use, and glassware was preferentially used throughout the experiments.
2.2. Experimental Design and Microplastic Exposure
The PS-MP stock suspension was diluted with distilled water to obtain environmentally relevant exposure concentrations of 0 (control), 102, and 104 particles L-1. Exposure concentrations were selected based on previously reported microplastic levels in horseshoe crab nursery habitats and coastal sediment environments.
Exposure experiments were conducted separately for five-instar-old and six-instar-old juvenile T. tridentatus, with three replicates per concentration group. Each replicate contained 20 juvenile T. tridentatus in a 15 L glass tank with the corresponding exposure solution. The exposure period lasted 21 days. Exposure media were renewed every 48 h to maintain stable microplastic concentrations and water quality. During water renewal, aquarium walls were gently cleaned to reduce particle adsorption and aggregation. Experimental conditions, including temperature, salinity, dissolved oxygen, and feeding regime, were maintained consistently throughout the exposure period. Sampling was conducted on Days 7 and 21 to evaluate both short-term and prolonged exposure responses.
2.3. Observation and Quantification of Intestinal Microplastic Accumulation
At each sampling time point (Days 7 and 21), three juvenile horseshoe crabs were randomly collected from each treatment group for intestinal microplastic analysis. Individuals were anesthetized on ice prior to dissection. The entire gastrointestinal tract was carefully excised under sterile conditions and rinsed with filtered phosphate-buffered saline (PBS) to remove loosely attached particles.
Intestinal tissues were observed using a fluorescence inverted microscope (Axio Observer Z1, Carl Zeiss, Oberkochen, Germany). The distribution and accumulation of fluorescent PS-MPs in different intestinal regions, including the foregut and midgut, were recorded. Fluorescence images were captured under identical exposure settings for all samples.
Quantification of PS-MP accumulation was performed using image analysis software by counting fluorescent particles within standardized observation fields. At least five randomly selected fields were analyzed for each sample, and the mean particle number was used to estimate relative accumulation levels.
2.4. RNA Extraction, Library Construction, and Transcriptome Sequencing
For transcriptomic analysis, gastrointestinal tissues were collected from three randomly selected juveniles per treatment group on Days 7 and 21. Samples were immediately frozen in liquid nitrogen and stored at −80 °C until RNA extraction.
Total RNA was extracted using the RNeasy Mini Kit (QIAGEN, Germany) according to the manufacturer’s instructions. RNA integrity and quality were evaluated using 1% agarose gel electrophoresis, NanoPhotometer spectrophotometry, Qubit 2.0 fluorometry, and an Agilent 2100 Bioanalyzer. Only high-quality RNA samples with satisfactory integrity were used for subsequent sequencing.
RNA libraries were prepared using the NEBNext Ultra RNA Library Prep Kit (New England Biolabs, USA). Paired-end sequencing was subsequently performed on the Illumina HiSeq platform.
Raw sequencing reads were filtered to remove adapters, low-quality reads, and ambiguous bases. Clean reads were assembled de novo using Trinity software [24]. Functional annotation was performed against public databases including NR, Swiss-Prot, GO, and KEGG.
2.5. Differential Gene Expression and Functional Enrichment Analyses
Differentially expressed genes (DEGs) between treatment and control groups were identified using the DESeq2 package [25]. Genes with |log₂FoldChange| > 1 and adjusted p-value (padj) < 0.05 were considered significantly differentially expressed.
Gene Ontology (GO) enrichment analysis was performed to identify significantly enriched biological processes, cellular components, and molecular functions associated with DEGs. Kyoto Encyclopedia of Genes and Genomes (KEGG) pathway enrichment analysis was conducted to identify significantly affected metabolic and signaling pathways [26,27].
Age-dependent transcriptomic responses were further compared between five- and six-year-old juveniles to evaluate developmental differences in physiological sensitivity and molecular regulation under PS-MP exposure.
2.6. Statistical Analysis
Data are presented as mean ± standard deviation (SD). Statistical analyses were performed using SPSS 26.0 (IBM, Armonk, NY, USA). Differences among treatment groups were evaluated using one-way analysis of variance (ANOVA) followed by Tukey’s multiple comparison test. Differences were considered statistically significant at p < 0.05.
3. Results
3.1. Accumulation of PS-MPs in the Gastrointestinal Tract of T. tridentatus
Fluorescent particles were detected in the gastrointestinal tracts of T. tridentatus in all PS-MPs exposure groups (Figure 1 and Figure 2). The accumulation levels showed a clear concentration-dependent relationship, with higher exposure concentrations resulting in a greater number of PS-MPs observed in the gastrointestinal tract (Figure 1 and Figure 2). The accumulation of PS-MPs was more pronounced in intestinal segments with higher amounts of food residues, and a significant amount of MP signals was also observed in the excreta. PS-MPs were not evenly distributed throughout the gastrointestinal tract; the midgut was the primary site of accumulation, while the foregut exhibited relatively lower accumulation. Additionally, the amount of intestinal contents was associated with the accumulation of PS-MPs, as segments with more contents generally showed stronger fluorescence signals.
When comparing different age groups, at the same exposure concentration and duration, the accumulation of PS-MPs in the midgut of six-instar-old T. tridentatus was significantly higher than in the five-instar-old individuals (Figure 3). However, as the exposure duration was extended from 7 to 21 days, the PS-MP content in the gastrointestinal tract of the same concentration group exhibited a decreasing trend (Figure 3).
3.2. Transcriptome Assembly and Functional Annotation
Transcriptome sequencing was performed on all 36 samples, and de novo assembly resulted in 373,069 unigenes. Species homology analysis indicated that the species most similar to T. tridentatus was the Limulus polyphemus, with a match rate of 45.6%, followed by other arthropods (Figure 4). GO functional classification showed that the annotated genes were primarily involved in biological processes such as "cellular process," "metabolic process," and "biological regulation," and exhibited molecular functions including "binding" and "catalytic activity" (Figure 5A). KOG classification results revealed that categories such as "signal transduction mechanisms" and "general functional prediction" were predominant (Figure 5B). KEGG pathway enrichment analysis identified the most abundant pathway categories, including "signal transduction," "amino acid metabolism," "transport and catabolism," "endocrine system," and "immune system" (Figure 5C).
3.3. Differentially Expressed Gene Analysis
Differential expression gene analysis revealed complex gene expression changes between the different treatment groups (Figure 6). Microplastic exposure significantly altered the gene expression profile, with a much larger number of differentially expressed genes (DEGs) observed under high concentration exposure compared to low concentration exposure. In the 7-day exposure group, most comparison groups (e.g., SL vs SC, SH vs SC) had more upregulated genes than downregulated genes. However, by the 21-day exposure group, this trend reversed, with the majority of comparison groups (e.g., SP vs SN, SG vs SN) showing more downregulated genes than upregulated genes. Notably, after 7 days of low concentration exposure, the proportion of upregulated genes in the five-instar-old horseshoe crabs (SL vs SC) reached 71.2%, whereas in the same conditions, the six-instar-old horseshoe crabs (FL vs FC) exhibited a dominant proportion of downregulated genes (62.5%). Among all pairwise comparisons, the highest number of DEGs was observed between the five-instar-old and six-instar-old groups under high concentration exposure at 7 days (SH vs FH), with a total of 33,462 DEGs.
Note: SC, control group (five-instar, 7 d); SL, low-concentration group (five-instar, 7 d); SH, high-concentration group (five-instar, 7 d); FC, control group (six-instar, 7 d); FL, low-concentration group (six-instar, 7 d); FH, high-concentration group (six-instar, 7 d); SN, control group (five-instar, 21 d); SP, low-concentration group (five-instar, 21 d); SG, high-concentration group (five-instar, 21 d); FN, control group (six-instar, 21 d); FP, low-concentration group (six-instar, 21 d); FG, high-concentration group (six-instar, 21 d). See the Materials and Methods section for
3.4. Results of Functional Enrichment Analysis
Compared to their respective control groups, both low and high concentration stress exposures induced significant transcriptomic responses after short-term exposure (7 days). GO enrichment analysis revealed that differentially expressed genes were involved in processes such as "signal transduction" and "transmembrane transport" (Figure 8 A1, C1). KEGG pathway enrichment analysis showed that the pathways responding in five-instar-old T. tridentatus were primarily related to "cardiomyopathy" and "calcium signaling pathways" (Figure 8 B1), while six-instar-old T. tridentatus were significantly enriched in pathways associated with neurodegenerative diseases and energy metabolism, such as "Parkinson’s disease," "oxidative phosphorylation," and "carbon metabolism" (Figure 8 D1).
Under long-term exposure (21 days), downregulated genes were predominant. GO enrichment analysis for these genes mainly identified molecular functions such as "hydrolase activity," "peptidase activity," and "oxidoreductase activity" (Figure 8 E1, G1). KEGG analysis revealed that the high concentration group of five-instar-old horseshoe crabs (SG vs SN) was enriched in pathways including "PI3K-Akt signaling pathway" and "neuroactive ligand-receptor interaction" (Figure 8 F1), while the high concentration group of six-instar-old horseshoe crabs (FG vs FN) was enriched in metabolic pathways such as "pancreatic secretion" and "glycine, serine, and threonine metabolism" (Figure 8 H1).
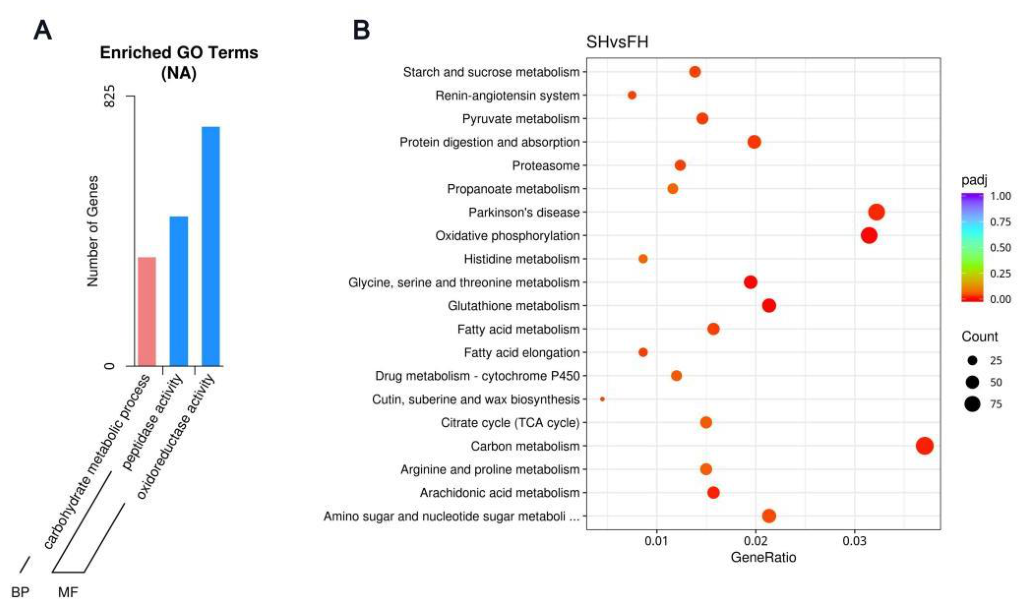
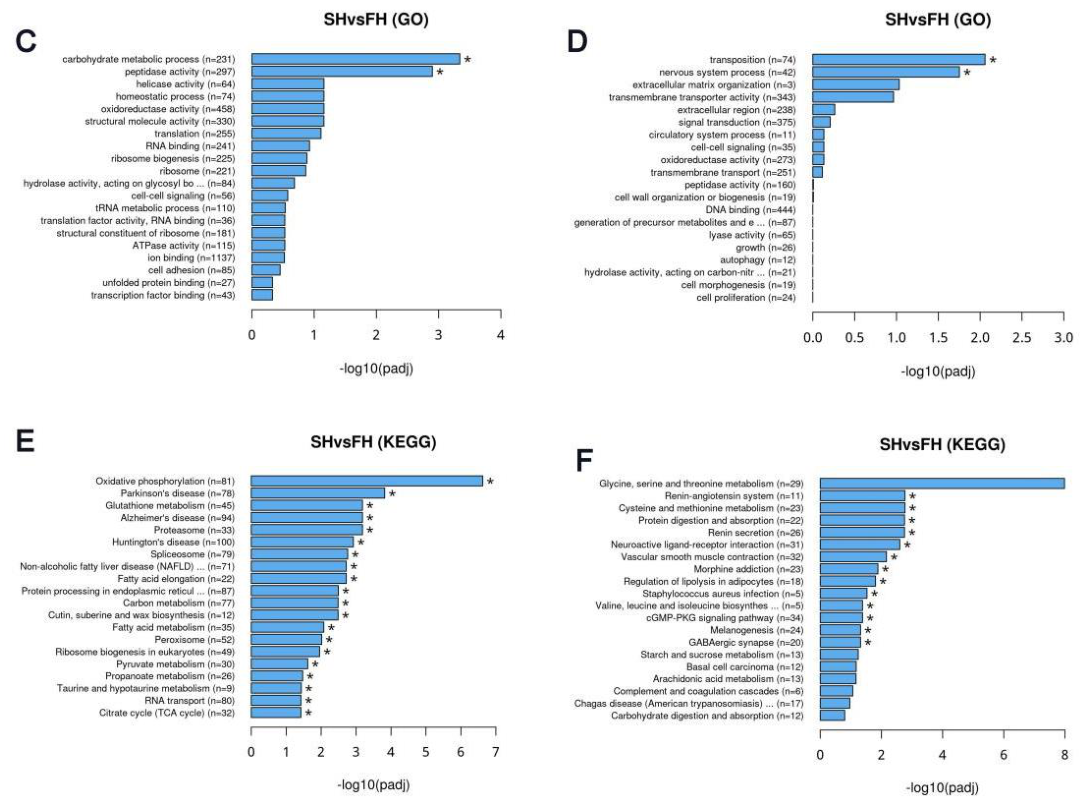
Further comparative analysis revealed differences in molecular responses under different conditions. For instance, the comparison between five-instar-old and six-instar-old horseshoe crabs under high concentration exposure (SH vs FH) showed that DEGs were significantly enriched in pathways such as "carbon metabolism" and "Parkinson’s disease," with a higher enrichment of downregulated genes (Figure 9). On the other hand, the comparison of different exposure durations in the five-instar-old high concentration group (SH vs SG) highlighted the downregulation of the "ribosome" pathway (Figure 10).
Figure 7.
Enrichment of differentially expressed genes in the control groups of five-instar-old and six-instar-old T. tridentatus. (A) Bar chart of GO enrichment analysis for differentially expressed genes. (B) Scatter plot of KEGG pathway enrichment.
Figure 7.
Enrichment of differentially expressed genes in the control groups of five-instar-old and six-instar-old T. tridentatus. (A) Bar chart of GO enrichment analysis for differentially expressed genes. (B) Scatter plot of KEGG pathway enrichment.
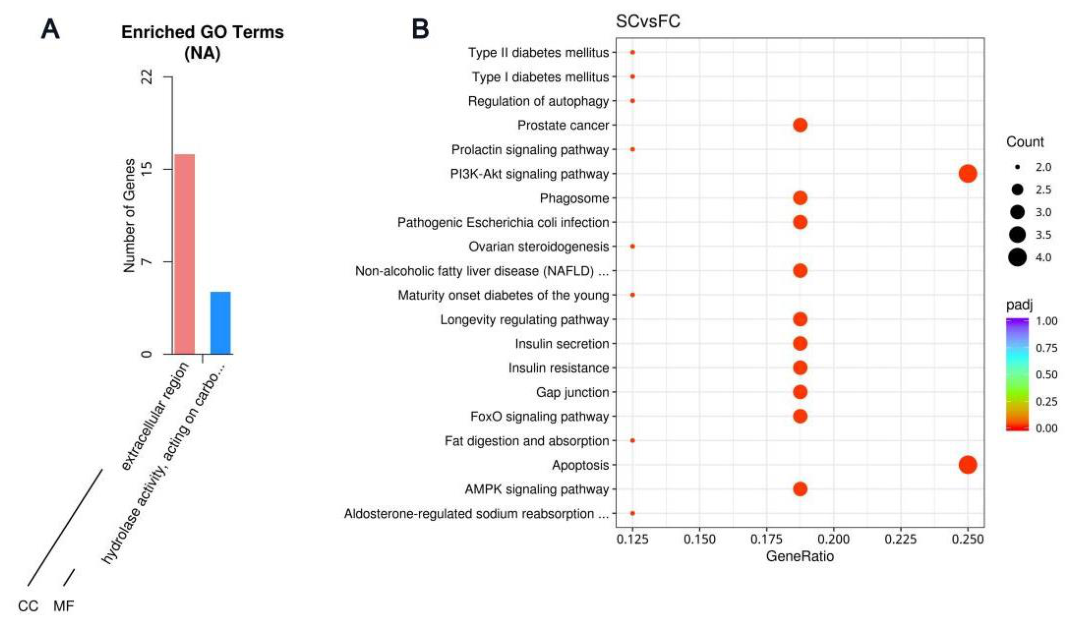
Note: The GO enrichment bar chart displays only the terms with a statistical significance of padj < 0.05, showing the top 30 most significant terms. If fewer than 30 terms meet this criterion, all the terms are displayed. The x-axis represents the next level of GO terms under the three major categories (biological process, cellular component, and molecular function), while the y-axis shows the number of differentially expressed genes annotated to that term (including its subterms). The three different categories represent the basic categories of GO terms (from left to right: biological process, cellular component, and molecular function). For KEGG pathway enrichment, the significance threshold for enrichment is also set at padj < 0.05. The y-axis represents the pathway names, while the x-axis shows the corresponding gene ratio for each pathway. The size of the dots reflects the number of differentially expressed genes within each pathway, and the color of the dots indicates the q-value, with smaller q-values represented by a more intense red color.
After 7 days of exposure under different concentration conditions, when comparing the five-instar-old and six-instar-old groups to their respective control groups (SC, FC), the number of upregulated genes exceeded the number of downregulated genes in all treatment groups. The group with the most DEGs was the FH group (high concentration for six-instar-old), with 5003 DEGs, 59.9% of which were upregulated. The group with the least DEGs was the FL group (low concentration for six-instar-old), with 1093 DEGs, of which 37.5% were upregulated.
GO functional classification annotation revealed that, compared to the control groups, most of the differentially expressed genes (DEGs) were enriched in the "cellular component" category, with the extracellular region showing the highest enrichment. In the "biological process" category, the DEGs in the SL group were most abundant in "signal transduction" and "transmembrane transport," both of which are related to signal transduction and material transport. The SH group had DEGs primarily related to "cell adhesion." The FH group mainly involved genes related to gene generation. In the "molecular function" category, more than half of the DEGs in the FH group were related to molecular function, involving multiple pathways.Thus, the differentially expressed genes under different conditions were related to protein and gene synthesis pathways, as well as signal transduction and response mechanisms, adjustments in cellular structures and protective barriers, and changes in material transport and metabolism (Figure 8).
After 7 days of exposure, KEGG pathway enrichment analysis indicated that, compared to the control groups, the significantly enriched KEGG pathways were similar within the same age group under different concentrations. Both the SL and SH groups were enriched in pathways such as "Tight junction" and "Hypertrophic cardiomyopathy (HCM)," which are related to cardiovascular diseases, myocardial contraction, and metabolic abnormalities in cardiomyopathy. Notably, the majority of the most significantly responsive KEGG pathways were related to hormone secretion and signaling (including signaling molecules), and myocardial inflammation, which are involved in immune processes.
In the FL and FH groups, the commonly enriched pathways were "Parkinson’s disease" and "Oxidative phosphorylation," both of which are related to neurodegenerative diseases, energy metabolism abnormalities, and systemic metabolic disorders, involving shared mechanisms such as cell dysfunction, oxidative stress, and gene-environment interactions. In addition to the common pathways mentioned above, there were also pathways related to energy metabolism, amino acid processing, protein synthesis, and antioxidant defense (Figure 8, 7d).
Figure 8.
Enrichment analysis of differentially expressed genes (DEGs) in T. tridentatus exposed to different concentrations of PS-MPs for 7 days (A1–D2) or 21 days (E1–H2). A1, A2, C1, C2, E1, E2, G1, and G2 present bar charts of GO enrichment analysis for DEGs; B1, B2, D1, D2, F1, F2, H1, and H2 illustrate scatter plots for KEGG pathway enrichment analysis.
Figure 8.
Enrichment analysis of differentially expressed genes (DEGs) in T. tridentatus exposed to different concentrations of PS-MPs for 7 days (A1–D2) or 21 days (E1–H2). A1, A2, C1, C2, E1, E2, G1, and G2 present bar charts of GO enrichment analysis for DEGs; B1, B2, D1, D2, F1, F2, H1, and H2 illustrate scatter plots for KEGG pathway enrichment analysis.
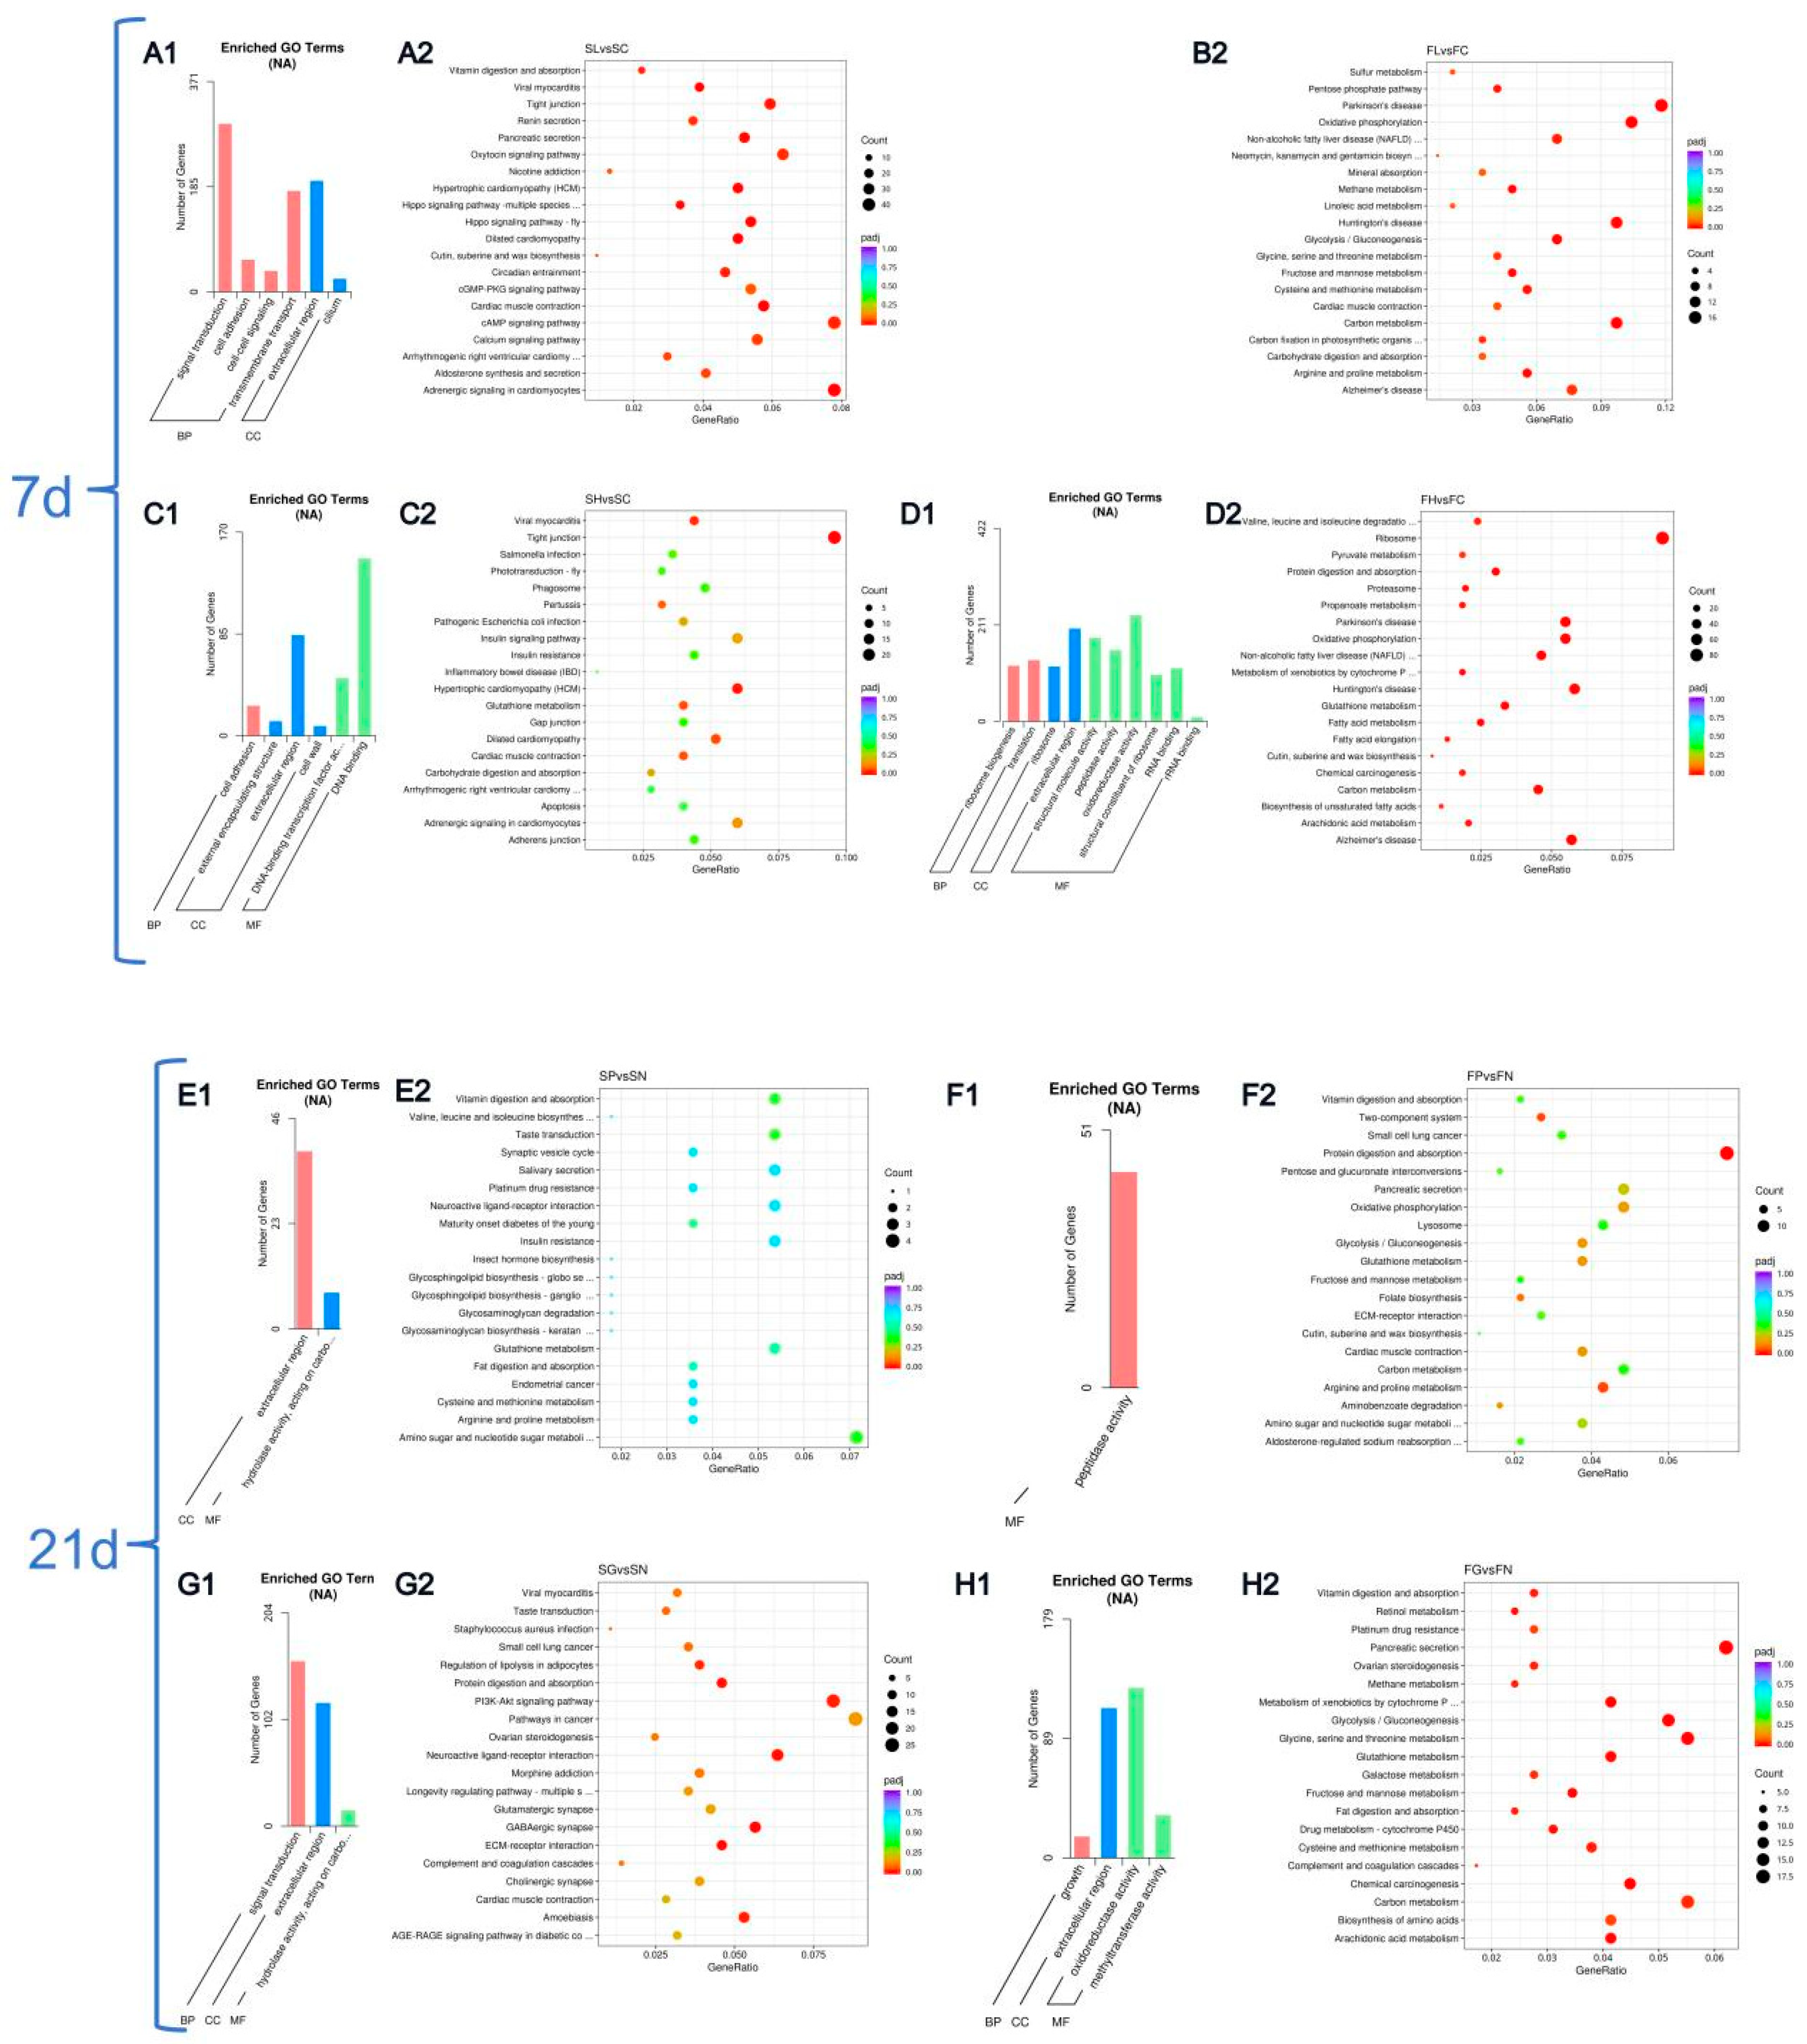
Note: In the GO enrichment plots, only terms that were significantly enriched are displayed. A threshold of padj < 0.05 was applied to determine significant enrichment (see Materials and Methods).
After 21 days of exposure under different concentration conditions, the number of downregulated genes exceeded the number of upregulated genes in both the fifth-instar and sixth-instar T. tridentatus compared to the control groups. The SG group had the highest number of differentially expressed genes (2877), with 44.3% being upregulated, while the SP group had the fewest DEGs (585), with 45.3% being upregulated.
GO functional enrichment analysis revealed that all four groups had DEGs significantly associated with molecular function, with most of these enriched terms related to protein synthesis and degradation. In the cellular component category, all experimental groups except the FP group were associated with the extracellular region. In the biological process category, the SP and FP groups showed no significantly enriched DEGs, while the SG group was significantly enriched in signal transduction.
KEGG pathway enrichment analysis showed that the SP group had the least significant enrichment, with a low number of DEGs in each pathway, and more than half of the pathways contained only a single differentially expressed gene. In the FP group, only the "Protein digestion and absorption" pathway had more than 10 genes. In contrast, the SG and FG groups showed more significant enrichment of DEGs in pathways. The FG group had the most significantly enriched pathways, with the highest number of DEGs, including pathways like "Pancreatic secretion" (18 DEGs). Although there were large differences in the level of enrichment, it is noteworthy that most of the enriched pathways were related to amino acid, carbohydrate, and lipid metabolism, cell signaling (MAPK, PI3K-Akt), and disease mechanisms, particularly metabolic diseases and cancer (Figure 8, 21d).
3.5. Functional Annotation Analysis of Differentially Expressed Genes Between Experimental Groups
The experimental groups with the highest number of differentially expressed genes (DEGs) were selected to investigate the similarities and differences in DEG functional expression under different experimental conditions in T. tridentatus.
A total of 33,462 DEGs were identified when comparing the SH group (fifth-instar, 7 days, high concentration) to the FH group (sixth-instar, 7 days, high concentration). GO enrichment analysis of upregulated and downregulated DEGs showed that, in the "biological process" category, the upregulated DEGs in the SH vs. FH comparison were significantly enriched in functions such as "transposition" and "nervous system process," while the downregulated DEGs were significantly enriched in "carbohydrate metabolic process." In the "molecular function" category, only downregulated DEGs were significantly enriched, specifically in "peptidase activity" (Figure 9C-D).
Figure 9B presents the results of KEGG pathway enrichment analysis for SH vs. FH. The significantly enriched pathways included "Carbon metabolism" (99 DEGs), among others. A comparison of the enriched pathways for upregulated and downregulated DEGs revealed that the number of pathways enriched with downregulated DEGs was greater than that for upregulated DEGs. Additionally, the number of DEGs within the pathways enriched for downregulated genes was generally higher than those for upregulated genes (Figure 9E-F). Notably, pathways related to neurodegenerative diseases were predominantly enriched in downregulated DEGs, while upregulated DEGs were concentrated in pathways associated with signal transduction and muscle contraction. These findings suggest that downregulated genes may play a more critical regulatory role in the response to microplastic stress.
Figure 9.
Enrichment analysis and annotation of DEGs for SH vs FH. (A) Bar chart of GO pathway enrichment analysis for differentially expressed genes (DEGs); (B) Scatter plot of KEGG pathway enrichment analysis for DEGs; (C) Bar chart of GO pathway enrichment analysis for downregulated DEGs in SH vs FH; (D) Bar chart of GO pathway enrichment analysis for upregulated DEGs in SH vs FH; (E) Bar chart of KEGG pathway enrichment analysis for downregulated DEGs in SH vs FH; (F) Bar chart of KEGG pathway enrichment analysis for upregulated DEGs in SH vs FH.
Figure 9.
Enrichment analysis and annotation of DEGs for SH vs FH. (A) Bar chart of GO pathway enrichment analysis for differentially expressed genes (DEGs); (B) Scatter plot of KEGG pathway enrichment analysis for DEGs; (C) Bar chart of GO pathway enrichment analysis for downregulated DEGs in SH vs FH; (D) Bar chart of GO pathway enrichment analysis for upregulated DEGs in SH vs FH; (E) Bar chart of KEGG pathway enrichment analysis for downregulated DEGs in SH vs FH; (F) Bar chart of KEGG pathway enrichment analysis for upregulated DEGs in SH vs FH.
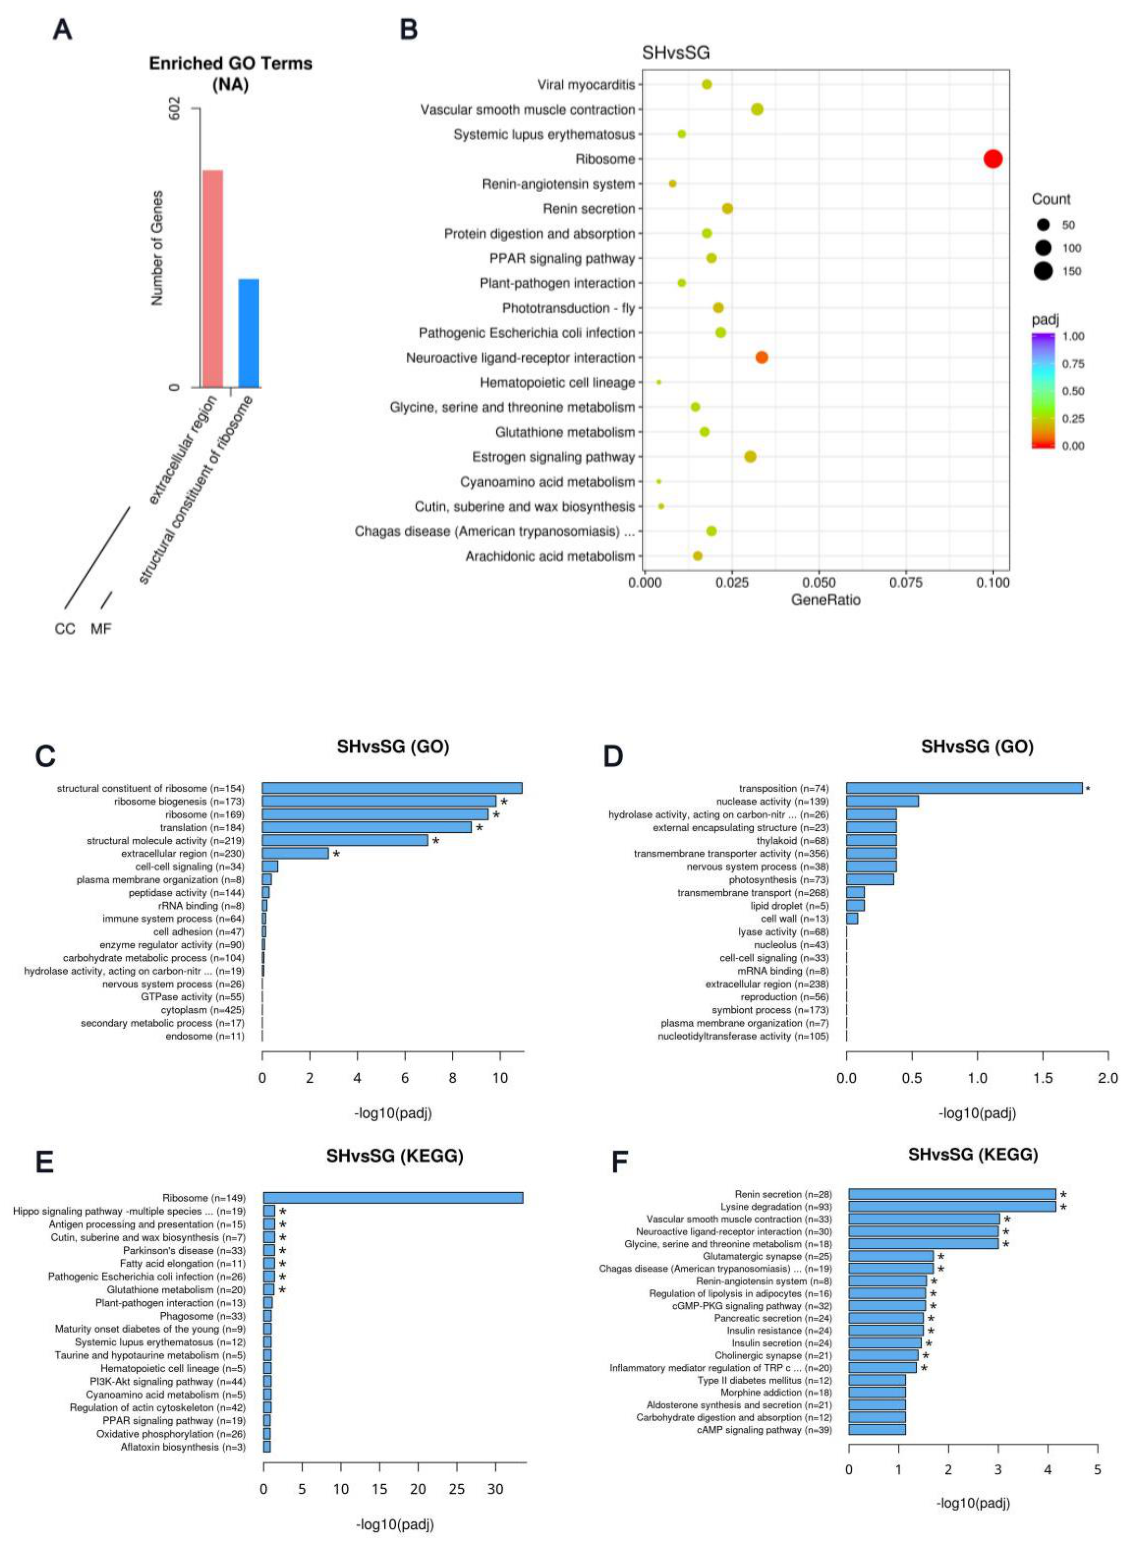
When comparing the SH group (fifth-instar, 7 days, high concentration) to the SG group (fifth-instar, 21 days, high concentration), a total of 28,137 DEGs were identified. A presents the results of the GO functional enrichment analysis. The upregulated DEGs were significantly enriched in only one biological process category, "transposition," while the downregulated DEGs were significantly enriched in both the "biological process" and "cellular component" categories (Figure 10C-D). However, whether upregulated or downregulated DEGs, or total DEGs, the functional enrichment results for GO were consistent. Overall, the downregulated DEGs exhibited a broader range of functional enrichment, with all three functional areas related to ribosome design, indicating higher activity in the functional enrichment of downregulated DEGs.
KEGG pathway enrichment analysis revealed that the only significantly enriched pathway for total DEGs was "Ribosome" (152 DEGs) (Figure 10B), whereas the number of significantly enriched pathways for upregulated and downregulated DEGs was higher (Figure 10E-F). The upregulated DEGs were significantly enriched in more pathways, spanning across metabolism and signal transduction, suggesting a strong regulatory effect of the SH group on cellular metabolism and signal transduction. In conclusion, under high concentration conditions, the SH group significantly impacted growth and metabolic pathways by downregulating/inhibiting core protein synthesis and extracellular region-related functions, with the diversity of upregulated pathways potentially reflecting stress or adaptive responses.
Figure 10.
Enrichment analysis and annotation of DEGs for SH vs SG. (A) Bar chart of GO pathway enrichment analysis for differentially expressed genes (DEGs); (B) Scatter plot of KEGG pathway enrichment analysis for DEGs; (C) Bar chart of GO pathway enrichment analysis for downregulated DEGs in SH vs SG; (D) Bar chart of GO pathway enrichment analysis for upregulated DEGs in SH vs SG; (E) Bar chart of KEGG pathway enrichment analysis for downregulated DEGs in SH vs SG; (F) Bar chart of KEGG pathway enrichment analysis for upregulated DEGs in SH vs SG.
Figure 10.
Enrichment analysis and annotation of DEGs for SH vs SG. (A) Bar chart of GO pathway enrichment analysis for differentially expressed genes (DEGs); (B) Scatter plot of KEGG pathway enrichment analysis for DEGs; (C) Bar chart of GO pathway enrichment analysis for downregulated DEGs in SH vs SG; (D) Bar chart of GO pathway enrichment analysis for upregulated DEGs in SH vs SG; (E) Bar chart of KEGG pathway enrichment analysis for downregulated DEGs in SH vs SG; (F) Bar chart of KEGG pathway enrichment analysis for upregulated DEGs in SH vs SG.
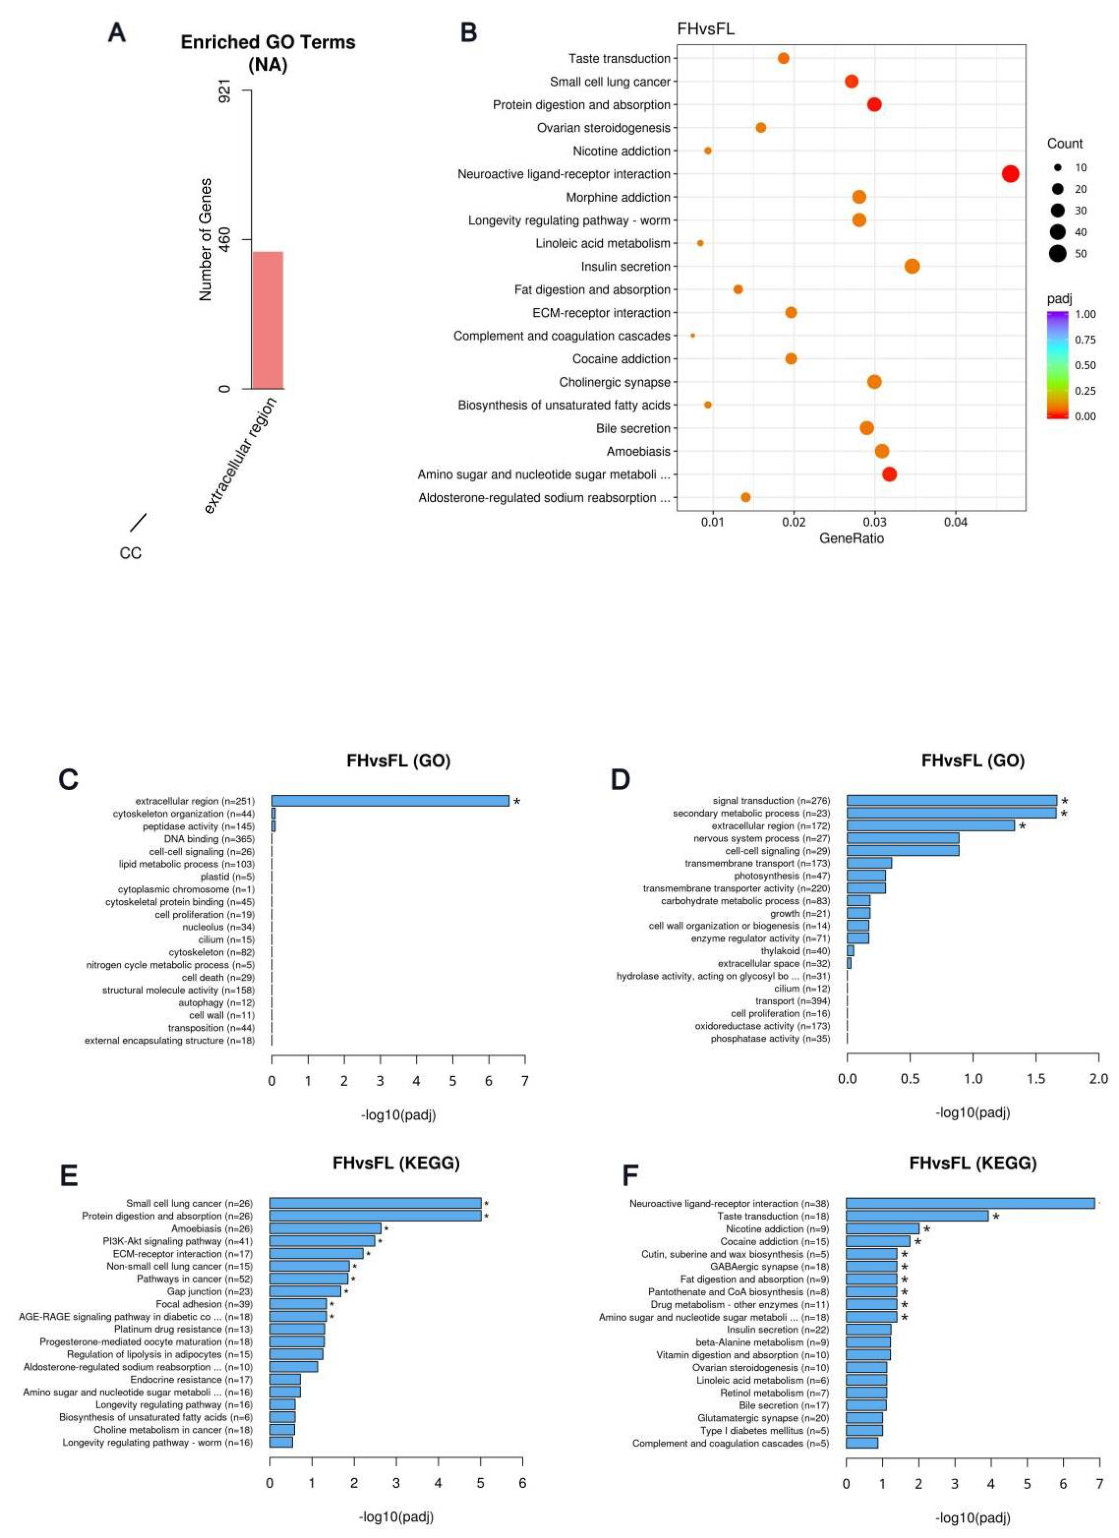
When comparing the FH group (sixth-instar, 7 days, high concentration) to the FL group (sixth-instar, 7 days, low concentration), a total of 21,618 DEGs were identified. GO functional enrichment analysis revealed that the only significantly enriched term was "extracellular region" in the "cellular component" category (Figure 11A). Both upregulated and downregulated DEGs were enriched in "extracellular region" (Figure 11C-D), indicating that high-concentration treatment may respond through signal transduction and secondary metabolic processes, with these processes primarily occurring in the extracellular environment.
According to KEGG pathway enrichment analysis, the significantly enriched pathways for FH vs FL DEGs are shown in Figure 11B. The number of DEGs in downregulated pathways was on average higher than in upregulated pathways, and the types of pathways differed. The FH group showed a relatively integrated regulatory response in processes such as intercellular signal transduction, energy and nutrient metabolism balance, and cell proliferation/survival signaling. Overall, the FH group, compared to the FL group, exhibited a trend toward the reorganization of extracellular signal sensing and metabolic networks, with differences not only reflected in the pathways that were enriched, but also in the distribution differences between upregulated and downregulated pathways.
4. Discussion
4.1. Intestinal Accumulation of PS-MPs Reveals Continuous Exposure Risks for Juvenile Horseshoe Crabs
Microplastics have become pervasive contaminants in coastal ecosystems and are increasingly recognized as important environmental stressors affecting marine biodiversity and ecosystem functioning [28,29]. Numerous studies have demonstrated that microplastics are widely distributed in coastal sediments and estuarine habitats and can be readily ingested by benthic organisms through feeding and sediment-associated exposure pathways [28,30].In the present study, fluorescent PS-MPs accumulated within the digestive tract of juvenile Tachypleus tridentatus, confirming that developing horseshoe crabs are capable of ingesting and retaining microplastic particles under environmentally relevant exposure conditions. As juvenile horseshoe crabs inhabit shallow intertidal and estuarine environments where microplastic contamination is widespread, intestinal accumulation may represent a realistic and chronic exposure pathway in natural populations.
The observed accumulation pattern suggests that the digestive system serves as a primary interface between microplastic pollution and organismal health. Previous studies have shown that ingested microplastics are predominantly retained within the gastrointestinal tract of aquatic organisms and may interfere with feeding behavior, nutrient assimilation, digestive efficiency, and physiological homeostasis [31,32]. Persistent retention of microplastics may further increase energetic demands associated with maintenance, detoxification, and stress responses, potentially diverting resources away from growth and development. Such effects may be particularly important for juvenile horseshoe crabs because early developmental stages generally possess limited energetic reserves and greater sensitivity to environmental disturbances. Consequently, chronic exposure to microplastics may represent a previously underestimated threat to the successful recruitment and long-term persistence of endangered horseshoe crab populations.
From a biodiversity conservation perspective, understanding exposure pathways is essential because environmental stressors that impair juvenile survival or developmental performance can ultimately influence population dynamics. Increasing evidence indicates that anthropogenic pressures can alter species vulnerability and adaptive potential, thereby affecting ecosystem resilience and biodiversity maintenance. The accumulation of PS-MPs observed in this study therefore highlights a potential mechanism through which coastal pollution may contribute to conservation challenges facing horseshoe crabs. Similar concerns have been raised for other marine invertebrates, where chronic microplastic exposure may generate sublethal effects that accumulate across life stages and ultimately affect population persistence and ecosystem functioning.
4.2. Transcriptomic Reprogramming Reflects Molecular Plasticity Under Microplastic Stress
Transcriptomic analyses revealed substantial changes in gene expression following PS-MP exposure, demonstrating that microplastics induce broad molecular responses in juvenile T. tridentatus. The number of DEGs in the high concentration PS-MPs exposure group was significantly higher than that in the low concentration group, indicating that high-concentration microplastics exert a stronger disturbance on the gene expression in the juvenile horseshoe crab’s gastrointestinal tract. Differentially expressed genes were primarily associated with metabolic regulation, immune processes, signal transduction, cellular stress responses, and developmental pathways. Similar transcriptomic alterations have been reported in a variety of aquatic organisms exposed to microplastics, suggesting that MPs affect multiple biological processes simultaneously rather than acting through a single toxicological mechanism [33,34,35]. Exposure to microplastics has been shown to modify genes involved in oxidative stress, immunity, lipid metabolism, apoptosis, and developmental regulation across diverse aquatic taxa.
Environmental stressors frequently trigger transcriptomic plasticity, enabling organisms to modify physiological functions in response to changing environmental conditions. Such plasticity represents an important component of adaptive capacity because it allows organisms to maintain cellular homeostasis while minimizing fitness loss. In marine ecosystems, resilience to environmental change is often linked to the ability of species to regulate metabolic processes, activate defense mechanisms, and reorganize physiological pathways under stress [36,37]. Gene expression responses are therefore increasingly recognized as useful indicators for assessing the capacity of marine organisms to cope with environmental change and anthropogenic stressors.
The enrichment of genes involved in energy metabolism suggests that exposure to PS-MPs imposes additional energetic costs. Increased energy expenditure associated with detoxification, cellular repair, immune activation, and stress defense may divert resources away from growth and development. Similar energetic trade-offs have been reported in marine invertebrates exposed to microplastics and other environmental stressors, where physiological compensation often occurs at the expense of growth, reproduction, or long-term performance [33,38]. Consequently, transcriptomic reprogramming observed in juvenile horseshoe crabs likely reflects an attempt to maintain homeostasis under microplastic-induced stress.
In addition, alterations in immune-related and stress-response pathways indicate that microplastic exposure may challenge host defense systems. Activation of these pathways may represent protective responses designed to reduce cellular damage and preserve organismal function. Reviews of microplastic ecotoxicology have consistently shown that changes in immune regulation, antioxidant defenses, and stress-response genes constitute common molecular signatures of microplastic exposure across aquatic organisms [34,35]. Collectively, these molecular adjustments demonstrate that PS-MPs act as biologically relevant environmental stressors capable of eliciting complex adaptive responses in an endangered marine arthropod.
4.3. Age-Dependent Molecular Response Strategies Indicate Differences in Adaptive Capacity
Developmental stage was the strongest factor influencing transcriptomic responses to microplastic exposure in the present study. Although all age groups accumulated PS-MPs, the magnitude and functional composition of differentially expressed genes varied considerably among developmental stages, indicating age-dependent molecular response strategies. Similar ontogenetic differences in environmental responses have been reported in a wide range of marine organisms, suggesting that developmental stage is a key determinant of physiological sensitivity and adaptive potential [39,40].
Developmental-stage variation in environmental sensitivity is common across marine taxa because physiological requirements, energy allocation patterns, and regulatory mechanisms change throughout ontogeny [39]. Younger juveniles are generally characterized by rapid growth and elevated metabolic demands, making them particularly vulnerable to environmental disturbances. In contrast, older juveniles often possess more developed physiological systems and greater capacity to maintain internal stability when confronted with external stressors. Studies on marine invertebrates have shown that early developmental stages frequently exhibit stronger molecular and physiological responses to environmental stress than later life stages, reflecting differences in developmental constraints and energetic allocation strategies [40].
Our results support this concept by showing that younger developmental stages exhibited stronger transcriptional perturbations in pathways associated with metabolic regulation and cellular stress responses, suggesting greater physiological sensitivity to PS-MP exposure. Conversely, older juveniles displayed more coordinated regulation of pathways involved in homeostasis, immune function, and adaptive adjustment. These differences may indicate enhanced physiological buffering capacity and greater resilience in later developmental stages. Similar age-dependent transcriptomic responses have been reported in marine organisms exposed to environmental stressors, where older developmental stages often exhibit more stable gene-expression networks and improved stress tolerance [34,37].
Importantly, age-dependent molecular plasticity may influence how individuals cope with environmental change. Adaptive capacity is increasingly recognized as a key determinant of species persistence under anthropogenic stress [3,41].Variation in molecular response strategies among developmental stages suggests that vulnerability to microplastic pollution is not uniform across the life cycle. Consequently, ecological risk assessments based solely on a single developmental stage may underestimate the true impacts of environmental contaminants on natural populations. These findings highlight the importance of incorporating ontogenetic variation into conservation assessments and biodiversity management strategies, particularly for endangered species with complex life histories such as T. tridentatus [2,5].
4.4. Implications for Resilience, Population Persistence, and Conservation
Recent biodiversity research has emphasized that species persistence under environmental change depends not only on exposure intensity but also on resilience mechanisms operating across biological levels, from molecular responses to population dynamics [4,5,41], The present study provides evidence that juvenile T. tridentatus possesses the capacity to mount transcriptomic responses to microplastic exposure; however, the pronounced developmental differences observed among age groups suggest that resilience may vary substantially throughout ontogeny. Such findings support the growing view that adaptive capacity and physiological plasticity are fundamental determinants of species persistence in rapidly changing environments [36,37].
For endangered species such as T. tridentatus, early life stages often represent demographic bottlenecks that strongly influence population recruitment and recovery [42].If chronic microplastic exposure reduces growth performance, developmental stability, or survival during sensitive juvenile stages, long-term consequences may emerge even when immediate mortality is not observed. Such sublethal effects are increasingly recognized as important drivers of population vulnerability under multiple environmental stressors and may ultimately influence recruitment success and long-term population viability [4,5].
The conservation implications of these findings are particularly relevant for coastal ecosystems experiencing rapid environmental change. Horseshoe crab populations are already threatened by habitat degradation, coastal development, fisheries bycatch, and anthropogenic disturbance [43]. The addition of microplastic pollution may further challenge the resilience of juvenile populations by increasing energetic costs and altering molecular regulatory processes. Therefore, developmental-stage-specific sensitivity should be incorporated into future ecological risk assessments, conservation planning, and management strategies for horseshoe crabs. Similar recommendations have been proposed for biodiversity conservation under global environmental change, where species vulnerability assessments increasingly consider adaptive capacity and life-history variation [3,41].
More broadly, the age-dependent responses identified here may extend beyond horseshoe crabs and occur in other marine benthic arthropods exposed to environmental contaminants. Recognizing ontogenetic variation in adaptive capacity could improve predictions of species vulnerability and strengthen biodiversity conservation efforts in increasingly polluted marine environments [2,5]. The present findings therefore contribute not only to understanding the ecological risks of microplastic pollution but also to broader efforts aimed at conserving marine biodiversity and enhancing resilience in threatened coastal ecosystems.
5. Conclusion
This study demonstrates that environmentally relevant polystyrene microplastics (PS-MPs) accumulate in the digestive tract of juvenile Tachypleus tridentatus, triggering transcriptomic reprogramming that disturbs metabolism, immune defense, cellular stress responses and developmental homeostasis. As a critical anthropogenic stressor, microplastic exposure profoundly disrupts core physiological functions of this endangered marine arthropod.
Distinct ontogenetic responses to PS-MPs were evident between developmental stages. Both 5th- and 6th-instar juveniles accumulated microplastics, yet younger individuals suffered greater disruption of metabolic and stress pathways, whereas older juveniles exhibited stronger regulatory capacity to maintain immune stability and physiological resilience. This stage-specific plasticity highlights that developmental status determines the species’ vulnerability to microplastic pollution.
From a biodiversity conservation perspective, microplastic contamination impairs individual fitness and may hinder population recruitment and long-term persistence. As early life stages represent critical population bottlenecks for horseshoe crabs, chronic microplastic exposure can constrain population recovery. Single-stage toxicological assessments therefore likely underestimate the ecological risks of pollutants to threatened marine species.
This study provides novel molecular evidence for age-dependent microplastic sensitivity in endangered T. tridentatus. It advances the mechanistic understanding of stage-specific vulnerability to anthropogenic pollution in marine invertebrates. Overall, the findings emphasize the necessity of integrating ontogenetic variation into ecological risk evaluation and conservation frameworks to improve the protection of coastal biodiversity under growing human disturbance.
- Highlights
- Environmentally relevant PS-MPs accumulate in juvenile Tachypleus tridentatus, with older individuals showing higher intestinal accumulation.
- PS-MPs remodel transcriptomic pathways governing metabolism, immunity and stress defense.
- Significant ontogenetic response differences determine the horseshoe crab’s vulnerability and conservation implications under microplastic stress.
Supplementary Materials
The following supporting information can be downloaded at the website of this paper posted on Preprints.org.
Author Contributions
Conceptualization: Y.L.and J. B.; Methodology and Laboratory Experiments: W. J.;C.C.; S.L; Supervision: Y.L.; Visualization: Y.T.; W. J.; L.H; Y.Land C.Z.; Writing—original draft: Y.L.; W. J.; C.C.; S.L; J. B.; C.Z. and T.Z.; Funding acquisition: Y.L. All authors have read and agreed to the published version of the manuscript.
Funding
This work was financially supported the Natural Science Foundation of Fujian Province (Grant No. 2023J01134).
Data Availability Statement
The original contributions presented in the study are included in the article/Supplementary Materials. Further inquiries can be directed to the corresponding author.:
Ethics
The animal procedures were approved by the ethics committee of Third Institute of Oceanography, Ministry of Natural Resources, China (No. TIO-IACUC-01-2024-03-08).
Conflicts of Interest
The authors declare no conflicts of interest.
References
- Meyer, A.S.; Pigot, A.L.; Merow, C.; Kaschner, K.; Garilao, C.; Reyes, K.K.; Trisos, C.H. Temporal dynamics of climate change exposure and opportunities for global marine biodiversity. Nat Commun. 2024, 15, 5836. [CrossRef]
- Hillebrand, H.; Baums, I.B.; Beng, K.C.C.; Dajka, J.C.; Franke, A.; Hodapp, D.; Laakmann, S.; Levi, S.; McCarthy, A.; Neun, S., et al. Towards a broader perspective on marine biodiversity change. Mar Biodivers. 2025, 56, 1. [CrossRef]
- Dube, K. A Comprehensive Review of Climatic Threats and Adaptation of Marine Biodiversity. J Mar Sci Eng. 2024, 12, 344. [CrossRef]
- Bernhardt, J.R.; Leslie, H.M. Resilience to Climate Change in Coastal Marine Ecosystems. Annu Rev Mar Sci. 2013, 5, 371-392. [CrossRef]
- Arnaud, A.; Conor, W.; Anthony, M.; Eric, G.; Camille, A.; C., A.A.; Matthew, M.; Anik, B.A.; L., G.A.; Mark, T., et al. A functional vulnerability framework for biodiversity conservation. Nat Commun. 2022, 13, 4774. [CrossRef]
- Thompson, R.C.; Olsen, Y.; Mitchell, R.P.; Davis, A.; Rowland, S.J.; John, A.W.G.; McGonigle, D.; Russell, A.E. Lost at Sea: Where Is All the Plastic? Science. 2004, 304, 838. [CrossRef]
- Zhenming, Z.; Xianliang, W.; Huijuan, L.; Xianfei, H.; Qina, C.; Xuetao, G.; Jiachun, Z. A systematic review of microplastics in the environment: Sampling, separation, characterization and coexistence mechanisms with pollutants. Sci Total Environ. 2023, 859, 160151. [CrossRef]
- Osman, A.I.; Hosny, M.; Eltaweil, A.S.; Omar, S.; Elgarahy, A.M.; Farghali, M.; Yap, P.; Wu, Y.; Nagandran, S.; Batumalaie, K., et al. Microplastic sources, formation, toxicity and remediation: a review. Environ Chem Lett. 2023, 1-41. [CrossRef]
- Michaela E. Miller, M.H.F.J. Bioaccumulation and biomagnification of microplastics in marine organisms: A review and meta-analysis of current data. Plos One. 2020, 15, e240792. [CrossRef]
- E, M.M.; A, M.C.; Mark, H.; J, K.F. Assessment of microplastic bioconcentration, bioaccumulation and biomagnification in a simple coral reef food web. The Science of the total environment. 2022, 858, 159615. [CrossRef]
- Mohamed, H.; M, S.H.A.; M, O.A.G.; H, S.A.E. Antioxidants and molecular damage in Nile Tilapia (Oreochromis niloticus after exposure to microplastics. Environmental science and pollution research international. 2020, 27, 1-8. [CrossRef]
- Rashid, E.; Hussain, S.M.; Ali, S.; Munir, M.; Ghafoor, A.; Yilmaz, E.; Alshehri, M.A.; Riaz, D.; Naeem, A.; Naeem, E. Impacts of microplastic accumulation in aquatic environment: Physiological, eco-toxicological, immunological, and neurotoxic effects. Aquat Toxicol. 2025, 279, 107232. [CrossRef]
- Lamsdell, J.C.; McKenzie, S.C. Tachypleus syriacus (Woodward)—a sexually dimorphic Cretaceous crown limulid reveals underestimated horseshoe crab divergence times. Org Divers Evol. 2015, 15, 681-693. [CrossRef]
- Hong, S. Biological Research on the Chinese Horseshoe Crab. Xiamen University Press: Xiamen, China, 2011; p 342.
- Laurie, K.C.C.P.; Nishida, S.S.P.Y. Tachypleus tridentatus (errata version published in 2019). In The IUCN Red List of Threatened Species, IUCN: 2019.
- National Forestry And Grassland Administration, M.O.A.A. Announcement on Issuing the List of National Key Protected Wild Animals; National Forestry and Grassland Administration: 2021; p.
- Li, R.; Zhang, S.; Zhang, L.; Yu, K.; Wang, S.; Wang, Y. Field study of the microplastic pollution in sea snails ( Ellobium chinense ) from mangrove forest and their relationships with microplastics in water/sediment located on the north of Beibu Gulf. Environ Pollut. 2020, 263, 114368. [CrossRef]
- Zhang, L.; Zhang, S.; Guo, J.; Yu, K.; Wang, Y.; Li, R. Dynamic distribution of microplastics in mangrove sediments in Beibu Gulf, South China: Implications of tidal current velocity and tidal range. J Hazard Mater. 2020, 399, 122849. [CrossRef]
- Xueping, W.; Shing, L.H.; Yijian, F.; Zhou, W.; Danmei, Q.; Xing, H.; Jingmin, Z.; Gin, C.S.; Yue, K.K. High Microplastic Contamination in Juvenile Tri-Spine Horseshoe Crabs: A Baseline Study of Nursery Habitats in Northern Beibu Gulf, China. J Ocean U China. 2022, 21, 521-530. [CrossRef]
- Yiting, P.; Jin, Q.; Xiaowan, M.; Wei, H.; KarHei, F.J.; Iqra, A.; Youji, W.; Yueyong, S.; Menghong, H. Response of moulting genes and gut microbiome to nano-plastics and copper in juvenile horseshoe crab Tachypleus tridentatus. Mar Environ Res. 2023, 191, 106128. [CrossRef]
- Jiang, L.; Fang, J.K.; Wang, Y.; Ma, X.; Lee, J.; Hu, M. Transcriptomic insights into an ancient and endangered species: Adverse effects of nanopolystyrene on the behavior and energy metabolism of Tachypleus tridentatus. J Hazard Mater. 2025, 498, 139958. [CrossRef]
- Pengzhi, Q.; Longmei, Q.; Dan, F.; Zhongqi, G.; Baoying, G.; Xiaojun, Y. Distinguish the toxic differentiations between acute exposure of micro- and nano-plastics on bivalves: An integrated study based on transcriptomic sequencing. Aquat Toxicol. 2023, 254, 106367. [CrossRef]
- Zou, L. Establishment and Validation of Allometric Growth Models for Tachypleus tridentatus. Fujian J. Agric. Sci. 2018, 33, 787-793. [CrossRef]
- Palmberger, D.; Rendić, D.; Tauber, P.; Krammer, F.; Wilson, I.B.H.; Grabherr, R. Insect cells for antibody production: Evaluation of an efficient alternative. J Biotechnol. 2011, 153, 160-166. [CrossRef]
- I, L.M.; Wolfgang, H.; Simon, A. Moderated estimation of fold change and dispersion for RNA-seq data with DESeq2. Genome Biol. 2014, 15, 550.
- Ashburner, M.; Ball, C.A.; Blake, J.A.; Botstein, D.; Butler, H.; Cherry, J.M.; Davis, A.P.; Dolinski, K.; Dwight, S.S.; Eppig, J.T., et al. Gene Ontology: tool for the unification of biology. Nat Genet. 2000, 25, 25-29. [CrossRef]
- M, K.; S, G. KEGG: kyoto encyclopedia of genes and genomes. Nucleic Acids Res. 2000, 28, 27-30.
- Wright, S.L.; Thompson, R.C.; Galloway, T.S. The physical impacts of microplastics on marine organisms: A review. Environ Pollut. 2013, 178, 483-492. [CrossRef]
- U., B.N.; D., A.O.; H., F.A.O.; De la Torre Gabriel Enrique; Ayodeji, O.; B., W.A. Micro(nano)plastics Prevalence, Food Web Interactions, and Toxicity Assessment in Aquatic Organisms: A Review . Front Mar Sci. 2022, 9. [CrossRef]
- Silva, A.B.; Bastos, A.S.; Justino, C.I.L.; Da Costa, J.P.; Duarte, A.C.; Rocha-Santos, T.A.P. Microplastics in the environment: Challenges in analytical chemistry - A review. Anal Chim Acta. 2018, 1017, 1-19. [CrossRef]
- Wesch, C.; Bredimus, K.; Paulus, M.; Klein, R. Towards the suitable monitoring of ingestion of microplastics by marine biota: A review. Environ Pollut. 2016, 218, 1200-1208. [CrossRef]
- Todd, G. Toward an Improved Understanding of the Ingestion and Trophic Transfer of Microplastic Particles: Critical Review and Implications for Future Research. Environ Toxicol Chem. 2020, 39, 1119-1137. [CrossRef]
- Franzellitti, S.; Canesi, L.; Auguste, M.; Wathsala, R.H.G.R.; Fabbri, E. Microplastic exposure and effects in aquatic organisms: A physiological perspective. Environ Toxicol Phar. 2019, 68, 37-51. [CrossRef]
- Lee, Y.J.; Kim, W.R.; Park, E.G.; Du Hyeong Lee; Kim, J.M.; Jeong, H.S.; Roh, H.Y.; Choi, Y.H.; Srivastava, V.; Mishra, A., et al. Phenotypic and Gene Expression Alterations in Aquatic Organisms Exposed to Microplastics. International Journal of Molecular Sciences. 2025, 26, 1080. [CrossRef]
- Patra, I.; Huy, D.T.N.; Alsaikhan, F.; Opulencia, M.J.C.; Van Tuan, P.; Nurmatova, K.C.; Majdi, A.; Shoukat, S.; Yasin, G.; Margiana, R., et al. Toxic effects on enzymatic activity, gene expression and histopathological biomarkers in organisms exposed to microplastics and nanoplastics: a review. Environ Sci Eur. 2022, 34, 80. [CrossRef]
- G, E.T.; E, H.G. Defining the limits of physiological plasticity: how gene expression can assess and predict the consequences of ocean change. Philosophical transactions of the Royal Society of London. Series B, Biological sciences. 2012, 367, 1733-1745. [CrossRef]
- Missionário, M.; Calado, R.; Dupont, S.; Costa, P.M.; Madeira, D. Plasticity and adaptation in a changing ocean: a review of research trends and challenges. Hydrobiologia. 2026, 853, 1-20. [CrossRef]
- Grid., C.O.L.A.; Grid., C.O.L.A.; Grid., C.O.L.A. Interactions of microplastic debris throughout the marine ecosystem. Nat Ecol Evol. 2017, 1, 116. [CrossRef]
- Pechenik, J.A. Larval experience and latent effects--metamorphosis is not a new beginning. Integr Comp Biol. 2006, 46, 323-333. [CrossRef]
- Foo, S.A.; Byrne, M. Marine gametes in a changing ocean: Impacts of climate change stressors on fecundity and the egg. Mar Environ Res. 2017, 128, 12-24. [CrossRef]
- Grid., S.O.A.A.; Grid., S.O.A.A.; Grid. C, C.R.A.O.; Grid. C, C.R.A.O.; Grid., E.D.O.B.; Grid., M.S.E.L.; Grid., S.O.A.A.; Grid., B.D.O.E. Management for network diversity speeds evolutionary adaptation to climate change. Nat Clim Change. 2019, 9, 632-636. [CrossRef]
- Botton ML, L.R.J.T. Overwintering by trilobite larvae of the horseshoe crab Limulus polyphemus on a sandy beach of Delaware Bay (New Jersey, USA). Mar Ecol Prog Ser. 1992, 88, 289-292.
- Akbar, J.; S, S.P.K.; L, B.M.; Glenn, G.; G, C.S.; Kevin, L. Conservation of Asian horseshoe crabs on spotlight. Biodivers Conserv. 2020, 30, 1-4. [CrossRef]
Figure 1.
Accumulation of PS-MPs in the foregut of T. tridentatus under different concentrations of PS-MPs exposure.
Figure 1.
Accumulation of PS-MPs in the foregut of T. tridentatus under different concentrations of PS-MPs exposure.
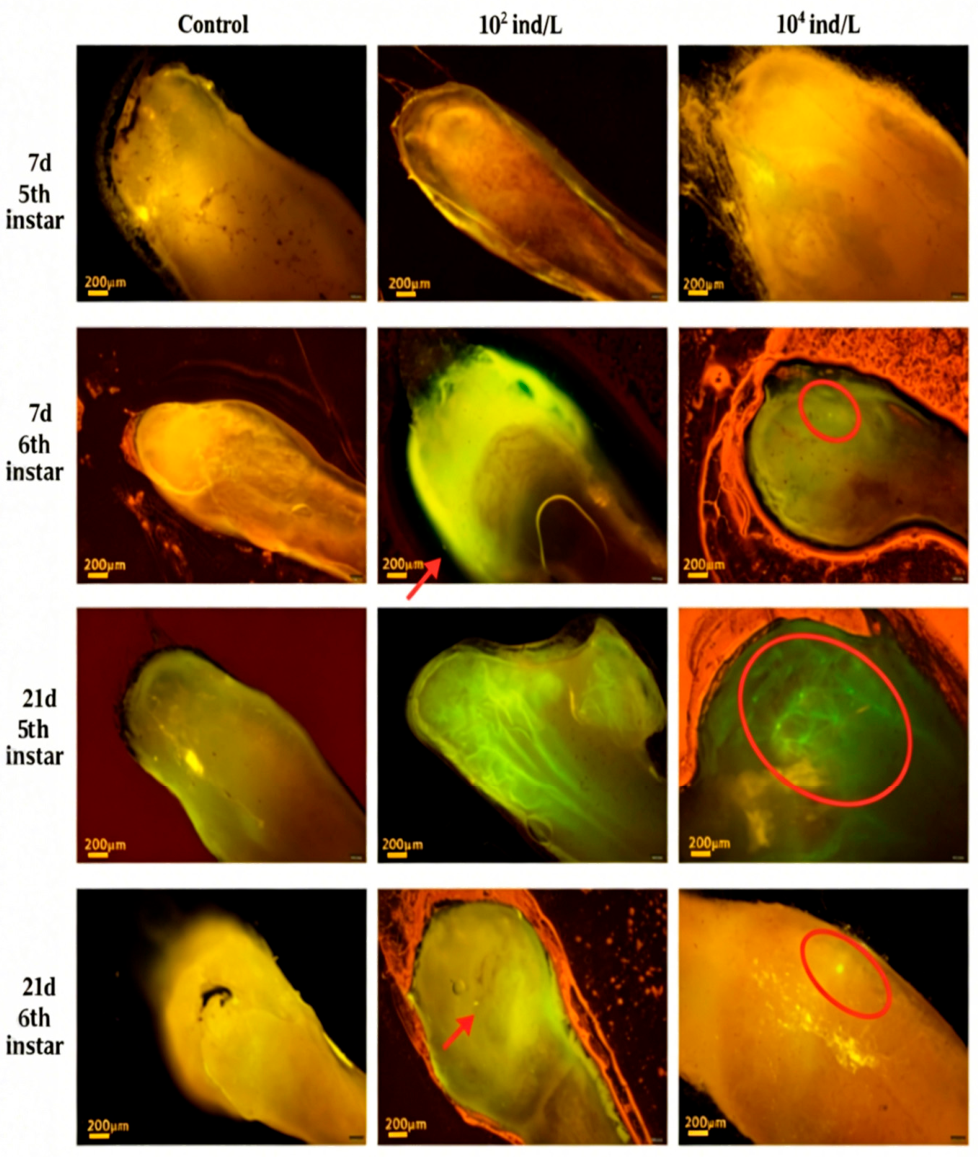
Figure 2.
Accumulation of PS-MPs in the midgut of T. tridentatus under different concentrations of PS-MPs exposure conditions.
Figure 2.
Accumulation of PS-MPs in the midgut of T. tridentatus under different concentrations of PS-MPs exposure conditions.
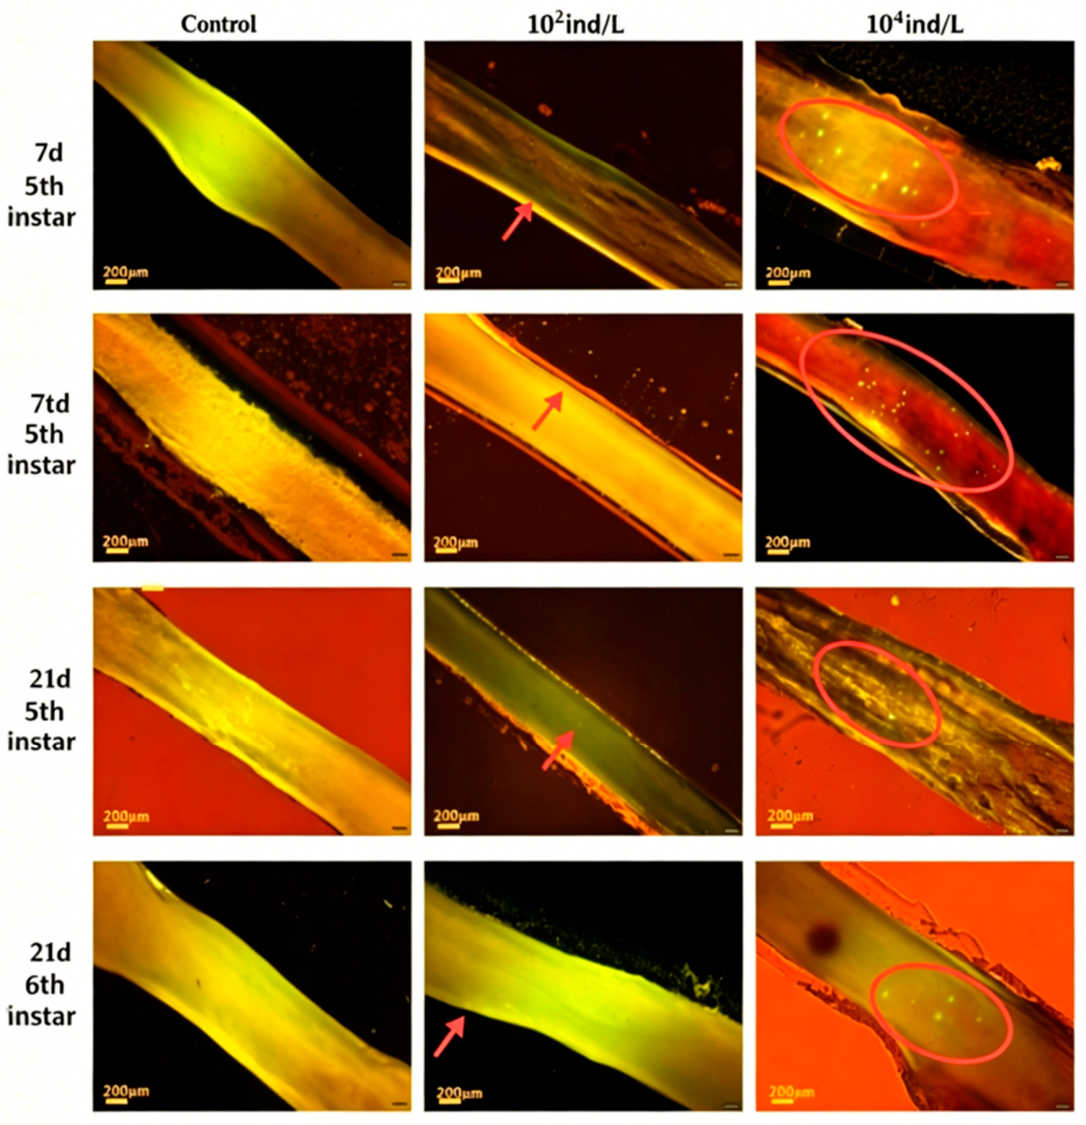
Figure 3.
Accumulation of PS-MPs in the midgut of T. tridentatus (n=3) under different exposure durations and concentrations of PS-MPs. Results are presented as mean ± standard deviation.
Figure 3.
Accumulation of PS-MPs in the midgut of T. tridentatus (n=3) under different exposure durations and concentrations of PS-MPs. Results are presented as mean ± standard deviation.
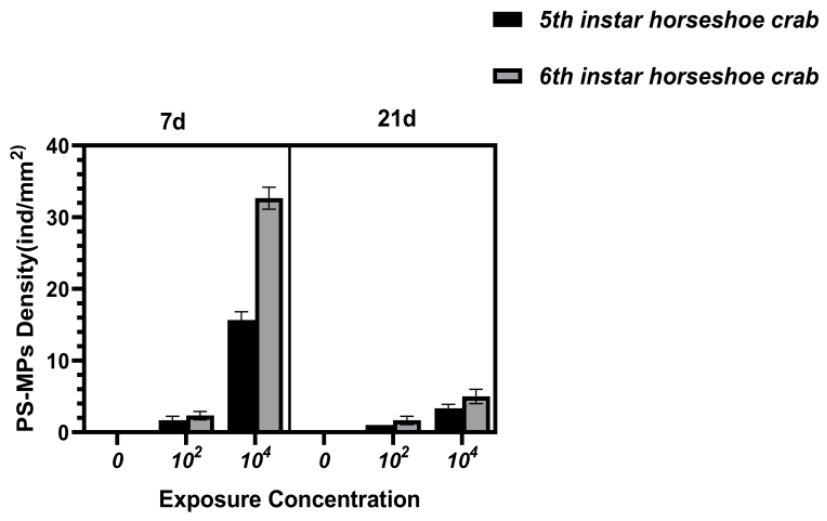
Figure 4.
Genetic analysis of similarity among T. tridentatus populations. A: Bar chart of gene annotation success rate; B: Species classification of genes in the transcriptome.
Figure 4.
Genetic analysis of similarity among T. tridentatus populations. A: Bar chart of gene annotation success rate; B: Species classification of genes in the transcriptome.
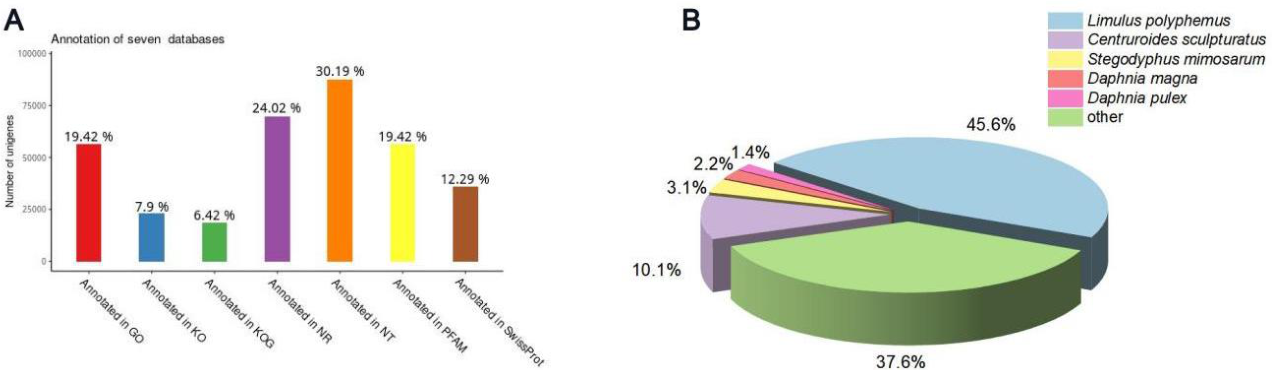
Figure 5.
Gene annotation and pathway analysis. A:GO annotation classification statistics of the T. tridentatus transcriptome; B: KOG annotation classification statistics of the T. tridentatus transcriptome; C: KEGG metabolic pathway classification of the T. tridentatus transcriptom.
Figure 5.
Gene annotation and pathway analysis. A:GO annotation classification statistics of the T. tridentatus transcriptome; B: KOG annotation classification statistics of the T. tridentatus transcriptome; C: KEGG metabolic pathway classification of the T. tridentatus transcriptom.
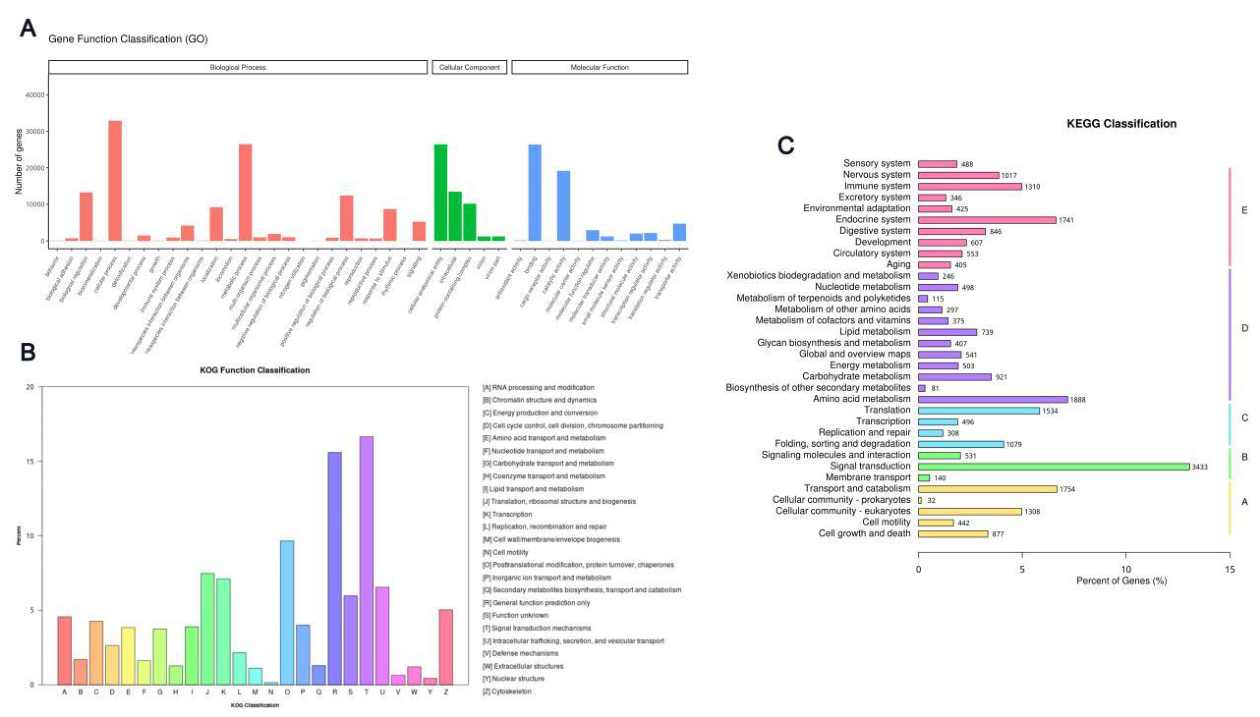
Figure 6.
Comparative analysis of differentially expressed genes (DEGs). (A) UpSet plot showing the distribution of shared DEGs among five-instar T. tridentatus under different exposure durations or stress concentrations; (B) UpSet plot showing the distribution of shared DEGs among six-instar T. tridentatus under different exposure durations or stress concentrations; (C) Venn diagram showing the distribution of DEGs in five- and six-instar T. tridentatus under different stress concentrations after 7 days of exposure; (D) Venn diagram showing the distribution of DEGs in five- and six-instar T. tridentatus under different stress concentrations after 21 days of exposure.
Figure 6.
Comparative analysis of differentially expressed genes (DEGs). (A) UpSet plot showing the distribution of shared DEGs among five-instar T. tridentatus under different exposure durations or stress concentrations; (B) UpSet plot showing the distribution of shared DEGs among six-instar T. tridentatus under different exposure durations or stress concentrations; (C) Venn diagram showing the distribution of DEGs in five- and six-instar T. tridentatus under different stress concentrations after 7 days of exposure; (D) Venn diagram showing the distribution of DEGs in five- and six-instar T. tridentatus under different stress concentrations after 21 days of exposure.
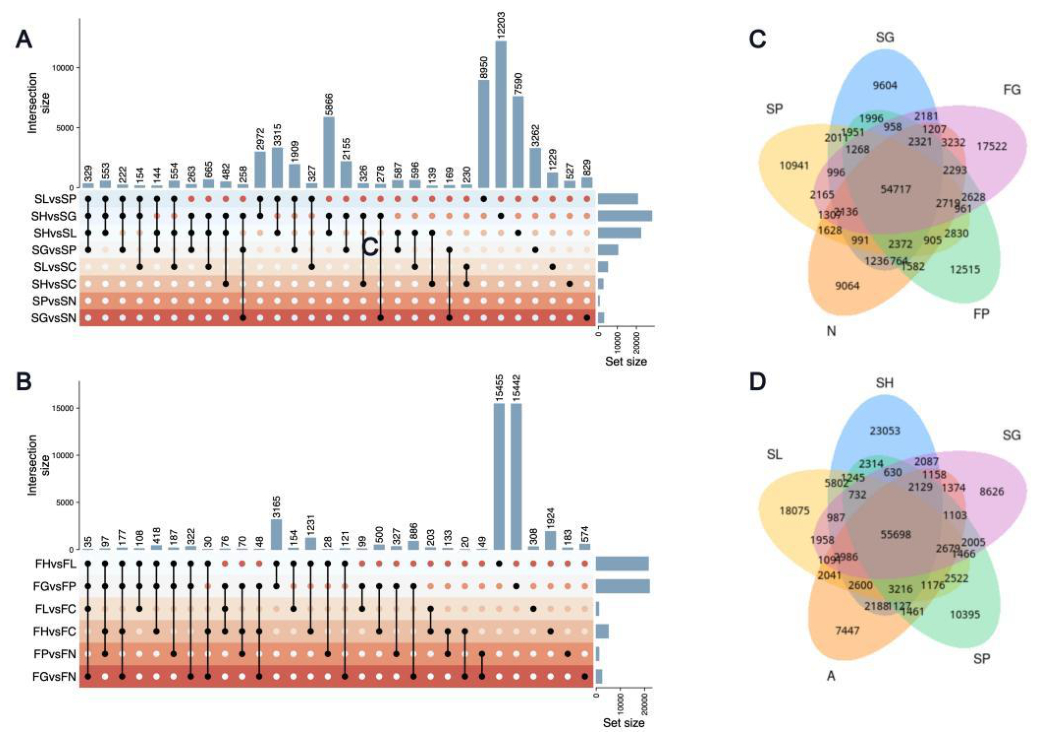
Figure 11.
Enrichment analysis and annotation of DEGs for FH vs FL. (A) Bar chart of GO pathway enrichment analysis for differentially expressed genes (DEGs); (B) Scatter plot of KEGG pathway enrichment analysis for DEGs; (C) Bar chart of GO pathway enrichment analysis for downregulated DEGs in FH vs FL; (D) Bar chart of GO pathway enrichment analysis for upregulated DEGs in FH vs FL; (E) Bar chart of KEGG pathway enrichment analysis for downregulated DEGs in FH vs FL; (F) Bar chart of KEGG pathway enrichment analysis for upregulated DEGs in FH vs FL.
Figure 11.
Enrichment analysis and annotation of DEGs for FH vs FL. (A) Bar chart of GO pathway enrichment analysis for differentially expressed genes (DEGs); (B) Scatter plot of KEGG pathway enrichment analysis for DEGs; (C) Bar chart of GO pathway enrichment analysis for downregulated DEGs in FH vs FL; (D) Bar chart of GO pathway enrichment analysis for upregulated DEGs in FH vs FL; (E) Bar chart of KEGG pathway enrichment analysis for downregulated DEGs in FH vs FL; (F) Bar chart of KEGG pathway enrichment analysis for upregulated DEGs in FH vs FL.
Disclaimer/Publisher’s Note: The statements, opinions and data contained in all publications are solely those of the individual author(s) and contributor(s) and not of MDPI and/or the editor(s). MDPI and/or the editor(s) disclaim responsibility for any injury to people or property resulting from any ideas, methods, instructions or products referred to in the content. |
© 2026 by the authors. Licensee MDPI, Basel, Switzerland. This article is an open access article distributed under the terms and conditions of the Creative Commons Attribution (CC BY) license (http://creativecommons.org/licenses/by/4.0/).
Copyright: This open access article is published under a Creative Commons CC BY 4.0 license, which permit the free download, distribution, and reuse, provided that the author and preprint are cited in any reuse.


