
Submitted:
03 July 2026
Posted:
07 July 2026
You are already at the latest version
Abstract
Soil microorganisms are essential for nutrient cycling, plant productivity, and soil health, yet the relative importance of land use and soil depth in shaping agricultural microbiomes remains poorly understood. This study investigated soil microbial com-munities across uncultivated land, alfalfa fields, crop systems (feed corn and sweet corn), and orchard systems (walnut and quince) in the Hajdúnánás region of Hungary using shotgun metagenomic sequencing and soil physicochemical analyses.
Microbial alpha diversity varied little among land-use systems but declined signifi-cantly with soil depth. Community composition was primarily structured by depth (R² = 0.233, p = 0.001), while land-use effects were stronger for fungal communities (p = 0.001) than for bacterial communities (p = 0.012). Crop soils contained the highest numbers of unique bacterial and fungal taxa. Functional analyses revealed significant differences in nutrient cycling, plant-growth-related, decomposition, and environ-mental adaptation functions among land-use systems. In crop soils, topsoil communi-ties were enriched in oxidative stress-related pathways involved in ROS detoxification, redox homeostasis, and stress regulation, whereas subsoil communities showed a greater representation of antioxidant metabolite production functions. Co-occurrence network analyses indicated greater connectivity in perennial systems, particularly al-falfa soils. Pathogen analyses identified stable bacterial and fungal pathogen cores across agricultural systems, with soil pH emerging as the strongest environmental factor associated with pathogen abundance. Overall, soil depth was the primary driver of microbial community assembly, whereas land use mainly influenced microbial composition, ecological functions, interaction networks, and pathogen distribution.
Keywords:
soil microbiome
; shotgun metagenomics
; land use
; crops
; orchards
; soil depth
; oxidative stress response
; plant pathogens
1. Introduction
Maximizing agricultural production is a primary objective for farmers today. However, it is crucial to achieve this goal while prioritizing human health, which relies on the nutritional quality of food. Modern food production heavily relies on the extensive use of fertilizers, various tillage systems, and other treatments, all of which significantly impact soil health. Studies indicate that different forms of soil treatment have a direct impact on soil health and productivity, influencing changes in its microbial composition [1]. Soil microorganisms play a crucial role in ecosystems by cycling nutrients, stabilizing soil, and aiding plant growth. They enhance disease resistance, regulate soil pH, boost soil organic carbon levels, and compete effectively against pathogens [2,3].
Soil microbial composition is primarily influenced by crops that are planted. For instance, orchards show a significant difference in soil composition compared to croplands. According to a study by Cheng et al. [1], orchard-planted soils have higher microbial diversity and impact the preservation of soil structure, especially in its surface layers However, the continuous cultivation of fruit trees as monocultures has been shown to cause replant syndrome issues. This disease, resulting from the repeated planting of the same crops in the same field, has led to reduced yields, hindered growth and development of plants, and affected their nutritional composition [4]. This occurs because the pathogenic members of the soil community become more robust, increasing their resistance to agrochemicals, and acting synergistically to cause such problems [5]. Monocultures decrease microbial diversity and increase pathogen resistance to various agrochemicals. This resistance can be transferred through gene transfer, directly impacting soil productivity, and leading to the development of resistant strains. Soils planted with monocultures or fruit trees have higher levels of antibiotic resistance due to the more favorable conditions for microorganisms in these undisturbed environments, facilitating their easier spread [6]. Cover crops such as alfalfa, buckwheat, and vetch are an environmentally friendly solution with desirable outcomes in supporting soil health. They promote the development of beneficial microorganisms, including those that solubilize phosphate, fix nitrogen, and others, thereby contributing to the enhancement of soil health and the promotion of microbiological growth [7]. Crop rotation has also demonstrated its significant impact on carbon sequestration and the formation of soil structure, which are essential for supporting plant growth and enhancing nutrient availability [8]. The practice of rotating different crops in agricultural soil disrupts the life cycles of pathogenic microorganisms by creating less favorable conditions for their growth and proliferation. This aids to break the cycle of pests, diseases, and pathogens that may build up when the same crop is grown repeatedly in the same soil. By introducing crop rotation, the need for agrochemicals application is reduced, thereby supporting sustainable agriculture practices.
Soil microbial composition is influenced by soil properties as well. The topography of agricultural land directly impacts microbial composition through the nutrients provided to plants and the available water content. For instance, fungal levels are decreased in lower topographic areas compared to higher ones because fungi adapt more easily to challenging environments with limited nutrient availability [9]. Due to less favorable temperatures, nutrient stress and variations in soil characteristics, the microbial community, especially bacteria, thrives more abundantly at lower elevations and demonstrates a higher capability for decomposing organic carbon [10]. Moreover, such differences are obvious in different soil layers, where deeper layers are related with more restrict living conditions for microbes. This impacts a higher microbial diversity in higher layers of soil compared to deeper layers [11,12]. Such differences affect the physico-chemical parameters of soil, shaping the adaptation of microorganisms in specific soils.
In this study, we investigated the soil microbiome across contrasting agricultural land-use systems in the Hajdúnánás region of Hungary, including crop fields, orchards, alfalfa, and uncultivated soils. Using shotgun metagenomic sequencing combined with soil physicochemical analyses, we aimed to assess how land use, soil depth, and environmental conditions influence microbial diversity, community composition, ecological functions, microbial interactions, and pathogen distribution. Specifically, this study aimed to: (i) characterize the diversity and composition of bacterial and fungal communities across contrasting land-use systems and soil depths; (ii) evaluate the relationships between microbial communities and soil physicochemical properties; (iii) investigate the functional potential and interaction networks of soil microorganisms; and (iv) assess the distribution, prevalence, and environmental drivers of plant-associated bacterial and fungal pathogens. By integrating taxonomic, functional, network, and pathogen analyses, this study provides a comprehensive assessment of the ecological mechanisms governing soil microbiome assembly and functioning in agricultural ecosystems.
2. Materials and Methods
2.1. Sampling
The experiment was conducted in the Hajdúnánás region, Hungary (N 47°51′, E 21°24′), including six agricultural management systems representing different land-use types. These included two crop production systems (feed corn and sweet corn), two orchard systems (quince and walnut), one alfalfa-covered area, and one unplanted control area. The control site was managed using shallow loosening and ploughing practices but was not cultivated during the study period. Soil sampling was performed across all sites to evaluate the effects of land use, soil depth, and topographic position on soil microbial communities and soil properties. Samples were collected from both high- and low-altitude locations within each site and from three depth intervals: 0–30 cm, 31–60 cm, and 61–90 cm. Multiple subsamples were collected from each sampling point and combined to obtain representative composite samples. Following collection, soil samples were transferred into sterile Falcon tubes, transported under controlled conditions, and stored at −80 °C until further laboratory analyses.
Soil physicochemical analyses were performed according to standard laboratory procedures at the University of Debrecen. The investigated parameters included soil pH (KCl), consistency (KA), water-soluble salts (WSS), calcium carbonate (CaCO₃), humus content, available phosphorus (P₂O₅), available potassium (K₂O), and nitrate concentration. These measurements were used to characterize the chemical and physical properties of the soils and to evaluate their relationships with microbial community composition and functional profiles.
2.2. DNA Extraction and Shotgun Sequencing
Microbial genomic DNA was recovered from soil samples using the DNeasy® PowerSoil® Pro Kit (Qiagen, Germany), following the approach reported by Remenyik et al. [13]. Prior to extraction, soil suspensions were processed to concentrate microbial cells, and the resulting pellets were subjected to mechanical and chemical lysis. Cell disruption was performed using a MagNA Lyser Instrument (Roche Applied Sciences, Germany), ensuring efficient release of nucleic acids from diverse soil microorganisms. Purified DNA was obtained according to the manufacturer’s protocol and subsequently evaluated for concentration and purity using a Qubit® 4.0 Fluorometer (Thermo Fisher Scientific, USA). Only DNA samples meeting the required quality criteria (OD260/280 ratio between 1.8 and 2.0) and a concentration of at least 10 ng μL⁻¹ were selected for downstream analysis. In cases where these thresholds were not achieved, DNA extraction was repeated to obtain material suitable for high-throughput sequencing.
Sequencing libraries were prepared from purified metagenomic DNA through fragmentation and adapter ligation. Whole-metagenome shotgun sequencing was carried out by Novogene Co. Ltd. (China) on an Illumina NovaSeq 6000 platform (Illumina, USA), generating paired-end reads of 150 bp. To ensure robust characterization of both taxonomic diversity and functional gene content, a sequencing depth of approximately 20 million reads per sample was achieved.
2.3. Statistical Analysis
All data processing, statistical analyses, and visualizations were performed in RStudio (v2025.09.0+387, R Foundation for Statistical Computing, Vienna, Austria). Species-level bacterial and fungal abundance tables obtained from shotgun metagenomic sequencing were filtered to retain only reliably identified taxa.
Soil physicochemical properties, including pH, Arany plasticity index, water-stable soil structure (WSS), CaCO₃, humus, P₂O₅, K₂O, and nitrate concentration, were compared among land-use systems using Kruskal–Wallis tests followed by Dunn’s post hoc comparisons. Microbial alpha diversity was evaluated using the Chao1 richness index, while relationships between diversity and soil properties were assessed using Spearman correlation analysis. Microbial community composition was analyzed using Bray–Curtis dissimilarities, non-metric multidimensional scaling (NMDS), and PERMANOVA. Both presence/absence and abundance-based approaches were used to evaluate shared taxa, dominant species, and differences among land-use systems, soil depths, and environmental gradients. Bacterial and fungal community composition was further examined through land-use-specific comparisons and species overlap analyses.
To investigate ecological functions, taxa were assigned to twelve literature-curated functional groups related to nutrient cycling, plant growth promotion, environmental adaptation, decomposition, and remediation processes. Functional community analyses were performed using only topsoil samples (0–30 cm depth). For each functional group, Bray–Curtis dissimilarity matrices were calculated from species-level abundance data and visualized using non-metric multidimensional scaling (NMDS). Overall differences among land-use systems were evaluated using permutational multivariate analysis of variance (PERMANOVA; 999 permutations). Pairwise comparisons between land-use systems were subsequently performed using pairwise PERMANOVA, with p-values adjusted using the Benjamini–Hochberg false discovery rate (FDR) procedure. Mean pairwise Bray–Curtis dissimilarities among land-use systems were additionally visualized as bubble plots, where bubble size and colour intensity were proportional to community dissimilarity, and statistically significant pairwise comparisons (adjusted p < 0.05) were indicated by an asterisk. Depth-related variation in microbial functional potential was further evaluated using shotgun metagenomic functional profiles. Oxidative stress-related KEGG orthologs were extracted and grouped into five literature-based categories: ROS Detoxification, Redox Homeostasis, Oxidative Damage Repair, Stress Regulation, and Antioxidant Metabolite Production (Supplementary Materials S1) [14,15,16,17,18,19,20,21,22,23,24,25,26,27,28,29,30,31,32,33,34,35,36,37,38,39,40]. Functional differences among soil depths were evaluated using Bray–Curtis dissimilarities and Principal Coordinate Analysis (PCoA), while statistical significance was assessed using PERMANOVA and Wilcoxon rank-sum tests. To identify oxidative stress-related biomarkers associated with topsoil and subsoil communities, Linear Discriminant Analysis Effect Size (LEfSe) was performed using relative abundances of normalized KEGG functions. Significantly enriched KEGG orthologs (adjusted p < 0.05) were manually classified into five literature-based oxidative stress-related functional categories. For visualization, significant biomarkers were ordered according to functional category and descending LDA score and displayed using a circular lollipop plot. The relative contribution of Topsoil- and Subsoil-enriched biomarkers within each functional category was additionally summarized using donut charts showing the proportion and total number of significant KEGG orthologs assigned to each category. In addition, selected KEGG pathways related to carbon, nitrogen, phosphorus, sulfur, and iron metabolism were compared between topsoil and subsoil using Wilcoxon rank-sum tests. The complete LEfSe output is provided in Supplementary Materials (S2).
Microbial dominance structure was evaluated using abundance-based classification of dominant and rare taxa. Microbial interactions were investigated through co-occurrence network analyses and keystone taxa identification. Network topology metrics, including node connectivity and modularity, were used to compare microbial interaction patterns among land-use systems and soil depths.
Plant-associated bacterial and fungal pathogens were identified using literature-curated pathogen lists developed separately for crop (feed corn and sweet corn) [41,42,43,44,45,46,47,48,49,50] and orchard (quince and walnut) systems [51,52,53,54,55,56,57,58,59,60,61,62,63,64,65,66,67,68,69,70,71]. The complete pathogen lists are provided in the Supplementary Materials (S3). Pathogen prevalence, composition, abundance patterns, vertical distribution, and relationships with soil physicochemical properties were evaluated using prevalence analyses, abundance profiling, and Pearson correlation analysis.
Statistical significance was defined at p < 0.05. Data manipulation was performed using the dplyr, tidyr, and stringr packages; ecological analyses were conducted using vegan and Hmisc; network analyses were performed using NetCoMi; statistical testing was carried out using rstatix; LEfSe analyses were performed using microbiomeMarker. Graphical visualizations, including circular lollipop plots, donut charts, heatmaps, and Venn diagrams, were generated using ggplot2, patchwork, pheatmap, and VennDiagram.
3. Results
3.1. Spatial Variability of Soil Physicochemical Properties
The physicochemical characterization of soils revealed generally similar environmental conditions across the evaluated land-use systems, although several nutrient-related parameters exhibited noticeable variation (Figure 1). Soil pH ranged from approximately 5.0 to 8.2, with median values between 5.6 and 7.2, and did not differ significantly among treatments (p = 0.72). Likewise, the Arany plasticity index (36–51; p = 0.271), WSS (0.028–0.051%; p = 0.896), CaCO₃ content (0–1.2%; p = 0.838), humus content (2.0–4.1%; p = 0.45), and nitrate concentration (15–72 mg kg⁻¹; p = 0.0966) remained relatively consistent across land-use categories.
In contrast, greater variability was observed for the plant-available nutrient fractions. Available phosphorus (P₂O₅) ranged from approximately 70 to 330 mg kg⁻¹ and showed a marginally significant land-use effect (p = 0.0709). Pairwise comparisons indicated higher P₂O₅ concentrations in quince soils than in sweet corn and walnut soils (adjusted p = 0.048). Available potassium (K₂O) exhibited the strongest land-use response (p = 0.0335), with the highest concentrations recorded in quince soils (approximately 450–580 mg kg⁻¹). Dunn’s post hoc test further revealed significantly higher K₂O values in quince soils compared with sweet corn and walnut soils (adjusted p = 0.03).
3.2. Soil Alpha Diversity
Given the relatively limited variation observed in most soil physicochemical properties, microbial alpha diversity also remained largely stable across the evaluated land-use systems (Figure 2). Chao1 richness values ranged from approximately 18,000 to 26,500 across all samples, indicating a consistently diverse microbial community throughout the study area.
No significant differences in microbial richness were detected among crop types within the 0–30 cm soil layer (p = 0.91; Figure 2a), although slightly higher median richness values were observed in quince, walnut, and sweet corn soils compared with feed corn and alfalfa soils. Similarly, richness did not differ between high- and low-fertility soils (p = 0.64; Figure 2c) or between crop and orchard systems (p = 0.60; Figure 2d), suggesting that land-use category alone exerted only a limited influence on species richness.
In contrast, soil depth emerged as an important driver of alpha diversity (Figure 2b). The highest Chao1 values were recorded in the 0–30 cm layer, with median richness reaching approximately 22,500 species, whereas richness gradually declined with increasing depth. Pairwise comparisons confirmed significantly higher richness in the topsoil compared with the 61–90 cm layer (p < 0.05), indicating a reduction in taxonomic richness along the soil profile.
To further explore potential environmental controls on microbial richness, correlations between soil properties and Chao1 values were examined (Figure 2e). Overall, relationships were weak and predominantly positive. The strongest association was observed for CaCO₃ (ρ = 0.30), followed by WSS (ρ = 0.19) and K₂O (ρ = 0.13). Weaker positive correlations were detected for pH (ρ = 0.11), Arany plasticity index (ρ = 0.08), nitrate (ρ = 0.06), and P₂O₅ (ρ = 0.04), whereas humus content showed virtually no relationship with richness (ρ ≈ 0.00). However, none of these correlations reached statistical significance (p > 0.05).
3.3. Community Structure and Beta Diversity Patterns
Although microbial richness showed only limited variation among most land-use categories, beta-diversity analyses revealed clear differences in microbial community composition (Figure 3). The species-level NMDS ordination based on bacterial and fungal taxa identified soil depth as the primary factor structuring microbial assemblages across the study area.
Samples from the three soil layers formed distinct clusters in ordination space, and PERMANOVA confirmed a significant effect of depth on community composition (R² = 0.233, p = 0.001). Importantly, multivariate dispersion did not differ among depth groups (p = 0.547), indicating that the observed separation primarily reflected differences in community composition rather than differences in within-group variability. Together, these results suggest that vertical soil stratification exerts a strong influence on microbial community assembly.
Land-use type also contributed to variation in microbial composition, although its effects were less pronounced than those associated with soil depth. Crop type explained a relatively large proportion of the observed variation (R² = 0.225) and the ordination indicated a tendency toward crop-specific microbial assemblages, particularly among cultivated systems. However, this effect was only marginally significant (p = 0.085).
In contrast, soil fertility level accounted for only a small fraction of community variation (R² = 0.037) and did not significantly influence microbial composition (p = 0.130). Plant system (crop fields versus orchards) explained a more modest proportion of the total variation (R² = 0.092) but yielded a significant PERMANOVA result (p = 0.048), suggesting differences in community structure between these production systems. Nevertheless, significant heterogeneity of multivariate dispersion was also detected (p = 0.025), indicating that part of the observed separation may be attributable to differences in within-group variability.
3.4. Land-Use Effects on Bacterial and Fungal Assemblages
Land-use systems influenced both the composition and distribution of bacterial and fungal communities in topsoil (Figure 4). Coverage-based analyses revealed the presence of a substantial shared microbial core among all land-use systems, particularly for bacteria. A total of 4,997 bacterial species were detected across alfalfa, not cultivated, crop, and orchard soils (Figure 4a), representing the dominant fraction of the bacterial community. Nevertheless, each land-use system also harbored unique bacterial taxa, with crops containing the highest number of unique species (1,574), followed by not cultivated soils (482), orchards (466), and alfalfa soils (260).
Fungal communities exhibited a smaller shared core and a greater proportion of unique taxa (Figure 4b). Only 226 fungal species were common to all land-use systems, whereas unique species represented a substantially larger component of the fungal assemblage. Crops again contained the highest number of unique fungal species (177), followed by orchards (118), not cultivated soils (44), and alfalfa soils (23). These patterns indicate greater taxonomic turnover among fungal communities than among bacterial communities.
The differences observed in species occurrence were further reflected in overall community composition. NMDS ordinations demonstrated significant separation among land-use systems for both bacterial and fungal assemblages. Bacterial communities differed significantly among land-use categories (PERMANOVA, R² = 0.139, p = 0.012; Figure 4c), with land use explaining approximately 14% of the variation in community structure. Fungal communities exhibited an even stronger response (R² = 0.160, p = 0.001; Figure 4d), indicating that fungal assemblages were slightly more sensitive to land-use differences than bacterial assemblages.
The abundance patterns of dominant shared species further highlighted these compositional differences (Figure 4e–f). Among bacteria, members of the genera Sphingomonas, Skermanella, Flavisolibacter, and Gemmatirosa displayed contrasting abundance profiles across land-use systems. Similarly, dominant fungal species such as Mortierella alpina, Alternaria alternata, Fusarium oxysporum, Rhizophagus irregularis, and Ustilago maydis varied substantially among treatments, indicating that even widely distributed taxa responded differently to management and environmental conditions.
Analysis of unique taxa provided additional evidence for land-use-specific microbial signatures (Figure 4g–h). Crop soils were characterized by highly abundant unique bacterial species, including Sulfuriferula thiophila and Paraburkholderia lava, whereas orchard soils contained characteristic taxa such as Asticcacaulis tiandongensis. Likewise, fungal communities exhibited distinct land-use-associated species, with Hanseniaspora uvarum dominating crop-specific assemblages and Penicillium griseofulvum representing the most abundant orchard-specific fungal species.
3.5. Microbial Dominance Structure and Community Evenness
To determine whether the observed taxonomic and functional differences among land-use systems were driven by a small number of dominant taxa or reflected broader community-wide shifts, species were classified into above-average and below-average groups based on treatment-specific mean relative abundance thresholds.
Across all land-use systems, a relatively small proportion of taxa accounted for most microbial abundance (Figure 5). In bacterial communities, above-average taxa contributed approximately 87–90% of total abundance, whereas below-average taxa accounted for only 10–13% (Figure 5a). A similar pattern was observed for fungi, where dominant taxa represented approximately 84–88% of total abundance (Figure 5b). In contrast, richness patterns showed the opposite trend. Above-average bacterial taxa represented only 10–15% of detected species, while below-average taxa accounted for approximately 85–90% of total richness (Figure 5c). Comparable distributions were observed for fungal communities (Figure 5d), indicating that most species were rare and contributed only marginally to overall abundance.
Despite the compositional differences identified in previous analyses, dominance structure remained remarkably consistent across land-use systems. Only minor variation was observed in the relative contribution of dominant and rare taxa, suggesting that community turnover was primarily associated with changes in taxonomic identity rather than major shifts in abundance distribution.
This pattern was further supported by Pielou’s evenness values. Bacterial communities exhibited relatively uniform evenness across all systems, ranging from approximately 0.66 to 0.73 (Figure 5e). Fungal communities showed slightly greater variability, with median values ranging from approximately 0.62 to 0.75 (Figure 5f), although differences among land-use systems remained modest overall.
The ridge-density analyses revealed a clear separation between dominance classes (Figure 5g–h). In both bacterial and fungal communities, above-average taxa consistently displayed lower Pielou evenness values than below-average taxa, reflecting the disproportionate contribution of a limited number of dominant species to total abundance. This pattern was particularly pronounced for fungi, where the distributions of the two dominance classes showed minimal overlap.
3.6. Microbial Network Organization
Although land-use systems exhibited broadly similar dominance structures and levels of community evenness, co-occurrence network analyses revealed clear differences in the organization and connectivity of microbial communities (Figure 6). Network density varied considerably among management systems, indicating differences in the extent of potential microbial interactions and community integration.
Alfalfa soils exhibited the highest network density for both bacterial (De = 0.806) and fungal communities (De = 0.808), reflecting highly interconnected microbial assemblages with numerous co-occurrence relationships among taxa. In contrast, crop soils displayed the lowest fungal network density (De = 0.384), suggesting a less connected and more fragmented fungal community structure. Not cultivated soils also maintained relatively high connectivity for both bacteria (De = 0.748) and fungi (De = 0.667), whereas orchard soils exhibited intermediate density values (bacteria: De = 0.686; fungi: De = 0.590).
Compared with density, differences in modularity were less pronounced. Bacterial modularity ranged from 0.006 in orchards to 0.051 in crop soils, while fungal modularity varied only slightly between 0.021 and 0.026. Overall, all networks were characterized by relatively low modularity values, indicating limited subdivision into strongly separated modules.
The network topologies visually reflected these patterns. Alfalfa and not cultivated soils displayed densely connected bacterial and fungal communities with numerous links among taxa, whereas crop soils were characterized by reduced connectivity, particularly within fungal communities. Orchard soils occupied an intermediate position, maintaining relatively connected bacterial networks while supporting fungal communities that were less integrated than those observed in alfalfa soils.
Given that soil depth emerged as the strongest driver of microbial community composition, co-occurrence networks were further examined across the three soil layers to determine whether vertical stratification also influenced microbial interaction patterns (Figure 7). Clear depth-related changes were observed in both bacterial and fungal networks. For bacteria, network density increased progressively from 0.625 in the 0–30 cm layer to 0.689 at 31–60 cm and 0.737 at 61–90 cm (Figure 7d), indicating increasingly interconnected microbial associations with depth. At the same time, bacterial modularity declined from 0.051 in the topsoil to 0.002 and 0.006 in the deeper layers, suggesting reduced subdivision into distinct network modules.
Fungal communities exhibited a similar but more pronounced response. Network density increased substantially from 0.384 in the 0–30 cm layer to 0.631 at 31–60 cm and remained high at 0.624 in the deepest layer. The largest shift occurred between the topsoil and subsoil horizons, indicating a marked increase in fungal connectivity below 30 cm depth. In contrast, fungal modularity remained consistently low, decreasing only slightly from 0.026 in the surface layer to 0.021 and 0.015 at greater depths.
The network visualizations supported these quantitative patterns. Fungal communities in the topsoil formed relatively sparse interaction networks, whereas both subsoil layers exhibited denser and more integrated structures. Bacterial communities displayed a comparable, although less pronounced, increase in connectivity with depth. Across all soil layers, modularity values remained low, indicating limited compartmentalization of microbial interactions throughout the soil profile.
3.7. Land-Use Effects on Microbial Functional Composition
To facilitate ecological interpretation, the twelve literature-curated microbial functions were grouped into four broader ecosystem-function categories: Nutrient Cycling and Plant Nutrition, Plant–Microbe Interactions, Environmental Adaptation and Remediation, and Organic Matter Turnover and Carbon Cycling, following the classification framework previously developed and described by Gashi et al. [72].
Non-metric multidimensional scaling (NMDS) based on Bray–Curtis dissimilarities revealed that the composition of predicted microbial functional groups varied among land-use systems, although the degree of separation differed according to functional category (Figure 8). Within the Nutrient Cycling and Plant Nutrition category, phosphorus solubilization (PERMANOVA, p = 0.004, Figure 8b), potassium solubilization (p = 0.001, Figure 8c), and plant growth promotion (p = 0.004, Figure 8d) showed significant overall differences among land-use systems, whereas nitrogen fixation did not (p = 0.092, Figure 8a), indicating that nitrogen-fixing communities remained comparatively conserved despite partial visual separation. Pairwise PERMANOVA further showed significant differences for phosphorus solubilization, potassium solubilization, and plant growth promotion after Benjamini–Hochberg correction, whereas no pairwise differences were detected for nitrogen fixation. Among Plant–Microbe Interactions, siderophore production (p = 0.002, Figure 8f) and mycorrhizal symbiosis (p = 0.007, Figure 8g) exhibited significant land-use-dependent clustering, while production of phytohormones showed only moderate overall separation (p = 0.097, Figure 8e). Pairwise analyses confirmed significant differences for siderophore production, mycorrhizal symbiosis, and production of phytohormones between selected land-use systems. Within the Environmental Adaptation and Remediation category, hydrocarbon degradation displayed one of the strongest separations among land-use systems (p = 0.001, Figure 8i), whereas bioremediation (p = 0.162, Figure 8h) and antibiotic resistance (p = 0.251, Figure 8j) exhibited substantial overlap among groups, indicating relatively stable functional composition across vegetation types. Consistently, pairwise PERMANOVA identified significant differences only for hydrocarbon degradation, while bioremediation and antibiotic resistance remained non-significant after multiple-testing correction. Similarly, functions related to Organic Matter Turnover and Carbon Cycling differed significantly among land-use systems, as both organic matter decomposition (p = 0.001, Figure 8k) and methane oxidizers (p = 0.006, Figure 8l) exhibited distinct ordination patterns, particularly separating orchard-associated communities from the remaining land-use systems. Pairwise comparisons further revealed the highest number of significant differences for organic matter decomposition, whereas methane oxidizers showed a more limited but still significant differentiation among selected land-use systems.
3.8. Depth-Dependent Variation in Microbial Functional Potential
3.8.1. Oxidative Stress-Related Functional Profiles
Oxidative stress-related microbial functions play a central role in protecting soil microorganisms from reactive oxygen species (ROS), maintaining intracellular redox balance, repairing oxidative damage, and regulating cellular responses to environmental stress. To facilitate ecological interpretation, oxidative stress-associated KEGG functions were grouped into five categories: ROS Detoxification, Redox Homeostasis, Oxidative Damage Repair, Stress Regulation, and Antioxidant Metabolite Production (Figure 9). The analysis revealed a clear vertical stratification of oxidative stress functions throughout the soil profile. When all oxidative stress-related KEGGs were considered together, microbial communities were significantly separated according to depth (R² = 0.403, p = 0.001), and topsoil exhibited a significantly greater overall oxidative stress functional potential than subsoil (p = 0.0358) (Figure 9a).
Among the individual categories, Stress Regulation showed the strongest depth-related structuring (R² = 0.548, p = 0.001) (Figure 9d), followed by Redox Homeostasis (R² = 0.471, p = 0.001) (Figure 9e) and ROS Detoxification (R² = 0.396, p = 0.001) (Figure 9b). Moreover, the functional potential of ROS Detoxification was substantially higher in topsoil than in subsoil (p = 5.1 × 10⁻⁶). Similarly, Redox Homeostasis functions were significantly enriched in topsoil (p = 0.00025) (Figure 9e). Stress Regulation functions also showed significantly greater potential in topsoil (p = 0.026).
In contrast, Oxidative Damage Repair displayed significant compositional differences across depths (R² = 0.361, p = 0.001) but no significant difference in total functional potential between topsoil and subsoil (p = 0.36) (Figure 9c). Likewise, Antioxidant Metabolite Production exhibited clear depth-dependent community structuring (R² = 0.384, p = 0.001), yet its overall functional potential remained comparable between soil layers (p = 0.71) (Figure 9f).
3.8.2. LEfSe Biomarkers of Oxidative Stress Functions
To identify the oxidative stress-related functions driving the functional differentiation between topsoil and subsoil microbial communities, LEfSe analysis was performed using oxidative stress-associated KEGG orthologs (Figure 10). A total of 117 significantly enriched KEGG biomarkers were identified, revealing clear depth-dependent functional specialization (Figure 10a). Topsoil was primarily characterized by biomarkers involved in redox balance, ROS detoxification, and cellular stress responses, including thioredoxin reductase (K00384), superoxide dismutase (K03781), and several DNA repair and stress-regulation functions. In contrast, subsoil communities were predominantly enriched in biomarkers associated with antioxidant metabolite production, including K00549, K01011, K03833, K12960, K21148, K00245, and K03636.
Grouping the significant biomarkers into five oxidative stress-related functional categories further emphasized these depth-dependent patterns (Figure 10b). Antioxidant Metabolite Production represented the largest functional group (n = 54), with 64.8% of biomarkers enriched in subsoil and 35.2% in topsoil. Oxidative Damage Repair contained 16 significant biomarkers and exhibited an equal distribution between topsoil and subsoil (50% each), suggesting that DNA and protein repair mechanisms are equally important across both soil horizons. In contrast, ROS Detoxification showed the strongest topsoil preference, with 83.3% of significant biomarkers enriched in topsoil and only 16.7% in subsoil. Likewise, Redox Homeostasis was predominantly represented by topsoil biomarkers (70%) compared with subsoil (30%), while Stress Regulation also favored topsoil (60%) over subsoil (40%).
3.8.3. Nutrient Cycling and Metabolic Pathways
Depth-related functional shifts were explored with selected KEGG pathways associated with carbon, nitrogen, phosphorus, sulfur, and iron metabolism were compared between topsoil and subsoil (Figure 11). The results indicate that topsoil harbors a greater functional potential for several key metabolic processes. The biosynthesis of siderophore group nonribosomal peptides was significantly enriched in topsoil (p = 0.021). Similarly, phosphonate and phosphinate metabolism showed significantly higher abundance in topsoil (p = 0.015). Among all pathways examined, starch and sucrose metabolism exhibited the strongest difference between soil layers (p = 0.0012). Inositol phosphate metabolism (p = 0.058) and sulfur metabolism (p = 0.054) displayed similar trends, with higher relative abundances in topsoil, although the differences remained slightly above the conventional significance threshold. In contrast, nitrogen metabolism did not differ significantly between topsoil and subsoil (p = 0.19).
3.9. Plant Pathogen Communities
3.9.1. Overall Pathogen Prevalence Across Agricultural Systems
To provide an initial overview of pathogen occurrence across agricultural systems, pathogen prevalence was examined separately for crop and orchard soils (Figure 12). Mean prevalence values were calculated from the proportion of samples in which each pathogen was detected, allowing comparison of the overall distribution of bacterial and fungal pathogens among host systems.
Among crop systems, bacterial pathogens exhibited relatively high prevalence in both feed corn and sweet corn soils. Sweet corn showed a higher mean bacterial pathogen prevalence (72.5%) than feed corn (62.5%), despite harboring fewer detected bacterial pathogen species (15 vs. 18). This pattern suggests that bacterial pathogens in sweet corn were distributed more consistently across samples, whereas feed corn supported a broader pathogen diversity with less uniform occurrence. However, the difference between crop types was not statistically significant (Wilcoxon test, p = 0.546).
A similar trend was observed for fungal pathogens. Sweet corn displayed a slightly higher mean prevalence (36.8%) than feed corn (32.8%) and contained a greater number of detected fungal pathogen species (18 vs. 16). Nevertheless, prevalence distributions did not differ significantly between the two crop types (p = 1.000).
Within orchard systems, bacterial pathogen prevalence was nearly identical between quince and walnut soils, with both systems exhibiting a mean prevalence of 77.8%. Although quince contained a larger number of detected bacterial pathogen species (15) than walnut (12), prevalence patterns remained highly similar (p = 0.892), indicating that bacterial pathogens were equally widespread across both orchard types.
The largest contrast was observed for fungal pathogens in orchard soils. Quince exhibited a substantially higher mean fungal pathogen prevalence (71.4%) than walnut (54.2%), despite containing slightly fewer pathogen species (7 vs. 8). Although this difference was not statistically significant (p = 0.288), it suggests that fungal pathogens were detected more consistently across quince samples.
3.10. Distribution of Plant Pathogens Across Agricultural Systems
A substantial proportion of the curated pathogen lists was detected within the studied soils, indicating that both crop and orchard systems harbored diverse communities of potential plant pathogens (Figure 13). Bacterial pathogen assemblages in crop soils were dominated by members of the genera Xanthomonas, Pseudomonas, Ralstonia, Clavibacter, and Xylella. In contrast, orchard soils were characterized primarily by Pseudomonas marginalis, Burkholderia glumae, Xylella fastidiosa, and several Xanthomonas species. Fungal pathogen communities displayed even clearer differences between production systems. Crop soils were dominated by Fusarium-associated pathogens, including Fusarium oxysporum, F. graminearum, F. proliferatum, F. verticillioides, and F. solani, whereas orchard soils were characterized by Alternaria alternata, Epicoccum nigrum, Fusarium oxysporum, Monilinia fructigena, and Verticillium dahliae.
Detected pathogen diversity was relatively evenly distributed among host types within each production system. Among bacterial pathogens, feed corn contributed 55.9% of the crop-associated species, while sweet corn accounted for 44.1%. A similar pattern was observed in orchards, where quince and walnut contributed 55.6% and 44.4% of the detected bacterial pathogen diversity, respectively. Fungal communities followed the same general trend, although sweet corn (54.5%) and walnut (53.3%) contributed slightly larger proportions of fungal pathogen diversity than feed corn (45.5%) and quince (46.7%).
Despite the relatively balanced species distributions, pathogen abundance was strongly concentrated in a limited number of taxa. Within crop systems, bacterial pathogen communities were dominated by Xanthomonas-related species, particularly Xanthomonas oryzae, X. citri, X. campestris, and X. translucens, together with Pseudomonas syringae. Orchard bacterial communities were largely dominated by Micrococcus luteus and Pantoea agglomerans, which together accounted for most of the bacterial pathogen abundance. For fungal pathogens, crop soils were overwhelmingly dominated by Ustilago maydis and several Fusarium species, whereas orchard soils were characterized by the strong dominance of Monilinia fructigena, accompanied by Alternaria alternata and Fusarium oxysporum.
Comparisons among individual host systems revealed additional differences in pathogen structure. Feed corn and sweet corn supported largely similar bacterial pathogen assemblages, although the relative contribution of individual Xanthomonas species varied between crops. Greater variation was observed within fungal communities, where sweet corn contained a larger contribution of Fusarium species than feed corn. Orchard systems also differed in their dominant pathogens. Walnut soils showed a stronger dominance of Monilinia fructigena, whereas quince soils supported a more diverse fungal pathogen assemblage involving Alternaria, Fusarium, and Rhizoctonia species. Similar host-specific shifts were observed among bacterial pathogens, where the relative abundance of individual taxa varied between quince and walnut despite the presence of a broadly shared pathogen pool.
3.11. Species-Level Pathogen Prevalence Patterns
Species-level prevalence analyses revealed that a relatively small number of pathogens occurred consistently across most samples, forming a core pathogen community within each production system (Figure 14). In contrast to abundance-based analyses, prevalence reflects the frequency with which individual pathogens were detected and therefore identifies taxa that are widespread regardless of their relative abundance.
Crop-associated bacterial pathogens exhibited particularly high prevalence (Figure 14a). Xylella fastidiosa, Xanthomonas translucens, Xanthomonas oryzae, Xanthomonas citri, Xanthomonas campestris, Ralstonia solanacearum, Pseudomonas syringae, and Clavibacter michiganensis were present in all feed corn and sweet corn samples, indicating a highly stable bacterial pathogen core. At the opposite end of the spectrum, Dickeya dadantii, Xanthomonas cucurbitae, and Rathayibacter tritici occurred only sporadically, with prevalence values ranging from 8% to 17%.
A similarly high prevalence was observed among orchard bacterial pathogens (Figure 14b). Xanthomonas campestris, Xanthomonas arboricola, Pseudomonas viridiflava, Pseudomonas syringae, Pantoea agglomerans, and Micrococcus luteus were detected in every quince and walnut sample. Other pathogens, including Xylella fastidiosa, Pseudomonas savastanoi, and Burkholderia glumae, occurred in all quince samples but only two-thirds of walnut samples, suggesting moderate host-specific variation in distribution.
Among fungal pathogens, Fusarium oxysporum was the most consistently detected species in crop systems, occurring in all feed corn and sweet corn samples (Figure 14c). Ustilago maydis also showed high prevalence, being present in 83% of feed corn and all sweet corn samples. Several additional Fusarium species, including F. solani, F. equiseti, and F. proliferatum, exhibited moderate to high prevalence, whereas Eutypa lata, Fusarium sporotrichioides, and Phaeoacremonium chlamydospora were encountered only occasionally. These patterns indicate that crop-associated fungal pathogen communities were largely structured around a core group of Fusarium-related taxa.
Orchard fungal communities displayed a somewhat different prevalence structure (Figure 14d). Fusarium oxysporum and Alternaria alternata were detected in all quince and walnut samples, making them the most consistently occurring fungal pathogens within orchard soils. Rhizoctonia solani was also highly prevalent, occurring in every quince sample and in 67% of walnut samples. In contrast, Monilinia fructigena and Phaeoacremonium minimum were restricted to walnut soils, whereas Verticillium dahliae was detected exclusively in quince soils, highlighting host-specific differences in pathogen distribution.
3.12. Depth-Related Distribution of Pathogens
The widespread occurrence of several bacterial and fungal pathogens prompted a further examination of their vertical distribution within the soil profile. By comparing pathogen abundance across the 0–30, 31–60, and 61–90 cm soil layers, it was possible to assess whether pathogens were concentrated in surface soils or persisted throughout deeper horizons (Figure 15).
Bacterial pathogens displayed relatively broad depth distributions, with several taxa occurring across all three soil layers (Figure 15a). Xanthomonas oryzae, Pseudomonas syringae, Ralstonia solanacearum, Xanthomonas citri, and Clavibacter michiganensis maintained measurable abundance throughout the soil profile, indicating persistence beyond the surface horizon. Among these taxa, Xanthomonas oryzae exhibited the highest abundance, particularly within the 0–30 cm layer. In contrast, Ralstonia pseudosolanacearum, Pseudomonas cichorii, and Xanthomonas cucurbitae showed more restricted distributions and occurred only within selected depth intervals at comparatively low abundance.
Fungal pathogens exhibited stronger depth-related patterns than bacterial pathogens (Figure 15b). The highest abundance values were generally concentrated in the topsoil, where Fusarium oxysporum and Ustilago maydis emerged as the dominant fungal pathogens. Several Fusarium species, including F. solani, F. proliferatum, F. poae, and F. equiseti, were detected across multiple soil layers, demonstrating their ability to persist throughout the soil profile. Other fungal pathogens displayed more distinct depth preferences. Verticillium longisporum, Phaeomoniella chlamydospora, and Macrophomina phaseolina were primarily associated with the upper soil layer, whereas Claviceps purpurea and Bipolaris sorokiniana were more frequently detected in deeper horizons.
3.13. Environmental Drivers of Pathogen Distribution
The widespread occurrence of several pathogens across crop and orchard systems prompted an examination of their relationships with soil physicochemical properties (Figure 16). Overall, fungal pathogens in crop systems exhibited the strongest and most frequent associations with soil variables, whereas pathogens in orchard soils generally showed weaker and predominantly non-significant responses.
Among crop-associated fungal pathogens (Figure 16a), soil pH emerged as the most influential environmental factor. Several Fusarium species exhibited significant negative correlations with pH, including Fusarium oxysporum (r = −0.68, p < 0.001), Fusarium solani (r = −0.61, p < 0.01), Fusarium equiseti (r = −0.51, p < 0.05), and Fusarium graminearum (r = −0.45, p < 0.05). Similar negative relationships were observed for Ustilago maydis (r = −0.67, p < 0.001) and Gaeumannomyces tritici (r = −0.58, p < 0.01). In contrast, Rhizoctonia solani was positively associated with available phosphorus (P₂O₅) (r = 0.53, p < 0.01), while U. maydis also exhibited a negative relationship with CaCO₃ content (r = −0.49, p < 0.05).
Relationships between orchard fungal pathogens and soil properties were considerably weaker (Figure 16b). Although several taxa displayed moderate positive or negative trends, none of the observed correlations reached statistical significance, suggesting that the measured soil parameters explained only a limited proportion of variation in fungal pathogen abundance within orchard soils.
Crop-associated bacterial pathogens generally exhibited weaker responses than fungal pathogens (Figure 16c). Most correlations were low to moderate and non-significant. The clearest associations were observed for Pseudomonas syringae, which showed positive correlations with pH (r ≈ 0.49, p < 0.05) and CaCO₃ (r ≈ 0.61, p < 0.01). Other bacterial pathogens displayed only limited relationships with the measured soil variables.
A similar pattern was observed within orchard bacterial communities (Figure 16d). Most associations were weak and non-significant, although Xanthomonas arboricola exhibited a strong negative correlation with pH (r ≈ −0.81, p < 0.001) and a negative association with CaCO₃ (r ≈ −0.69, p < 0.01). Pseudomonas syringae also showed a weaker negative relationship with pH (p < 0.05). Positive associations with nutrient-related variables such as nitrate, P₂O₅, and K₂O were observed for several taxa, although these relationships were not statistically significant.
4. Discussion
The results of this study demonstrate that soil microbial communities are shaped by the combined effects of vertical soil stratification and land-use history, although these factors influence different aspects of community organization. Among all evaluated variables, soil depth emerged as the strongest determinant of microbial community composition, highlighting the importance of vertical environmental gradients in structuring belowground biodiversity.
The strong influence of depth is consistent with the concept of environmental filtering, whereby soil horizons represent distinct ecological habitats characterized by differences in carbon availability, root density, oxygen concentration, moisture dynamics, and nutrient accessibility. Surface soils receive continuous inputs of plant residues and root exudates that create diverse ecological niches and support highly heterogeneous microbial communities. In contrast, deeper soil layers are generally characterized by lower carbon availability and more stable environmental conditions, favoring a smaller subset of microorganisms adapted to resource limitation [73]. Consequently, the observed decline in richness with depth likely reflects not only reduced resource availability but also increasing environmental specialization. The pronounced separation of microbial communities among soil layers further suggests that depth-related patterns are driven primarily by species replacement rather than simple richness loss, indicating that deeper horizons harbor distinct microbial assemblages adapted to specific ecological conditions [74].
While depth represented the dominant environmental filter, land-use systems exerted a strong influence on community composition without substantially affecting microbial richness. Such a pattern is frequently observed in soil ecosystems and reflects the high degree of functional redundancy within microbial communities. Multiple taxa often perform similar ecological functions, allowing species turnover to occur without major changes in overall diversity or ecosystem functioning [75]. This interpretation is supported by the presence of a large shared bacterial core across all land-use systems, suggesting that a considerable proportion of the soil microbiome remains relatively stable despite differences in management practices [76].
At the same time, the identification of numerous unique bacterial and fungal taxa indicates that individual land-use systems provide distinct ecological niches that support specialized microbial assemblages [77]. The particularly high number of unique taxa detected in crop soils may reflect the greater environmental heterogeneity associated with annual cultivation, fertilization practices, seasonal vegetation turnover, and recurrent soil disturbance [77].
Fungal communities appeared to respond more strongly to land-use differences than bacterial communities, a pattern commonly reported in agricultural ecosystems. Unlike bacteria, fungi rely heavily on plant-derived carbon inputs and frequently establish close associations with roots, litter, and decomposing plant residues [78]. As a result, differences among alfalfa, crop, orchard, and uncultivated systems are likely to create contrasting resource environments that selectively favor distinct fungal assemblages. Bacterial communities, although responsive to environmental change, generally exhibit greater metabolic flexibility and are therefore capable of persisting across a wider range of environmental conditions [79]. This difference in ecological strategy may explain why fungal communities exhibited stronger compositional turnover than bacterial communities across the studied land-use systems.
The observed functional differentiation indicates that the effects of land use extend beyond taxonomic composition and ultimately influence ecological processes linked to nutrient cycling, plant productivity, and carbon turnover [80,81]. However, the strength of this response varied among functional groups. Functions associated with phosphorus and potassium solubilization, plant growth promotion, mycorrhizal symbiosis, hydrocarbon degradation, and organic matter decomposition exhibited the clearest land-use-specific differentiation, whereas nitrogen fixation, bioremediation, and antibiotic resistance remained comparatively conserved after correction for multiple comparisons. These findings suggest that microbial functions directly linked to nutrient acquisition and carbon turnover are more responsive to long-term changes in vegetation and management practices than broadly distributed ecological functions [82]. The particularly strong differentiation observed for organic matter decomposition, which exhibited the highest number of significant pairwise comparisons among all evaluated functional groups, further highlights the importance of organic matter quality in shaping microbial communities Although microbial communities exhibit a considerable degree of functional redundancy, certain ecosystem processes remain strongly dependent on community composition. Glassman et al. [83] demonstrated that shifts in microbial composition can directly alter decomposition rates and litter chemistry, suggesting that different vegetation types support microbiomes with distinct functional capacities for degrading cellulose, lignin, and other organic compounds. Therefore, the functional divergence observed among land-use systems likely reflects differences in both resource quality and long-term vegetation inputs.
Despite substantial taxonomic and functional turnover, microbial dominance patterns remained remarkably stable across land-use systems. In all cases, a relatively small fraction of taxa accounted for the majority of microbial abundance, whereas most species occurred at low abundance. This pattern is characteristic of complex microbial ecosystems and reflects the existence of a stable abundance hierarchy. Dominant taxa are often ecological generalists capable of efficiently exploiting available resources, while rare taxa constitute a large reservoir of genetic and functional diversity that contributes to ecosystem resilience. Similar patterns were reported by Gschwend et al. [84], who showed that the relationship between abundant and rare taxa remains surprisingly consistent across contrasting land-use systems despite ongoing species turnover.
Although dominance structure remained largely unchanged, network analyses revealed pronounced differences in the organization of microbial interactions. This apparent contrast suggests that land-use systems influence how microorganisms interact rather than how abundance is distributed among taxa. The highly connected bacterial and fungal networks observed in alfalfa soils likely result from the continuous root inputs and reduced disturbance associated with perennial vegetation. Long-term carbon inputs can promote cooperative interactions and increase network stability, leading to more integrated microbial communities. Conversely, the reduced connectivity observed in crop soils may reflect periodic disturbance, seasonal vegetation turnover, and fluctuating resource availability [85].
Depth-related network responses revealed an equally interesting pattern. Although deeper soil layers contained fewer species, the remaining microorganisms formed increasingly interconnected networks. One possible explanation is that resource limitation strengthens microbial dependencies, promoting cooperative interactions, cross-feeding relationships, and metabolic complementarity among the taxa that persist in deeper horizons. Similar mechanisms have been proposed for oligotrophic environments, where community stability relies more heavily on interspecific interactions than on taxonomic diversity itself. However, the direction of depth-related network responses is not universal. Guseva et al. [86] reported lower connectivity in forest subsoils, suggesting that the effects of depth depend strongly on ecosystem type, vegetation cover, and local environmental conditions.
Soil depth strongly influenced the oxidative stress response strategies of microbial communities. The enrichment of ROS detoxification, redox homeostasis, and stress-regulation functions in topsoil suggests that microorganisms in surface horizons are exposed to greater oxidative stress due to higher oxygen availability, stronger environmental fluctuations, and intensive root activity. According to Pett-Ridge and Firestone [87], microbes in the surface layers of tropical soils, exposed to strong environmental fluctuations, develop physiological tolerance mechanisms and antioxidant enzymes to cope with redox stress. In contrast, the predominance of antioxidant metabolite production biomarkers in subsoil indicates a shift toward more stable and long-term protective mechanisms. The enrichment of thioredoxin reductase and superoxide dismutase further supports the importance of active oxidative stress management in topsoil communities.
Depth also affected nutrient-related metabolic pathways. The higher abundance of siderophore biosynthesis, phosphorus-acquisition pathways, and carbohydrate metabolism in topsoil likely reflects greater microbial competition for nutrients and increased availability of plant-derived substrates. According to Huang et al. [88], soil depth significantly influences the composition of soil organic matter, with topsoil characterized by a higher abundance of carbohydrates and a greater availability of plant-derived substrates, such as plant residues and root exudates, compared with subsoil. These findings suggest that soil depth selects for distinct microbial functional strategies, with topsoil communities adapted for rapid stress response and resource acquisition, whereas subsoil communities appear better adapted to relatively stable and resource-limited conditions.
Pathogen communities provided an additional perspective on how environmental conditions shape microbial assemblages. The widespread occurrence of several bacterial and fungal pathogens suggests the existence of stable pathogen cores within both crop and orchard systems. However, prevalence alone should not be interpreted as disease risk because pathogen activity depends on interactions among host plants, environmental conditions, and surrounding microbial communities.
Among the evaluated soil properties, pH emerged as the most consistent predictor of pathogen abundance. The strong negative associations observed between pH and several Fusarium species support the view that soil acidity acts as a major ecological filter regulating pathogen persistence and competitiveness. This interpretation is consistent with the findings of Li et al. [89], who identified soil pH as one of the strongest predictors of Fusarium root rot severity and demonstrated that soil acidification reduces the natural suppressive capacity of the soil microbiome. In contrast, nutrient-related variables exhibited comparatively weak relationships with pathogen abundance, indicating that pathogen distribution is influenced more strongly by environmental filtering and biological interactions than by nutrient availability alone.
The weaker environmental responses observed among orchard pathogens may reflect the greater ecological stability of perennial systems. Compared with annually cultivated fields, orchard soils experience lower levels of physical disturbance and maintain long-term plant–microbe associations that can buffer short-term fluctuations in environmental conditions. Similar patterns have been reported in perennial fruit systems, where management history and landscape context often exert stronger influences on microbial community assembly than individual soil properties [90]. Together, these findings suggest that pathogen communities are governed by a combination of abiotic filtering, host specificity, and microbial interactions, with soil pH representing one of the most important environmental drivers identified in the present study.
Collectively, these findings indicate that soil depth acts as the primary environmental filter shaping microbial community assembly, whereas land-use systems primarily influence community composition, ecological functions, and microbial interactions. Although richness and dominance structure remained relatively stable, substantial turnover was observed in taxonomic composition, functional potential, and network organization. The stronger response of fungal communities compared with bacterial communities highlights the importance of vegetation-driven resource availability in structuring soil microbiomes. Together, these results demonstrate that both vertical stratification and land-use history contribute to the development of functionally distinct soil microbial communities with potential implications for nutrient cycling, ecosystem stability, and plant health.
5. Conclusions
Understanding how agricultural management and environmental gradients shape soil microbial communities is essential for maintaining soil health and ecosystem sustainability. The results highlight the importance of both soil depth and land-use system in shaping agricultural soil microbiomes, although their effects operate at different levels of community organization. Soil depth emerged as the dominant factor influencing microbial richness, community composition, and network structure, whereas land-use systems primarily affected taxonomic turnover, ecological functions, microbial interactions, and pathogen distribution. Despite relatively stable alpha diversity and dominance patterns, substantial differences were observed in community composition, functional potential, and network organization. Fungal communities responded more strongly to land-use changes than bacterial communities, and shifts in microbial composition were accompanied by changes in nutrient cycling, plant-growth-related functions, and decomposition processes. In addition, soil depth was associated with distinct oxidative stress response strategies, with topsoil communities exhibiting greater potential for ROS detoxification, redox homeostasis, and stress regulation, while subsoil communities were characterized by a higher representation of antioxidant metabolite production functions. Network analyses further revealed greater connectivity in perennial systems, particularly alfalfa soils, while pathogen analyses identified soil pH as one of the most important factors associated with pathogen distribution. Overall, these findings demonstrate that agricultural management influences not only microbial diversity but also the ecological functions and interactions that underpin soil health and ecosystem functioning. Future studies should combine multi-omics approaches with broader geographical sampling to better understand the mechanisms governing soil microbiome assembly and resilience under different management practices. Such approaches may also help elucidate how beneficial soil microbiomes influence crop nutritional quality and the accumulation of health-promoting bioactive compounds, thereby supporting the development of sustainable agricultural systems for future medical food production.
Supplementary Materials
The following supporting information can be downloaded at the website of this paper posted on Preprints.org. Supplementary Table S1. Literature-based classification of oxidative stress-related functional categories used for metagenomic analyses. Supplementary Table S2. Complete LEfSe results for oxidative stress-related KEGG orthologs differentiating topsoil and subsoil microbial communities. Supplementary Table S3. Supplementary Table S2. Bacterial and fungal plant pathogens included in crop and orchard systems.
Author Contributions
Conceptualization, N.G., P.D., A.C.D., R.C., M.K., M.P.; data curation, N.G.; P.D. P.F.; formal analysis, N.G.; investigation N.G., M.P.; methodology, N.G., P.D., A.C.D., R.C., M.K., M.M., F.G., M.P.; project administration M.P., J.R., L.S.; supervision M.P., J.R.; writing—original draft, N.G., M.P.; writing—review and editing N.G., P.D., A.C.D., R.C., M.K., M.M., P.F., F.G., L.S., J.R., M.P. All authors have read and agreed to the published version of the manuscript.
Funding
No funding received.
Institutional Review Board Statement
Not applicable.
Informed Consent Statement
Not applicable.
Data Availability Statement
The authors will provide the raw data underlying this study’s conclusions upon request.
Acknowledgments
Supported by the University of Debrecen Program for Scientific Publication.
Conflicts of Interest
The authors declare no conflicts of interest.
References
- Cheng, C.; Zhao, D.; Deguo, L.V.; Shuang, L.; Guodong, D.U. Comparative Study on Microbial Community Structure across Orchard Soil, Cropland Soil, and Unused Soil. Soil Water Res. 2017, 12, 237–245. [Google Scholar] [CrossRef]
- Wei, X.; Xie, B.; Wan, C.; Song, R.; Zhong, W.; Xin, S.; Song, K. Enhancing Soil Health and Plant Growth through Microbial Fertilizers: Mechanisms, Benefits, and Sustainable Agricultural Practices. Agronomy 2024, 14, 609. [Google Scholar] [CrossRef]
- Ujvári, G.; Borsodi, A.K.; Megyes, M.; Mucsi, M.; Szili-Kovács, T.; Szabó, A.; Szalai, Z.; Jakab, G.; Márialigeti, K. Comparison of Soil Bacterial Communities from Juvenile Maize Plants of a Long-Term Monoculture and a Natural Grassland. Agronomy 2020, 10, 341. [Google Scholar] [CrossRef]
- Winkelmann, T.; Smalla, K.; Amelung, W.; Baab, G.; Grunewaldt-Stöcker, G.; Kanfra, X.; Meyhöfer, R.; Reim, S.; Schmitz, M.; Vetterlein, D.; et al. Apple Replant Disease: Causes and Mitigation Strategies. Curr. Issues Mol. Biol. 2019, 30, 89–106. [Google Scholar] [CrossRef] [PubMed]
- Somera, T.S.; Mazzola, M. Toward a Holistic View of Orchard Ecosystem Dynamics: A Comprehensive Review of the Multiple Factors Governing Development or Suppression of Apple Replant Disease. Front. Microbiol. 2022, 13. [Google Scholar] [CrossRef] [PubMed]
- Zhang, W.-G.; Wen, T.; Liu, L.-Z.; Li, J.-Y.; Gao, Y.; Zhu, D.; He, J.-Z.; Zhu, Y.-G. Agricultural Land-Use Change and Rotation System Exert Considerable Influences on the Soil Antibiotic Resistome in Lake Tai Basin. Sci. Total Environ. 2021, 771, 144848. [Google Scholar] [CrossRef] [PubMed]
- Fareleira, P.; Castro, I.V. e; Soares, R.; Matos, S.; Almeida, L.; Barradas, A.; Nunes, A.P. Culturas de cobertura para a melhoria das propriedades microbiológicas do solo em sistemas de produção hortícola intensiva. Rev. De Ciências Agrárias 2022, 45, 482–486. [Google Scholar] [CrossRef]
- Zheng, F.; Liu, X.; Ding, W.; Song, X.; Li, S.; Wu, X. Positive Effects of Crop Rotation on Soil Aggregation and Associated Organic Carbon Are Mainly Controlled by Climate and Initial Soil Carbon Content: A Meta-Analysis. Agric. Ecosyst. Environ. 2023, 355, 108600. [Google Scholar] [CrossRef]
- Zhang, N.; Xu, W.; Yu, X.; Lin, D.; Wan, S.; Ma, K. Impact of Topography, Annual Burning, and Nitrogen Addition on Soil Microbial Communities in a Semiarid Grassland. Soil Sci. Soc. Am. J. 2013, 77, 1214–1224. [Google Scholar] [CrossRef]
- Semeraro, S.; Kergunteuil, A.; Sánchez-Moreno, S.; Puissant, J.; Goodall, T.; Griffiths, R.; Rasmann, S. Relative Contribution of High and Low Elevation Soil Microbes and Nematodes to Ecosystem Functioning. Funct. Ecol. 2022, 36, 974–986. [Google Scholar] [CrossRef]
- Hao, J.; Chai, Y.N.; Lopes, L.D.; Ordóñez, R.A.; Wright, E.E.; Archontoulis, S.; Schachtman, D.P. The Effects of Soil Depth on the Structure of Microbial Communities in Agricultural Soils in Iowa (United States). Appl. Environ. Microbiol. 2021, 87, e02673-20. [Google Scholar] [CrossRef] [PubMed]
- Gong, J.; Hou, W.; Liu, J.; Malik, K.; Kong, X.; Wang, L.; Chen, X.; Tang, M.; Zhu, R.; Cheng, C.; et al. Effects of Different Land Use Types and Soil Depths on Soil Mineral Elements, Soil Enzyme Activity, and Fungal Community in Karst Area of Southwest China. Int. J. Environ. Res. Public Health 2022, 19, 3120. [Google Scholar] [CrossRef] [PubMed]
- Remenyik, J.; Csige, L.; Dávid, P.; Fauszt, P.; Szilágyi-Rácz, A.A.; Szőllősi, E.; Bacsó, Z.R.; Jnr, I.S.; Molnár, K.; Rácz, C.; et al. Exploring the Interplay between the Core Microbiota, Physicochemical Factors, Agrobiochemical Cycles in the Soil of the Historic Tokaj Mád Wine Region. PLoS ONE 2024, 19, e0300563. [Google Scholar] [CrossRef] [PubMed]
- Zhao, X.; Drlica, K. Reactive Oxygen Species and the Bacterial Response to Lethal Stress. Curr. Opin. Microbiol. 2014, 21, 1–6. [Google Scholar] [CrossRef] [PubMed]
- Staerck, C.; Gastebois, A.; Vandeputte, P.; Calenda, A.; Larcher, G.; Gillmann, L.; Papon, N.; Bouchara, J.-P.; Fleury, M.J.J. Microbial Antioxidant Defense Enzymes. Microb. Pathog. 2017, 110, 56–65. [Google Scholar] [CrossRef] [PubMed]
- Gutierrez, C.; Devedjian, J.C. Osmotic Induction of Gene osmC Expression in Escherichia Coli K12. J. Mol. Biol. 1991, 220, 959–973. [Google Scholar] [CrossRef] [PubMed]
- Clarke, D.J.; Mackay, C.L.; Campopiano, D.J.; Langridge-Smith, P.; Brown, A.R. Interrogating the Molecular Details of the Peroxiredoxin Activity of the Escherichia Coli Bacterioferritin Comigratory Protein Using High-Resolution Mass Spectrometry. Biochemistry 2009, 48, 3904–3914. [Google Scholar] [CrossRef] [PubMed]
- Prieto-Álamo, M.-J.; Jurado, J.; Gallardo-Madueño, R.; Monje-Casas, F.; Holmgren, A.; Pueyo, C. Transcriptional Regulation of Glutaredoxin and Thioredoxin Pathways and Related Enzymes in Response to Oxidative Stress*. J. Biol. Chem. 2000, 275, 13398–13405. [Google Scholar] [CrossRef] [PubMed]
- Missirlis, F.; Phillips, J.P.; Jäckle, H. Cooperative Action of Antioxidant Defense Systems in Drosophila. Curr. Biol. 2001, 11, 1272–1277. [Google Scholar] [CrossRef] [PubMed]
- Akif, M.; Khare, G.; Tyagi, A.K.; Mande, S.C.; Sardesai, A.A. Functional Studies of Multiple Thioredoxins from Mycobacterium Tuberculosis. J. Bacteriol. 2008, 190, 7087–7095. [Google Scholar] [CrossRef] [PubMed]
- Lu, J.; Holmgren, A. The Thioredoxin Antioxidant System. Free Radic. Biol. Med. 2014, 66, 75–87. [Google Scholar] [CrossRef] [PubMed]
- Okumura, N.; Masamoto, K.; Wada, H. The gshB Gene in the Cyanobacterium Synechococcus Sp. PCC 7942 Encodes a Functional Glutathione Synthetase. Microbiology 1997, 143, 2883–2890. [Google Scholar] [CrossRef] [PubMed]
- Cadet, J.; Davies, K.J.A. Oxidative DNA Damage & Repair: An Introduction. Free Radic. Biol. Med. 2017, 107, 2–12. [Google Scholar] [CrossRef] [PubMed]
- Hori, M.; Ishiguro, C.; Suzuki, T.; Nakagawa, N.; Nunoshiba, T.; Kuramitsu, S.; Yamamoto, K.; Kasai, H.; Harashima, H.; Kamiya, H. UvrA and UvrB Enhance Mutations Induced by Oxidized Deoxyribonucleotides. DNA Repair 2007, 6, 1786–1793. [Google Scholar] [CrossRef] [PubMed]
- Wozniak, K.J.; Simmons, L.A. Bacterial DNA Excision Repair Pathways. Nat. Rev. Microbiol. 2022, 20, 465–477. [Google Scholar] [CrossRef] [PubMed]
- Santos-Escobar, F.; Leyva-Sánchez, H.C.; Ramírez-Ramírez, N.; Obregón-Herrera, A.; Pedraza-Reyes, M. Roles of Bacillus Subtilis RecA, Nucleotide Excision Repair, and Translesion Synthesis Polymerases in Counteracting Cr(VI)-Promoted DNA Damage. J. Bacteriol. 2019, 201. [Google Scholar] [CrossRef]
- Wang, G.; Maier, R.J. Critical Role of RecN in Recombinational DNA Repair and Survival of Helicobacter Pylori. Infect. Immun. 2008, 76, 153–160. [Google Scholar] [CrossRef] [PubMed]
- Dupuy, P.; Howlader, M.; Glickman, M.S. A Multilayered Repair System Protects the Mycobacterial Chromosome from Endogenous and Antibiotic-Induced Oxidative Damage. Proc. Natl. Acad. Sci. 2020, 117, 19517–19527. [Google Scholar] [CrossRef] [PubMed]
- Zhou, Q.; Zhang, X.; Xu, H.; Xu, B.; Hua, Y. RadA: A Protein Involved in DNA Damage Repair Processes of Deinococcus Radiodurans R1. Chin. SCI BULL. 2006, 51, 2993–2999. [Google Scholar] [CrossRef]
- Tran, H.T.; Bonilla, C.Y. SigB-Regulated Antioxidant Functions in Gram-positive Bacteria. World J. Microbiol. Biotechnol. 2021, 37, 38. [Google Scholar] [CrossRef] [PubMed]
- Alves, J.A.; Previato-Mello, M.; Barroso, K.C.M.; Koide, T.; da Silva Neto, J.F. The MarR Family Regulator OsbR Controls Oxidative Stress Response, Anaerobic Nitrate Respiration, and Biofilm Formation in Chromobacterium Violaceum. BMC Microbiol. 2021, 21, 304. [Google Scholar] [CrossRef] [PubMed]
- Imlay, J.A. Transcription Factors That Defend Bacteria Against Reactive Oxygen Species. Annu. Rev. Microbiol. 2015, 69, 93–108. [Google Scholar] [CrossRef] [PubMed]
- Wei, Q.; Le Minh, P.N.; Dötsch, A.; Hildebrand, F.; Panmanee, W.; Elfarash, A.; Schulz, S.; Plaisance, S.; Charlier, D.; Hassett, D.; et al. Global Regulation of Gene Expression by OxyR in an Important Human Opportunistic Pathogen. Nucleic Acids Res. 2012, 40, 4320–4333. [Google Scholar] [CrossRef] [PubMed]
- Chiang, S.M.; Schellhorn, H.E. Regulators of Oxidative Stress Response Genes in Escherichia Coli and Their Functional Conservation in Bacteria. Arch. Biochem. Biophys. 2012, 525, 161–169. [Google Scholar] [CrossRef] [PubMed]
- Pederick, J.L.; Vandborg, B.C.; George, A.; Bovermann, H.; Boyd, J.M.; Freundlich, J.S.; Bruning, J.B. Identification of Cysteine Metabolism Regulator (CymR)-Derived Pentapeptides as Nanomolar Inhibitors of Staphylococcus Aureus O-Acetyl-l-Serine Sulfhydrylase (CysK). ACS Infect. Dis. 2025, 11, 238–248. [Google Scholar] [CrossRef] [PubMed]
- Averianova, L.A.; Balabanova, L.A.; Son, O.M.; Podvolotskaya, A.B.; Tekutyeva, L.A. Production of Vitamin B2 (Riboflavin) by Microorganisms: An Overview. Front. Bioeng. Biotechnol. 2020, 8. [Google Scholar] [CrossRef] [PubMed]
- Zhang, J.-R.; Ge, Y.-Y.; Liu, P.-H.; Wu, D.-T.; Liu, H.-Y.; Li, H.-B.; Corke, H.; Gan, R.-Y. Biotechnological Strategies of Riboflavin Biosynthesis in Microbes. Engineering 2022, 12, 115–127. [Google Scholar] [CrossRef]
- Fu, B.; Ying, J.; Chen, Q.; Zhang, Q.; Lu, J.; Zhu, Z.; Yu, P. Enhancing the Biosynthesis of Riboflavin in the Recombinant Escherichia Coli BL21 Strain by Metabolic Engineering. Front. Microbiol. 2023, 13. [Google Scholar] [CrossRef] [PubMed]
- Iwasaka, H.; Koyanagi, R.; Satoh, R.; Nagano, A.; Watanabe, K.; Hisata, K.; Satoh, N.; Aki, T. A Possible Trifunctional β-Carotene Synthase Gene Identified in the Draft Genome of Aurantiochytrium Sp. Strain KH105. Genes 2018, 9, 200. [Google Scholar] [CrossRef] [PubMed]
- Sedkova, N.; Tao, L.; Rouvière, P.E.; Cheng, Q. Diversity of Carotenoid Synthesis Gene Clusters from Environmental Enterobacteriaceae Strains. Appl. Environ. Microbiol. 2005, 71, 8141–8146. [Google Scholar] [CrossRef] [PubMed]
- Takanashi, K. Bacterial Diseases of Fruit Trees Found in Japan. Jpn. Agric. Res. Q. 1989, 22. [Google Scholar]
- Tambong, J.T. Bacterial Pathogens of Wheat: Symptoms, Distribution, Identification, and Taxonomy. In Wheat - Recent Advances; IntechOpen, 2022; ISBN 978-1-80355-523-2. [Google Scholar]
- Tripathi, A.N.; Tiwari, S.K.; Sharma, S.K.; Sharma, P.K.; Behera, T.K. Current Status of Bacterial Diseases of Vegetable Crops. Veg. Sci. 2024, 51, 106–117. [Google Scholar] [CrossRef]
- Fujikawa, T.; Hatomi, H.; Ota, N. Draft Genome Sequences of Seven Strains of Dickeya Dadantii, a Quick Decline-Causing Pathogen in Fruit Trees, Isolated in Japan. Microbiol. Resour. Announc. 2020, 9. [Google Scholar] [CrossRef]
- Manna, S.; Santander, R.D.; Zhao, Y. First Report of Pseudomonas Amygdali Pv. Morsprunorum Causing Bacterial Canker in Sweet Cherry Orchards in Washington State. Plant Dis. 2024, 108, 2560. [Google Scholar] [CrossRef]
- Das, A.J.; Sarangi, A.N.; Ravinath, R.; Talambedu, U.; Krishnareddy, P.M.; Nijalingappa, R.; Middha, S.K. Improved Species Level Bacterial Characterization from Rhizosphere Soil of Wilt Infected Punica Granatum. Sci. Rep. 2023, 13, 8653. [Google Scholar] [CrossRef] [PubMed]
- Verhaegen, M.; Bergot, T.; Liebana, E.; Stancanelli, G.; Streissl, F.; Mingeot-Leclercq, M.-P.; Mahillon, J.; Bragard, C. On the Use of Antibiotics to Control Plant Pathogenic Bacteria: A Genetic and Genomic Perspective. Front. Microbiol. 2023, 14. [Google Scholar] [CrossRef] [PubMed]
- An, X.-H.; Wang, N.; Wang, H.; Li, Y.; Si, X.-Y.; Zhao, S.; Tian, Y. Physiological and Transcriptomic Analyses of Response of Walnuts (Juglans Regia) to Pantoea Agglomerans Infection. Front. Plant Sci. 2023, 14. [Google Scholar] [CrossRef] [PubMed]
- Rai, R.; Rai, M.N. Tackling Bacterial Diseases in Crops: Current and Emerging Management Strategies. Phytopathol. Res. 2025, 7, 58. [Google Scholar] [CrossRef]
- Mansfield, J.; Genin, S.; Magori, S.; Citovsky, V.; Sriariyanum, M.; Ronald, P.; Dow, M.; Verdier, V.; Beer, S.V.; Machado, M.A.; et al. Top 10 Plant Pathogenic Bacteria in Molecular Plant Pathology. Mol. Plant Pathol. 2012, 13, 614–629. [Google Scholar] [CrossRef] [PubMed]
- Nel, W.J.; Duong, T.A.; de Beer, Z.W.; Wingfield, M.J. Black Root Rot: A Long Known but Little Understood Disease. Plant Pathol. 2019, 68, 834–842. [Google Scholar] [CrossRef]
- Martino, I.; Agustí-Brisach, C.; Nari, L.; Gullino, M.L.; Guarnaccia, V. Characterization and Pathogenicity of Fungal Species Associated with Dieback of Apple Trees in Northern Italy. Plant Dis. 2024, 108, 311–331. [Google Scholar] [CrossRef] [PubMed]
- Fang, X.; Zhang, C.; Wang, Z.; Duan, T.; Yu, B.; Jia, X.; Pang, J.; Ma, L.; Wang, Y.; Nan, Z. Co-Infection by Soil-Borne Fungal Pathogens Alters Disease Responses Among Diverse Alfalfa Varieties. Front. Microbiol. 2021, 12. [Google Scholar] [CrossRef] [PubMed]
- Pliego, C.; López-Herrera, C.; Ramos, C.; Cazorla, F.M. Developing Tools to Unravel the Biological Secrets of Rosellinia Necatrix, an Emergent Threat to Woody Crops. Mol. Plant Pathol. 2012, 13, 226–239. [Google Scholar] [CrossRef] [PubMed]
- Bollmann-Giolai, A.; Malone, J.G.; Arora, S. Diversity, Detection and Exploitation: Linking Soil Fungi and Plant Disease. Curr. Opin. Microbiol. 2022, 70, 102199. [Google Scholar] [CrossRef] [PubMed]
- van Ruijven, J.; Ampt, E.; Francioli, D.; Mommer, L. Do Soil-Borne Fungal Pathogens Mediate Plant Diversity–Productivity Relationships? Evidence and Future Opportunities. J. Ecol. 2020, 108, 1810–1821. [Google Scholar] [CrossRef]
- Berraies, S.; Walkowiak, S.; Buchwaldt, L.; Menzies, J.G. Ergot (Claviceps Spp.) of Cereals in Western Canada. Plant Health Cases 2023, 2023, phcs20230004. [Google Scholar] [CrossRef]
- Reeleder, R.D. Fungal Plant Pathogens and Soil Biodiversity. Can. J. Soil. Sci. 2003, 83, 331–336. [Google Scholar] [CrossRef]
- Kwon, S.; Kim, J.; Lee, Y.; Balaraju, K.; Jeon, Y. Identification and Characterization of Diplodia Parva and Diplodia Crataegicola Causing Black Rot of Chinese Quince. Plant Pathol. J. 2023, 39, 275–289. [Google Scholar] [CrossRef] [PubMed]
- Jiang, H.; Wu, N.; Jin, S.; Ahmed, T.; Wang, H.; Li, B.; Wu, X.; Bao, Y.; Liu, F.; Zhang, J.-Z. Identification of Rice Seed-Derived Fusarium Spp. and Development of LAMP Assay against Fusarium Fujikuroi. Pathogens 2021, 10, 1. [Google Scholar] [CrossRef] [PubMed]
- Ismagulova, E.; Oleichenko, S.; Sarshayeva, M.; Korabayeva, S.; Nizamdinova, G.; Gritsenko, D.; Suleimanova, G.; Sapakhova, Z.; Basim, H.; Kairova, G. Identification, Characterization, and Pathogenicity of Fungal and Bacterial Pathogens of Walnut (Juglans Regia L.) in Kazakhstan. Horticulturae 2025, 11, 1217. [Google Scholar] [CrossRef]
- Hegewald, H.; Wensch-Dorendorf, M.; Sieling, K.; Christen, O. Impacts of Break Crops and Crop Rotations on Oilseed Rape Productivity: A Review. Eur. J. Agron. 2018, 101, 63–77. [Google Scholar] [CrossRef]
- ElDesouki-Arafat, I.; Aldebis-Albunnai, H.K.; Vargas-Osuna, E.; Trapero, A.; López-Escudero, F.J. Lack of Evidence for Transmission of Verticillium Dahliae by the Olive Bark Beetle Phloeotribus Scarabaeoides in Olive Trees. Pathogens 2021, 10, 534. [Google Scholar] [CrossRef] [PubMed]
- Aranda, C.; Méndez, I.; Barra, P.J.; Hernández-Montiel, L.; Fallard, A.; Tortella, G.; Briones, E.; Durán, P. Melanin Induction Restores the Pathogenicity of Gaeumannomyces Graminis Var. Tritici in Wheat Plants. J. Fungi 2023, 9, 350. [Google Scholar] [CrossRef] [PubMed]
- Belair, M.; Pensec, F.; Jany, J.-L.; Le Floch, G.; Picot, A. Profiling Walnut Fungal Pathobiome Associated with Walnut Dieback Using Community-Targeted DNA Metabarcoding. Plants 2023, 12, 2383. [Google Scholar] [CrossRef] [PubMed]
- Savas, N.G. The Control of Soil-Borne Fungal Pathogens in Grapevine Nurseries in Türkiye and Their Impact on Sapling Quality. Plant Prot. Sci. 2024, 60, 241–257. [Google Scholar] [CrossRef]
- Jakobija, I.; Bankina, B.; Klūga, A.; Roga, A.; Skinderskis, E.; Fridmanis, D. The Diversity of Fungi Involved in Damage to Japanese Quince. Plants 2022, 11, 2572. [Google Scholar] [CrossRef] [PubMed]
- Czarnecka, D.; Czubacka, A.; Agacka-Mołdoch, M.; Trojak-Goluch, A.; Księżak, J. The Occurrence of Fungal Diseases in Maize in Organic Farming Versus an Integrated Management System. Agronomy 2022, 12, 558. [Google Scholar] [CrossRef]
- Du, S.; Trivedi, P.; Wei, Z.; Feng, J.; Hu, H.-W.; Bi, L.; Huang, Q.; Liu, Y.-R. The Proportion of Soil-Borne Fungal Pathogens Increases with Elevated Organic Carbon in Agricultural Soils. mSystems 2022, 7, e01337-21. [Google Scholar] [CrossRef] [PubMed]
- Dean, R.; Van Kan, J. a. L.; Pretorius, Z.A.; Hammond-Kosack, K.E.; Di Pietro, A.; Spanu, P.D.; Rudd, J.J.; Dickman, M.; Kahmann, R.; Ellis, J.; et al. The Top 10 Fungal Pathogens in Molecular Plant Pathology. Mol. Plant Pathol. 2012, 13, 414–430. [Google Scholar] [CrossRef] [PubMed]
- Karki, K.; Coolong, T.; Kousik, C.; Petkar, A.; Myers, B.K.; Hajihassani, A.; Mandal, M.; Dutta, B. The Transcriptomic Profile of Watermelon Is Affected by Zinc in the Presence of Fusarium Oxysporum f. Sp. Niveum and Meloidogyne Incognita. Pathogens 2021, 10, 796. [Google Scholar] [CrossRef] [PubMed]
- Gashi, N.; Mikolás, M.; Dávid, P.; Fauszt, P.; Gál, F.; Stündl, L.; Remenyik, J.; Paholcsek, M. Trends in Global Soil Research and a Microbiome-Based Framework for Soil Health Assessment. Agronomy 2026, 16, 1154. [Google Scholar] [CrossRef]
- Fierer, N.; Schimel, J.P.; Holden, P.A. Variations in Microbial Community Composition through Two Soil Depth Profiles. Soil Biol. Biochem. 2003, 35, 167–176. [Google Scholar] [CrossRef]
- Naylor, D.; McClure, R.; Jansson, J. Trends in Microbial Community Composition and Function by Soil Depth. Microorganisms 2022, 10, 540. [Google Scholar] [CrossRef] [PubMed]
- Li, Y.; Ge, Y.; Wang, J.; Shen, C.; Wang, J.; Liu, Y.-J. Functional Redundancy and Specific Taxa Modulate the Contribution of Prokaryotic Diversity and Composition to Multifunctionality. Mol. Ecol. 2021, 30, 2915–2930. [Google Scholar] [CrossRef] [PubMed]
- Sommermann, L.; Geistlinger, J.; Wibberg, D.; Deubel, A.; Zwanzig, J.; Babin, D.; Schlüter, A.; Schellenberg, I. Fungal Community Profiles in Agricultural Soils of a Long-Term Field Trial under Different Tillage, Fertilization and Crop Rotation Conditions Analyzed by High-Throughput ITS-Amplicon Sequencing. PLoS ONE 2018, 13, e0195345. [Google Scholar] [CrossRef] [PubMed]
- Fang, D.; Chen, D.; Zhang, J.; Wang, C.; Dou, S.; Luo, W.; Zhu, Y.; Zhou, W.; Wang, S. Land-Use Types Shape Soil Bacterial Communities, Co-Occurrence Networks, and Predicted Functions in Karst Ecosystems. Sci. Rep. 2026, 16, 12682. [Google Scholar] [CrossRef] [PubMed]
- Fellbaum, C.R.; Mensah, J.A.; Pfeffer, P.E.; Kiers, E.T.; Bücking, H. The Role of Carbon in Fungal Nutrient Uptake and Transport: Implications for Resource Exchange in the Arbuscular Mycorrhizal Symbiosis. Plant Signal. Behav. 2012, 7, 1509–1512. [Google Scholar] [CrossRef] [PubMed]
- Chen, Y.-J.; Leung, P.M.; Wood, J.L.; Bay, S.K.; Hugenholtz, P.; Kessler, A.J.; Shelley, G.; Waite, D.W.; Franks, A.E.; Cook, P.L.M.; et al. Metabolic Flexibility Allows Bacterial Habitat Generalists to Become Dominant in a Frequently Disturbed Ecosystem. ISME J. 2021, 15, 2986–3004. [Google Scholar] [CrossRef] [PubMed]
- Ding, J.; Yu, S. Impacts of Land Use on Soil Nitrogen-Cycling Microbial Communities: Insights from Community Structure, Functional Gene Abundance, and Network Complexity. Life 2025, 15, 466. [Google Scholar] [CrossRef] [PubMed]
- Huang, G.; Rong, Y.; Song, C.; Huang, S.; Huang, X.; Guan, Z.; Ma, T. Influence of Land-Use Types on Soil Microbial Communities and Nutrient Changes in Xinyang City, China. Sci. Rep. 2026, 16, 7564. [Google Scholar] [CrossRef] [PubMed]
- Liu, G.; Bai, Z.; Cui, G.; He, W.; Kongling, Z.; Ji, G.; Gong, H.; Li, D. Effects of Land Use on the Soil Microbial Community in the Songnen Grassland of Northeast China. Front. Microbiol. 2022, 13. [Google Scholar] [CrossRef] [PubMed]
- Glassman, S.I.; Weihe, C.; Li, J.; Albright, M.B.N.; Looby, C.I.; Martiny, A.C.; Treseder, K.K.; Allison, S.D.; Martiny, J.B.H. Decomposition Responses to Climate Depend on Microbial Community Composition. Proc. Natl. Acad. Sci. 2018, 115, 11994–11999. [Google Scholar] [CrossRef] [PubMed]
- Gschwend, F.; Hartmann, M.; Hug, A.-S.; Enkerli, J.; Gubler, A.; Frey, B.; Meuli, R.G.; Widmer, F. Long-Term Stability of Soil Bacterial and Fungal Community Structures Revealed in Their Abundant and Rare Fractions. Mol. Ecol. 2021, 30, 4305–4320. [Google Scholar] [CrossRef] [PubMed]
- Romdhane, S.; Spor, A.; Banerjee, S.; Breuil, M.-C.; Bru, D.; Chabbi, A.; Hallin, S.; van der Heijden, M.G.A.; Saghai, A.; Philippot, L. Land-Use Intensification Differentially Affects Bacterial, Fungal and Protist Communities and Decreases Microbiome Network Complexity. Environ. Microbiome 2022, 17, 1. [Google Scholar] [CrossRef] [PubMed]
- Guseva, K.; Darcy, S.; Simon, E.; Alteio, L.V.; Montesinos-Navarro, A.; Kaiser, C. From Diversity to Complexity: Microbial Networks in Soils. Soil Biol. Biochem. 2022, 169, 108604. [Google Scholar] [CrossRef] [PubMed]
- Pett-Ridge, J.; Firestone, M.K. Redox Fluctuation Structures Microbial Communities in a Wet Tropical Soil. Appl. Environ. Microbiol. 2005, 71, 6998–7007. [Google Scholar] [CrossRef] [PubMed]
- Huang, W.; Kuzyakov, Y.; Niu, S.; Luo, Y.; Sun, B.; Zhang, J.; Liang, Y. Drivers of Microbially and Plant-Derived Carbon in Topsoil and Subsoil. Glob. Change Biol. 2023, 29, 6188–6200. [Google Scholar] [CrossRef]
- Li, X.; Chen, D.; Carrión, V.J.; Revillini, D.; Yin, S.; Dong, Y.; Zhang, T.; Wang, X.; Delgado-Baquerizo, M. Acidification Suppresses the Natural Capacity of Soil Microbiome to Fight Pathogenic Fusarium Infections. Nat. Commun. 2023, 14, 5090. [Google Scholar] [CrossRef] [PubMed]
- Schaeffer, R.N.; Pfeiffer, V.W.; Basu, S.; Brousil, M.; Strohm, C.; DuPont, S.T.; Vannette, R.L.; Crowder, D.W. Orchard Management and Landscape Context Mediate the Pear Floral Microbiome. Appl. Environ. Microbiol. 2021, 87, e00048-21. [Google Scholar] [CrossRef] [PubMed]
Figure 1.
Spatial distribution and variation of soil physicochemical properties across six land-use based on topsoil samples (0–30 cm). Panel (a) shows the sampling locations. Panels (b–i) present spatial distribution maps and boxplots for pH (KCl), Arany plasticity index, water-stable soil structure (WSS), CaCO₃, humus, available P₂O₅, available K₂O, and nitrate content. In the spatial distribution maps, each sampling point is represented by a color-coded dot, with color intensity corresponding to the measured value of the respective soil property. Boxplots display median, interquartile range, and individual observations. Overall differences among land-use systems were evaluated using the Kruskal–Wallis test, and significant pairwise comparisons identified by Dunn’s test are indicated on the plots.
Figure 1.
Spatial distribution and variation of soil physicochemical properties across six land-use based on topsoil samples (0–30 cm). Panel (a) shows the sampling locations. Panels (b–i) present spatial distribution maps and boxplots for pH (KCl), Arany plasticity index, water-stable soil structure (WSS), CaCO₃, humus, available P₂O₅, available K₂O, and nitrate content. In the spatial distribution maps, each sampling point is represented by a color-coded dot, with color intensity corresponding to the measured value of the respective soil property. Boxplots display median, interquartile range, and individual observations. Overall differences among land-use systems were evaluated using the Kruskal–Wallis test, and significant pairwise comparisons identified by Dunn’s test are indicated on the plots.
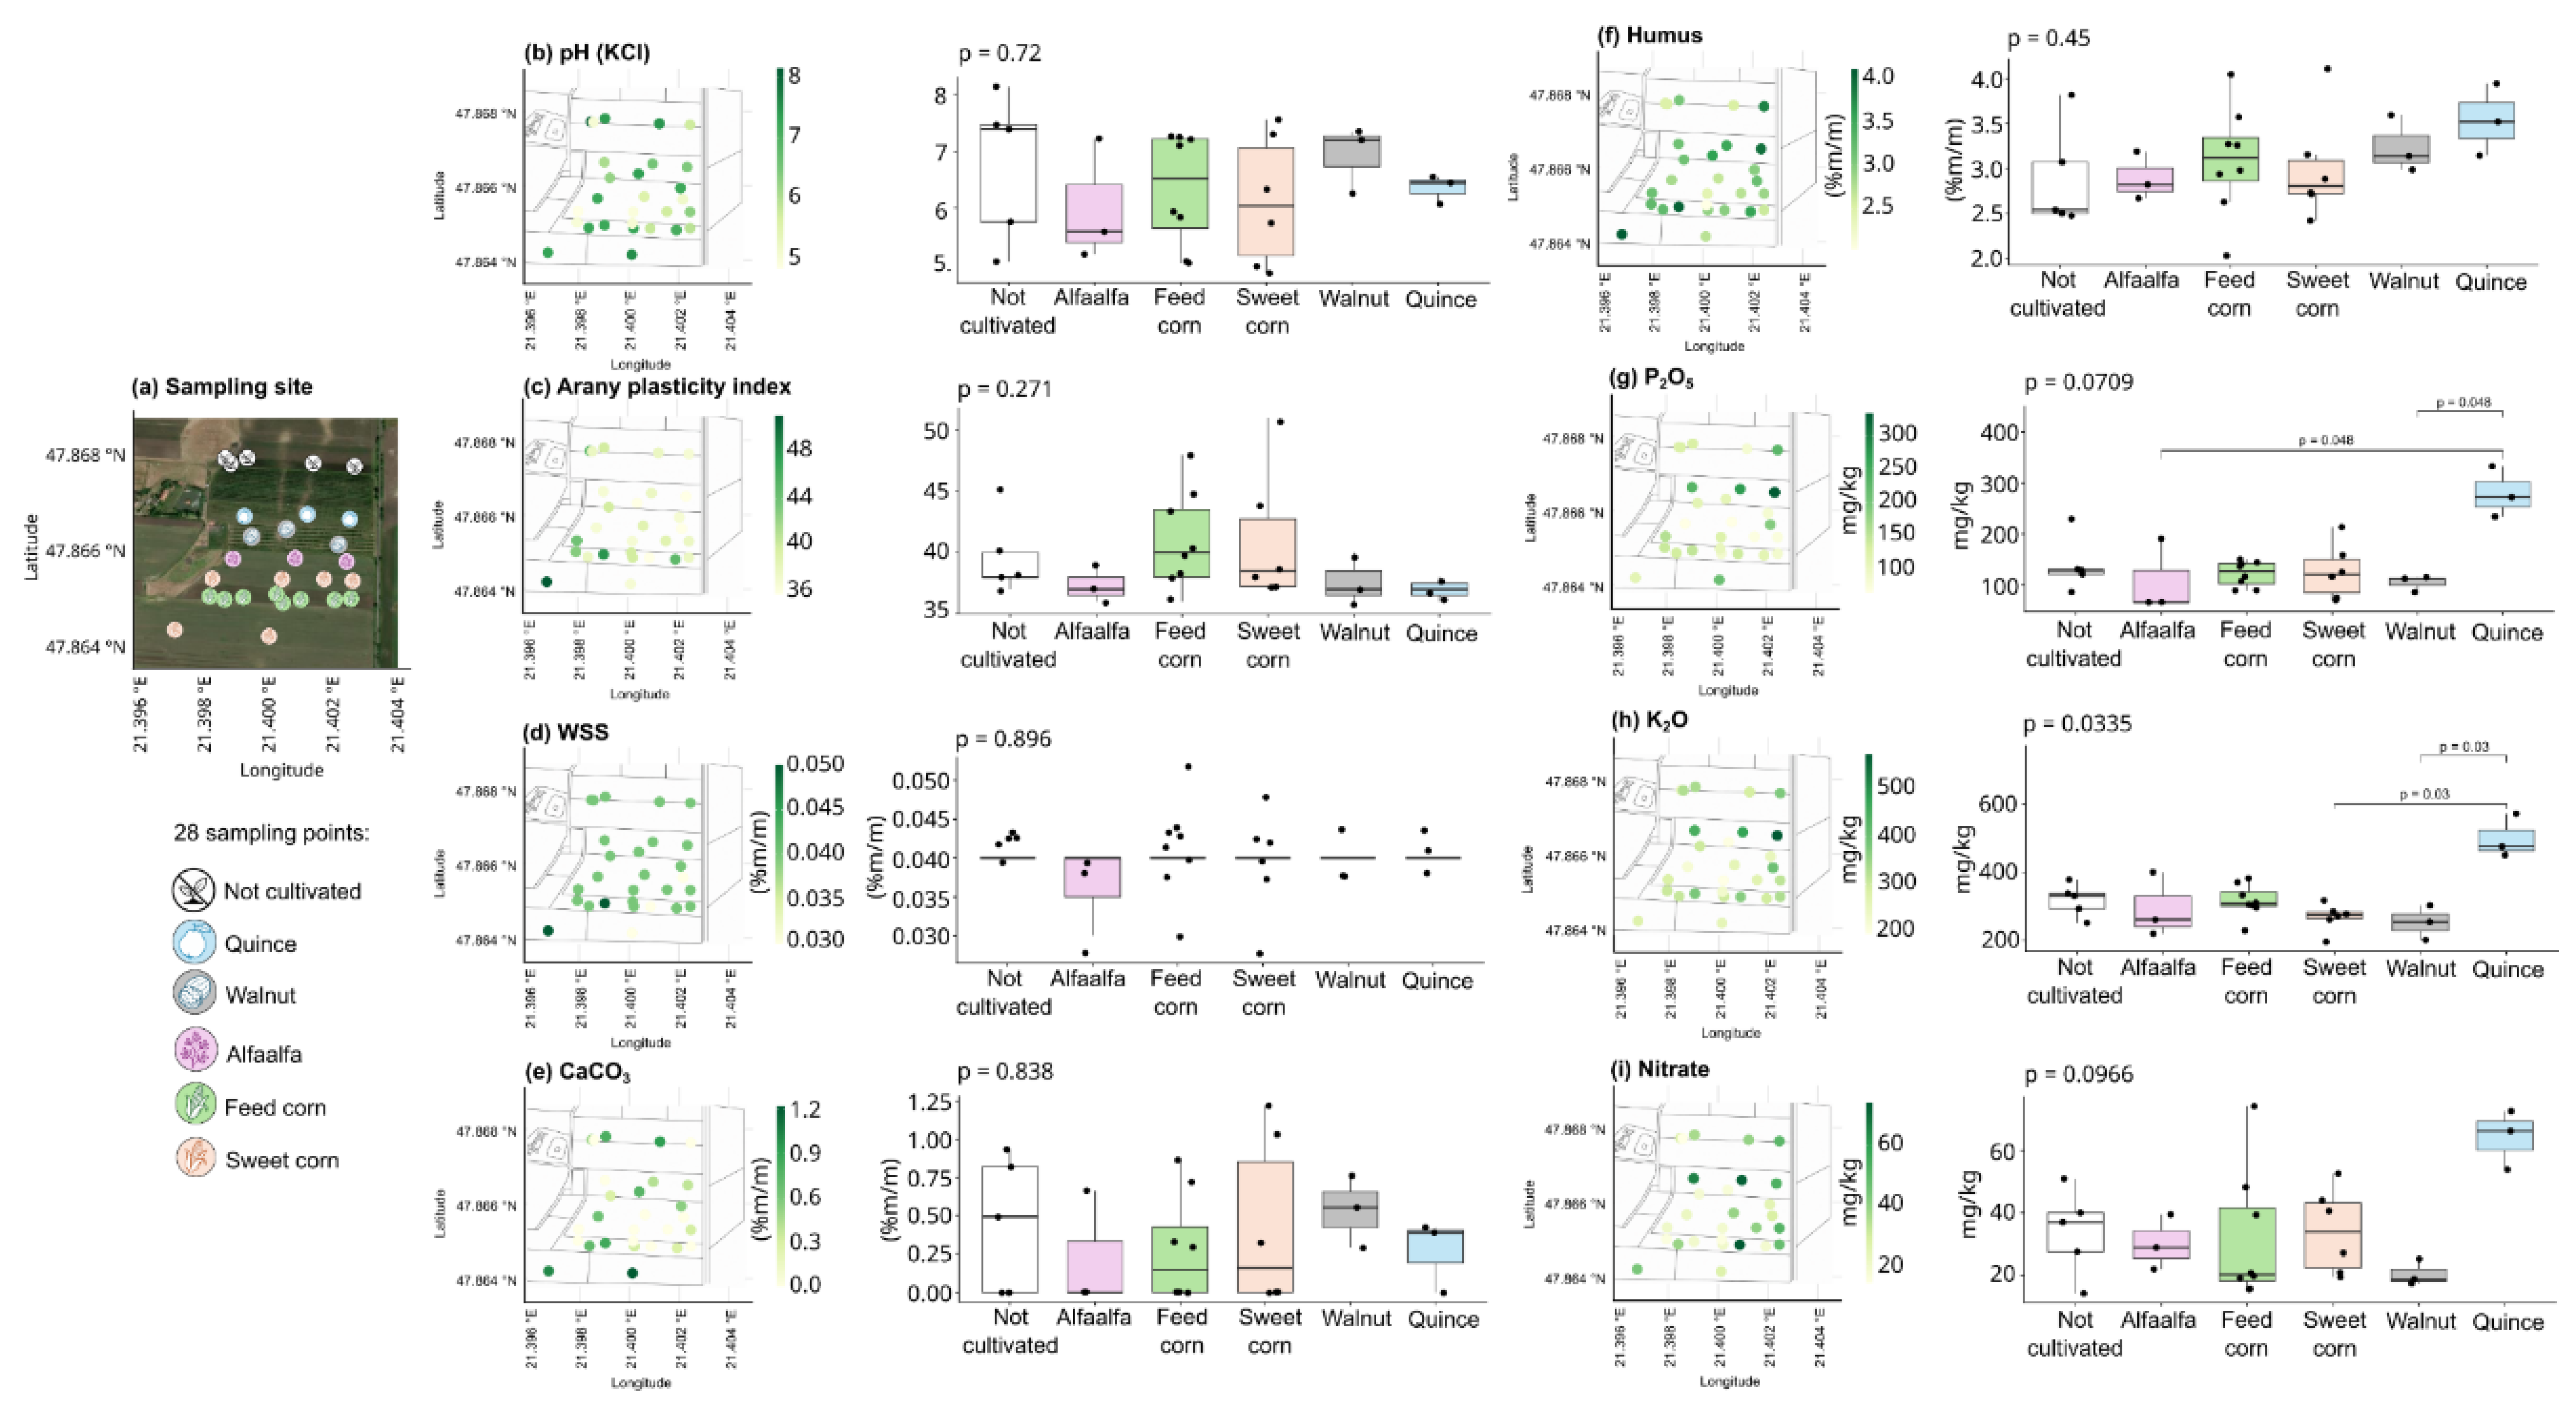
Figure 2.
Alpha diversity of soil microbial communities assessed using the Chao1 richness index across different environmental and management factors. Panels show comparisons among crop types in the 0–30 cm soil layer (a), soil depths (b), soil fertility levels (c), and plant systems (d). Boxplots represent the median, interquartile range, and distribution of observations, while points indicate individual samples. Crop-type and plant-system analyses were performed using only topsoil samples (0–30 cm), whereas soil-depth and soil-fertility-level comparisons included all available samples. Statistical significance was evaluated using Kruskal–Wallis tests for multiple-group comparisons and Wilcoxon rank-sum tests for two-group comparisons. Panel (e) presents Spearman correlation coefficients (ρ) between soil physicochemical properties and Chao1 richness. Bubble size is proportional to the absolute correlation coefficient (|ρ|), while color indicates the direction and magnitude of the relationship. Significant correlations are indicated by asterisks (* p ≤ 0.05).
Figure 2.
Alpha diversity of soil microbial communities assessed using the Chao1 richness index across different environmental and management factors. Panels show comparisons among crop types in the 0–30 cm soil layer (a), soil depths (b), soil fertility levels (c), and plant systems (d). Boxplots represent the median, interquartile range, and distribution of observations, while points indicate individual samples. Crop-type and plant-system analyses were performed using only topsoil samples (0–30 cm), whereas soil-depth and soil-fertility-level comparisons included all available samples. Statistical significance was evaluated using Kruskal–Wallis tests for multiple-group comparisons and Wilcoxon rank-sum tests for two-group comparisons. Panel (e) presents Spearman correlation coefficients (ρ) between soil physicochemical properties and Chao1 richness. Bubble size is proportional to the absolute correlation coefficient (|ρ|), while color indicates the direction and magnitude of the relationship. Significant correlations are indicated by asterisks (* p ≤ 0.05).
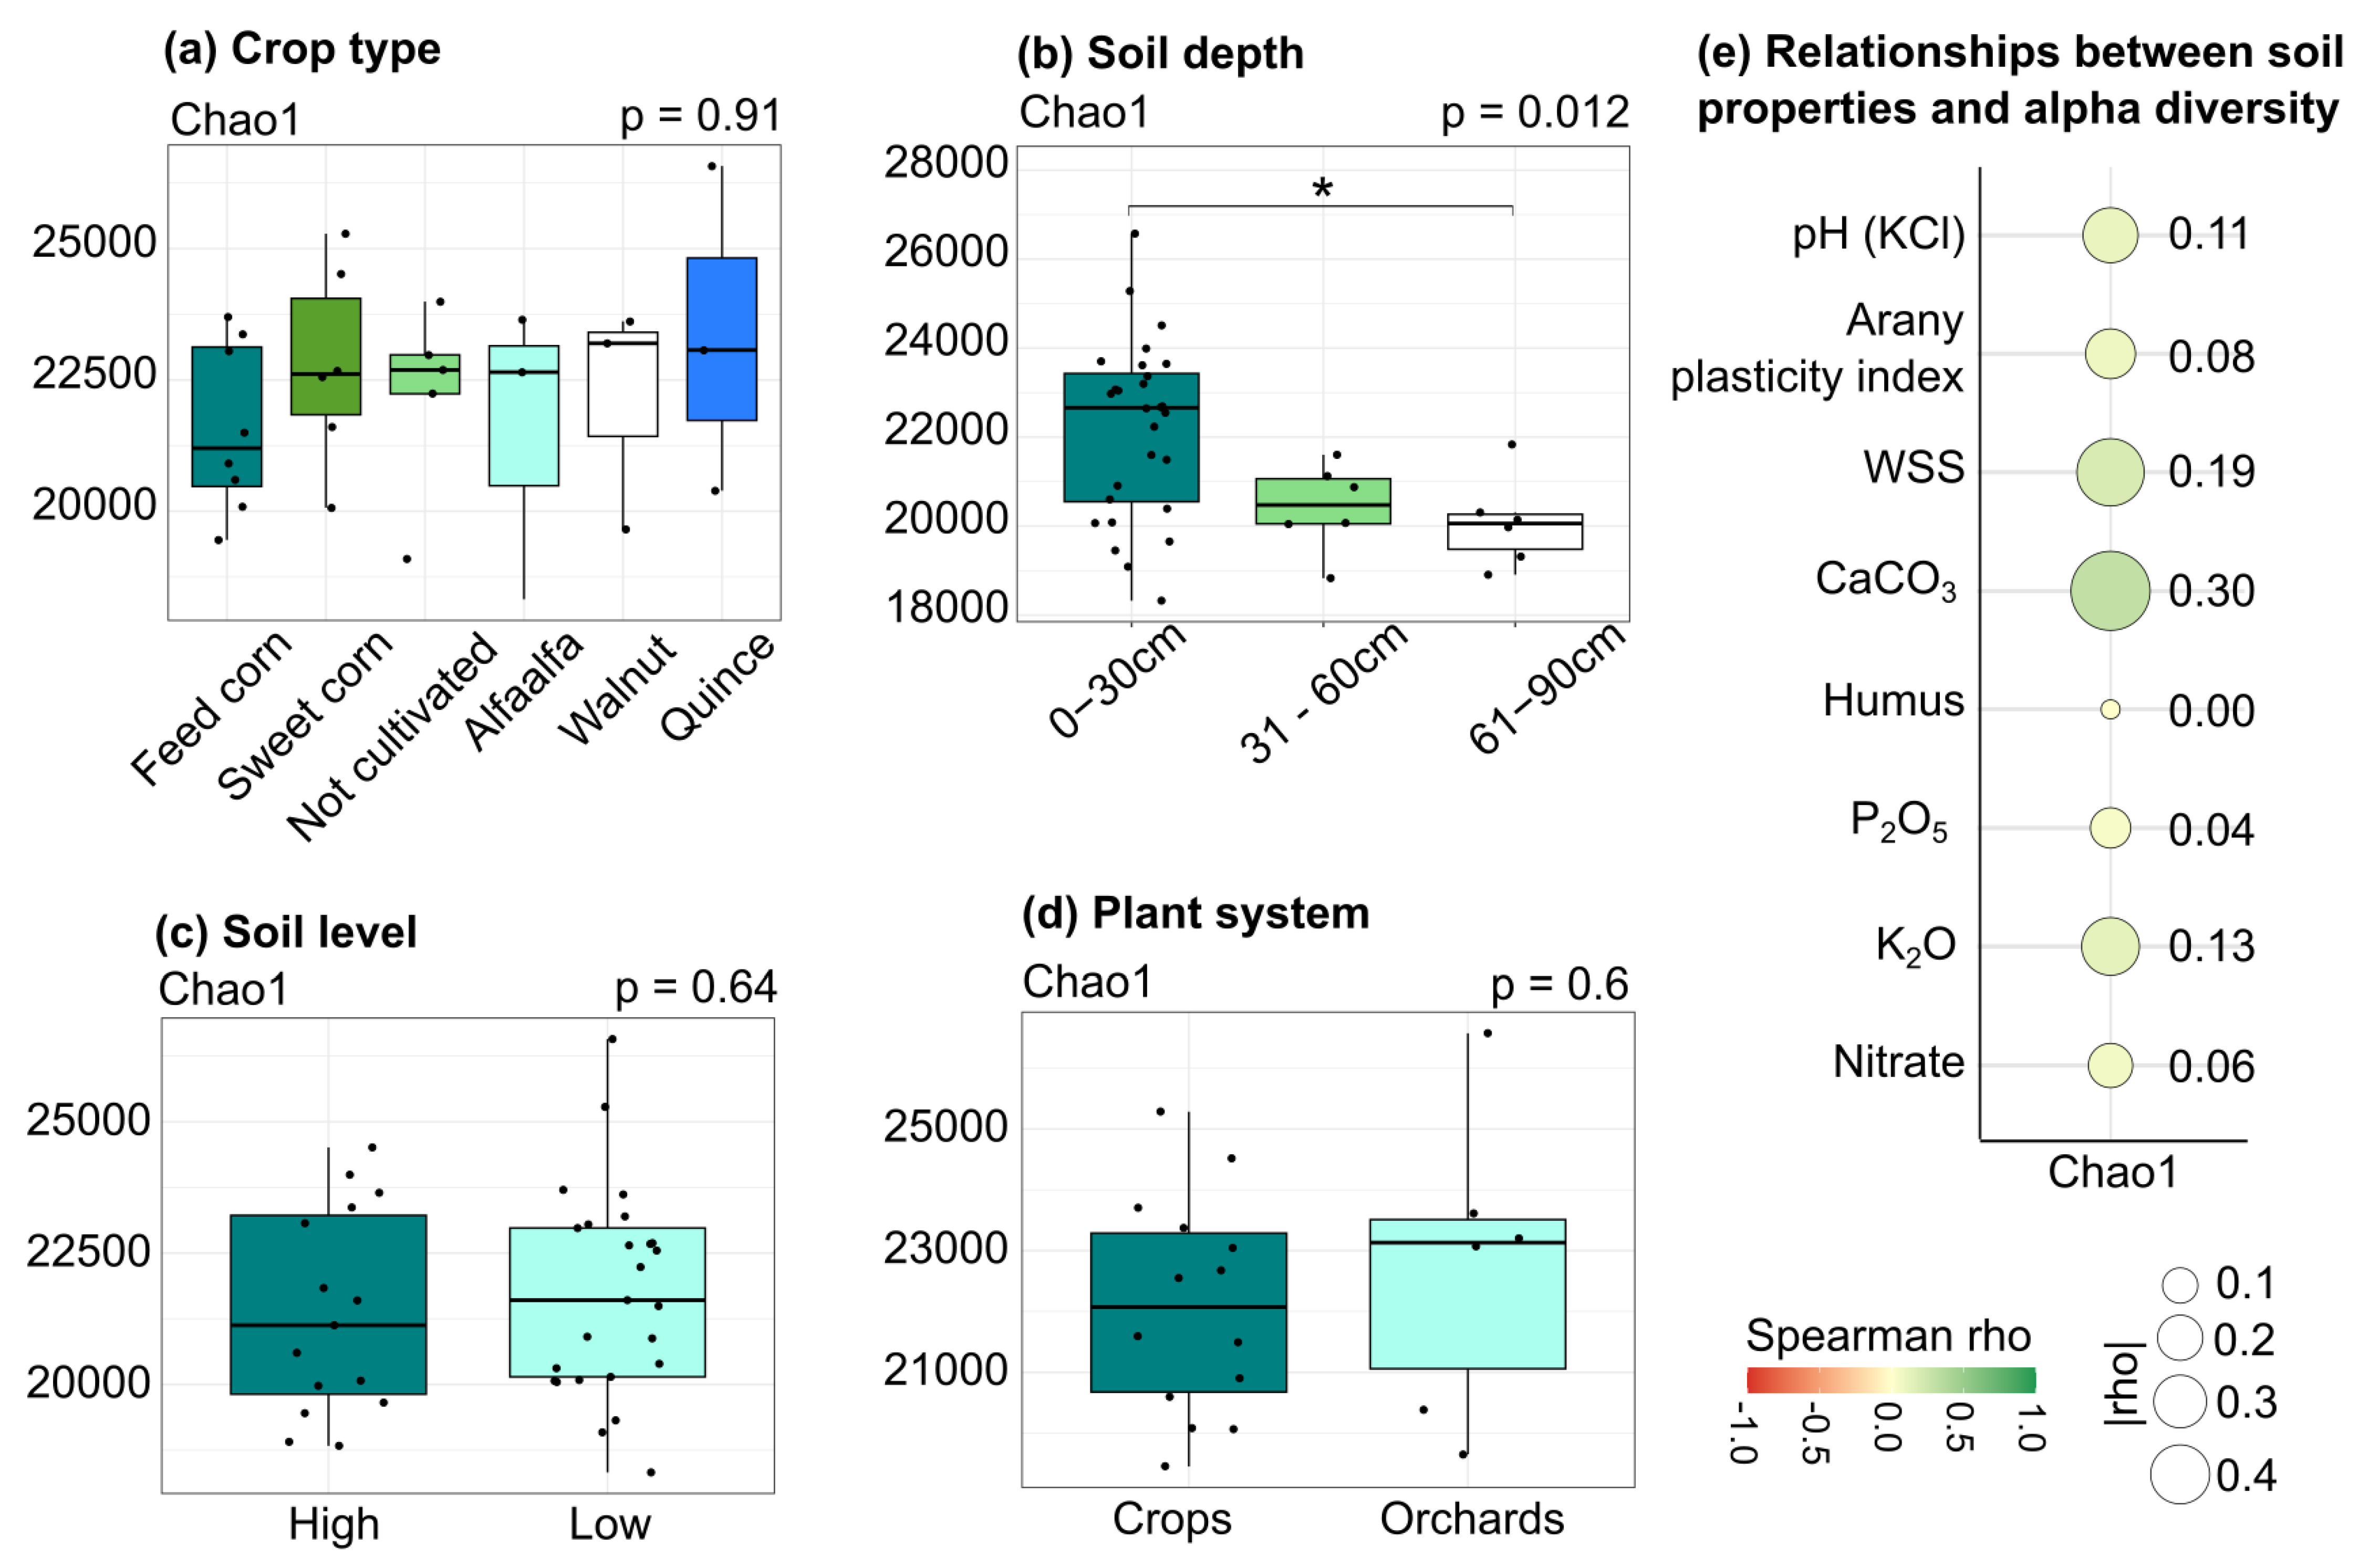
Figure 3.
Non-metric multidimensional scaling (NMDS) ordination based on Bray–Curtis dissimilarities calculated from bacterial and fungal species-level abundance profiles. Panel (a) shows microbial community variation among crop types using samples collected from the 0–30 cm soil layer only. Panel (b) illustrates differences among soil depths, panel (c) compares soil fertility levels, and panel (d) compares plant systems (crop fields versus orchards) using samples from the 0–30 cm layer. Ellipses represent 95% confidence intervals around group centroids.
Figure 3.
Non-metric multidimensional scaling (NMDS) ordination based on Bray–Curtis dissimilarities calculated from bacterial and fungal species-level abundance profiles. Panel (a) shows microbial community variation among crop types using samples collected from the 0–30 cm soil layer only. Panel (b) illustrates differences among soil depths, panel (c) compares soil fertility levels, and panel (d) compares plant systems (crop fields versus orchards) using samples from the 0–30 cm layer. Ellipses represent 95% confidence intervals around group centroids.
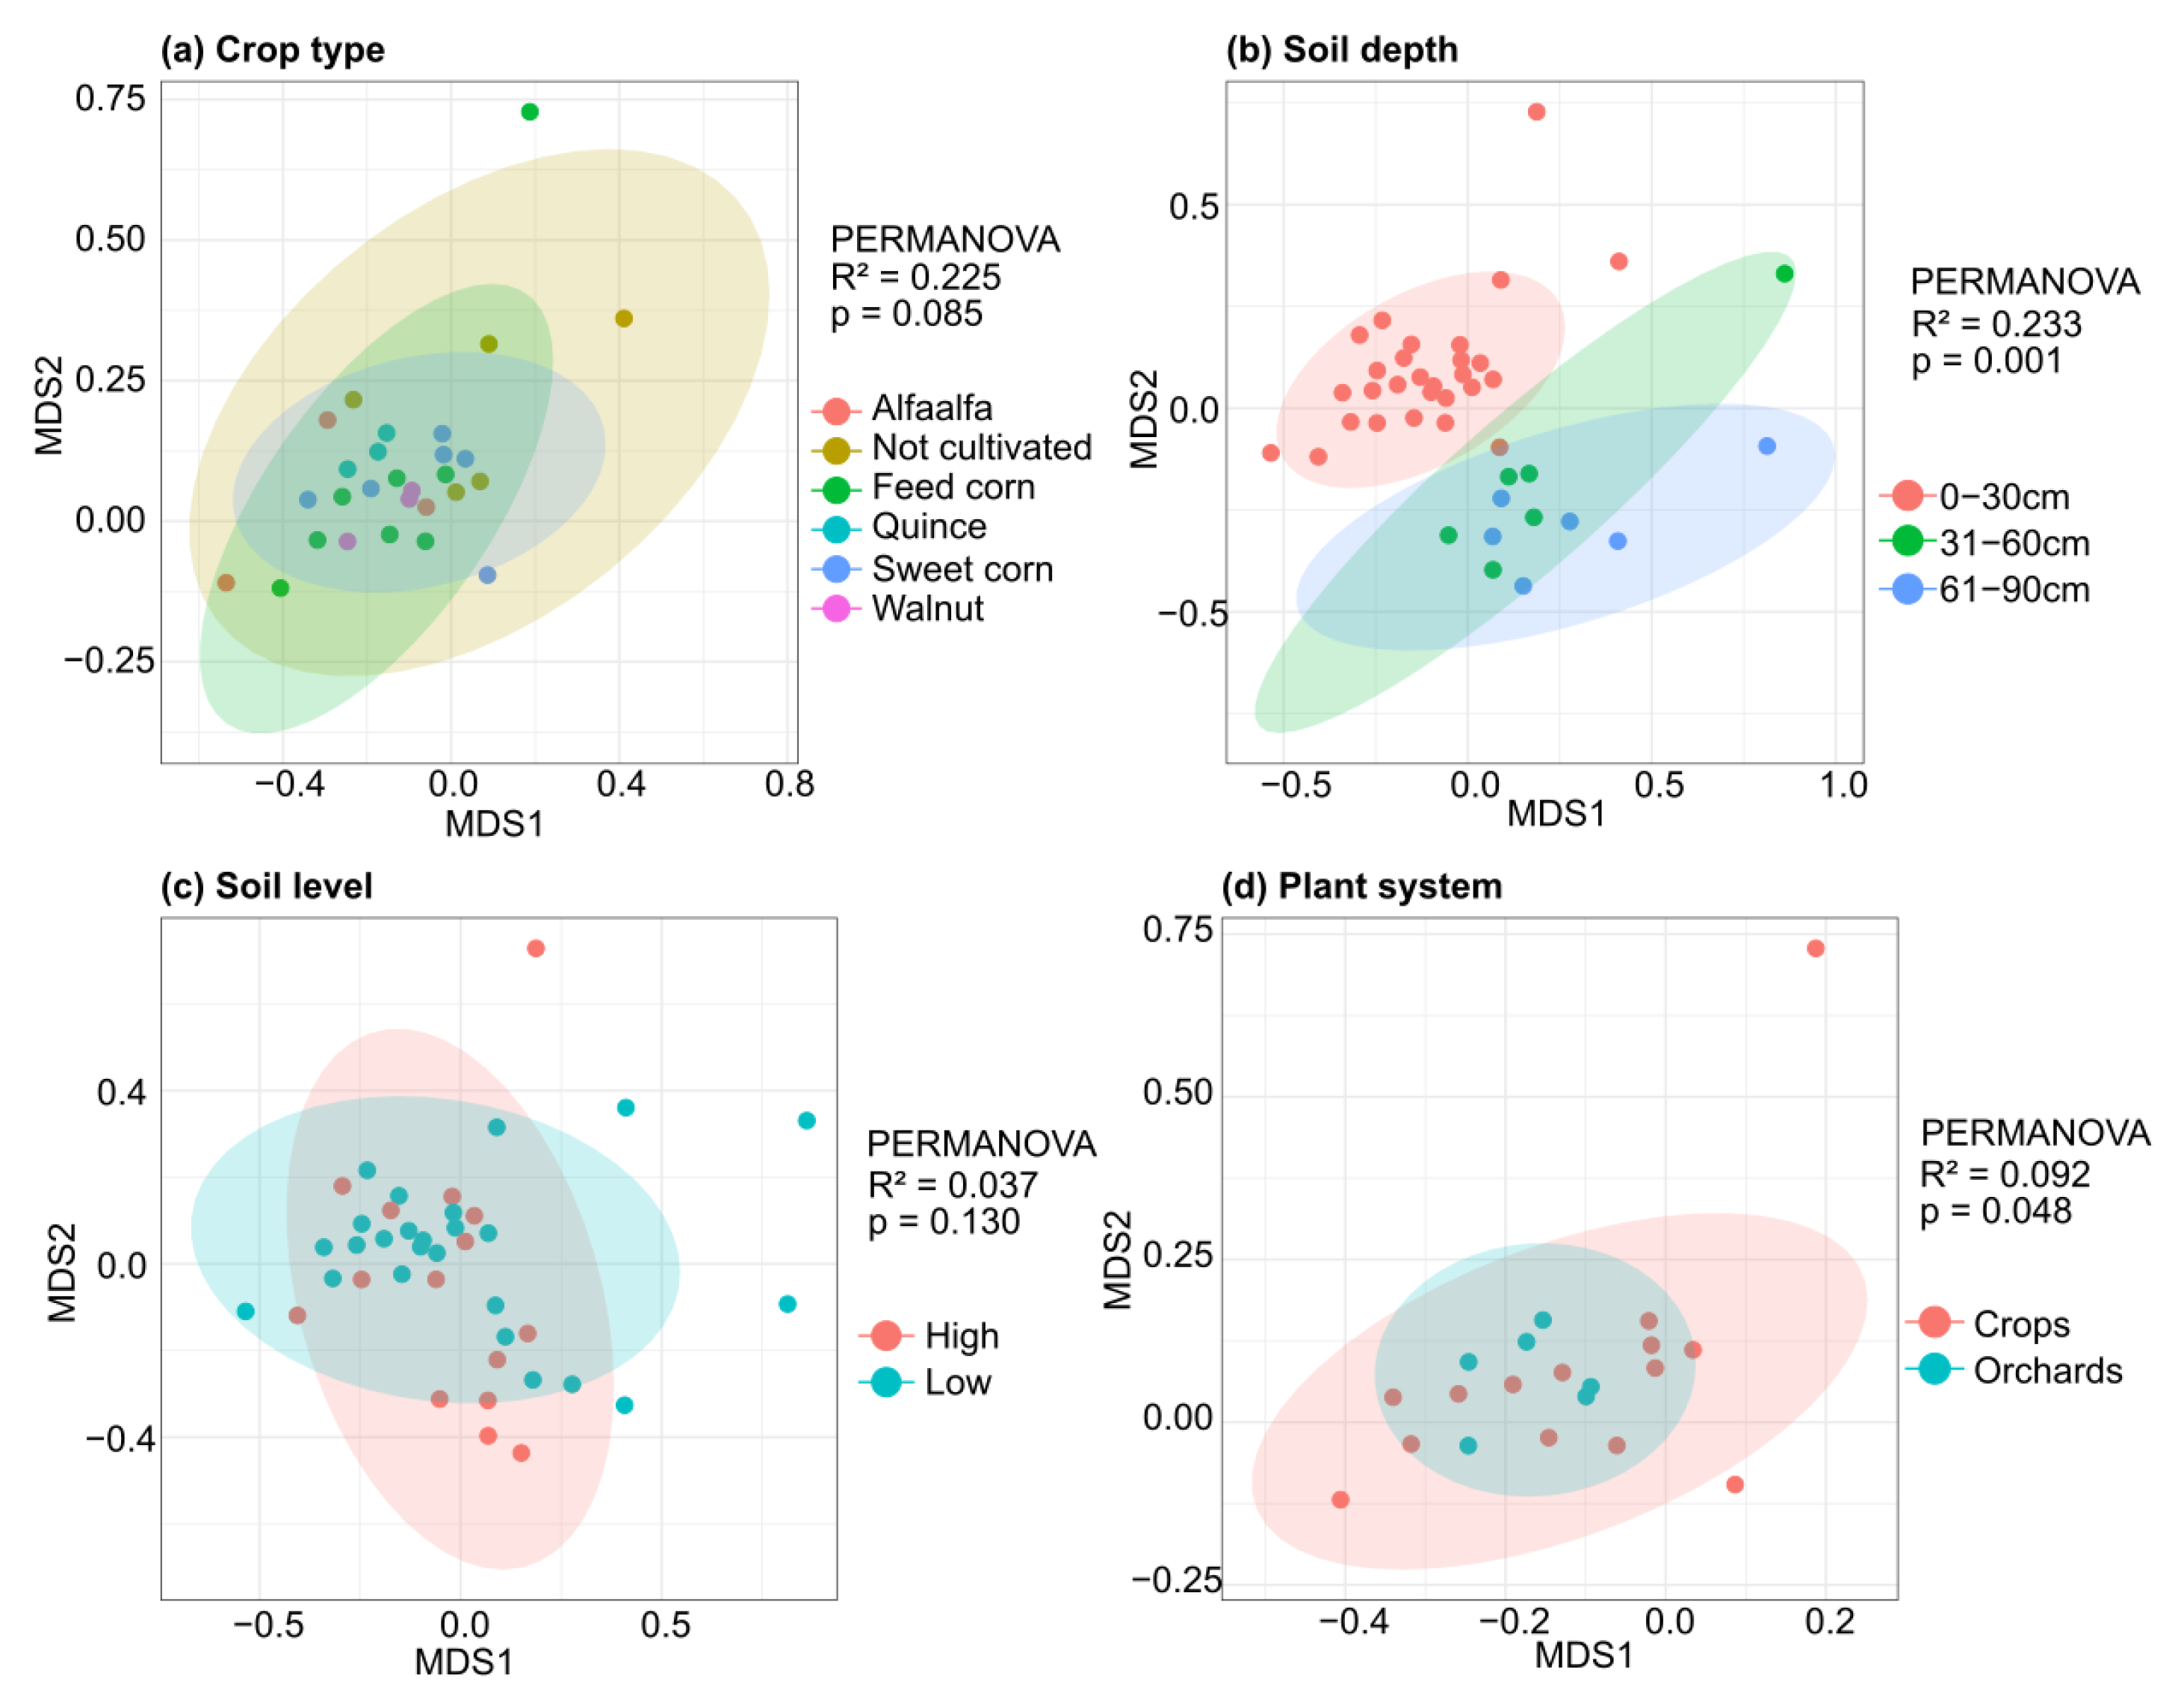
Figure 4.
Community structure of bacterial and fungal assemblages across four land-use systems (alfalfa, not cultivated land, crops, and orchards) in topsoil samples (0–30 cm depth). Panels (a) and (b) show coverage-based analyses, including Venn diagrams of shared and unique bacterial and fungal species among land-use systems. Panels (c) and (d) present NMDS ordinations based on Bray–Curtis dissimilarities calculated from species abundance data for bacterial and fungal communities, respectively. Ellipses indicate group dispersion and PERMANOVA statistics are reported within each panel. Panels (e) and (f) display heatmaps of the ten most abundant bacterial and fungal species shared among all land-use systems, selected by ranking species according to their mean abundance across all samples. For the shared-community heatmaps, the minimum mean abundance of the selected Top 10 species was 307.93 for bacteria and 54.28 for fungi. Colors represent mean log10-transformed abundance values. Panels (g) and (h) show the ten most abundant unique bacterial and fungal species detected exclusively within each land-use system, selected according to their mean abundance within the corresponding land-use system. Bar lengths represent mean species abundance.
Figure 4.
Community structure of bacterial and fungal assemblages across four land-use systems (alfalfa, not cultivated land, crops, and orchards) in topsoil samples (0–30 cm depth). Panels (a) and (b) show coverage-based analyses, including Venn diagrams of shared and unique bacterial and fungal species among land-use systems. Panels (c) and (d) present NMDS ordinations based on Bray–Curtis dissimilarities calculated from species abundance data for bacterial and fungal communities, respectively. Ellipses indicate group dispersion and PERMANOVA statistics are reported within each panel. Panels (e) and (f) display heatmaps of the ten most abundant bacterial and fungal species shared among all land-use systems, selected by ranking species according to their mean abundance across all samples. For the shared-community heatmaps, the minimum mean abundance of the selected Top 10 species was 307.93 for bacteria and 54.28 for fungi. Colors represent mean log10-transformed abundance values. Panels (g) and (h) show the ten most abundant unique bacterial and fungal species detected exclusively within each land-use system, selected according to their mean abundance within the corresponding land-use system. Bar lengths represent mean species abundance.
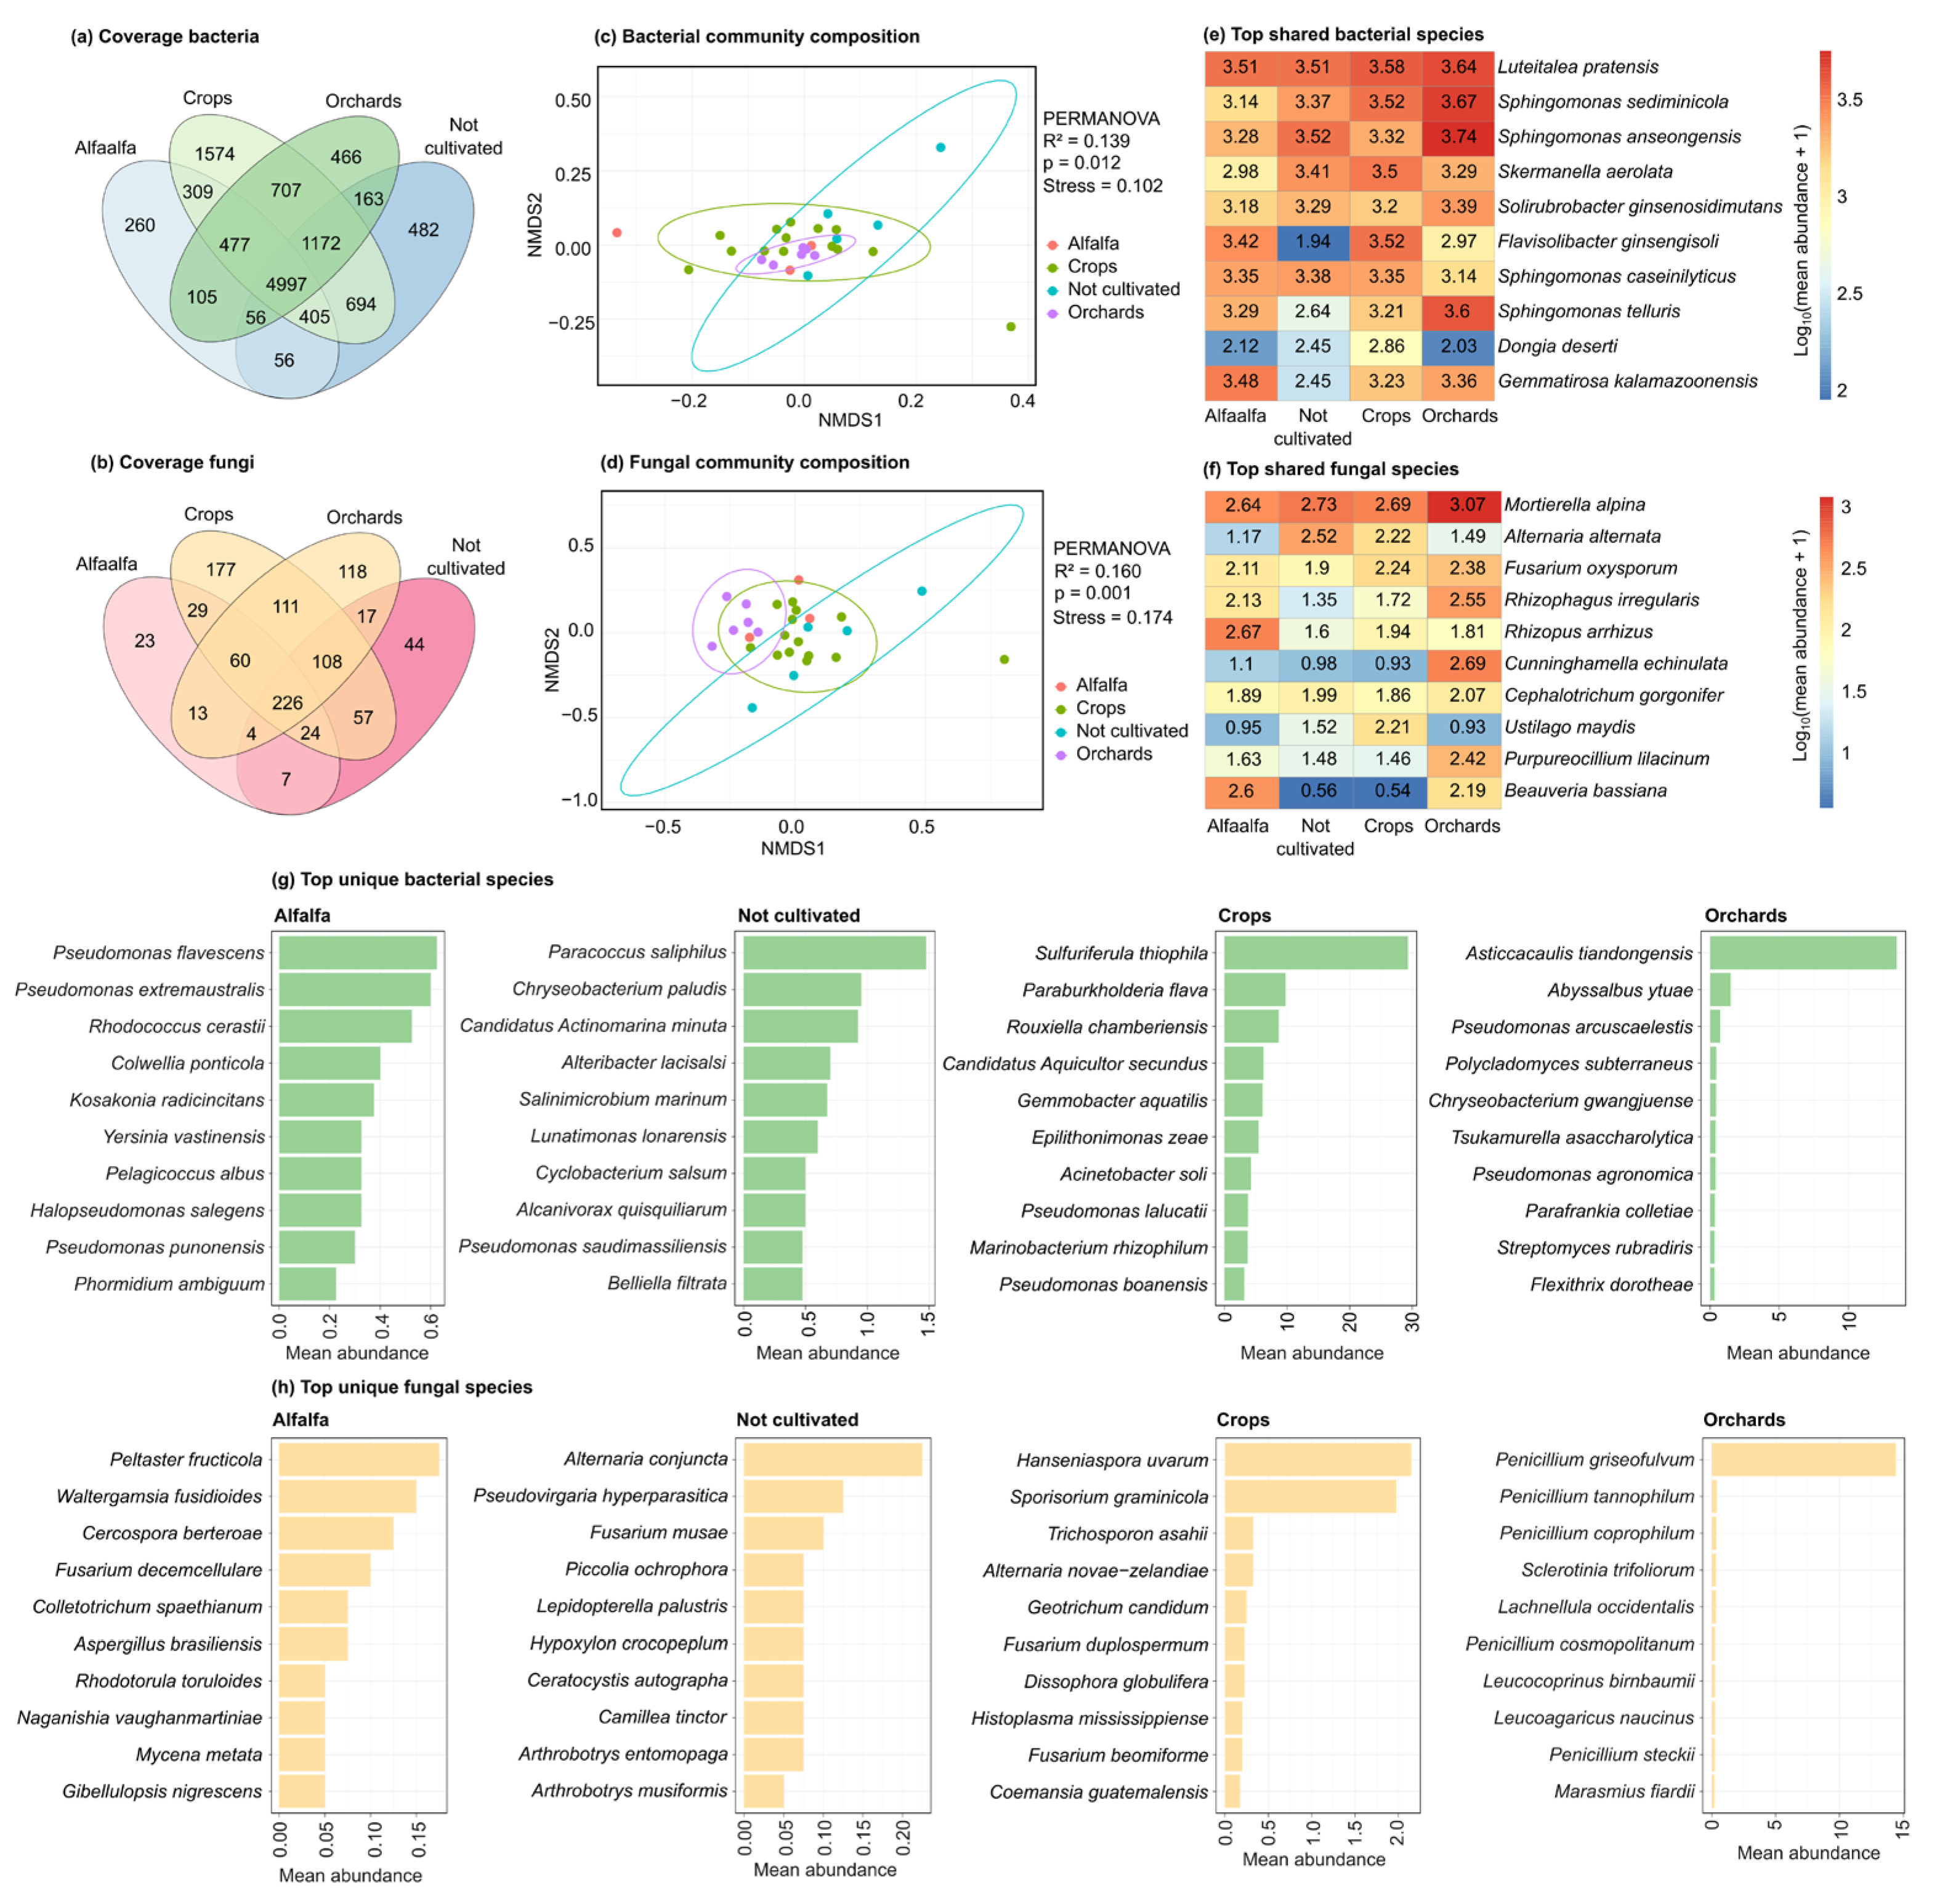
Figure 5.
Dominance structure and community evenness of bacterial and fungal assemblages across land-use systems based on species-level communities from topsoil samples (0–30 cm depth). Panels (a) and (b) show the contribution of above-average and below-average taxa to total bacterial and fungal abundance, respectively, whereas panels (c) and (d) present the corresponding contribution to species coverage. Taxa were classified as above-average or below-average according to treatment-specific mean relative abundance thresholds. Panels (e) and (f) display Pielou’s evenness values for overall bacterial and fungal communities, respectively. Panels (g) and (h) show ridge-density distributions of Pielou’s evenness for above-average and below-average taxa. Numbers within the circular plots correspond to land-use systems: 1 = Not cultivated, 2 = Alfalfa, 3 = Crops, 4 = Feed corn, 5 = Sweet corn, 6 = Orchards, 7 = Quince, and 8 = Walnut. Differences among groups were evaluated using Kruskal–Wallis tests followed by Dunn’s post hoc comparisons with Benjamini–Hochberg correction.
Figure 5.
Dominance structure and community evenness of bacterial and fungal assemblages across land-use systems based on species-level communities from topsoil samples (0–30 cm depth). Panels (a) and (b) show the contribution of above-average and below-average taxa to total bacterial and fungal abundance, respectively, whereas panels (c) and (d) present the corresponding contribution to species coverage. Taxa were classified as above-average or below-average according to treatment-specific mean relative abundance thresholds. Panels (e) and (f) display Pielou’s evenness values for overall bacterial and fungal communities, respectively. Panels (g) and (h) show ridge-density distributions of Pielou’s evenness for above-average and below-average taxa. Numbers within the circular plots correspond to land-use systems: 1 = Not cultivated, 2 = Alfalfa, 3 = Crops, 4 = Feed corn, 5 = Sweet corn, 6 = Orchards, 7 = Quince, and 8 = Walnut. Differences among groups were evaluated using Kruskal–Wallis tests followed by Dunn’s post hoc comparisons with Benjamini–Hochberg correction.
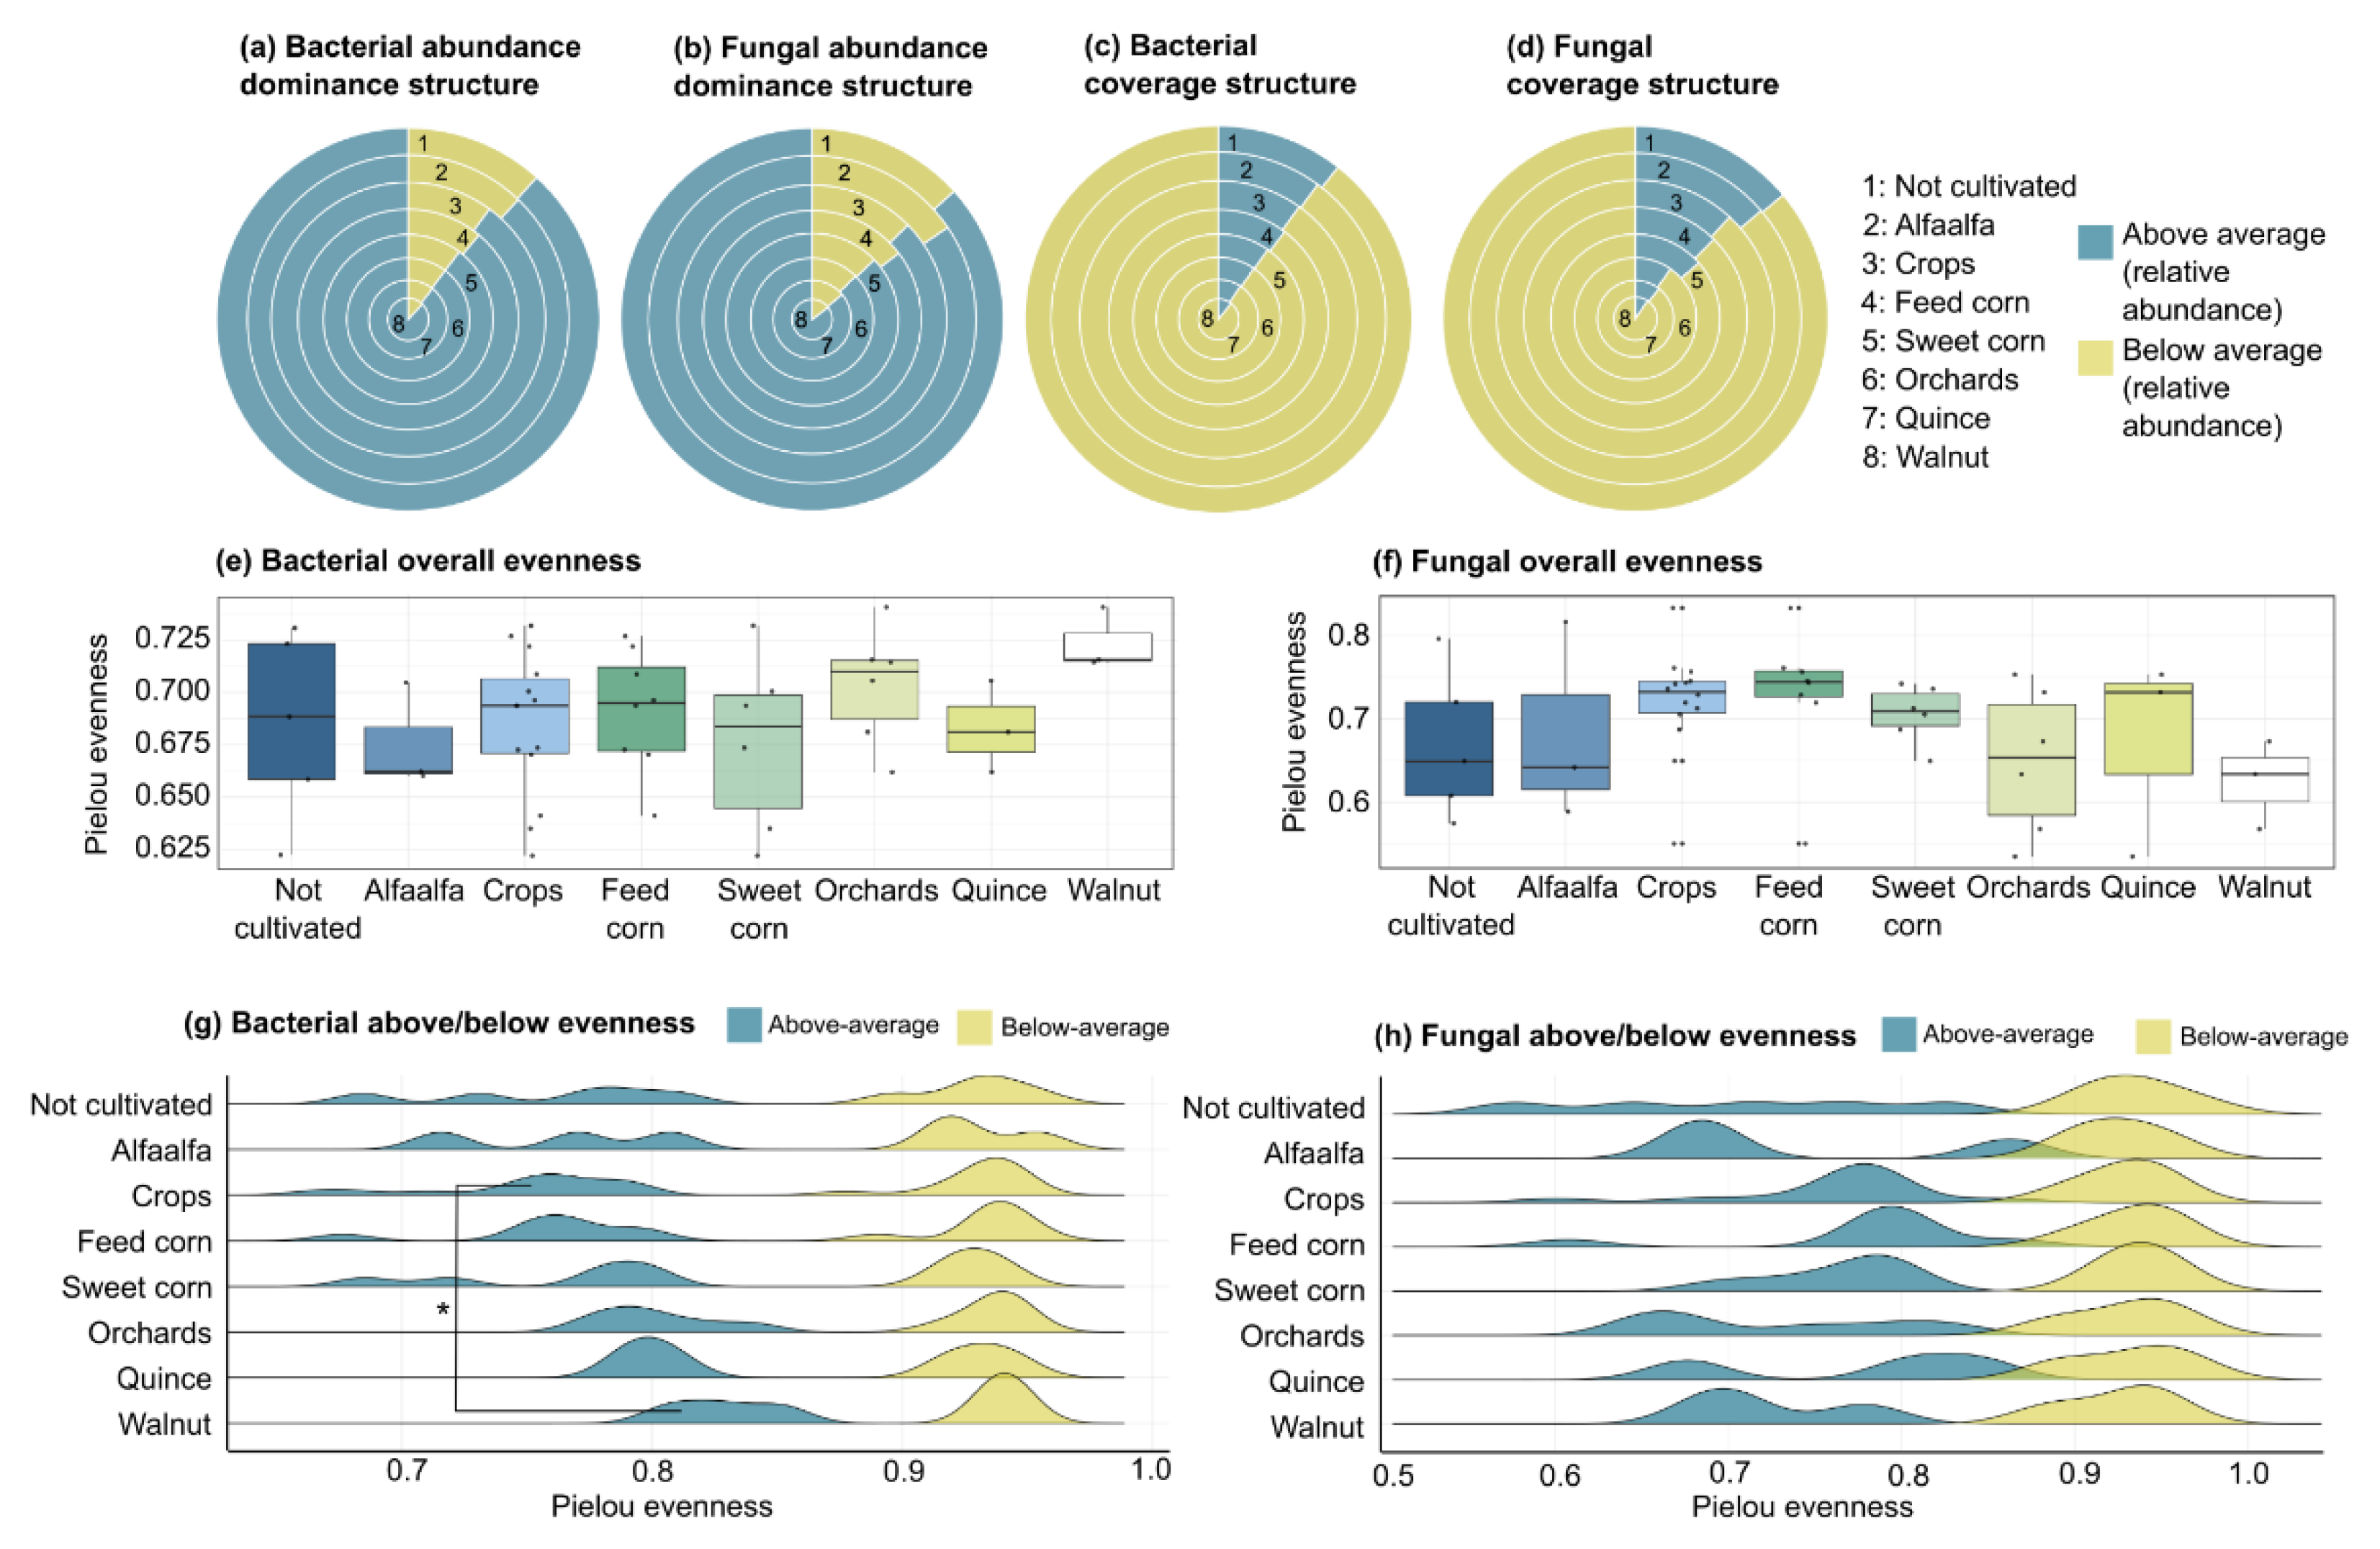
Figure 6.
Co-occurrence network structure of bacterial and fungal communities across four land-use systems in topsoil samples (0–30 cm depth): not cultivated (a), alfalfa (b), crops (c), and orchards (d). Nodes represent microbial taxa and edges represent significant co-occurrence relationships. Node colors indicate network modules. Network modularity (Mo) and density (De) values are reported for each community. Higher density values indicate a greater degree of connectivity among taxa, whereas higher modularity values reflect a stronger subdivision of the network into distinct modules.
Figure 6.
Co-occurrence network structure of bacterial and fungal communities across four land-use systems in topsoil samples (0–30 cm depth): not cultivated (a), alfalfa (b), crops (c), and orchards (d). Nodes represent microbial taxa and edges represent significant co-occurrence relationships. Node colors indicate network modules. Network modularity (Mo) and density (De) values are reported for each community. Higher density values indicate a greater degree of connectivity among taxa, whereas higher modularity values reflect a stronger subdivision of the network into distinct modules.
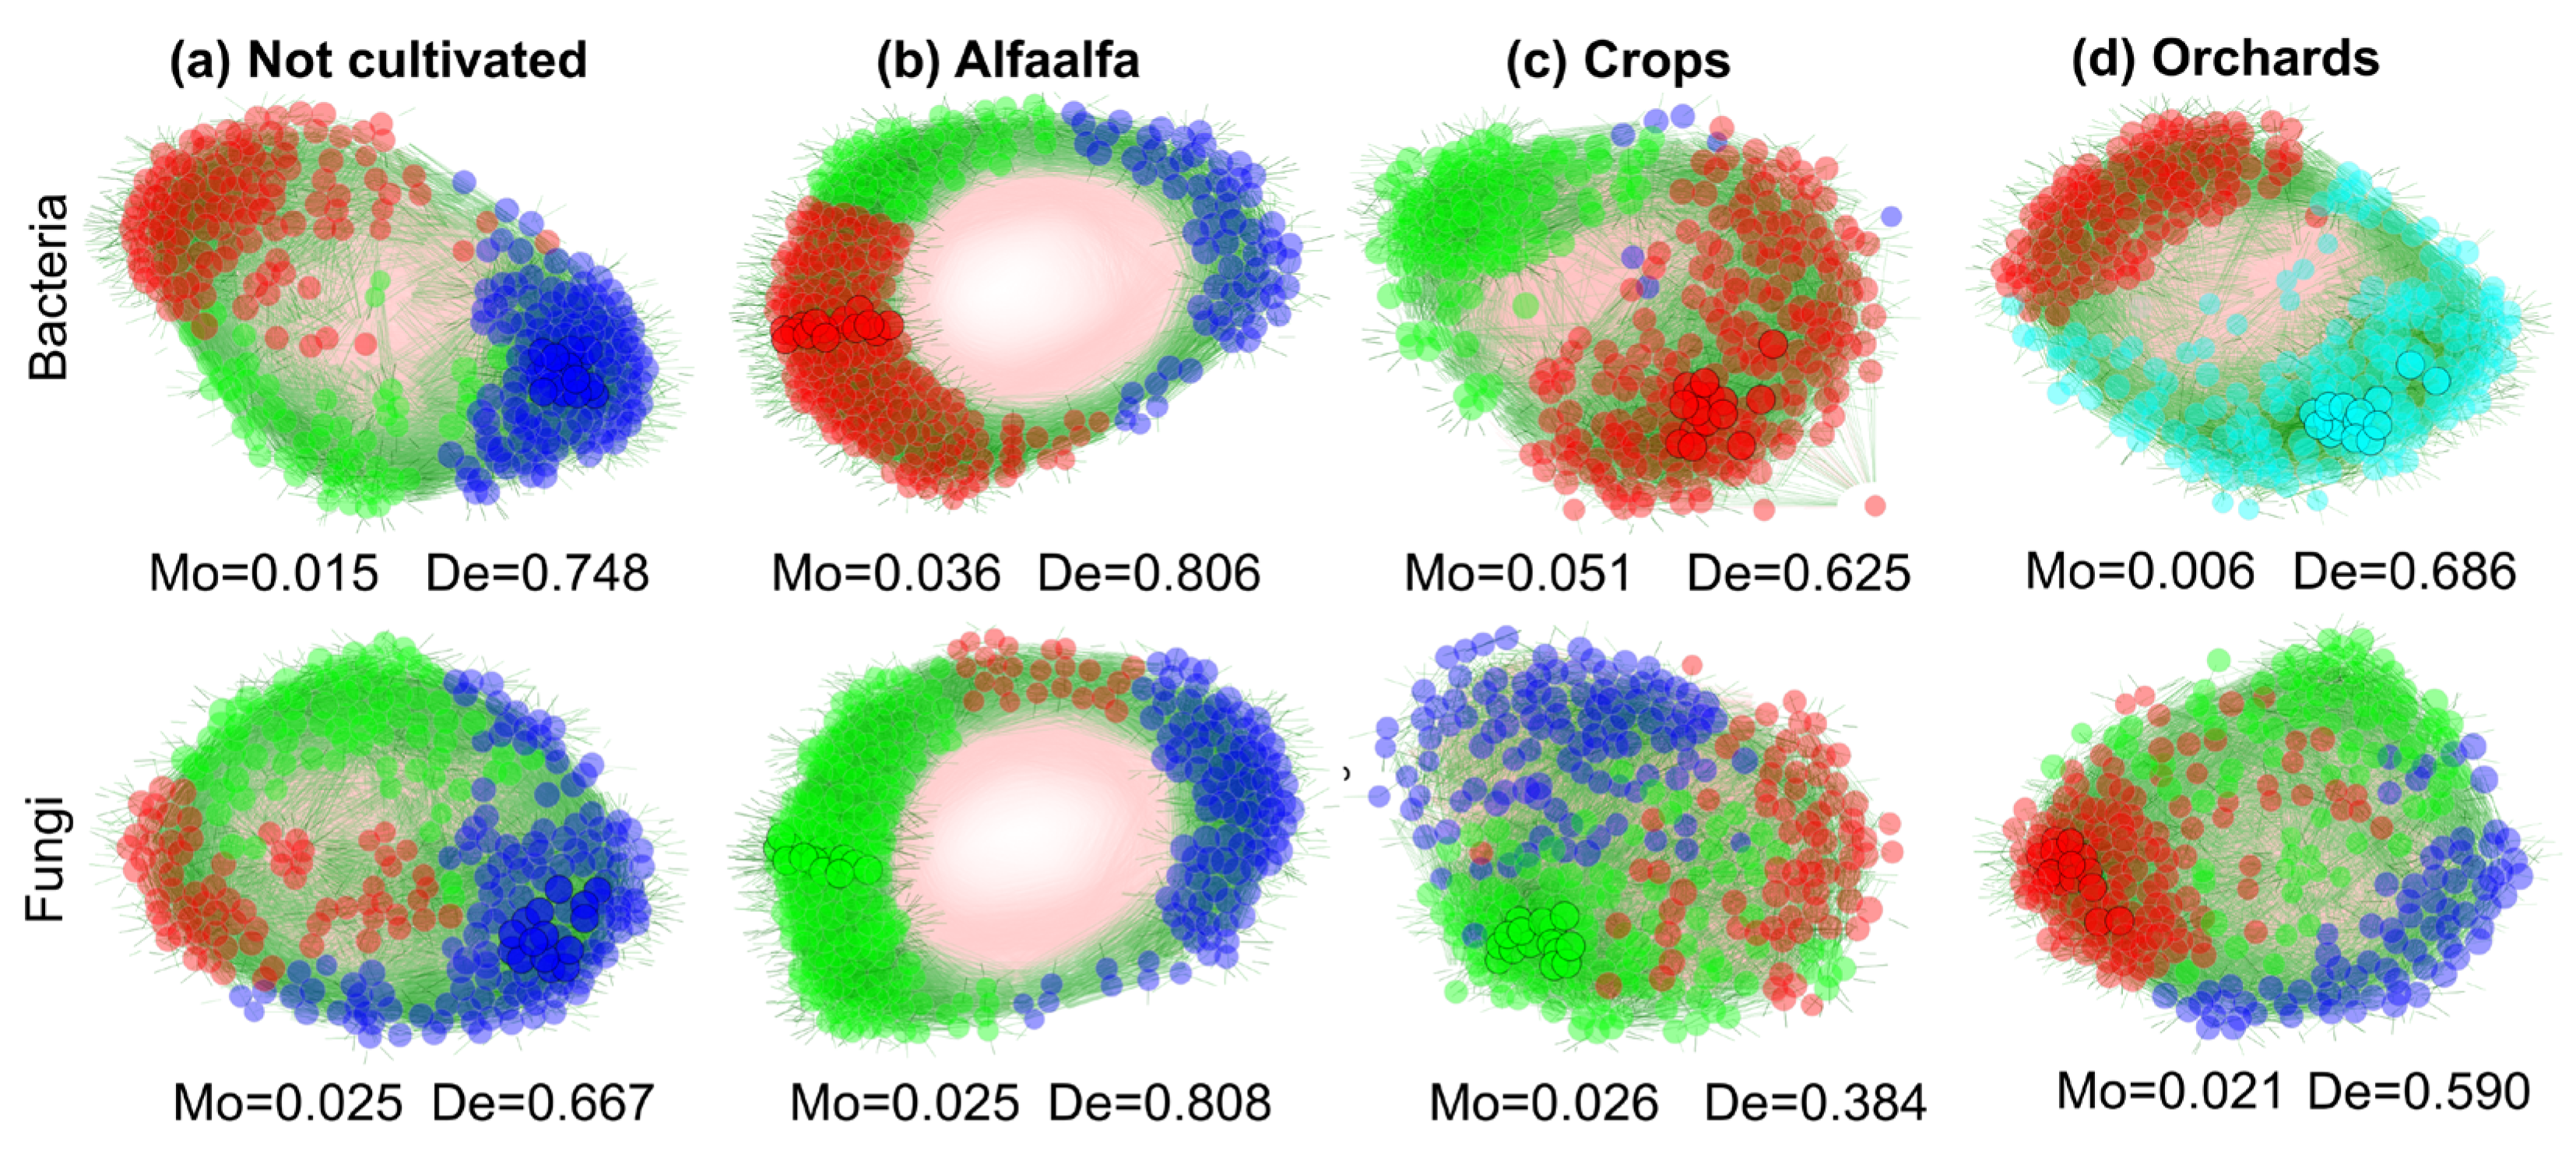
Figure 7.
Co-occurrence network structure of bacterial and fungal communities across soil depths. Panels (a–c) show bacterial and fungal co-occurrence networks in the 0–30 cm, 31–60 cm, and 61–90 cm soil layers, respectively. Nodes represent microbial taxa and edges represent significant co-occurrence relationships. Node colors indicate network modules, while larger nodes highlight highly connected taxa within each network. Panel (d) summarizes network density and modularity values for bacterial and fungal communities across soil depths. Higher density values indicate greater connectivity among taxa, whereas higher modularity values reflect stronger subdivision of the network into distinct modules.
Figure 7.
Co-occurrence network structure of bacterial and fungal communities across soil depths. Panels (a–c) show bacterial and fungal co-occurrence networks in the 0–30 cm, 31–60 cm, and 61–90 cm soil layers, respectively. Nodes represent microbial taxa and edges represent significant co-occurrence relationships. Node colors indicate network modules, while larger nodes highlight highly connected taxa within each network. Panel (d) summarizes network density and modularity values for bacterial and fungal communities across soil depths. Higher density values indicate greater connectivity among taxa, whereas higher modularity values reflect stronger subdivision of the network into distinct modules.
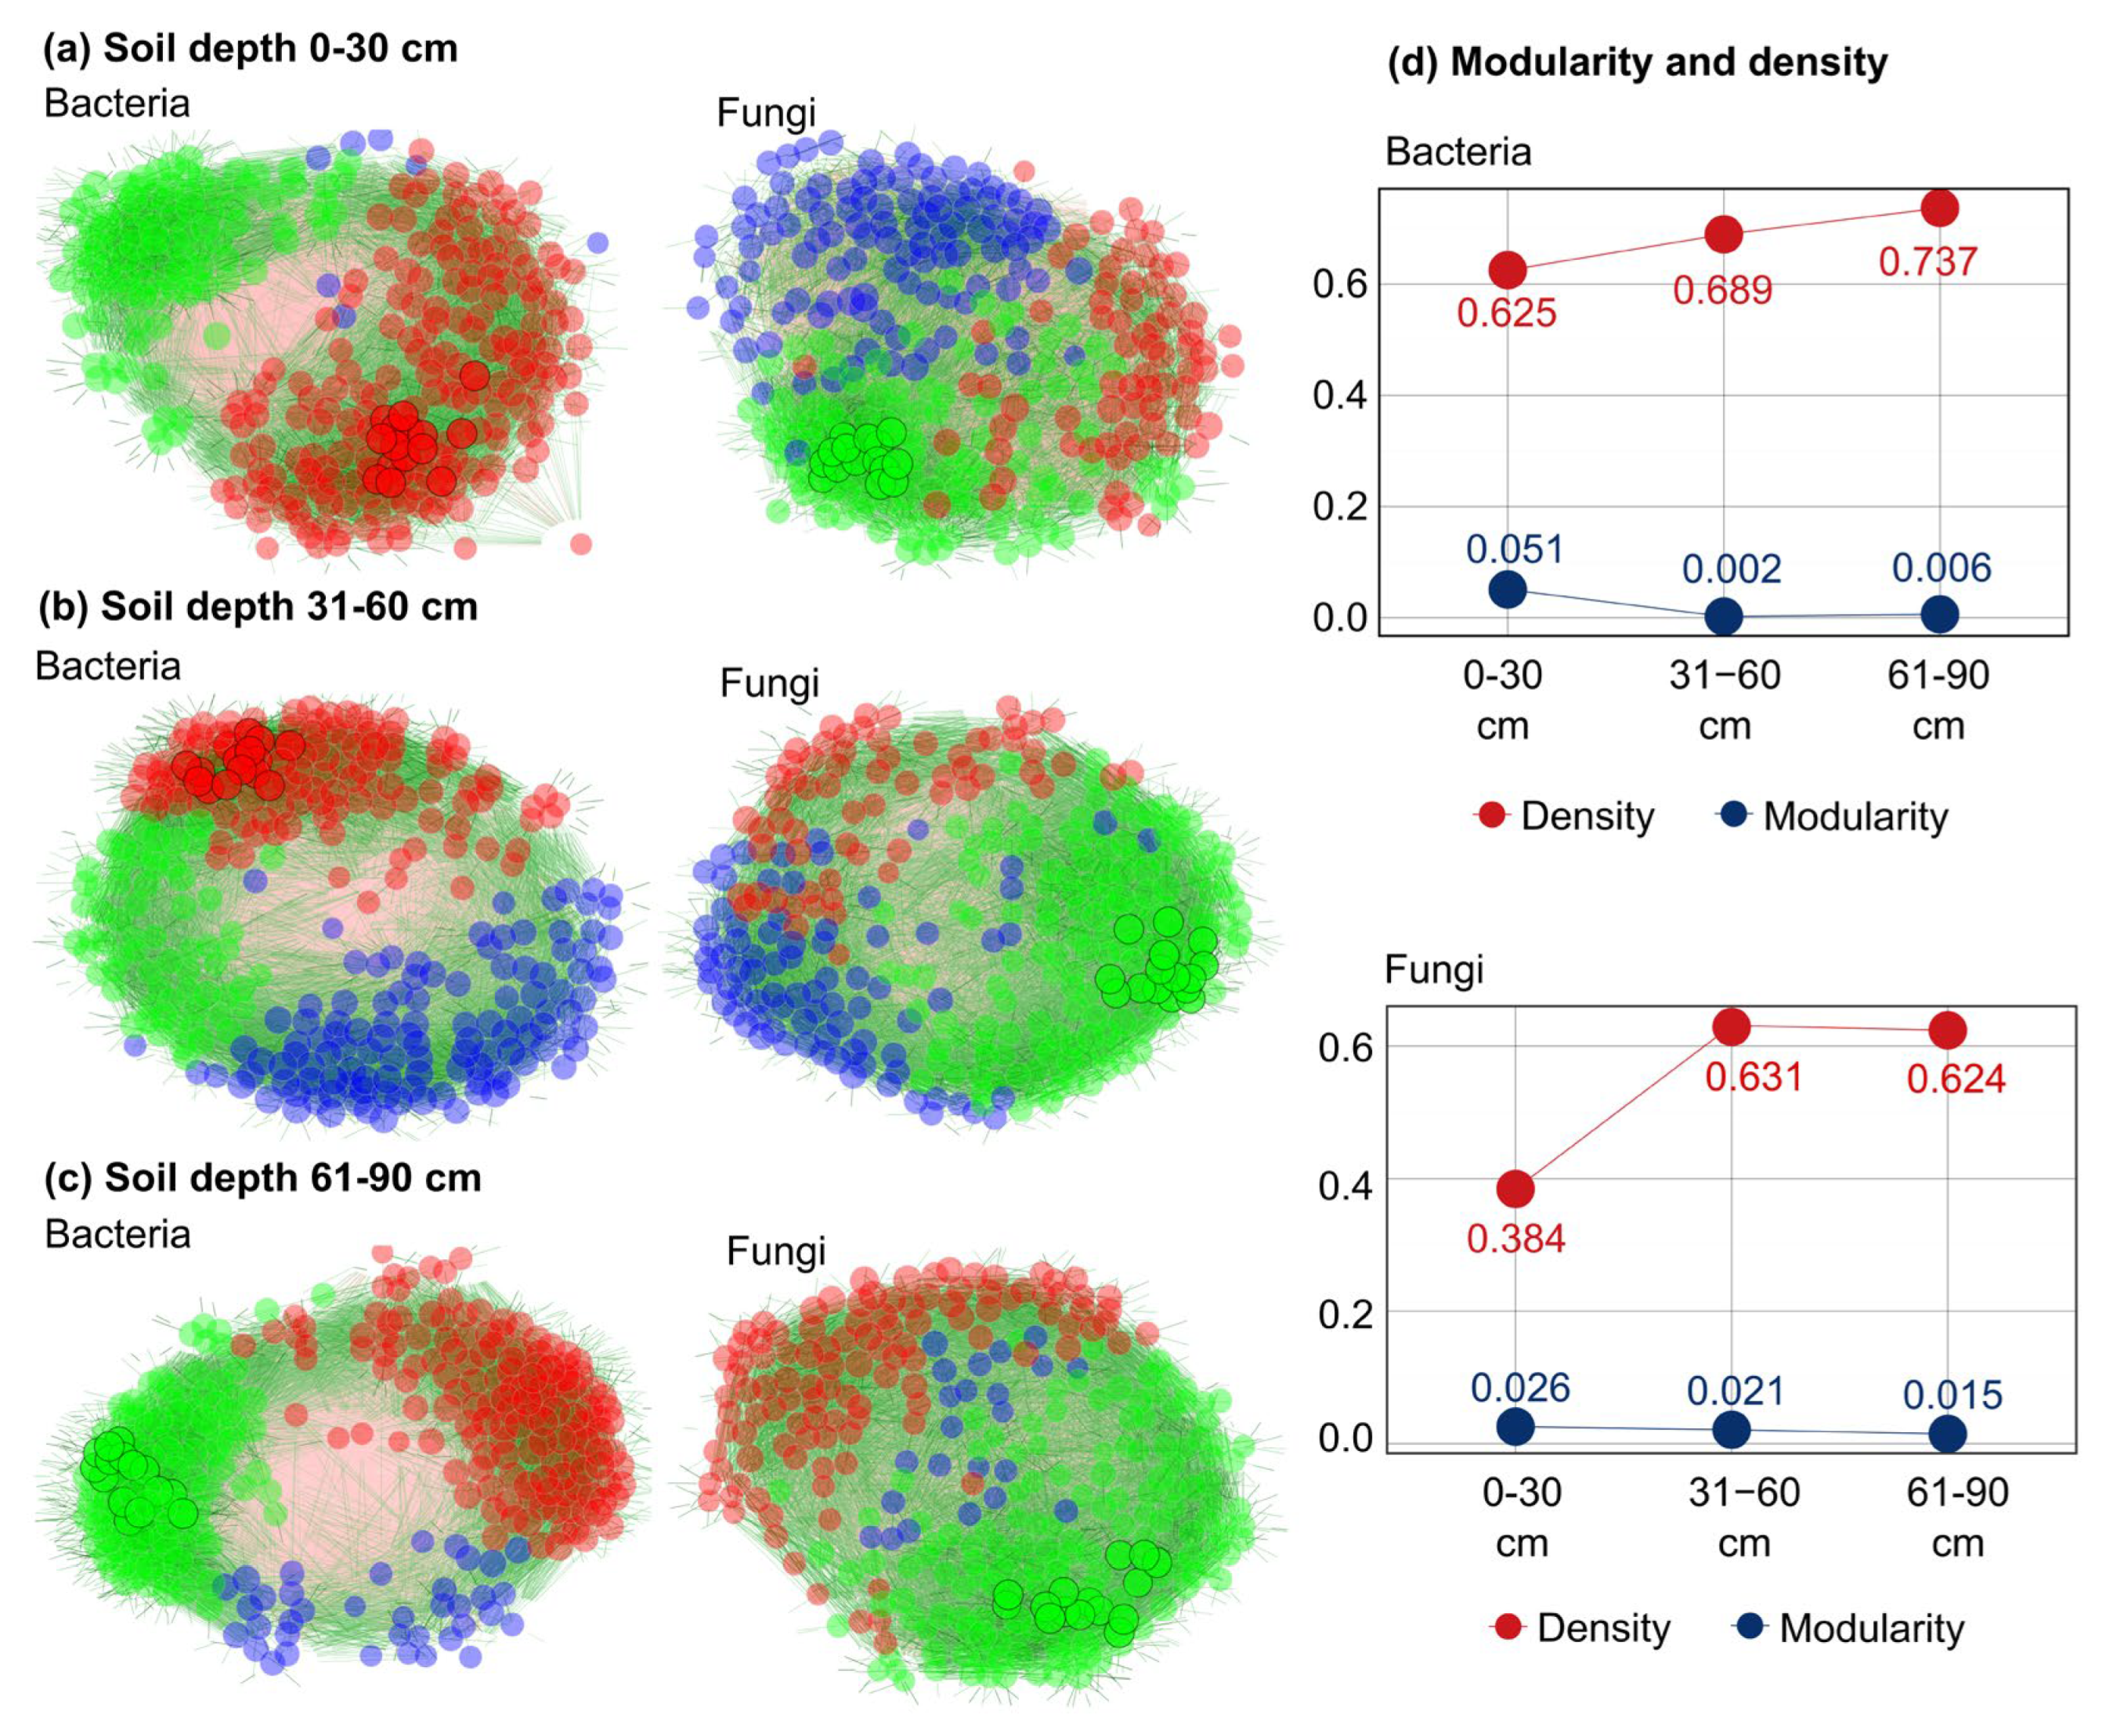
Figure 8.
Functional differentiation of soil microbial communities across twelve ecological functions grouped into four broader ecosystem-function categories: Nutrient Cycling and Plant Nutrition, Plant–Microbe Interactions, Environmental Adaptation and Remediation, and Organic Matter Turnover and Carbon Cycling. For each functional group, the left panel presents a non-metric multidimensional scaling (NMDS) ordination based on Bray–Curtis dissimilarities calculated from function-associated microbial taxa detected in topsoil samples (0–30 cm). Points represent individual samples coloured according to land-use system (cultivated land, alfalfa, crops, and orchards), while shaded ellipses indicate group dispersion. Stress values and overall PERMANOVA p-values are reported within each NMDS panel. The corresponding bubble plots summarize the mean pairwise Bray–Curtis dissimilarities among land-use systems, where bubble size and colour intensity increase with increasing community dissimilarity. Asterisks (*) indicate statistically significant pairwise differences identified by pairwise PERMANOVA after Benjamini–Hochberg correction (adjusted p < 0.05).
Figure 8.
Functional differentiation of soil microbial communities across twelve ecological functions grouped into four broader ecosystem-function categories: Nutrient Cycling and Plant Nutrition, Plant–Microbe Interactions, Environmental Adaptation and Remediation, and Organic Matter Turnover and Carbon Cycling. For each functional group, the left panel presents a non-metric multidimensional scaling (NMDS) ordination based on Bray–Curtis dissimilarities calculated from function-associated microbial taxa detected in topsoil samples (0–30 cm). Points represent individual samples coloured according to land-use system (cultivated land, alfalfa, crops, and orchards), while shaded ellipses indicate group dispersion. Stress values and overall PERMANOVA p-values are reported within each NMDS panel. The corresponding bubble plots summarize the mean pairwise Bray–Curtis dissimilarities among land-use systems, where bubble size and colour intensity increase with increasing community dissimilarity. Asterisks (*) indicate statistically significant pairwise differences identified by pairwise PERMANOVA after Benjamini–Hochberg correction (adjusted p < 0.05).
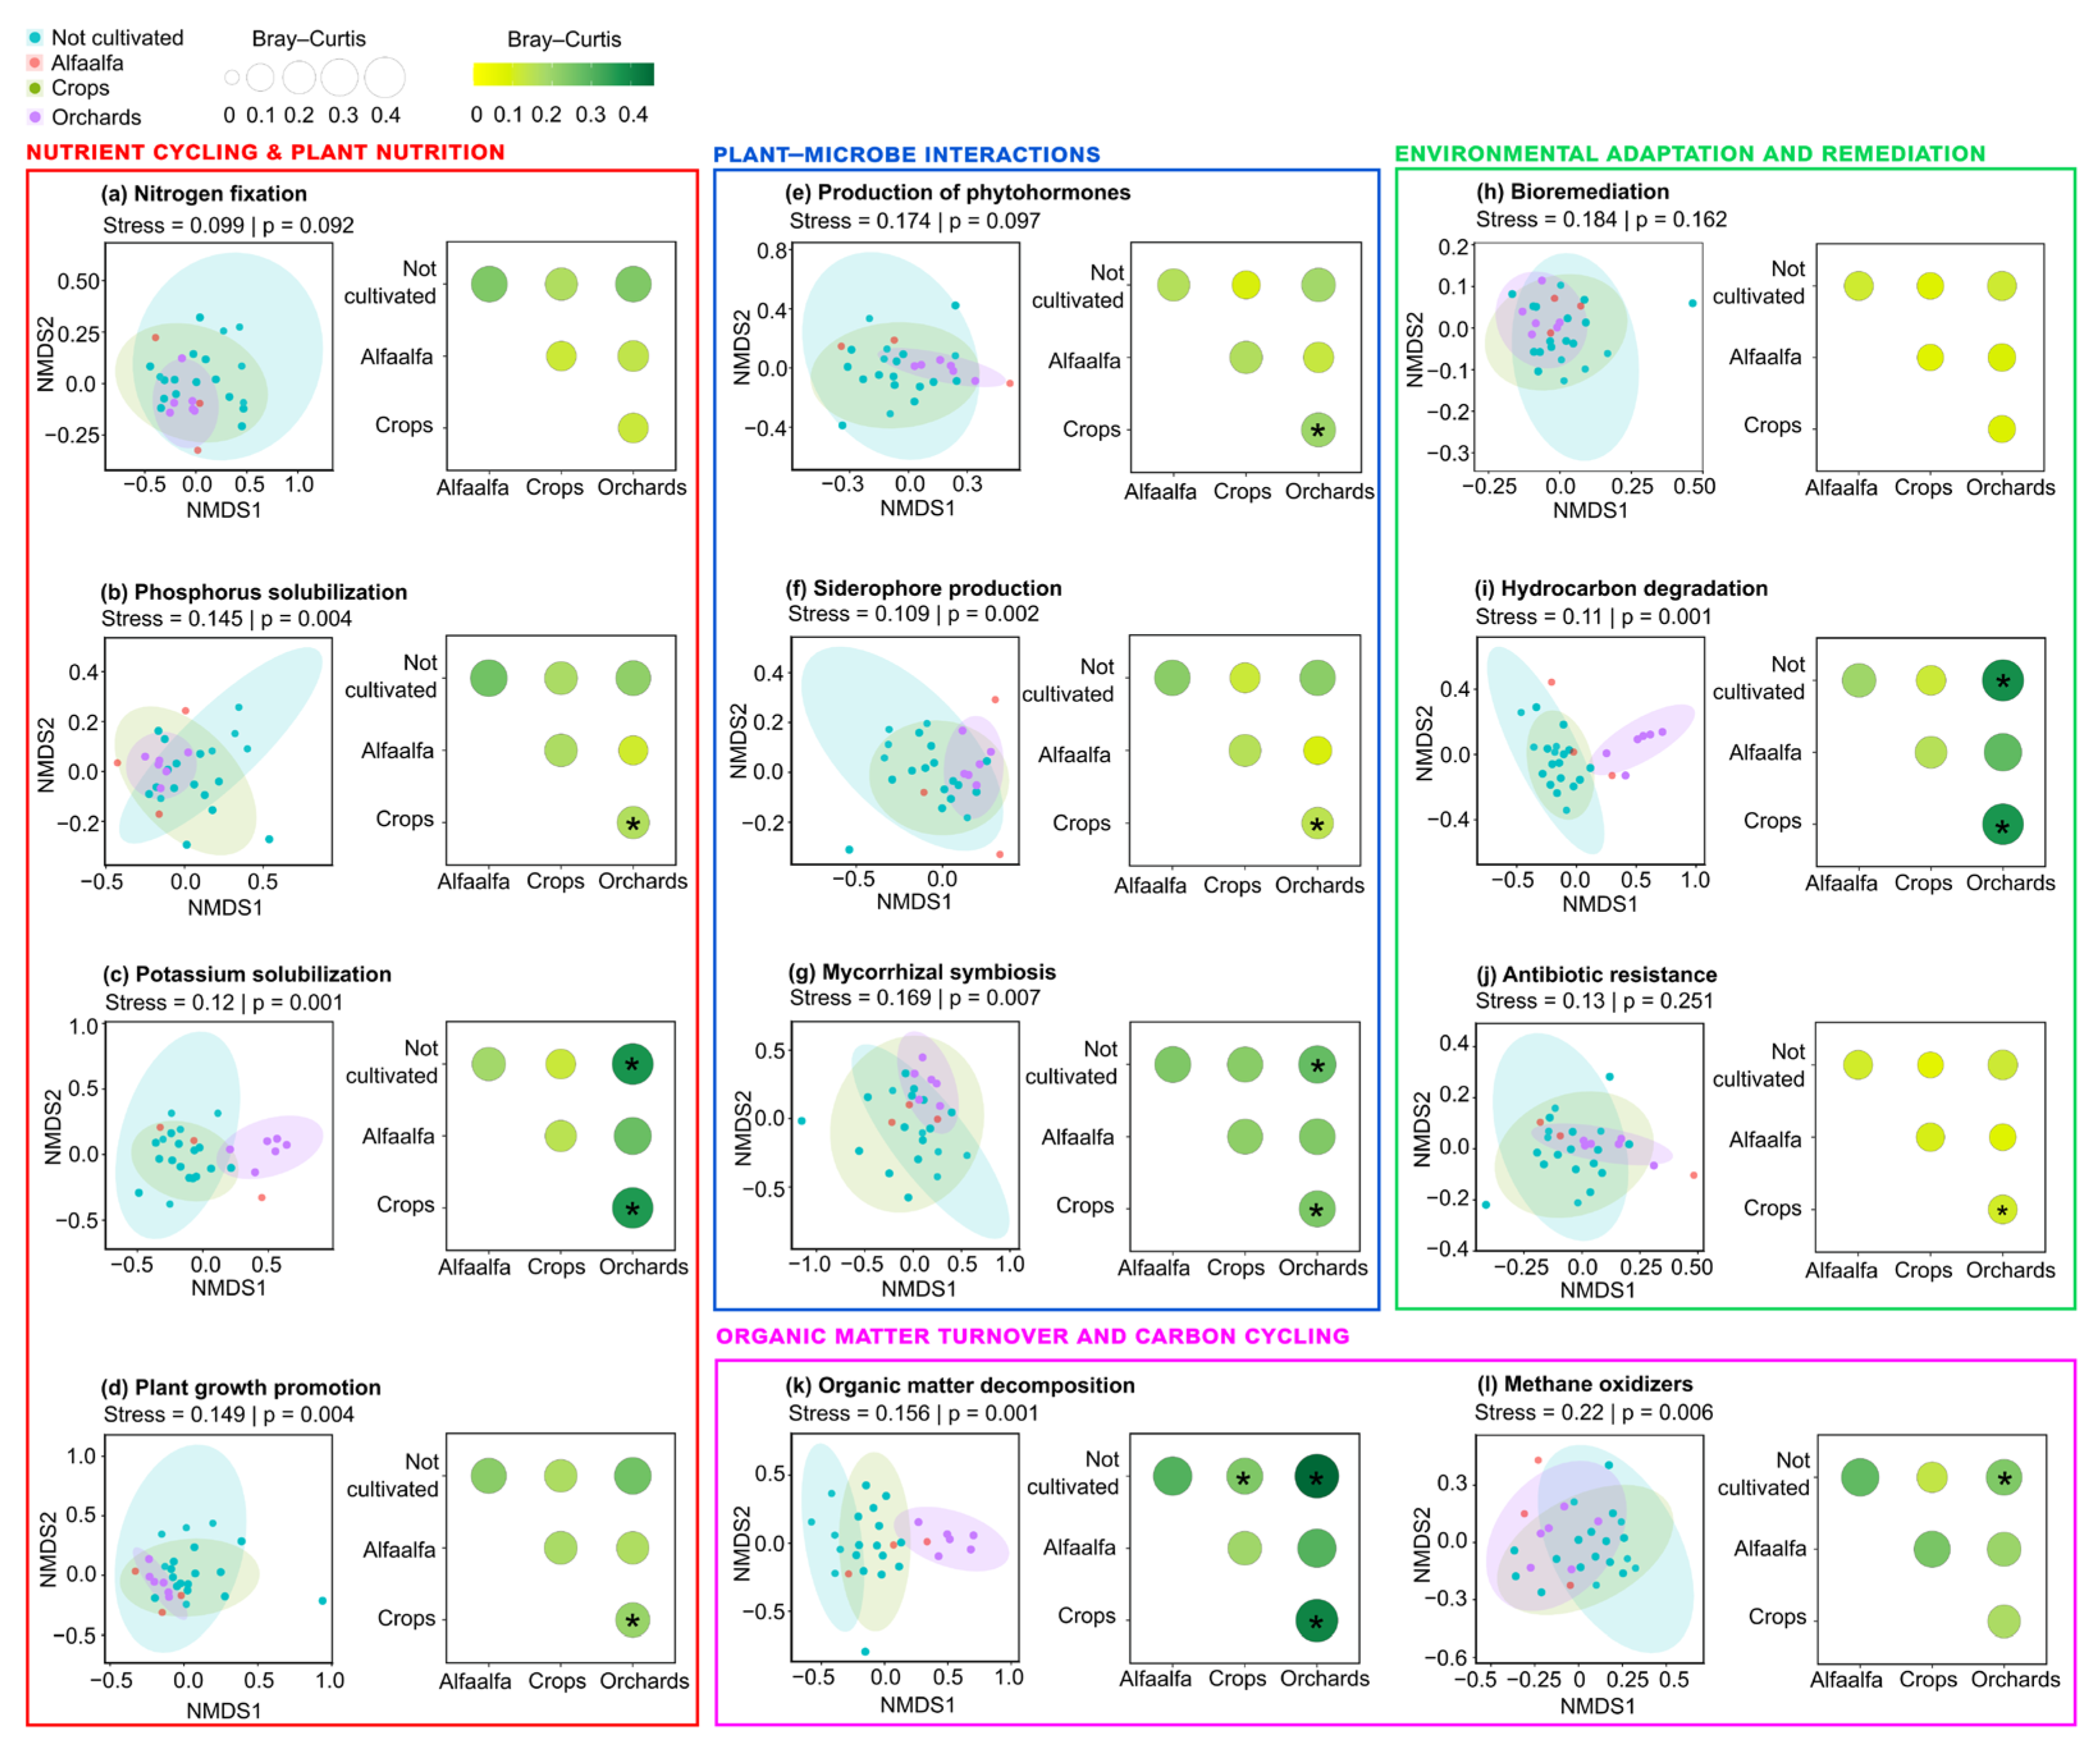
Figure 9.
Depth-dependent variation in oxidative stress-related functional profiles in crop soils (feed corn and sweet corn) based on KEGG annotations. Oxidative stress genes were grouped into five functional categories: ROS Detoxification, Redox Homeostasis, Oxidative Damage Repair, Stress Regulation, and Antioxidant Metabolite Production. A detailed description of the functional grouping is provided in Supplementary Material S1. Principal Coordinate Analysis (PCoA) based on Bray–Curtis dissimilarity illustrates the compositional differences among soil depths (0–30 cm, 31–60 cm, and 61–90 cm), while boxplots compare the corresponding functional potential between topsoil (0–30 cm) and subsoil (31–90 cm). Community-level differences were assessed using PERMANOVA, and differences in functional potential were evaluated using the Wilcoxon rank-sum test.
Figure 9.
Depth-dependent variation in oxidative stress-related functional profiles in crop soils (feed corn and sweet corn) based on KEGG annotations. Oxidative stress genes were grouped into five functional categories: ROS Detoxification, Redox Homeostasis, Oxidative Damage Repair, Stress Regulation, and Antioxidant Metabolite Production. A detailed description of the functional grouping is provided in Supplementary Material S1. Principal Coordinate Analysis (PCoA) based on Bray–Curtis dissimilarity illustrates the compositional differences among soil depths (0–30 cm, 31–60 cm, and 61–90 cm), while boxplots compare the corresponding functional potential between topsoil (0–30 cm) and subsoil (31–90 cm). Community-level differences were assessed using PERMANOVA, and differences in functional potential were evaluated using the Wilcoxon rank-sum test.
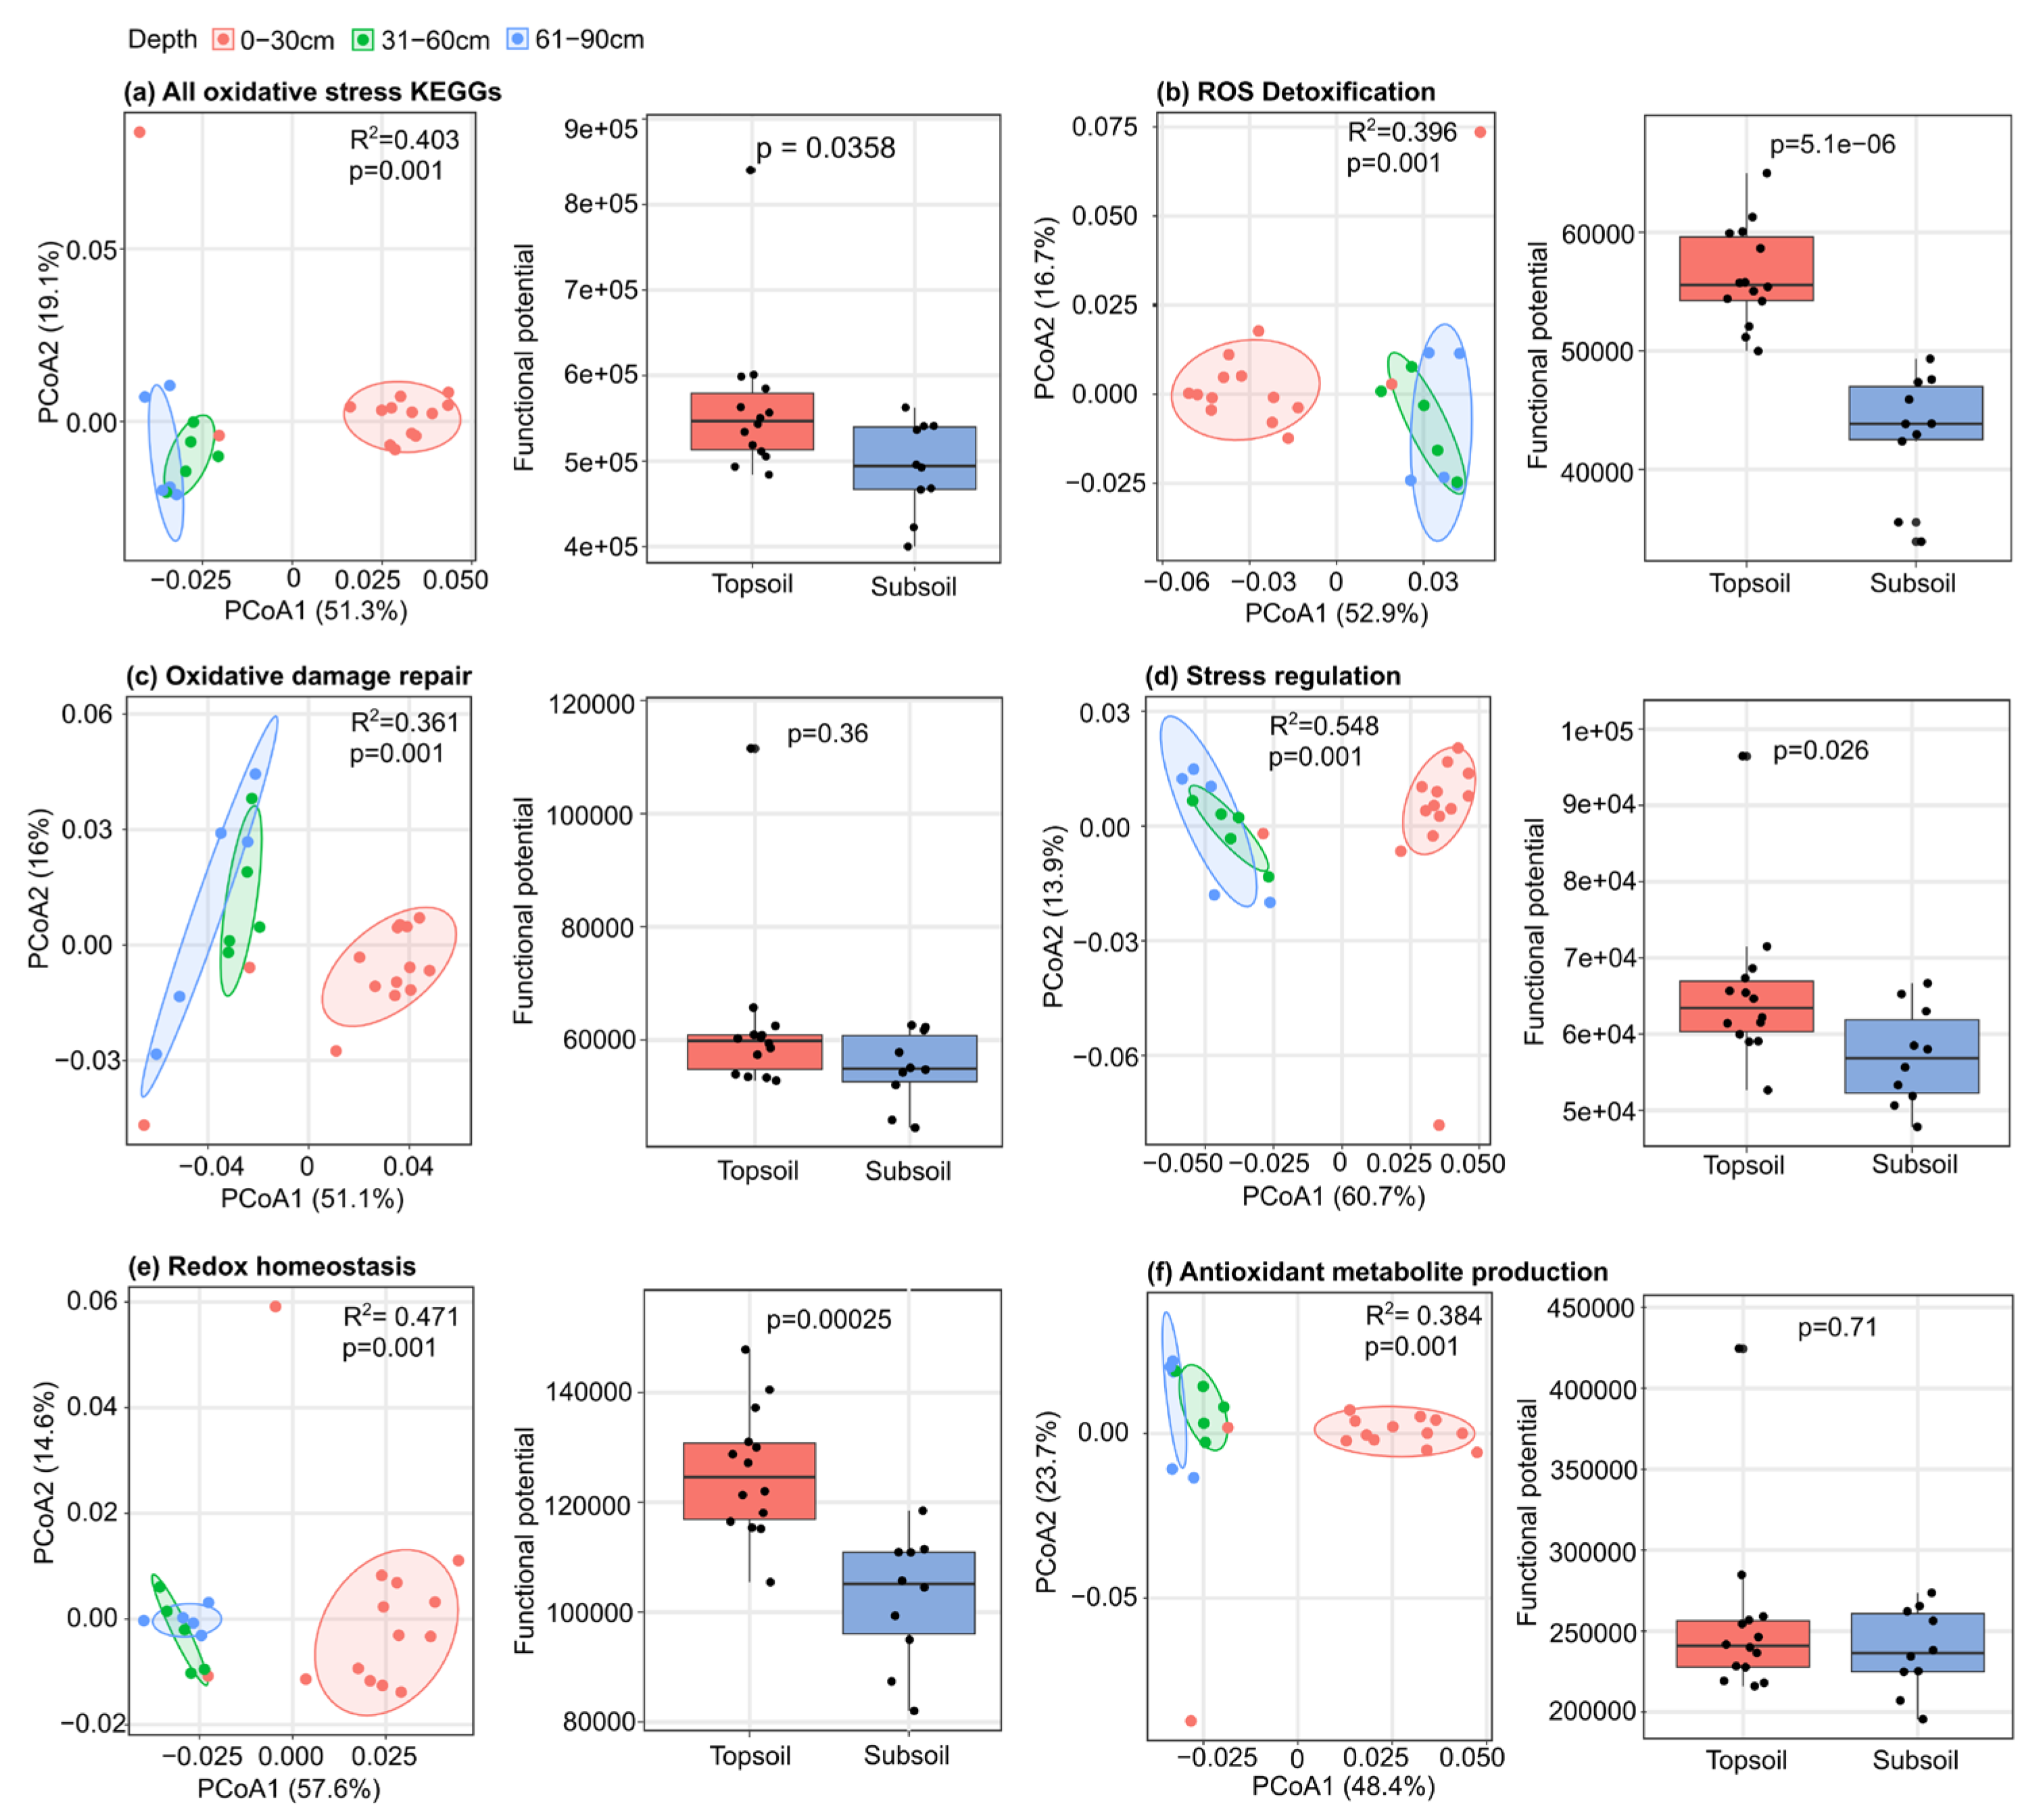
Figure 10.
LEfSe biomarkers of oxidative stress-related KEGG orthologs across soil depths. (a) Circular visualization of the 117 significantly enriched oxidative stress-related KEGG orthologs identified by LEfSe analysis. Biomarkers are grouped into five manually curated oxidative stress-related functional categories: Antioxidant Metabolite Production, Oxidative Damage Repair, ROS Detoxification, Redox Homeostasis, and Stress Regulation. Each point represents a significant KEGG ortholog and is colored according to the soil compartment in which it was significantly enriched (Topsoil or Subsoil). Radial lines connect each biomarker to its corresponding LDA score, while the colored outer sectors indicate the functional category to which each KEGG ortholog belongs. (b) Donut charts summarizing the relative distribution of Topsoil- and Subsoil-enriched KEGG orthologs within each functional category. Percentages represent the proportion of significant biomarkers assigned to each soil compartment, and the value in the center of each donut indicates the total number of significant KEGG orthologs belonging to that category. The complete list of significant oxidative stress-related KEGG biomarkers identified by LEfSe is provided in Supplementary Materials (S2).
Figure 10.
LEfSe biomarkers of oxidative stress-related KEGG orthologs across soil depths. (a) Circular visualization of the 117 significantly enriched oxidative stress-related KEGG orthologs identified by LEfSe analysis. Biomarkers are grouped into five manually curated oxidative stress-related functional categories: Antioxidant Metabolite Production, Oxidative Damage Repair, ROS Detoxification, Redox Homeostasis, and Stress Regulation. Each point represents a significant KEGG ortholog and is colored according to the soil compartment in which it was significantly enriched (Topsoil or Subsoil). Radial lines connect each biomarker to its corresponding LDA score, while the colored outer sectors indicate the functional category to which each KEGG ortholog belongs. (b) Donut charts summarizing the relative distribution of Topsoil- and Subsoil-enriched KEGG orthologs within each functional category. Percentages represent the proportion of significant biomarkers assigned to each soil compartment, and the value in the center of each donut indicates the total number of significant KEGG orthologs belonging to that category. The complete list of significant oxidative stress-related KEGG biomarkers identified by LEfSe is provided in Supplementary Materials (S2).
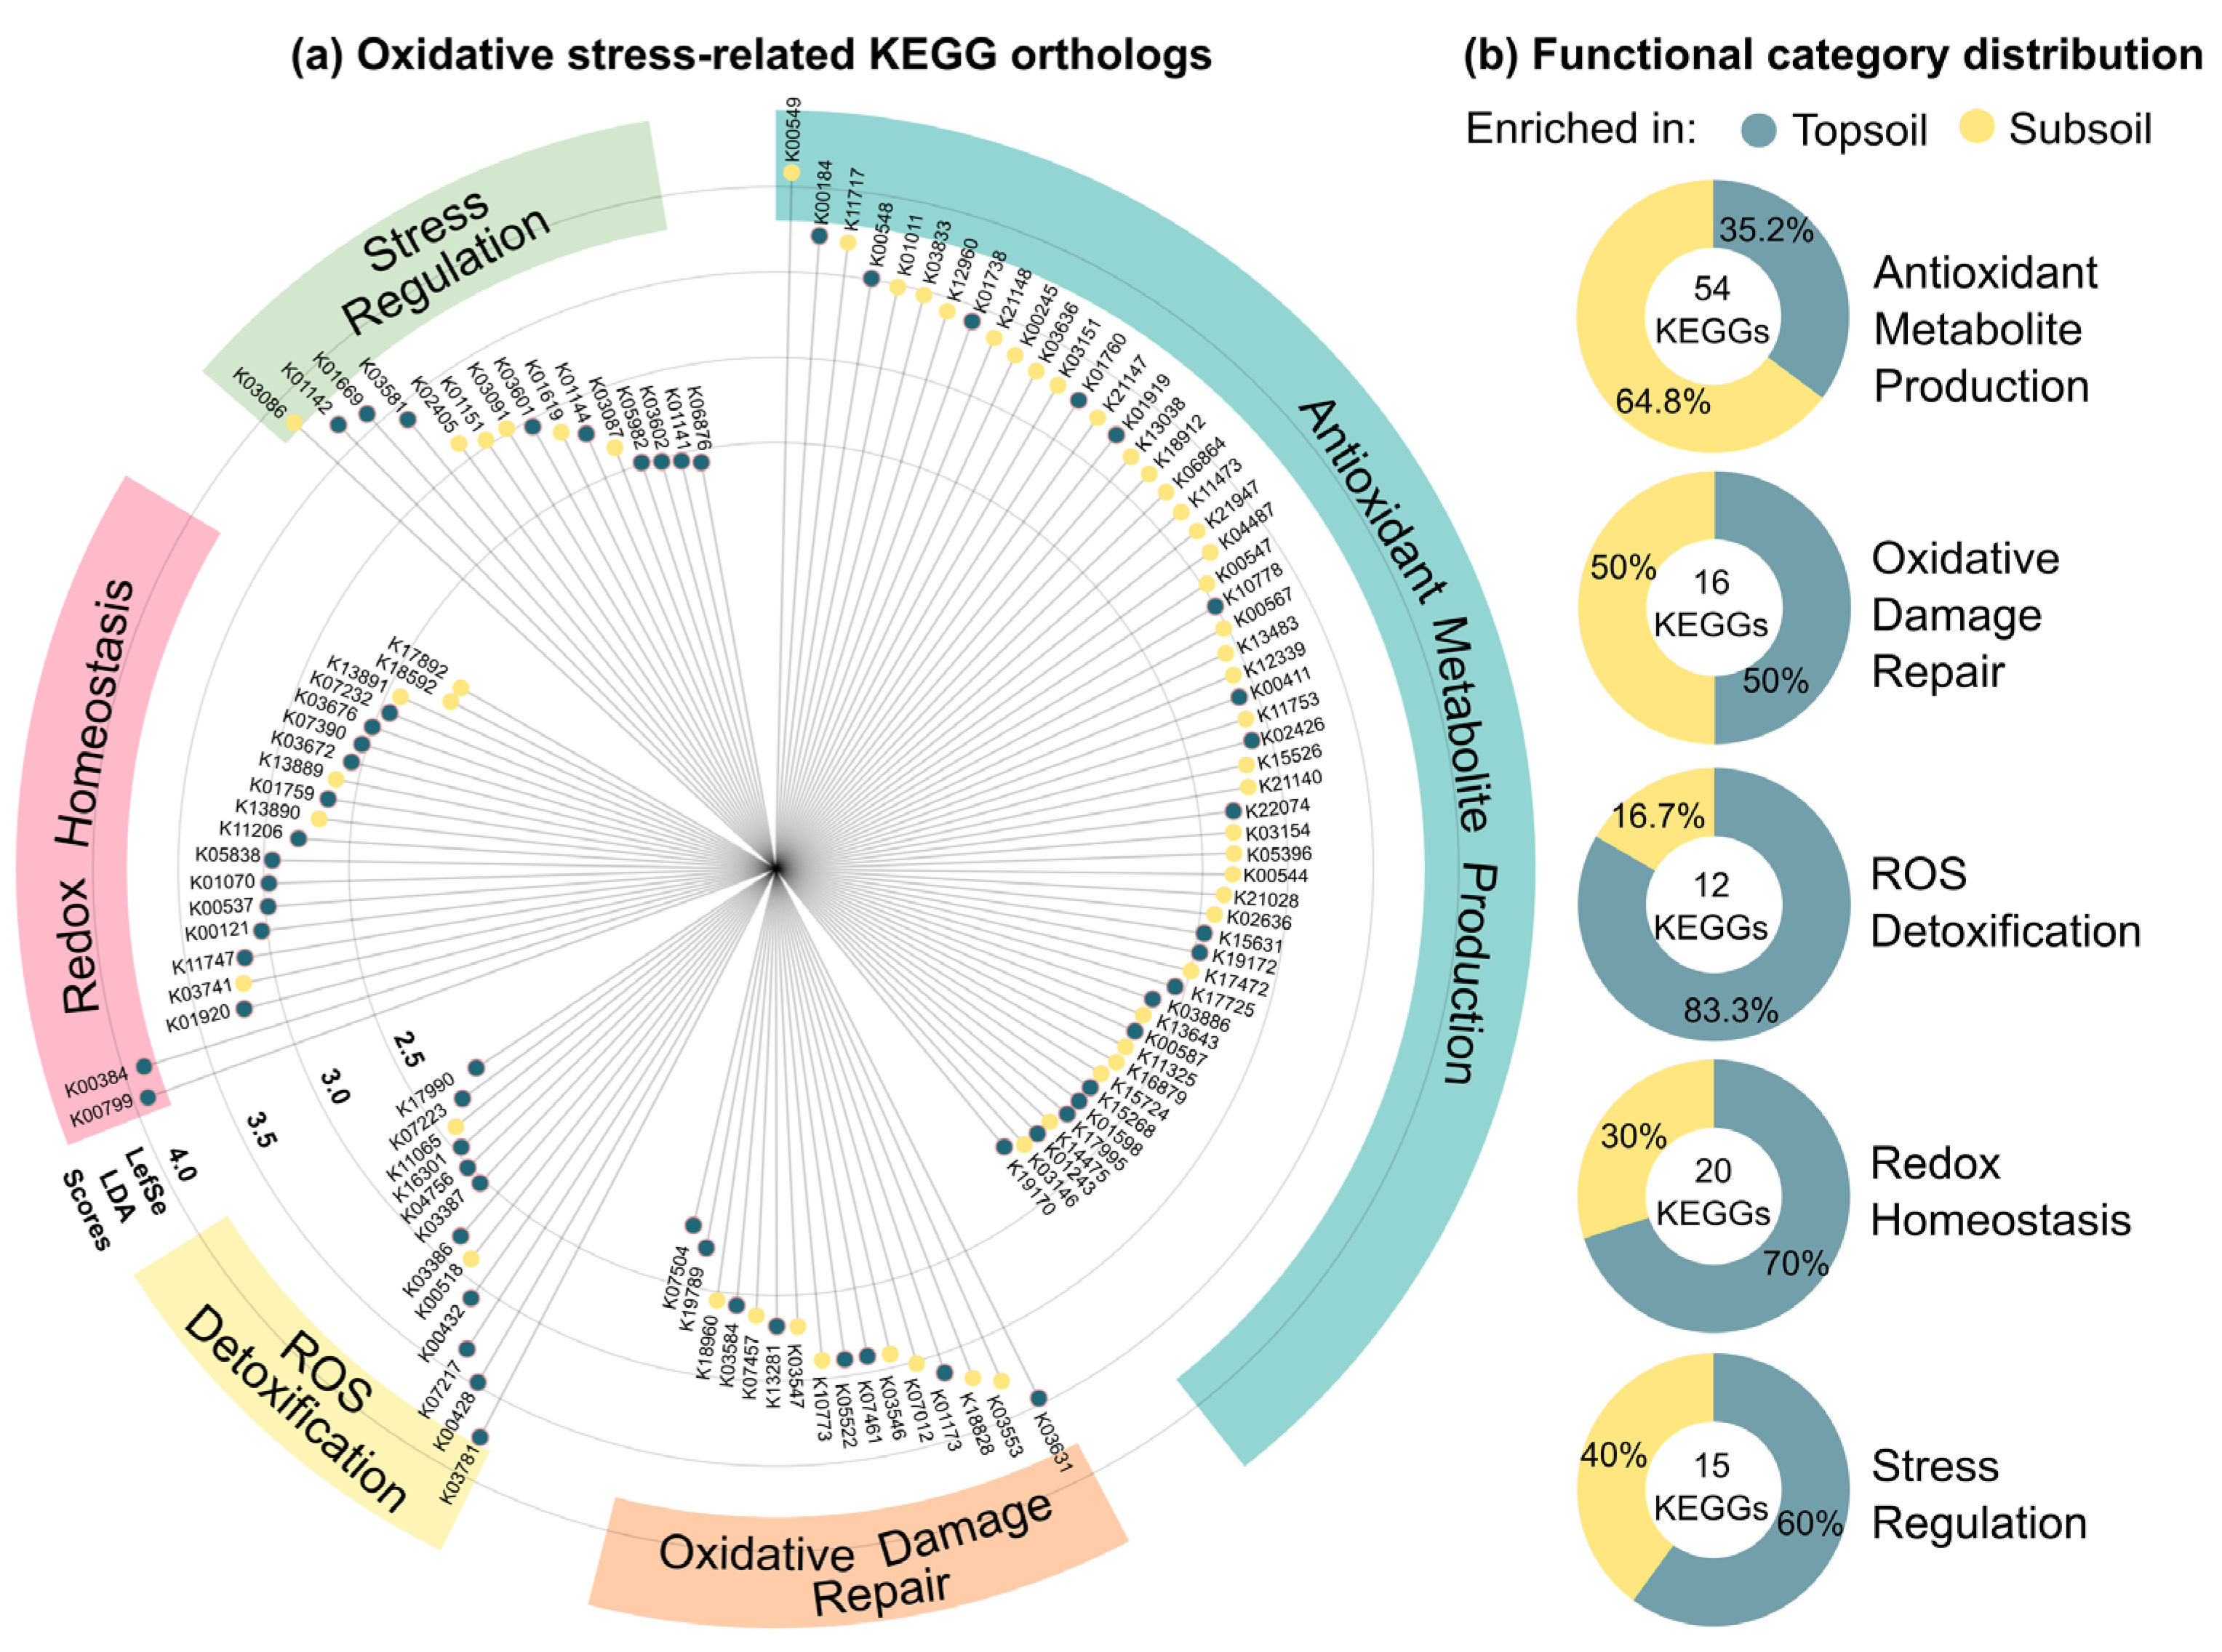
Figure 11.
Depth-related variation in nutrient cycling and carbon metabolism pathways in crop soils (feed corn and sweet corn). Boxplots show the relative abundance of KEGG pathways associated with biosynthesis of siderophore group nonribosomal peptides (a), inositol phosphate metabolism (b), nitrogen metabolism (c), phosphonate and phosphinate metabolism (d), starch and sucrose metabolism (e), and sulfur metabolism (f). Differences between topsoil and subsoil were evaluated using the Wilcoxon rank-sum test.
Figure 11.
Depth-related variation in nutrient cycling and carbon metabolism pathways in crop soils (feed corn and sweet corn). Boxplots show the relative abundance of KEGG pathways associated with biosynthesis of siderophore group nonribosomal peptides (a), inositol phosphate metabolism (b), nitrogen metabolism (c), phosphonate and phosphinate metabolism (d), starch and sucrose metabolism (e), and sulfur metabolism (f). Differences between topsoil and subsoil were evaluated using the Wilcoxon rank-sum test.
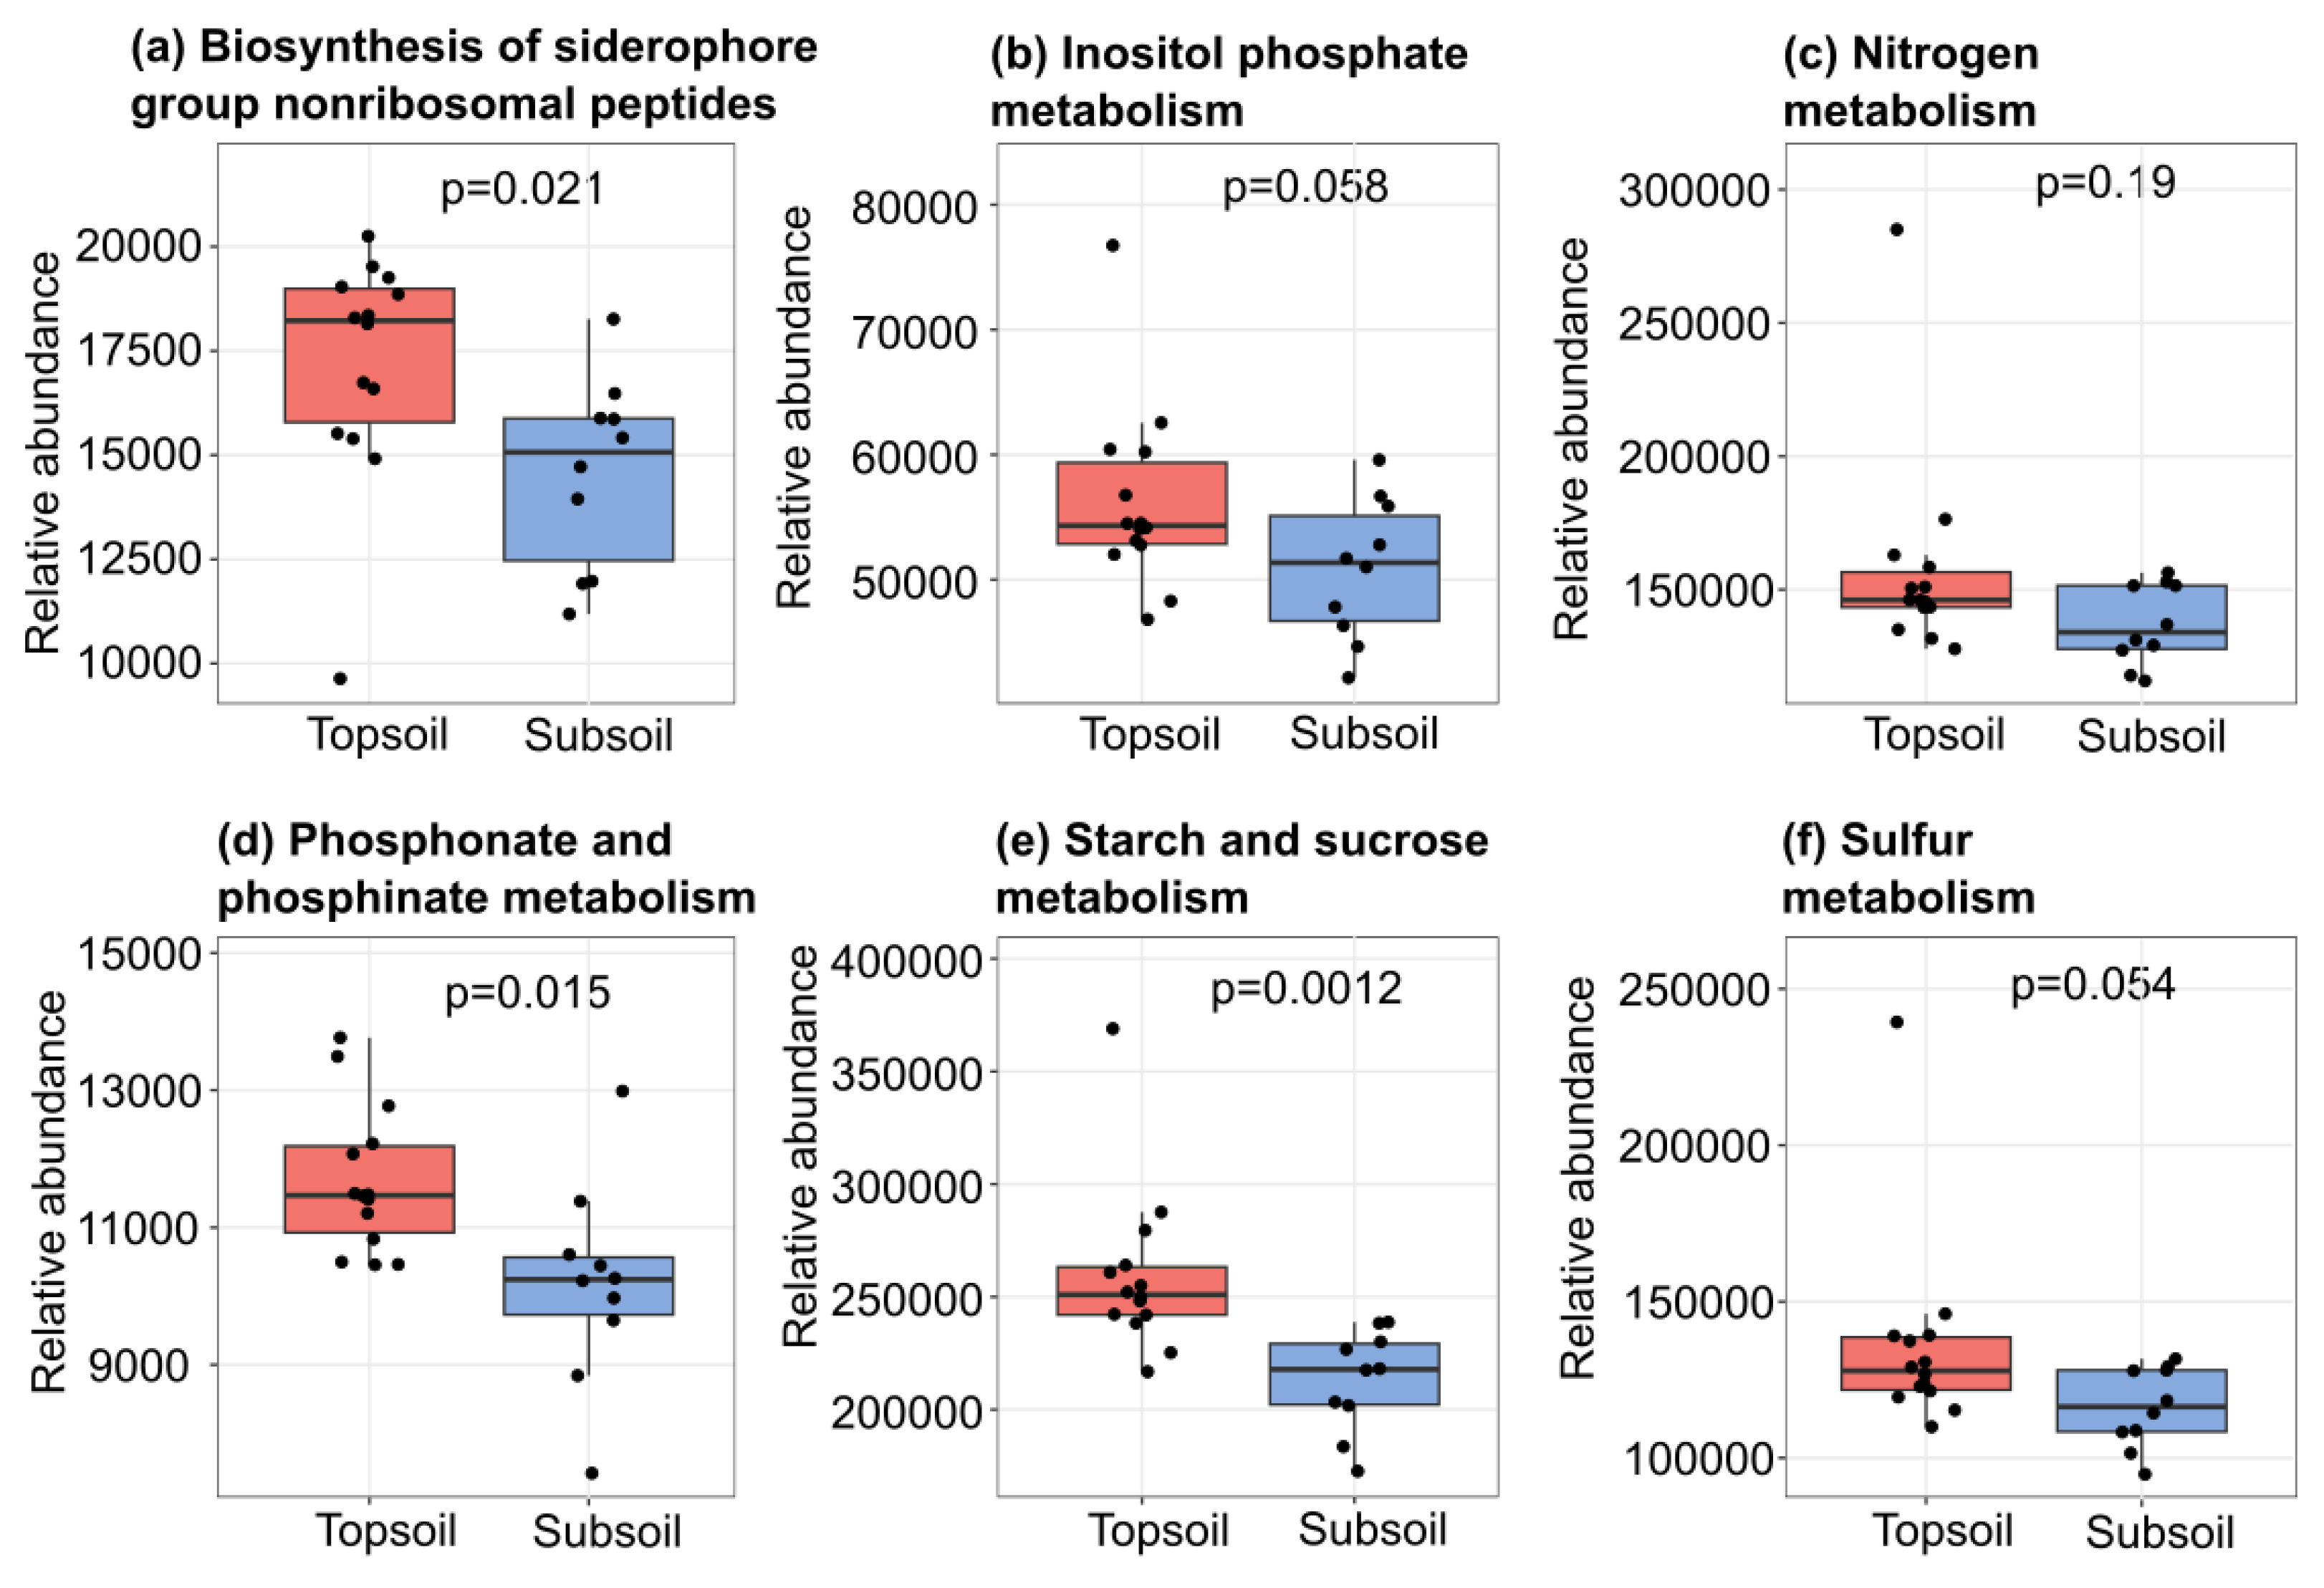
Figure 12.
Normalized prevalence of bacterial and fungal pathogens across crop and orchard systems. (a) Bacterial pathogens in crops (feed corn and sweet corn), (b) bacterial pathogens in orchards (quince and walnut), (c) fungal pathogens in crops, and (d) fungal pathogens in orchards. Bars represent the mean prevalence of detected pathogens, calculated as the average proportion of samples in which each pathogen was present within each group. Values inside bars indicate mean prevalence percentages and the number of detected pathogens. Statistical differences between groups were assessed using the Wilcoxon rank-sum test, with p-values and significance levels indicated above each panel. The complete pathogen lists are provided in the Supplementary Materials (S3).
Figure 12.
Normalized prevalence of bacterial and fungal pathogens across crop and orchard systems. (a) Bacterial pathogens in crops (feed corn and sweet corn), (b) bacterial pathogens in orchards (quince and walnut), (c) fungal pathogens in crops, and (d) fungal pathogens in orchards. Bars represent the mean prevalence of detected pathogens, calculated as the average proportion of samples in which each pathogen was present within each group. Values inside bars indicate mean prevalence percentages and the number of detected pathogens. Statistical differences between groups were assessed using the Wilcoxon rank-sum test, with p-values and significance levels indicated above each panel. The complete pathogen lists are provided in the Supplementary Materials (S3).
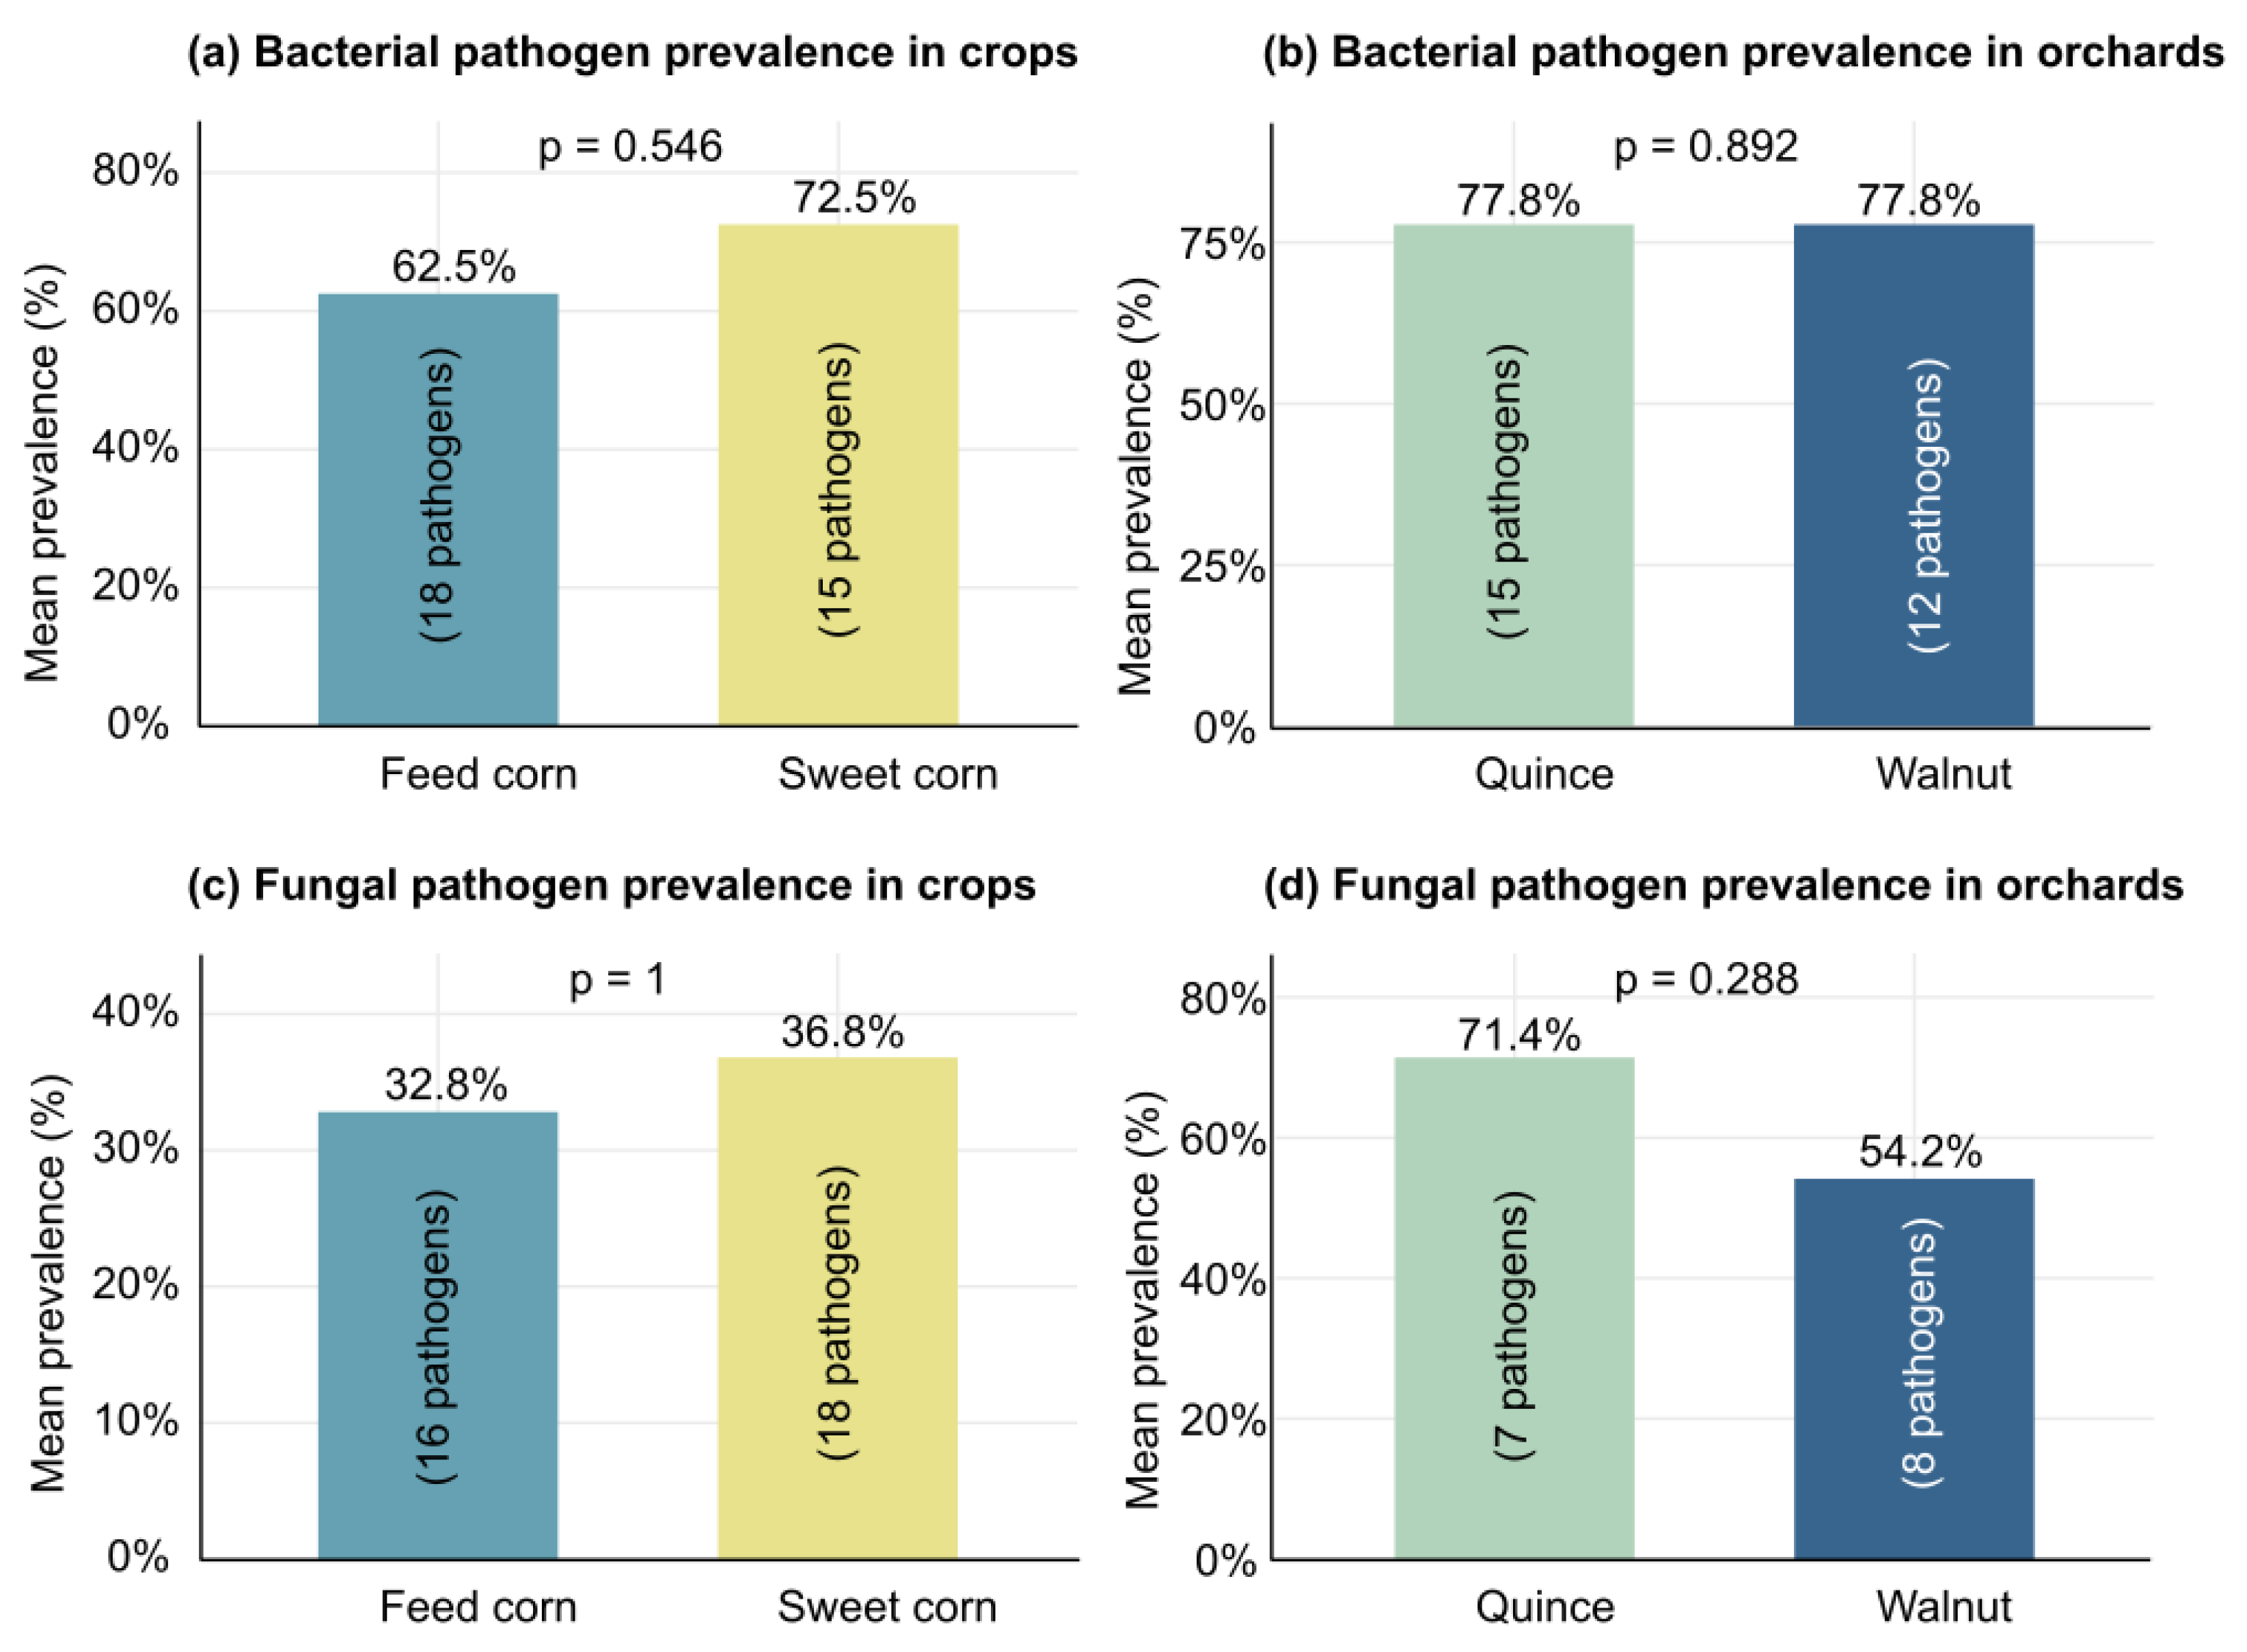
Figure 13.
Integrated analysis of bacterial and fungal pathogen composition across crop and orchard systems. Panels (a) and (b) show the relative abundance of the top bacterial and fungal pathogen species, respectively, in Crops (feed corn and sweet corn) and Orchards (walnut and quince), with each bar normalized to 100% within the respective system. Panels (c) and (d) present the distribution of bacterial and fungal pathogen species within crop and orchard systems, expressed as the percentage contribution of each crop type (feed corn vs. sweet corn) or orchard type (quince vs. walnut) to the total number of detected pathogen species. Panels (e) and (f) illustrate the relative abundance of the top dominant bacterial and fungal pathogen species within each crop or orchard type, with each bar normalized to 100%, highlighting differences in pathogen dominance among feed corn, sweet corn, quince, and walnut.
Figure 13.
Integrated analysis of bacterial and fungal pathogen composition across crop and orchard systems. Panels (a) and (b) show the relative abundance of the top bacterial and fungal pathogen species, respectively, in Crops (feed corn and sweet corn) and Orchards (walnut and quince), with each bar normalized to 100% within the respective system. Panels (c) and (d) present the distribution of bacterial and fungal pathogen species within crop and orchard systems, expressed as the percentage contribution of each crop type (feed corn vs. sweet corn) or orchard type (quince vs. walnut) to the total number of detected pathogen species. Panels (e) and (f) illustrate the relative abundance of the top dominant bacterial and fungal pathogen species within each crop or orchard type, with each bar normalized to 100%, highlighting differences in pathogen dominance among feed corn, sweet corn, quince, and walnut.
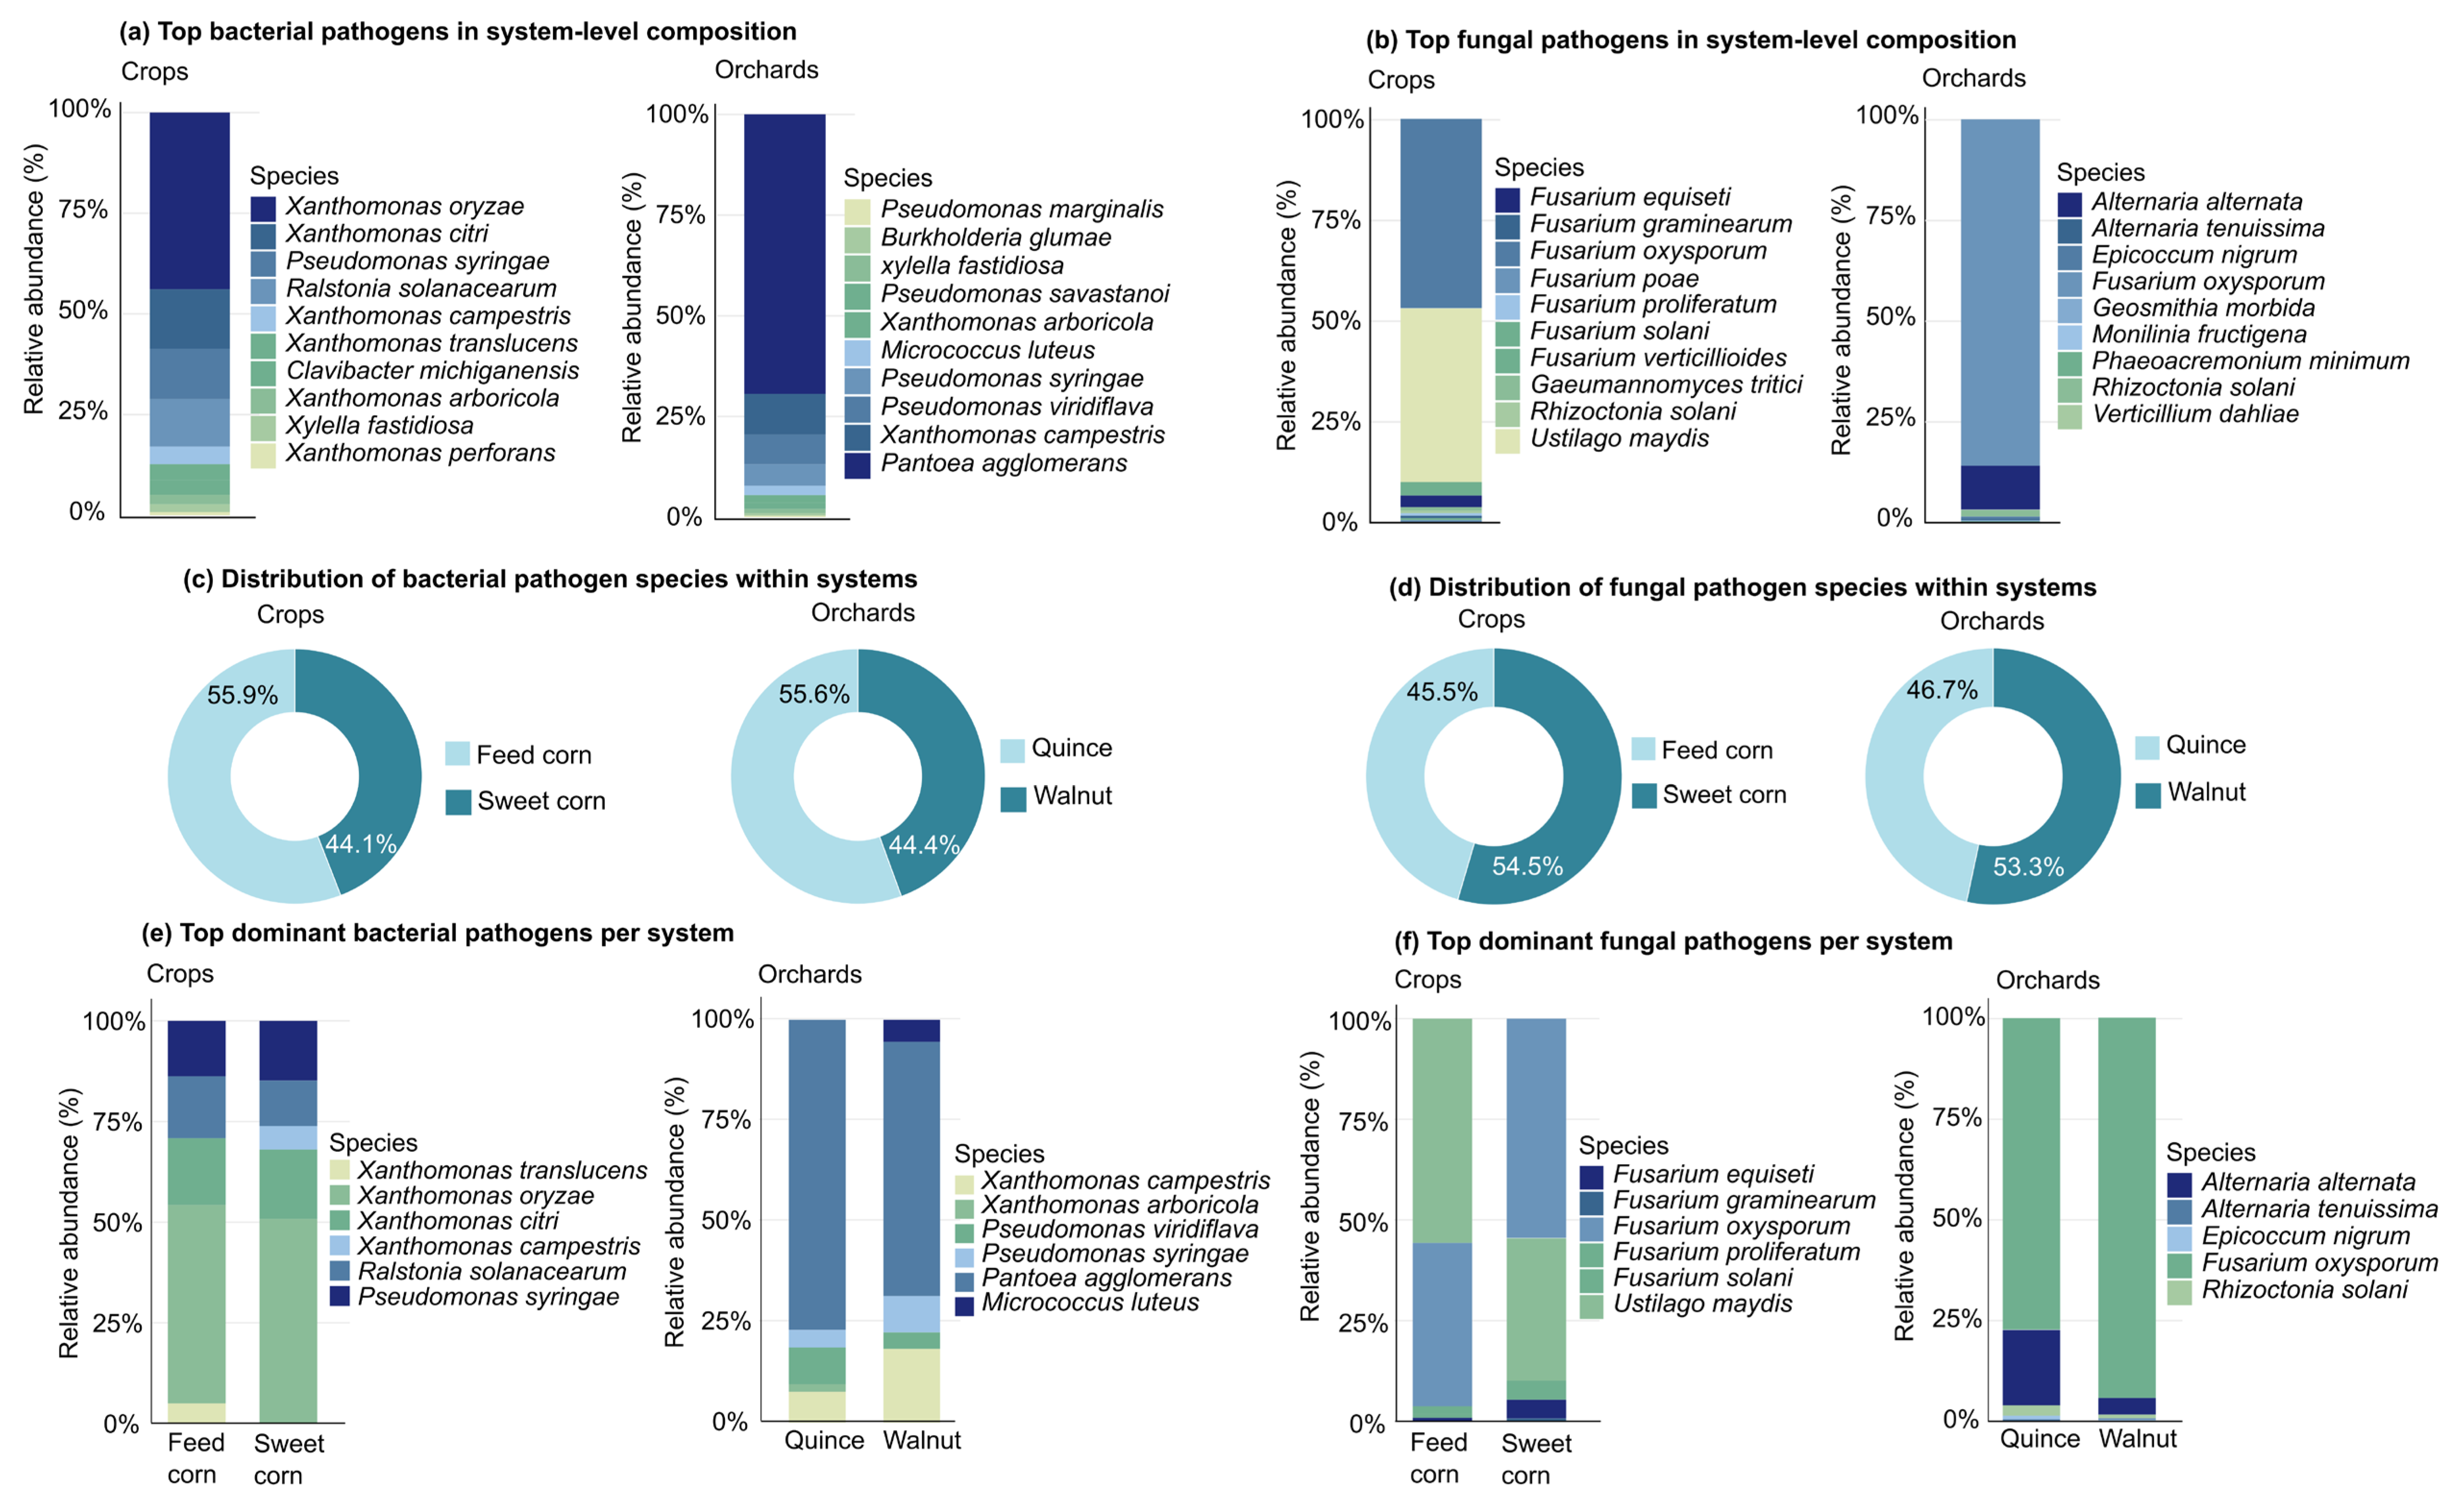
Figure 14.
Prevalence patterns of bacterial and fungal pathogens across crop and orchard systems based on species-level microbial profiling. Panels (a) and (b) show the prevalence of bacterial pathogens in crop (feed corn and sweet corn) and orchard (quince and walnut) systems, respectively, whereas panels (c) and (d) present the corresponding fungal pathogen prevalence patterns. Prevalence was calculated as the proportion of samples within each crop type in which a pathogen species was detected and is expressed as a percentage. Only pathogen species detected in at least one sample were included in the analysis. Pathogens are ordered according to their mean prevalence within each system. Color intensity reflects prevalence, with darker colors indicating more consistently detected pathogens. Numerical values within cells represent prevalence percentages and indicate the frequency of pathogen occurrence across samples rather than their relative abundance.
Figure 14.
Prevalence patterns of bacterial and fungal pathogens across crop and orchard systems based on species-level microbial profiling. Panels (a) and (b) show the prevalence of bacterial pathogens in crop (feed corn and sweet corn) and orchard (quince and walnut) systems, respectively, whereas panels (c) and (d) present the corresponding fungal pathogen prevalence patterns. Prevalence was calculated as the proportion of samples within each crop type in which a pathogen species was detected and is expressed as a percentage. Only pathogen species detected in at least one sample were included in the analysis. Pathogens are ordered according to their mean prevalence within each system. Color intensity reflects prevalence, with darker colors indicating more consistently detected pathogens. Numerical values within cells represent prevalence percentages and indicate the frequency of pathogen occurrence across samples rather than their relative abundance.
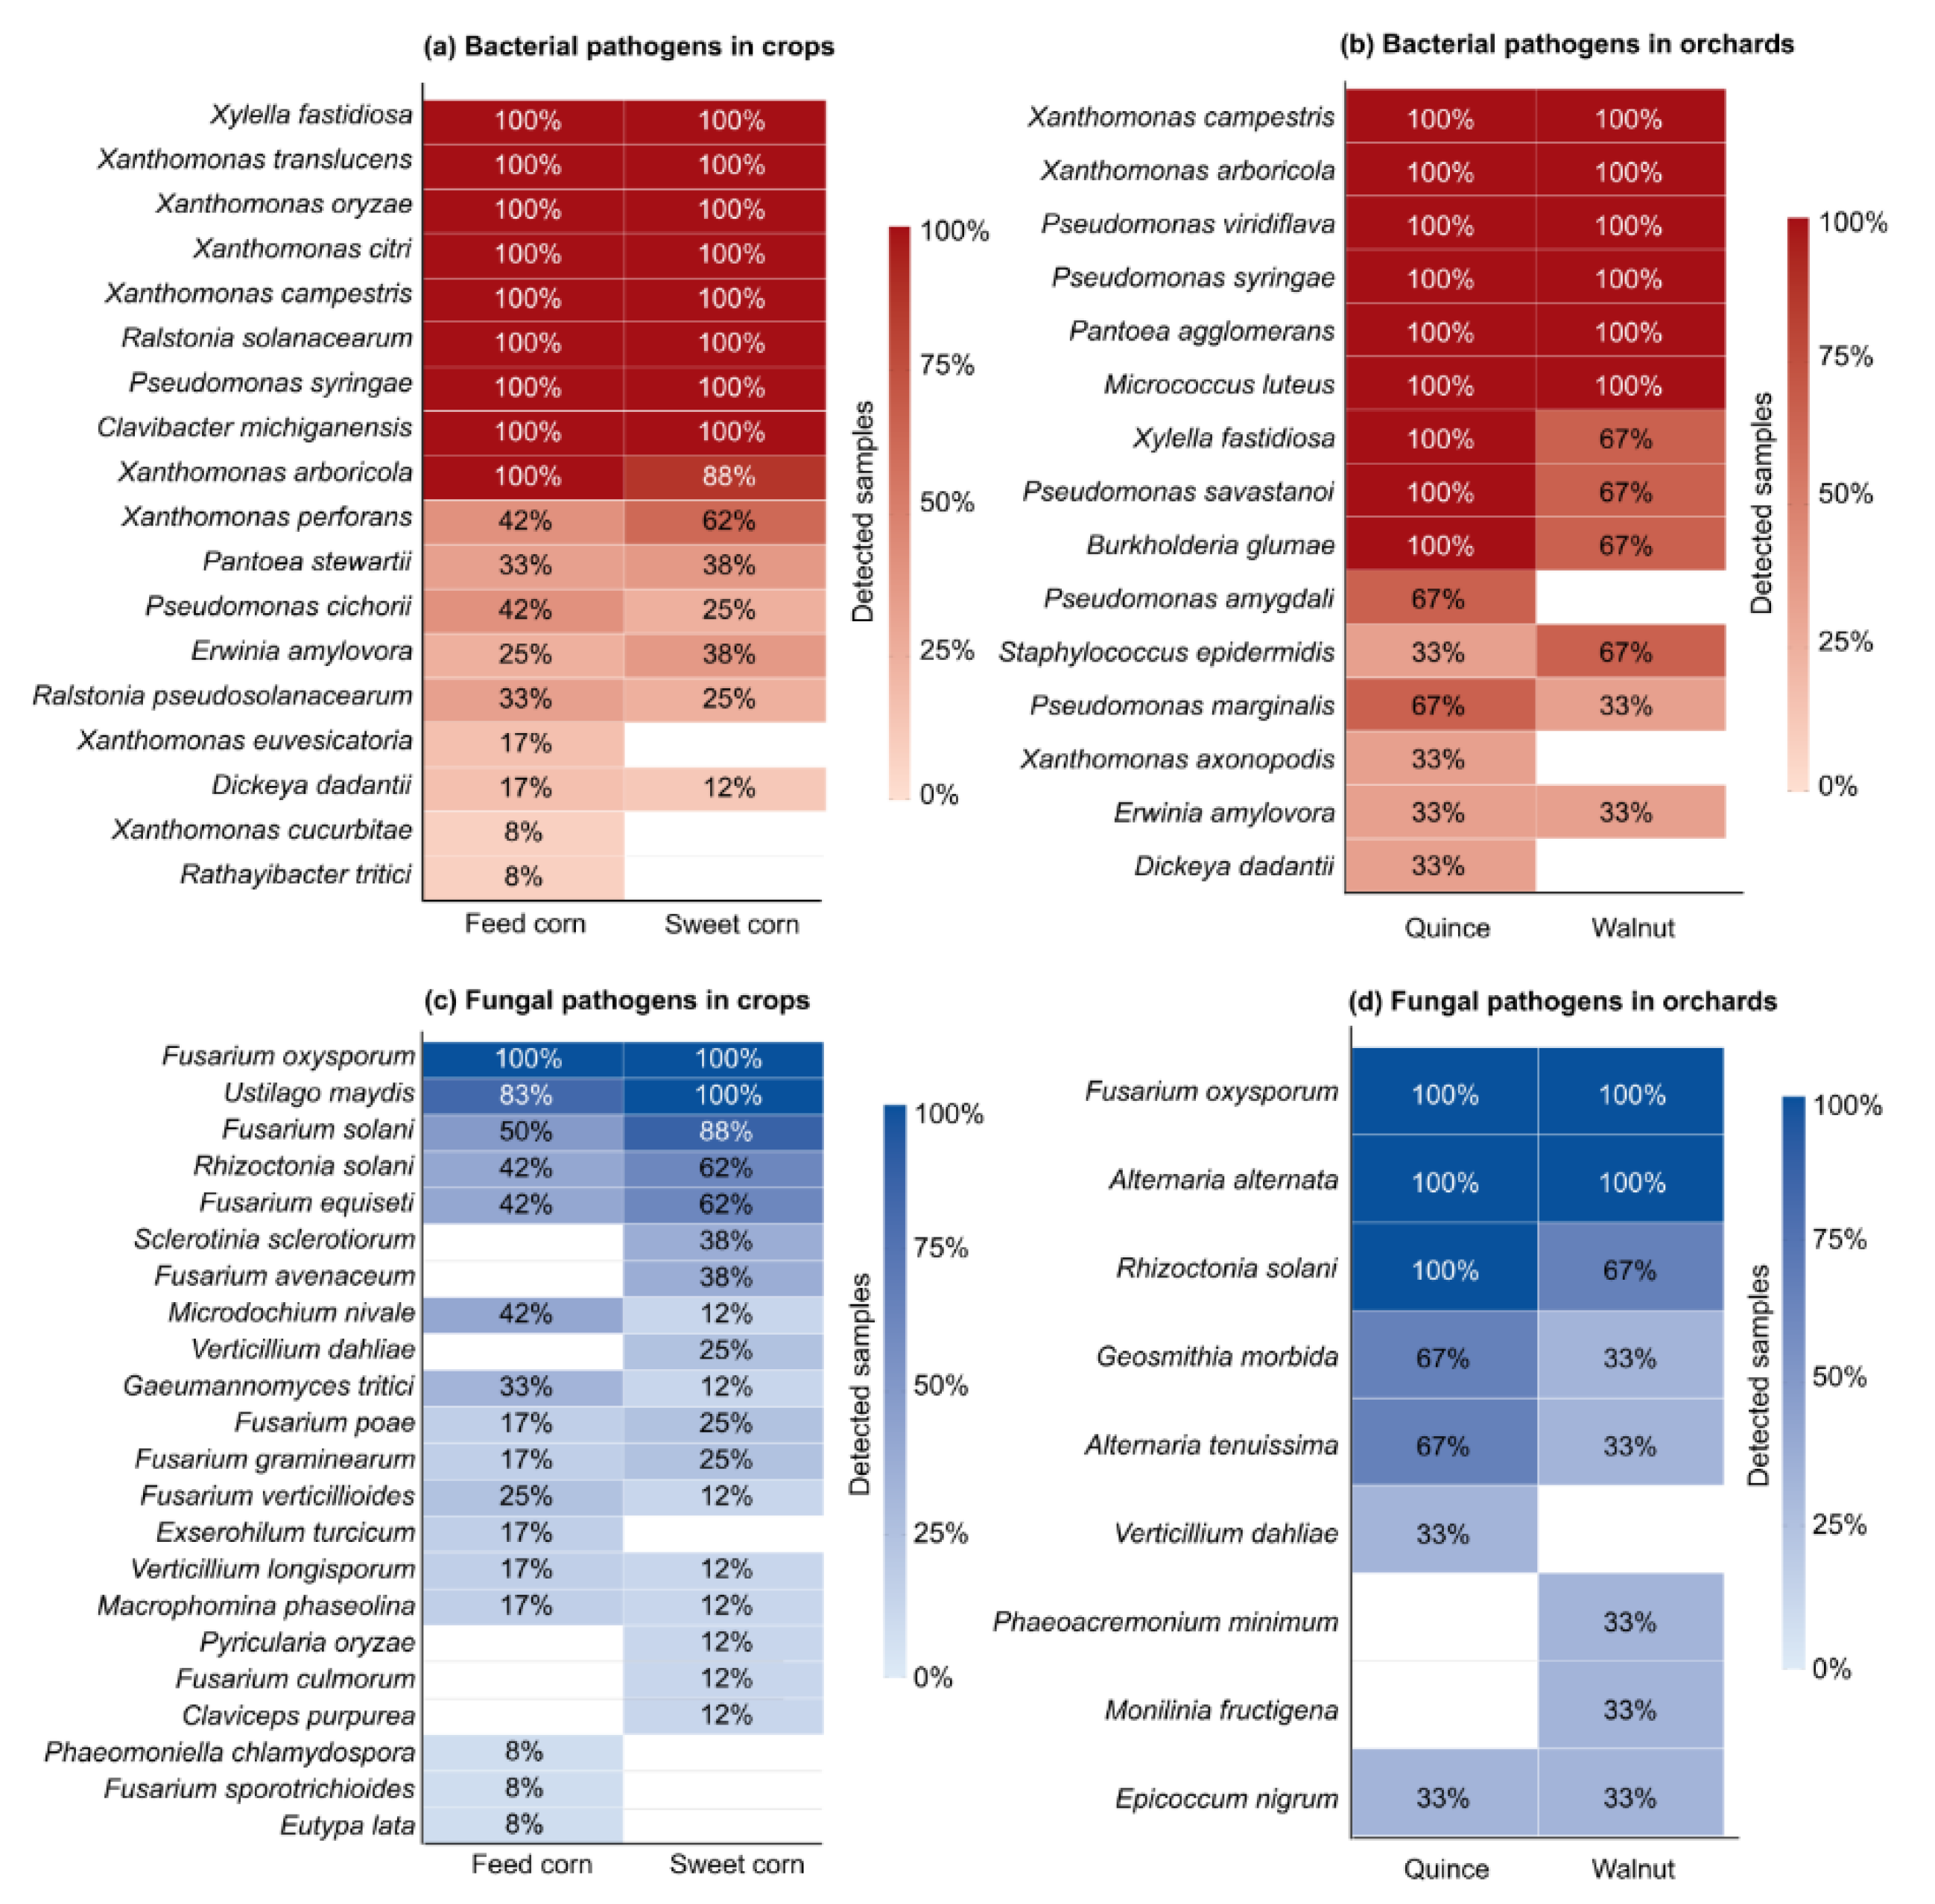
Figure 15.
Depth-related distribution and mean abundance of crop-associated pathogens in agricultural soils. Panels show (a) bacterial and (b) fungal pathogens detected in crop systems (feed corn and sweet corn) across three soil depth intervals (0–30, 31–60, and 61–90 cm). Heatmap color intensity and bubble size both represent mean pathogen abundance calculated across all samples within each depth layer. Only pathogens included in the curated crop-specific pathogen lists and detected in the dataset are shown. This combined heatmap–bubble visualization highlights pathogen persistence, depth-specific occurrence patterns, and changes in abundance across the soil profile.
Figure 15.
Depth-related distribution and mean abundance of crop-associated pathogens in agricultural soils. Panels show (a) bacterial and (b) fungal pathogens detected in crop systems (feed corn and sweet corn) across three soil depth intervals (0–30, 31–60, and 61–90 cm). Heatmap color intensity and bubble size both represent mean pathogen abundance calculated across all samples within each depth layer. Only pathogens included in the curated crop-specific pathogen lists and detected in the dataset are shown. This combined heatmap–bubble visualization highlights pathogen persistence, depth-specific occurrence patterns, and changes in abundance across the soil profile.
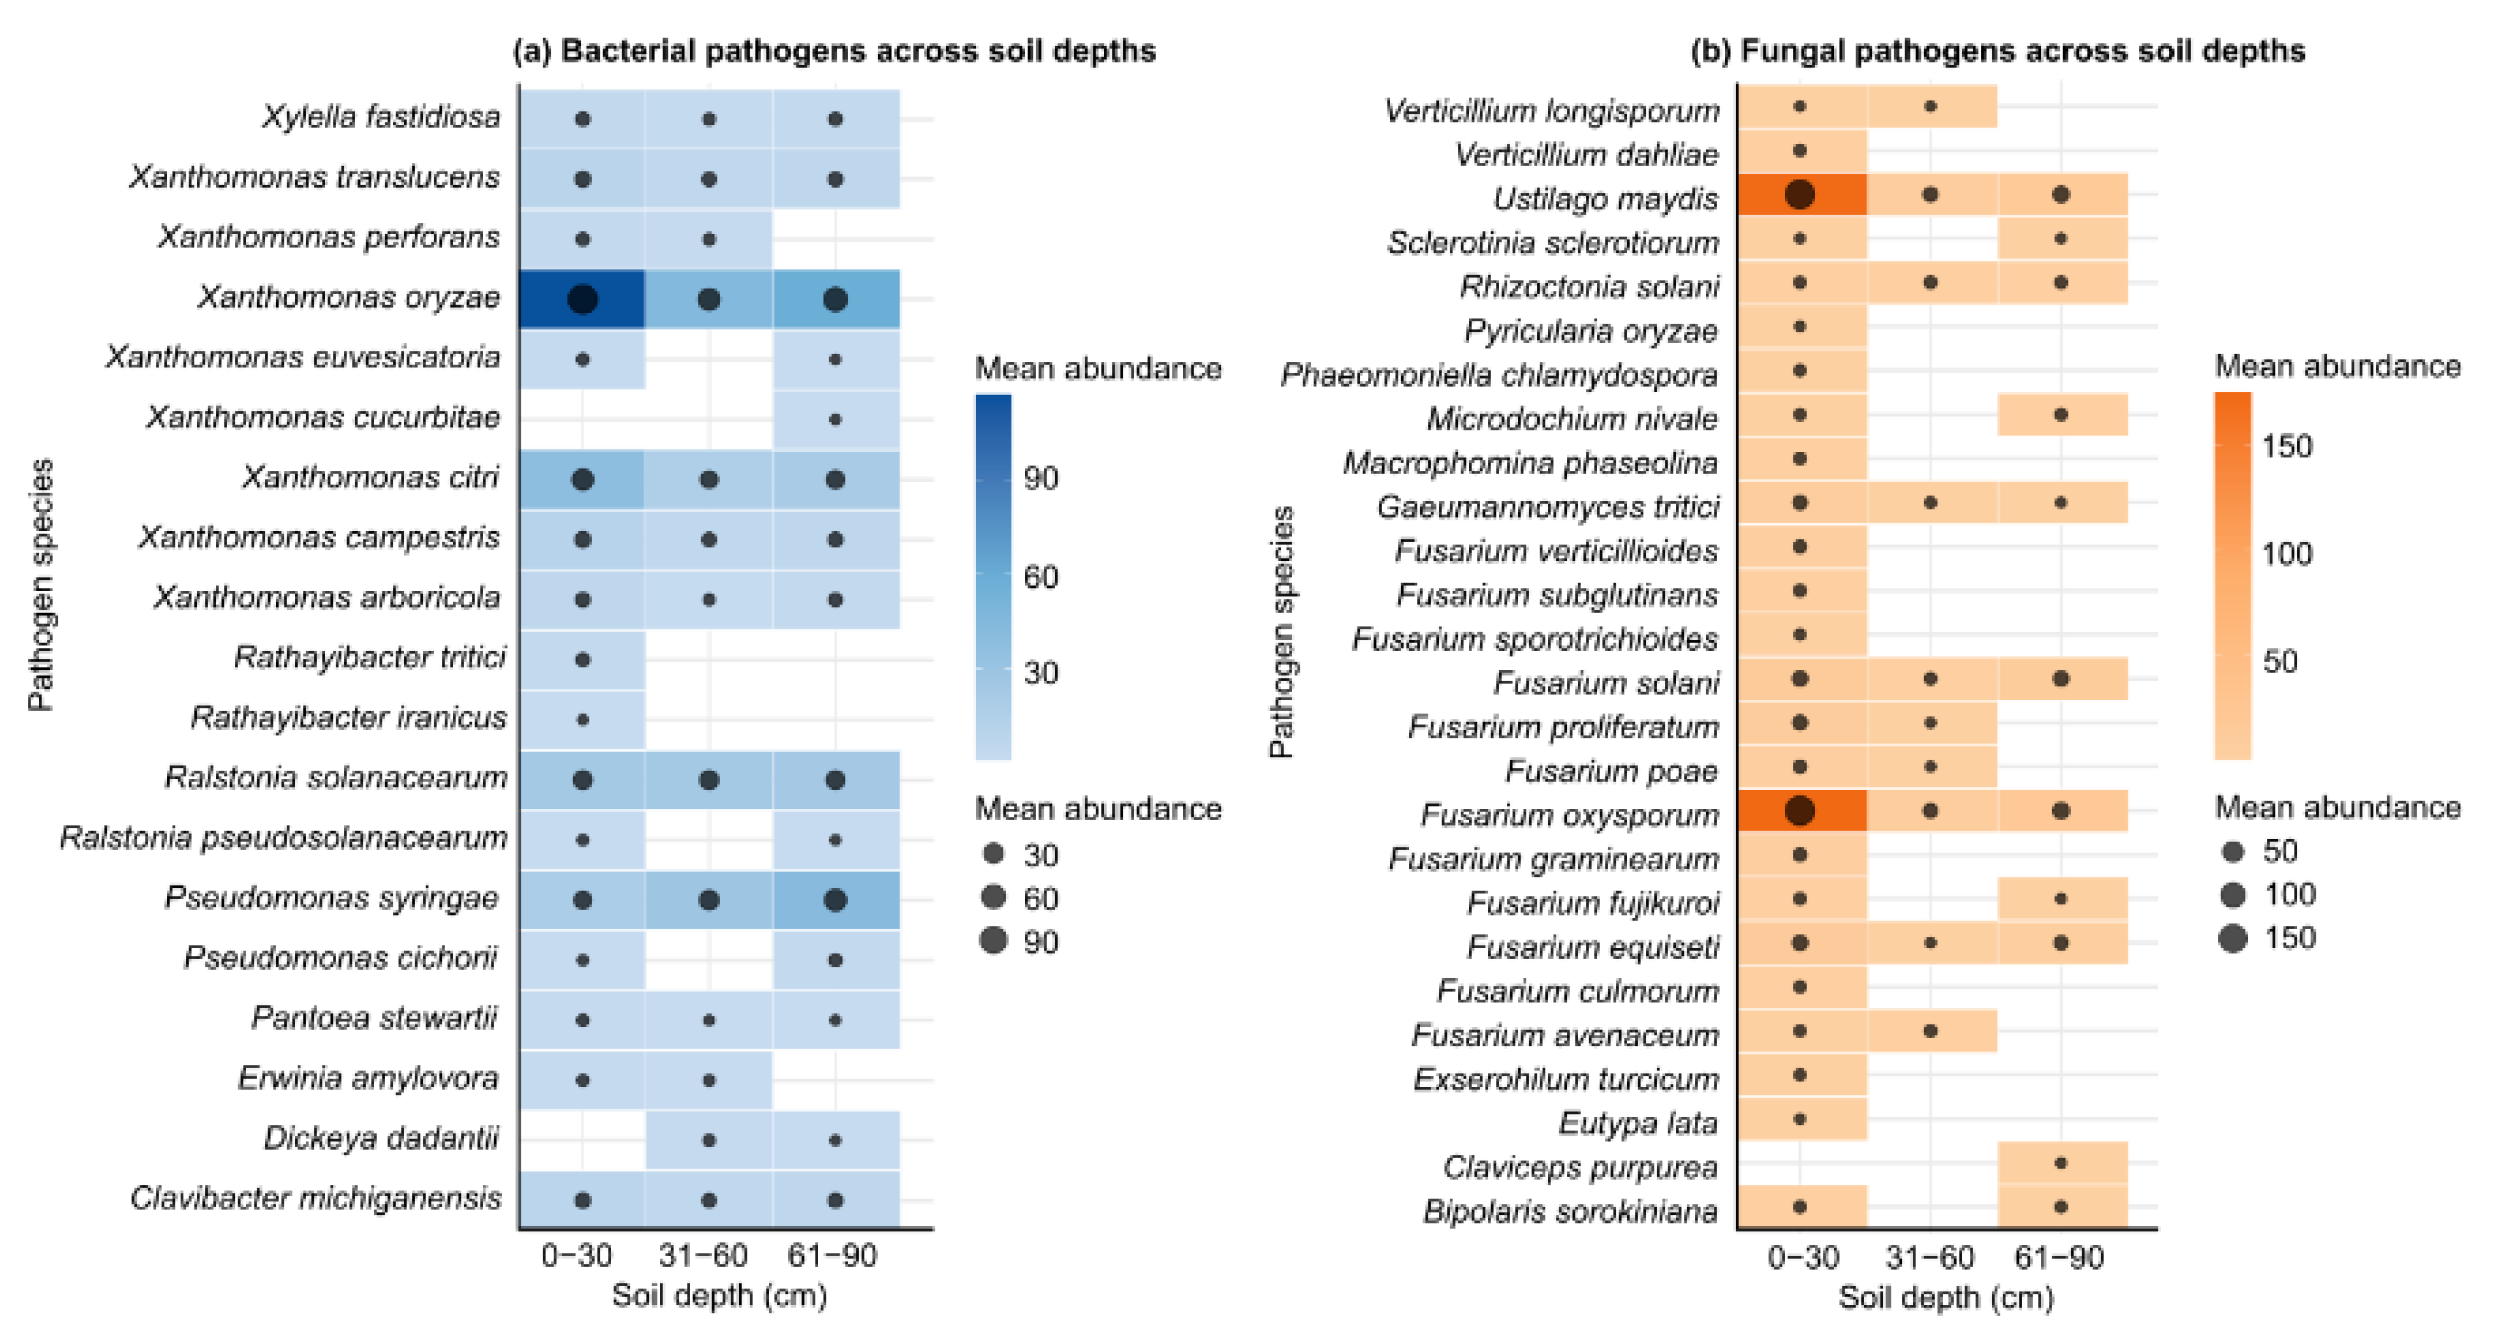
Figure 16.
Relationships between soil physicochemical properties and the most abundant plant-pathogenic microorganisms in crop and orchard systems. Panels (a) and (b) show Pearson correlation coefficients between fungal pathogen abundance and soil properties in crops and orchards, respectively, while panels (c) and (d) present the corresponding analyses for bacterial pathogens. Heatmap colors represent the direction and strength of correlations, ranging from negative (blue) to positive (orange) relationships. Asterisks indicate statistically significant correlations (* p < 0.05, ** p < 0.01, *** p < 0.001). Only the ten most abundant pathogens within each system were included. Soil variables comprise pH, humus content, CaCO₃, nitrate, available P₂O₅, available K₂O, and WSS where available.
Figure 16.
Relationships between soil physicochemical properties and the most abundant plant-pathogenic microorganisms in crop and orchard systems. Panels (a) and (b) show Pearson correlation coefficients between fungal pathogen abundance and soil properties in crops and orchards, respectively, while panels (c) and (d) present the corresponding analyses for bacterial pathogens. Heatmap colors represent the direction and strength of correlations, ranging from negative (blue) to positive (orange) relationships. Asterisks indicate statistically significant correlations (* p < 0.05, ** p < 0.01, *** p < 0.001). Only the ten most abundant pathogens within each system were included. Soil variables comprise pH, humus content, CaCO₃, nitrate, available P₂O₅, available K₂O, and WSS where available.
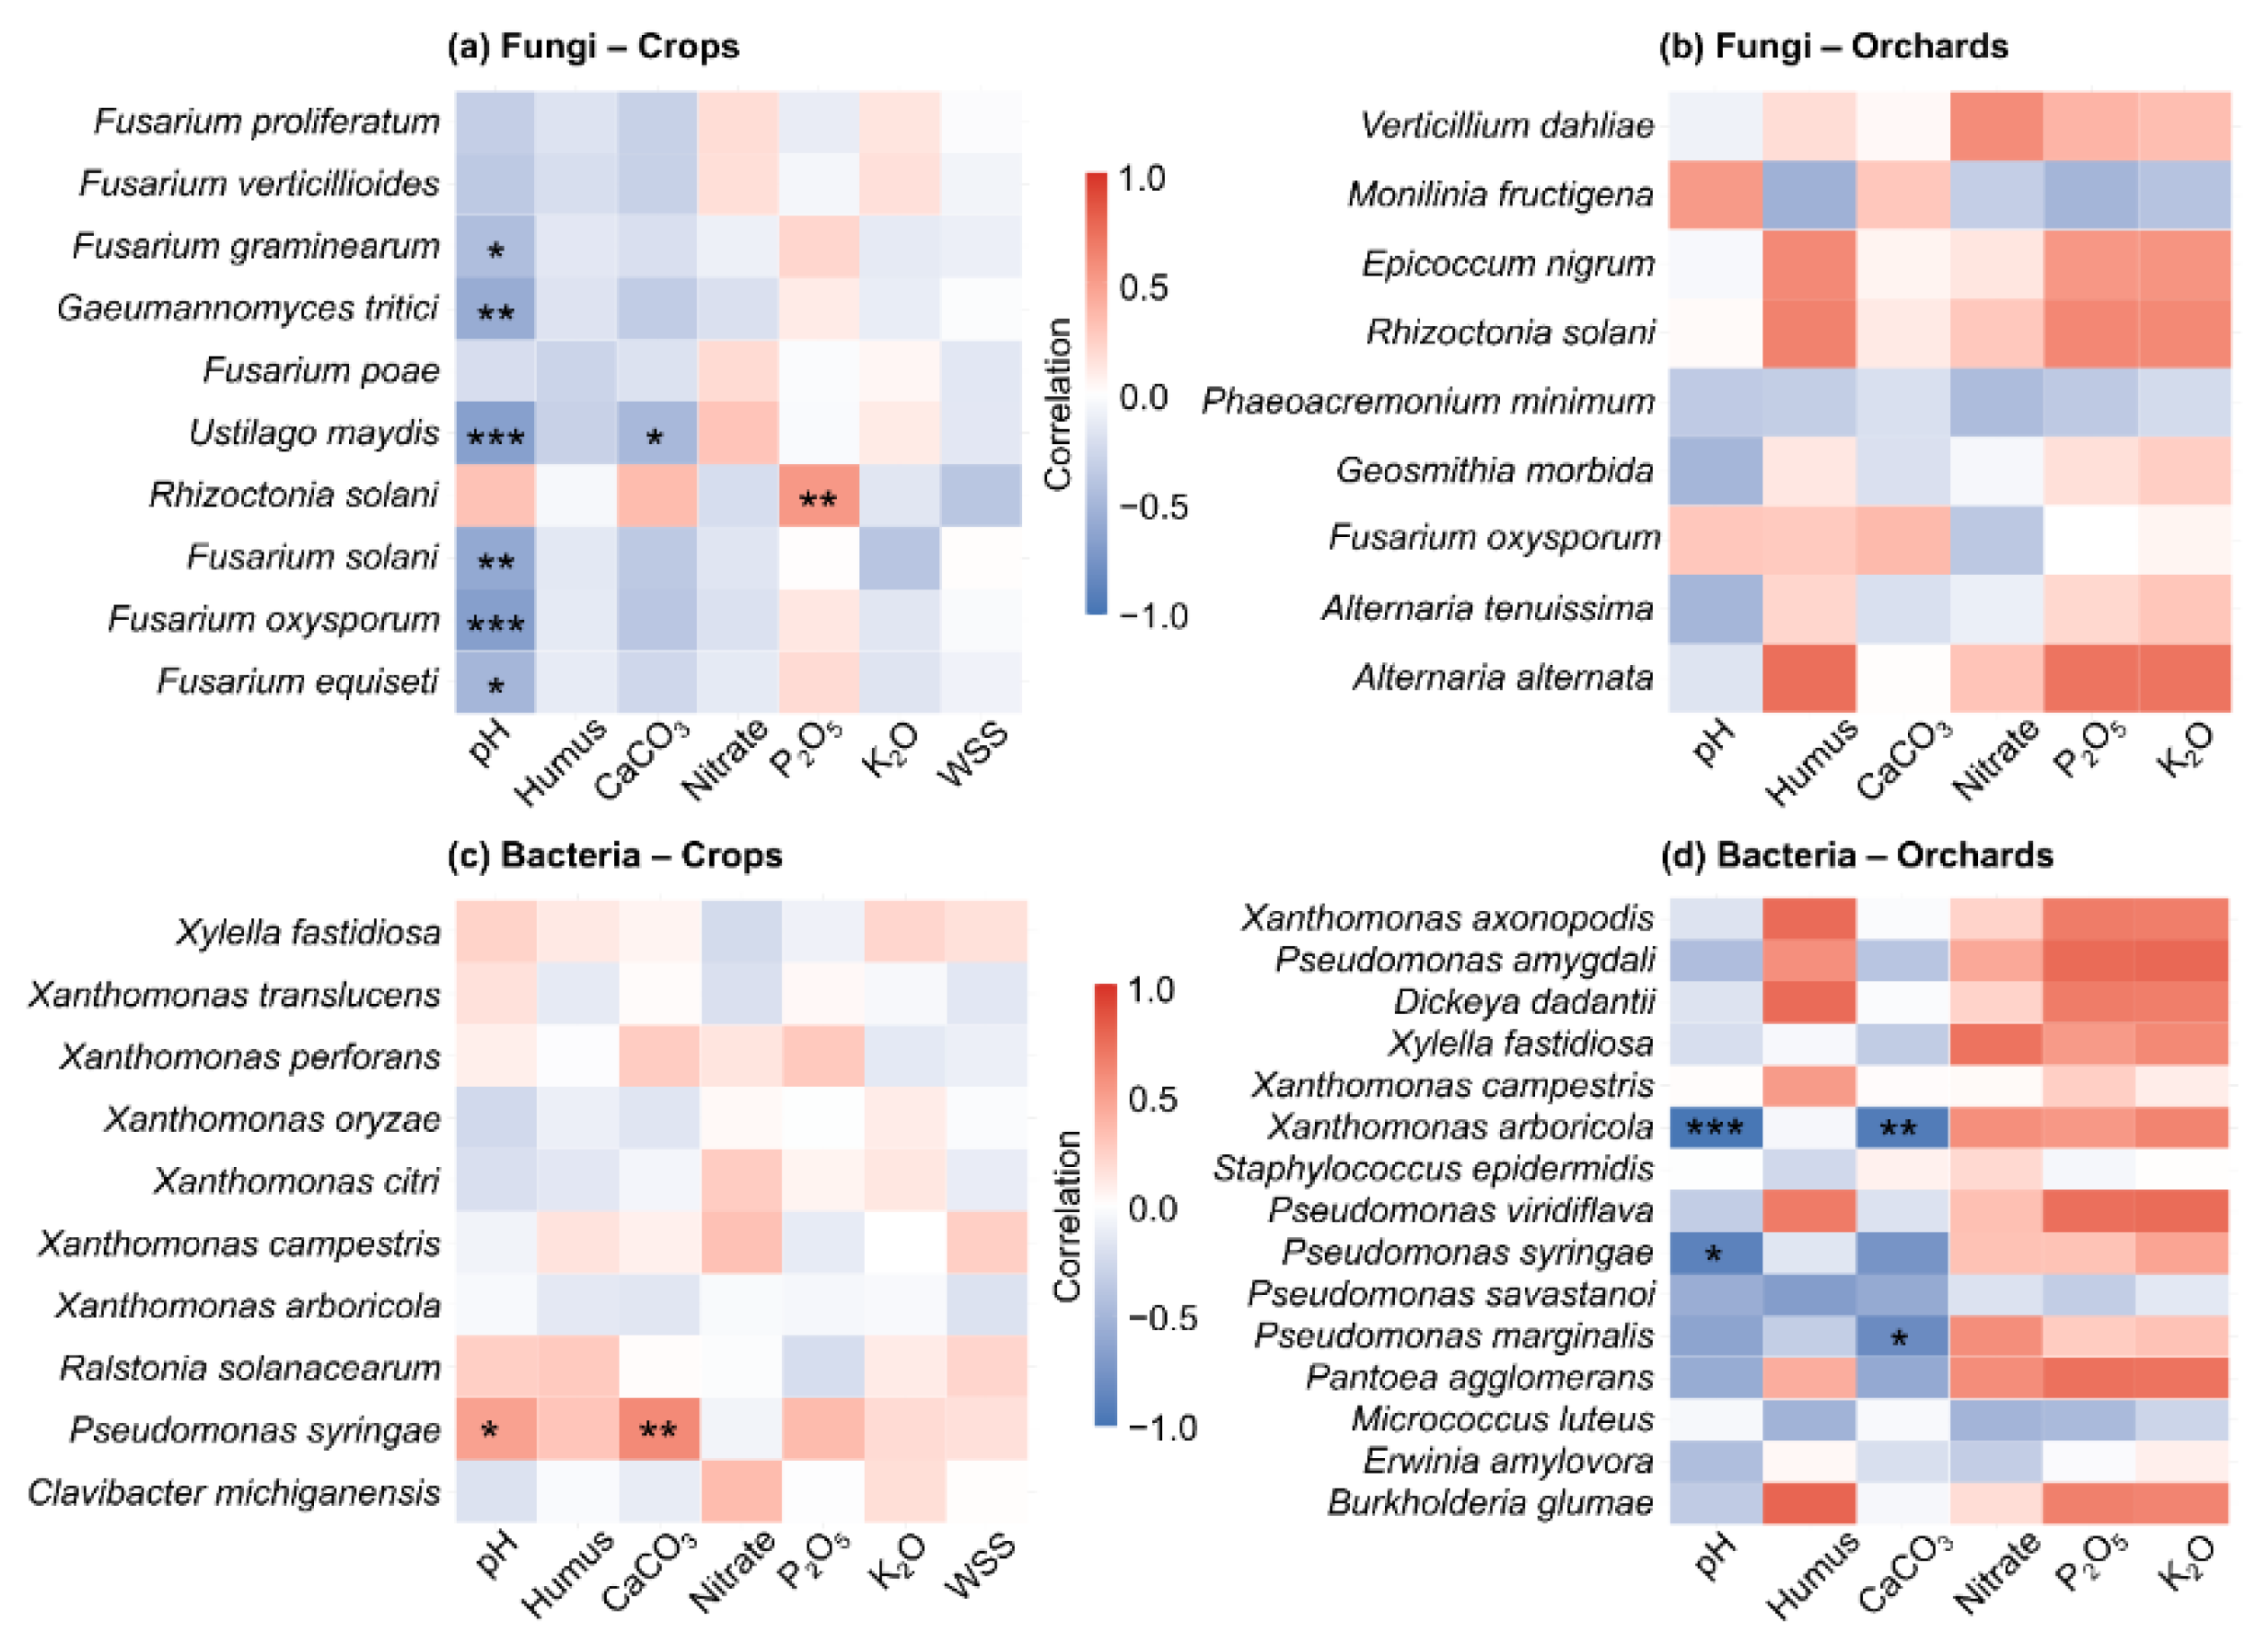
Disclaimer/Publisher’s Note: The statements, opinions and data contained in all publications are solely those of the individual author(s) and contributor(s) and not of MDPI and/or the editor(s). MDPI and/or the editor(s) disclaim responsibility for any injury to people or property resulting from any ideas, methods, instructions or products referred to in the content. |
© 2026 by the authors. Licensee MDPI, Basel, Switzerland. This article is an open access article distributed under the terms and conditions of the Creative Commons Attribution (CC BY) license (http://creativecommons.org/licenses/by/4.0/).
Copyright: This open access article is published under a Creative Commons CC BY 4.0 license, which permit the free download, distribution, and reuse, provided that the author and preprint are cited in any reuse.


