

Submitted:
04 July 2026
Posted:
07 July 2026
You are already at the latest version
Abstract
Airborne microplastics (AMPs) are increasingly recognized as an emerging air pollutant. However, observational data remains scarce in Southeast Asia. This study provides the first observations of AMPs in Phnom Penh, Cambodia, using µFTIR-ATR imaging. Number concentration, morphology, polymer composition, aerodynamic size distribution, Feret diameter, and surface aging characteristics were investigated together with meteorological parameters, gaseous pollutants, water-soluble ionic tracers, and HYSPLIT backward trajectories for source attribution. AMPs were dominated by polyethylene (PE), polypropylene (PP), and polyethylene terephthalate (PET), with 52% classified as fragments and 82% having Feret diameters smaller than 30 µm. AMP concentrations ranged from 0.55 to 1.27 MP m-3 in TSP (mean: 0.97 ± 0.30 MP m-3, n = 134) and from 0.23 to 0.49 MP m-3 in PM2.5 (mean: 0.33 ± 0.10 MP m-3, n = 46). Carbonyl and hydroxyl indexes indicate that PE and PP were relatively fresh and in low-to-moderate photo-oxidative aging states. Correlation analysis further indicates that PE and PP were mainly associated with local waste fragmentation, whereas PET was linked to precipitation scavenging and resuspension processes. In addition, HYSPLIT backward trajectories suggest regional transport of AMPs by the Southwest Monsoon from marine source regions, including the Indian Ocean, Arabian Sea, and Andaman Sea. These findings provide the first baseline dataset for AMP pollution in Phnom Penh, Cambodia and highlight the combined importance of local emissions and regional atmospheric transport in Southeast Asia.
Keywords:
µFTIR-ATR imaging
; surface aging
; precipitation scavenging
; sea spray aerosol
; Southwest Monsoon
1. Introduction
Airborne microplastics (AMPs), plastic particles smaller than 100 µm suspended in the atmosphere and potentially incorporated into cloud or fog droplets, have emerged as a critical environmental pollutant. Unlike marine microplastics (MMPs) or soil microplastics (SMPs), generally defined as plastic particles smaller than 5 mm, AMPs can undergo regional to long-range atmospheric transport from populated to remote regions, including high-altitude mountains [1,2] and polar regions [3,4]. Recent studies have further suggested that meteorological conditions, including precipitation scavenging, atmospheric circulation, and monsoonal transport, strongly influence the transport and deposition behavior of AMPs [5]. Despite the increase in AMP research, studies remain heavily concentrated in Europe, North America, China, and Japan, with limited coverage across Southeast Asia. Southeast Asia remains poorly characterized, even though it is one of the world’s major centers of plastic production, consumption, and mismanaged plastic wastes [6,7]. Recent regional assessments have further highlighted the severe lack of microplastic observations across ASEAN countries, particularly for airborne microplastics [8]. In addition, Southeast Asia faces documented challenges in municipal solid waste (MSW) management, including inadequate waste collection infrastructure and widespread open burning practices that may contribute significantly to the release, fragmentation, and atmospheric resuspension of plastic particles, particularly in Cambodia [8,9].
In Cambodia, waste management infrastructure remains insufficient to cope with the increasing MSW generation, estimated at approximately 4.09 million tons annually, of which 21% consists of plastic wastes, excluding 12% of plastic-containing materials such as textiles, nappies, and elastomers [9,10,11,12]. It has been reported that 46% of MSW remains uncollected, while 44% is disposed of in unsanitary landfills [10,11]. Nevertheless, only 5% of total plastic waste is properly managed, whereas the remaining fraction is associated with landfilling, littering, or open burning. Large fractions of mismanaged plastic wastes are associated with open-waste burning, including 16% at landfill sites and 29% by citizens, followed by 32% terrestrial disposal, 10% aquatic disposal, and 8% undocumented pathways [9]. Such mismanaged plastic waste may represent an important precursor for microplastic formation through weathering, fragmentation, and resuspension processes. These plastic waste concerns raise disproportionate risks to environmental ecosystem and public health following fragmentation into microplastics (MPs).
Few studies have detected MPs in Cambodia’s terrestrial and aquatic environments. Tun et al. [13] discovered that MPs widely distributed in burned landfill soil, ranging from 7475 to 1205019 MP kg-1, with 73% of particles measuring 100 - 1000 µm. Mendrik et al. [14] reported on MPs in Mekong River water at concentrations of 0.013 – 0.040 MP L-1, with 53% of plastic particles measuring 100 - 1000 µm, while Babel and Dork [15] reported higher MP concentrations of 1180 - 1463 MP L-1 in river water sources used for water treatment systems, with 60% of plastic particles measuring 6.5 - 53 µm. The number of concentrations may vary due to the plastic size distribution and analytic methods. Polymer compositions were majorly dominated by polyethylene terephthalate (PET), polyethylene (PE), and polypropylene (PP), with fragments and fiber as the dominant morphologies [13,14,15]. To date, the documented MP studies in Cambodia have been limited primarily to terrestrial and aquatic environments [6,7]. However, airborne microplastic (AMPs), which potentially represent one of the most direct pathways for human exposure via inhalation, remains entirely uncharacterized in Cambodia.
This study aims to provide the first comprehensive observations of AMPs in Phnom Penh, Cambodia. AMP characteristics are examined, including number concentration, morphology, polymer composition, aerodynamic size distribution, Feret diameter, and surface aging. Possible AMP sources and transport pathways are interpreted using Pearson correlation analysis among AMP characteristics, meteorological variables, gaseous pollutants, and water-soluble ionic tracers. HYSPLIT backward trajectories are also applied for possible AMP transport pathways. Finally, the regional context of AMPs in Cambodia is discussed in comparison with that of Asian countries.
2. Materials and Methods
2.1. Sampling Techniques
AMPs were collected at the rooftop of Building A (approximately 16 m above ground level), Institute of Technology of Cambodia (ITC), Phnom Penh, Cambodia (11°34’12.71”N, 104°53’50.48”E) from September 1 to13, 2025, with 72-hour sampling intervals (Figure 1). A multi-nozzle cascade impactor (MCI) sampler model NL-20-2.5A (Tokyo Dylec Corp., Japan) was used to segregate particles, including AMPs, according to aerodynamic diameters (da), into three size fractions: da > 10 µm (PM10+), 2.5 < da ≤ 10 µm (PM10–2.5), and da ≤ 2.5 µm (PM2.5). The flow rate was set at 20 L min-1 using a low volume suction pump model LVS-30 (Sibata, Japan). Two filter shapes of PTFE-glass fiber binder filters model Pallflex TX40HI20WW (Pall Corporation, USA) were used in this experiment: two donut-shaped filters ( 47 mm centered with a 20 mm hole) for PM10+ and PM10–2.5, and one full-circle filter ( 47 mm) for PM2.5. After sampling, the filters were folded in half, packed in aluminum foil, sealed in zip-locks, and then stored in a refrigerator at 4 °C for further analysis.
In addition, meteorological variables (temperature, humidity, wind speed, wind direction, precipitation, and solar radiation) and gaseous pollutants (NO, NO2, NOx, SO2, CO, and O3) were monitored using an Air Quality Monitoring System (AQMS; Horiba, Japan), whereas particulate matter (PM) and optical black carbon (OBC) were monitored using a PM monitor model PM-712 (Kimoto, Japan).
2.2. Sample Pretreatment
The sample pretreatment was carried out inside a clean bench (CT-600UVAD, AS ONE, Japan). All reagents were pre-filtered through hydrophilic PTFE membrane filters (0.45 µm pore size, 25 mm; JHWP02500, Omnipore, Ireland) before use. The sampled filter, immersed in 50 mL of ultrapure water in a glass centrifuge tube, was shaken for 1 hour at 500 rpm and then filtered through the membrane filter to remove dissolved organic and inorganic constituents. Organic matters and/or organic matter-bound AMPs were digested with 30% H2O2 (1st Grade, FUJIFILM Wako Pure Chemical Corporation, Japan) for 48 hours and then filtered through the membrane filter. Mineral matters were separated using NaI solution (1.5 g cm-3; Special Grade, FUJIFILM Wako Pure Chemical Corporation, Japan) by centrifugation for 1 hour at 2500 rpm. Most common plastics have densities lower than that of the NaI solution, including polyethylene (PE), polyethylene terephthalate (PET), polyvinyl chloride (PVC), polypropylene (PP), polystyrene (PS), acrylonitrile butadiene styrene (ABS), polymethyl methacrylate (PMMA), and polyamide (PA) [16]. The AMP-enriched supernatant was filtered onto a 4-mm-diameter filtration spot of an alumina membrane filter (0.2 µm pore size, 25 mm; Anodisc®, Whatman, UK). Ultrapure water and 96 vol% ethanol (FUJIFILM Wako Pure Chemical Corporation, Japan) were used to rinse glass tubes and filtration apparatus in all pretreatment stages (Figure 2). The recovery efficiency of total AMPs, evaluated during two of the five density-separation procedures, was approximately 70%, with hydrophilic polymers such as PET, PC, and PA showing higher recovery efficiencies than hydrophobic polymers such as PE, PP, and PE/PP. The alumina membrane filter was kept in a glass Petri dish and dried in a desiccator for further analysis by micro-Fourier Transform Infrared Spectroscopy with Attenuated Total Reflection Imaging (µFTIR-ATR imaging; Spectrum3/Spotlight 400, PerkinElmer, USA).
2.3. Sample Analysis
As shown in Figure 2, AMPs were measured using µFTIR-ATR imaging equipped with a Cassegrain objective and a high-refractive-index germanium (GE) ATR crystal (refractive index of 4.0). The measurement area consisted of nine areas (750 µm × 750 µm), corresponding to a filter coverage ratio of 40.3%. AMP candidates were screened based on C-H (3000–2700 cm-1) and C=O (1740–1710 cm-1) stretching vibration bands. With a pixel size of 1.56 µm, AMPs can be theoretically detected at diameters of approximately 1.5 µm or larger [17,18]. After atmospheric correction and Savitzky–Golay (SG) smoothing, polymer compositions were identified using the hit quality index (HQI) based on the Spectrum 10 library and an original AMP spectral library. Search results with HQI values ≥ 0.9 were accepted directly, whereas particles with HQI values between 0.4 and 0.9 were further identified based on confirmation of characteristic absorption bands and functional groups to minimize false-positive and false-negative results. In addition, the Feret diameter of AMPs was measured by ImageJ v.1.54g after principal component analysis (PCA), using a threshold defined as the mean blank signal plus 5σ. The morphology of AMPs was classified based on the ratio of the maximum to minimum Feret diameters as follows: granule (< 1.2), fragment (≥ 1.2 to < 3.0), and fiber (≥ 3.0) [1,18].
Photo-oxidative aging was evaluated for PE and PP based on the carbonyl index (CI) and hydroxyl index (HI). CI was calculated as the ratio of the maximum absorbance of carbonyl stretching vibrations (C=O; 1715 cm-1) to the maximum absorbance of methylene stretching vibrations (CH2; 2920 cm-1). HI was calculated as the ratio of the maximum absorbance of hydroxyl stretching vibrations (OH; 3467 cm-1) to the maximum absorbance of the same reference band. The degree of degradation was categorized as low (< 0.15), medium (≥ 0.15 to < 0.30), and high (≥ 0.30) [1].
The filtrate obtained during the water extraction stage of pretreatment (Section 2.2) was further analyzed using an ion chromatograph (Dionex AS-AP, DX - 1000 equipped with an IonPac CS14) for cations and an ion chromatograph (Dionex Corp., DX - 320 equipped with an IonPac AS4A - SC) for anions. Five cations (Na+, NH4+, K+, Mg2+, Ca2+) and three anions (Cl-, NO3-, SO42-) were examined.
2.4. Quality Control and Blank Tests
The sample pretreatment stage was essential for preparing AMP samples. Plastic materials were avoided as much as possible to prevent sample contamination; metal forceps, glass Petri dishes, glass filtration apparatus, cotton laboratory coat, powder-free nitrile gloves, cotton gloves, and tissue papers were used. All tools were cleaned ultrasonically before use. Reagent blanks, operational blanks, and filter blanks were performed to ensure the reliability of the analytical procedure. No MPs were detected in any blank procedure.
2.5. Backward Trajectory of Air Mass
The transport pathways of air mass was examined by using backward trajectory model, called the Hybrid Single-Particle Lagrangian Integrated Trajectory (HYSPLIT) (http://www.arl.noaa.gov/ready/hysplit4.html) developed by the National Oceanic and Atmospheric Administration (NOAA) as well as the obtained meteorological data, GDAS 1.0 degree (https://www.ready.noaa.gov/index.php) [19,20]. In this study, 120-h backward trajectories were performed every hour during the sampling periods, starting at 500 m altitude.
3. Results and Discussion
3.1. Characteristics of AMPs
Number concentrations and polymer composition of AMPs by aerodynamic size fraction are shown in Figure 3 . Feret diameter distribution and morphology are also presented for each sampling period. During the sampling periods from September 1 to 13, 2025, a mean AMP number concentration was 0.97 ± 0.30 MP m-3 (ranging from 0.55 to 1.27 MP m-3), whereas respirable AMP2.5 exhibited a mean number concentration of 0.33 ± 0.10 MP m-3 (ranging from 0.23 to 0.49 MP m-3; n = 46), equivalent to 34% of AMPTSP. Higher concentrations were observed in the latter half of the sampling period, likely due to reduced precipitation scavenging associated with lower rainfall amount and frequency, as well as enhanced resuspension of particles from the ground surface compared to the earlier period [21,22]. Weak surface winds and lower rainfall intensity (Table S1) also affected AMP concentration during the earlier period [5]. Further explanation can be found in Section 3.3.
A total of 14 polymer types were detected, including polyethylene (PE), polypropylene (PP), polyethylene terephthalate (PET), polystyrene (PS), polyvinyl chloride (PVC), silicone resin (SI), acrylic resin-group polymers (AR) such as styrene butadiene methacrylate (SBMA) and polymethyl methacrylate (PMMA), other thermoplastic polymers including ethylene vinyl acetate (EVA), polyvinyl alcohol (PVA), nylon 6 (N6), and acrylonitrile styrene (AS), and thermosetting polymers including polyurethane (PUR), and polydially phthalate (PDAP). Major polymer types were dominated by PP (33%), PE (20%), and PET (17%) throughout the studied periods. These polymers are commonly used in plastic bottles, caps, straws, bags, containers, and packaging materials, which are frequently observed in the landfills. Such single-use plastic wastes accounted for approximately 13% of the total wastes followed by textile (8%), diapers (3%), and elastomer materials (1%), whereas recyclable and non-recycle plastic wastes accounted for 0.3% and 7.1%, respectively [10,11,12]. Previous studies in Cambodia have also reported high concentrations of MPs, dominated by PE, PP, and PET in burned landfill soil [13] and Mekong river systems [14,15]. Additionally, EVA contributed 7%, which is frequently used in footwear and floor mat application. PS and PUR were detected at relatively low abundances (4% each), possibly reflecting contributions from sealant and building materials [23], similar to trace concentrations of SBMA and PMMA derived from paints and coating materials [24]. These polymers may originate from nearby construction activities and/or weathering of building surface materials. Minor polymer types of PVC, SI, PVA, N6, AS, and PDAP were detected only at trace levels within specific size fractions and sampling periods.
Meanwhile, 52% of AMPs were fragments, indicating mechanical and photochemical degradation of plastic debris, whereas granules and fibers accounted for 18% and 6%, respectively. The remaining particles consisted of particles with indeterminate morphologies and particles below the particle detection threshold. Most particles below the detection threshold were PET, suggesting extensive fragmentation into submicron-sized particles. This result may reflect enhanced degradation of PET under high humidity and strong solar radiation (78.13 ± 3.37% and 864.30 ± 102.18 W m-2, respectively; Table S1), similar to the characteristics of PET observed in Siem Reap, Cambodia, reported by Niida et al. [17]. Therefore, AMP number concentrations were likely underestimated for submicron-sized particles.
Regarding Feret diameter distribution, 82% of AMPs fell into plastic sizes less than 30 µm, of which 65% were smaller than 20 µm. The mean plastic sizes ranged from 18.47 to 31.31 µm, and the minimum detected plastic size was 1.78 µm. Wang et al. [1] reported that tiny and fragmented AMPs, approximately 20 µm, can be readily transported over long distances in the atmosphere, particularly at high altitudes, thereby contributing to transboundary transport.
3.2. Degradation Evaluation
Carbonyl index (CI) and hydroxyl index (HI) for total PE (n = 27) and PP (n = 45) are illustrated in Figure 4. CIPE (mean 0.073 ± 0.084) and CIPP (mean 0.066 ± 0.064) were relatively low, indicating that AMPs were recently emitted into the atmosphere, whereas HIPE (mean 0.109 ± 0.087) and HIPP (mean 0.129 ± 0.121) ranged from low to intermediate, suggesting that AMPs were at an early stage of photo-oxidative aging led to surface change. However, several particles showed elevated HI values, with maximum HIPE and HIPP values reaching 0.391 and 0.564, respectively, suggesting prolonged atmospheric aging and oxidation processes. Higher HIPP relative to HIPE was consistent with the greater photo-oxidative susceptibility of PP, whose tertiary backbone carbons were more vulnerable to hydrogen abstraction and hydroperoxide formation than the secondary carbons of PE [25].
According to Niida et al. [17], PET observed in Siem Reap, Cambodia, underwent advanced photo-oxidative aging as compared with PET observed at Mt. Fuji, Tokyo, and Osaka, Japan. This tendency may apply to PET in Phnom Penh, Cambodia, given that PET exhibited a significant positive correlation with solar radiation, as discussed below (r = 0.995, p < 0.01). Rostampour et al. [26] reported that high humidity, such as that occurring under Cambodia’s wet monsoon conditions, can enhance hydrolysis processes by cleaving ester linkages, which may be further accelerated under strong solar radiation and elevated temperature. The photoexcitation of ester chromophores in the PET polymer backbone can promote oxidation reactions, leading to the formation of peroxy radicals and oxygen-containing functional groups, particularly carboxylic acids, as degradation byproducts [17,26,27]. In addition, the tropical environmental conditions observed in this study (Table S1), including high humidity (78.13 ± 3.37%), strong solar radiation (maximum 864.30 ± 102.18 W m-2), and elevated temperature (28.31 ± 0.58 °C), may provide favorable conditions for AMP surface aging. Such aging may generate surface cracks and increase oxygen-containing functional groups, thereby enhancing interactions with water molecules and potentially increasing particle density [26,27,28,29]. These results indicate that AMP surface properties may shift from hydrophobic to more hydrophilic characteristics, suggesting that aged AMPs may potentially act as cloud condensation nuclei (CCN) [1,30] or vectors for polar air pollutants [31,32]. The high degree photo-oxidative aging may suggest contributions from aged and potentially transported AMPs rather than exclusively local urban emissions.
3.3. Possible Sources and Atmospheric Influences of AMPs Based on Pearson Correlation Analysis
A Pearson correlation matrix between AMPs, meteorological variables, gaseous pollutants, and water-soluble ionic tracers was used to examine possible sources and atmospheric influences on AMP distributions in Phnom Penh, Cambodia, as shown in Figure 5 with complementary scatter plots from Figure S2 to Figure S9. Owing to the limited number of sampling periods, especially for polymer-specific correlations, the following interpretations should be regarded as indicative rather than definitive source attribution.
3.3.1. Meteorology
Regarding correlations between AMPs and meteorological variables, AMP10-2.5 and AMP2.5 showed apparent positive correlations with wind speed at r = 0.914 and r = 0.802, respectively, although these correlations did not reach statistical significances, p > 0.05. The mean wind speed at (0.26 ± 0.02 m s-1; maximum peak 0.78 m s-1) can be considered as predominantly near-surface wind conditions at the sampling height. It may suggest the influences of local resuspension and nearby urban emissions of AMPs, potentially associated with unsanitary landfills located approximately 4.0 km south-southeast from the inactive Steung Meanchey Landfill and 9.5 km south from the active Dangkor Landfill (Figure 1). Thinh et al. [33] reported that AMPs from landfills in Vietnam showed characteristics similar to MPs in the Saigon river and surrounding areas, suggesting that landfills can act as potential sources of MP pollution. Moreover, the fine plastic particles may remain suspended in the atmosphere longer and can be transported to higher altitudes more efficiently than coarse particles because of their smaller aerodynamic diameters and morphology [1,34]. Higher-altitude air masses generally exhibit stronger wind speeds; therefore, the fine AMPs may also be influenced by Southwest Monsoon transport, as suggested by wind direction (Figure S1) and HYSPLIT backward trajectories (Section 3.4).
Similarly, AMP10-2.5 and AMP2.5 also showed apparent positive correlations with rainfall intensity at r = 0.698 and r = 0.790, respectively, with statistically insignificant p > 0.05. This result suggests that rainfall intensity, rather than rainfall duration or frequency, may influence AMP concentrations through the competing effects of precipitation scavenging and subsequent raindrop-induced resuspension of surface-deposited particles [5,22,35,36]. In below-cloud scavenging, particle collection efficiency strongly depends on particle size; coarse particles are generally scavenged efficiently by inertial impaction and interception, whereas submicron particles may exhibit lower scavenging efficiencies [37,38]. Rainfall may selectively remove relatively larger AMPs while allowing smaller particles, particularly those near the Greenfield gap or below the analytical detection limit, to remain suspended in the atmosphere. Subsequent raindrop impacts on contaminated surfaces containing plastic waste may also resuspend deposited or surface-bound plastic particles into the atmosphere.
Among polymer-specific correlations with meteorological variables, PET showed significant positive correlations with precipitation (r = 0.962, p < 0.05) and maximum solar radiation (r = 0.995, p ≤ 0.01), possibly reflecting the combined influence of precipitation-related processes and photo-oxidative aging processes consistent with abovementioned PET below detection threshold and PET observed in Siem Reap, Cambodia, reported by Niida et al. [17]. Although PET exhibited apparent positive correlations with wind speed, rainfall frequency and rainfall intensity (r = 0.697, r = 0.720, and r = 0.796, respectively with all p > 0.05), the patterns may indicate that PET was influenced by precipitation scavenging and rain-splash resuspension processes rather than directly providing a specific source.
3.3.2. Other Air Pollutants
(1) Gas
Apparent positive correlations were observed between SO2 and all fractions of AMPs as well as PE and PP; however, neither correlation reached statistical significance. SO2 is commonly emitted from combustion of sulfur-containing materials including fossil fuel combustion, contaminated biomass burning, and municipal waste burning; SO2 alone is not the specific tracer of PE or PP combustion. Amin et al. [39] have suggested the occurrences of open-waste burning as one of air pollution sources in Phnom Penh, Cambodia. Similarly, National Plastic Action Partnership Cambodia [9] and Dek et al. [10] have also reported that approximately 45% of total plastic wastes was open-burned together with municipal solid wastes and methane-induced spontaneous ignition at landfill sites. Therefore, the observed correlations should be regarded only as tentative evidence of co-variation under polluted conditions.
(2) Aerosol
No significant correlations were observed between AMP number concentrations and PM mass concentrations (PM10–2.5 and PM2.5), indicating that AMP number concentrations did not clearly co-vary with PM mass concentration, consistent with the finding in Bangkok, Thailand [40] and five megacities in China [41]. This suggests that the dominant sources, transport pathways, and removal processes controlling PM mass concentrations differed from those governing AMPs.
NH4+ was not detected during any sampling period. NH4+ is typically a major aerosol ionic component. Its absence was likely related to post-filter treatment, sample transportation, and volatilization losses of semi-volatile ammonium nitrate. In this study, the filters were equilibrated for 2 days at stable temperature of 21.5 ± 1.5 °C and humidity of 35 ± 5% prior to gravimetric analysis, and all samples were transported from Cambodia to Japan before chemical analysis. Ammonium sulfate ((NH4)2SO4) is relatively non-volatile under typical ambient conditions [42]; however, ammonium nitrate (NH4NO3) is semi-volatile and readily dissociates into gaseous nitric acid (HNO3) and ammonia (NH3), particularly at elevated temperatures and low humidity [43]. The post-filter treatment and long-distance transport are therefore likely to have promoted volatilization of NH4NO3, leading to losses of both NH4+ and NO3−.
No clear positive correlations were observed between AMPs and K+, Ca2+, or Mg2+ as well as the major polymers. K+ is widely recognized as a tracer of biomass-burning aerosols, whereas Ca2+ and Mg2+ are often associated with crustal particles and construction dust. However, the absence of positive correlations does not necessarily rule out these sources; it only indicates that there was no clear evidence of their contribution to AMPs during the limited observation period. Na+, which is mainly associated with sea salt, also showed apparent correlations with AMPs. The concentration range of Na+ was narrow, and the scatter plots in Figure S9 suggest that these apparent correlations may represent spurious correlations rather than clear evidence of marine aerosol or coastal air-mass influences on AMP transport. It may also apply to the correlations between PET and water-soluble ionic tracers (Cl−, SO42−, K+, Mg2+, and Ca2+) as coupled with the scatter plots in Figure S5.
As discussed above, PET showed positive correlations with precipitation-related meteorological variables, including precipitation, rainfall frequency, and rainfall intensity, although not all were statistically significant. In general, aerosol ionic species and PM mass concentrations can decrease through precipitation scavenging. Therefore, the negative correlation between PET and both PM mass concentrations and aerosol ionic species may suggest that PET behaved differently from ordinary aerosol components during rainfall events. One possible explanation is that PET particles were influenced by precipitation-associated surface resuspension or rain-splash processes [5,22,35,36,37,38], whereas soluble ionic components and PM mass were reduced by wet scavenging. However, this interpretation remains tentative because of the limited sample size and should not be presented as definitive evidence of the dominant PET source or removal mechanism.
3.4. Backward Trajectory of Air Mass
The backward trajectories of the air mass are shown in Figure 6. A total of 312 backward trajectories were classified into three clusters: Arabian Sea (17%), Andaman Sea (40%), and Indian Ocean (43%). The Andaman Sea cluster was characterized by relatively lower-level transport around 950 hPa with a shorter transport distance of approximately 900 km, whereas the Arabian Sea and Indian Ocean clusters indicated higher-altitude transport pathways around 930–860 hPa with transport distances reaching approximately 5000 km.
Previous studies conducted in South and Southeast Asia have demonstrated that airborne microplastics are widely distributed in urban atmospheres across Vietnam, Indonesia, Malaysia, Sri Lanka, India, and the Philippines [44,45,46,47,48,49,50]. Polyethylene (PE), polypropylene (PP), polyethylene terephthalate (PET), and ethylene-vinyl acetate (EVA) are commonly detected polymers in these regions [44,45,46,47,48,49,50], consistent with the polymer composition observed in the present study. Arina et al. [50] reported relatively high MPs concentrations in Andaman Sea, reaching 221.90 ± 15.32 MP L-1 in seawater and 7.62 ± 0.99 MP m-3 in the atmosphere over Andaman area. Monsoon transport pathways may influence the source of both AMPs and MMPs in the region. AMP concentrations during the Northeast Monsoon period were reported to be relatively high at 10.46 ± 0.85 MP m−3, whereas lower concentrations of 4.99 ± 0.37 MP m−3 were observed during the Inter-Monsoon period. Similar seasonal and urban influences on AMPs have also been reported in Metro Manila, Philippines [44]. These findings suggest that regional atmospheric transport under monsoonal circulation may influence AMP characteristics in Phnom Penh, Cambodia.
The backward trajectory analysis indicates that air masses arriving in Phnom Penh frequently passed over surrounding marine and urbanized regions during the observation period. Therefore, the observed AMPs were likely influenced not only by local urban emissions but also by regional atmospheric transport associated with south and southwest monsoonal circulation. Potential upwind source regions may include surrounding urban areas in South and Southeast Asia, including the Mekong Delta and southern Vietnam [51]. However, the present trajectory analysis alone cannot quantitatively distinguish the relative contributions of local and regional sources.
Moderately photo-oxidized PE and PP particles accounted for approximately 18% of the detected AMP, which may reflect atmospheric aging during transport under strong solar radiation conditions. In contrast, strongly oxidized PE and PP particles accounted for only 2%, suggesting variability in atmospheric aging histories and transport pathways. These observations are consistent with the possibility that both local emissions and regional-scale transport contributed to airborne microplastic pollution in Phnom Penh during the monsoon season [34,50,51,52,53].
Overall, the results suggest that regional-scale atmospheric transport associated with monsoonal circulation may contribute to airborne microplastic pollution in Phnom Penh, Cambodia, together with local urban emissions. Future studies should investigate seasonal variability throughout dry, rainy, and inter-monsoon periods to better understand the relative importance of local emissions, regional transport, and atmospheric aging processes.
3.5. Comparisons of AMP characteristics Between Cambodia to other Asian Countries
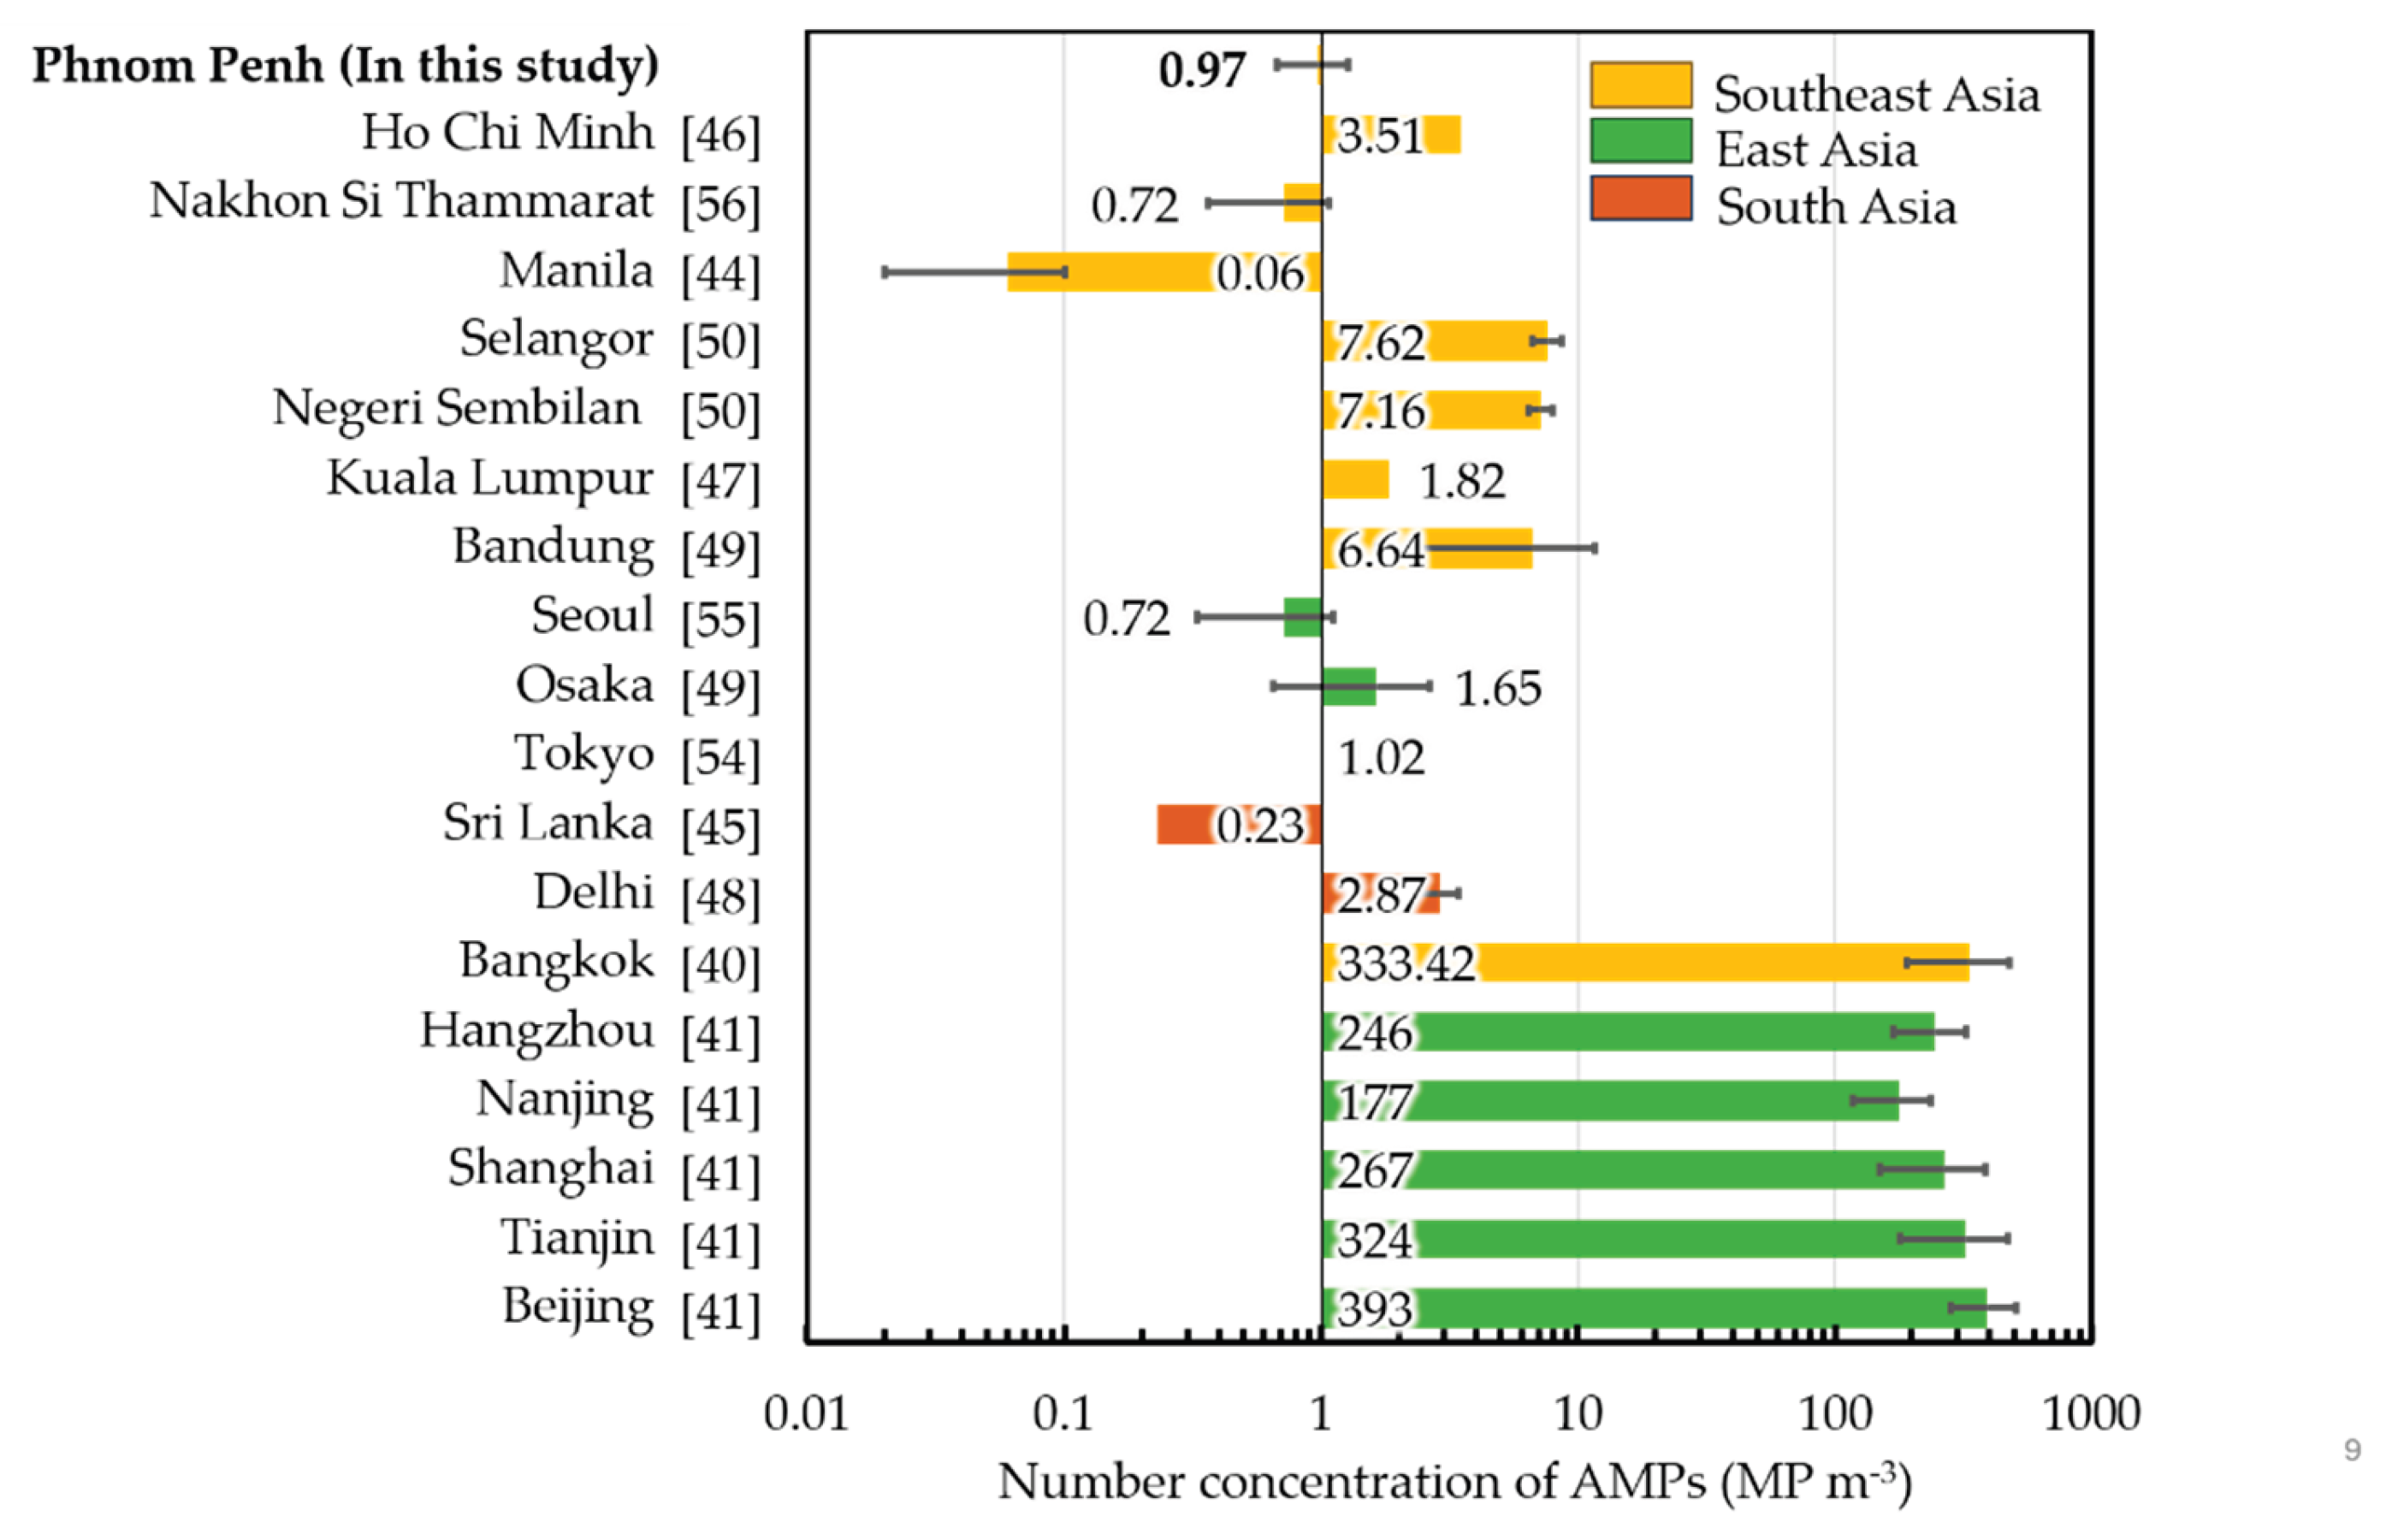
Research on airborne microplastics (AMPs) in Southeast Asia remains limited. To date, no AMP data have been available for Brunei, Laos, Myanmar, or Timor-Leste [6,7], while only limited studies on airborne microfiber deposition have been conducted in Singapore. This study compares AMP characteristics in Cambodia with those reported for other Asian countries, including Southeast Asia (Indonesia, Malaysia, the Philippines, Thailand, and Vietnam), South Asia (India and Sri Lanka), and East Asia (China, Japan, and South Korea) as shown in Figure 7 and Table S2.
The number concentration of AMPs in Phnom Penh, Cambodia (0.97 ± 0.30 MP m−3) during the rainy season was relatively low and comparable to those reported for Tokyo, Japan (1.02 MP m−3) [54]; Seoul, South Korea (0.72 ± 0.39 MP m−3) [55]; and Nakhon Si Thammarat, Thailand (0.72 ± 0.36 MP m−3 ) [56], but was higher than those reported for Manila, the Philippines (0.06 ± 0.04 MP m−3) [44] and Sri Lanka (0.01 - 0.23 MP m−3) [45]. Higher or partly overlapping concentration ranges were reported for Ho Chi Minh, Vietnam (0.45 to 3.51 MP m−3) [46]; Kuala Lumpur, Malaysia (1.82 MP m−3) [47]; Delhi NCR, India (2.87 ± 0.57 MP m−3) [48], and Osaka, Japan (1.65 ± 1.00 MP m−3) [49]. Considerably higher concentrations were reported in Bandung, Indonesia (6.64 ± 4.98 MP m−3) [49]; Selangor (7.62 ± 0.99 MP m−3) and Negeri Sembilan (7.16 ± 0.75 MP m−3), Malaysia [50]. Extremely high concentrations were reported in Bangkok, Thailand (333.42 ± 142.99 MP m−3) [40]; Beijing (393 ± 112 MP m−3), Hangzhou (246 ± 78 MP m−3), Nanjing (177 ± 59 MP m−3), Tianjin (324 ± 145 MP m−3), and Shanghai (267 ±117 MP m−3), China [41]. The relatively low AMP number concentrations for Sri Lanka may be partly attributable to the limited detection of smaller particles, because particles with sizes of 300–500 µm were dominant in that study. AMP concentrations in densely populated cities may be influenced by population density, traffic activity, and widespread plastic use [34,41,55]. However, direct comparisons of AMP concentrations among studies should be made with caution because of methodological heterogeneity. Differences in urbanization patterns, waste management practices, seasonal effects, sampling locations and altitude, sampling devices, analytical equipment and procedures, and particle-size definitions in terms of number- or mass-based concentrations may strongly influence the reported AMP concentrations.
Fragment-shaped particles were the dominant AMP morphology in Phnom Penh, Cambodia, which is consistent with observations in many Asian cities. In contrast, fibers accounted for up to 94% of the detected particles in Kuala Lumpur, Malaysia [47], and Sri Lanka [45], suggesting stronger contributions from fiber-related sources in those studies. Fiber-shaped particles were generally observed in larger size fractions. Zhu et al. [41] reported that textile-derived fibers increased during daytime periods.
In terms of polymer composition, AMPs in Phnom Penh, Cambodia were mainly composed of PP (33%), PE (20%), PET (17%), and minor polymers such as EVA, PS, PVC, SI, AR, PMMA, PVA, N6, AS, PUR, and PDAP. PE, PP, and PET were commonly observed in many Asian cities and may reflect common plastic usage patterns and waste emissions across Asian urban environments [40,41,44,46,48,49,54,55], but the polymer composition differed from that reported in Kuala Lumpur, Malaysia, which was characterized by N12, ABS, and PVA [47]; Nakhon Si Thammarat, Thailand, where PES, PET, PMMA, PU, ABS, EP and N6 were dominant [56]; and Sri Lanka, where PET, PES, PA, and AR were dominant [45]. These differences may reflect regional differences in plastic usage, textile-related emissions, waste management practices, and analytical methods. The high proportions of PES, PET, and PA reported in India, Sri Lanka, and the Philippines may partly reflect contributions from textile fibers and consumer plastic products [44,45,48].
4. Conclusions
This study presents one of the first field characterization of airborne microplastics (AMPs) during the rainy season in Phnom Penh, Cambodia, and provides new insights into their occurrences and possible controlling factors based on an integrated analysis of AMP concentrations, meteorological conditions, gaseous pollutants, and water-soluble ion species. The results provide a baseline dataset for Cambodia and a scientific basis for future monitoring and evidence-based environmental policy development.
The mean number concentration of AMPs was 0.97 ± 0.30 MP m−3, with individual sample concentrations ranging from 0.55 to 1.27 MP m−3. Inhalable airborne microplastics with aerodynamic diameters ≤ 2.5 µm (AMP2.5) were detected at a mean concentration of 0.33 ± 0.10 MP m−3, ranging from 0.23 to 0.49 MP m−3, and accounted for 34% of total AMPs. Based on the Feret diameters, particles smaller than 30 µm dominated the AMP population, accounting for 82% of AMPTSP. PP, PE, and PET were the dominant polymers, accounting for 70% of the total polymer compositions, which may reflect the widespread use and environmental release of these common plastic materials. Fragment-shaped particles accounted for 52% of the detected AMPs.
The assessment of photo-oxidative degradation indicated that PE and PP generally exhibited low to moderate aging, suggesting that many particles were relatively fresh or at an early stage of degradation. However, some highly aged PE and PP particles were also observed, indicating the coexistence of less aged and more weathered particles. Pearson correlation analysis suggested that PE and PP may have been influenced by local plastic fragmentation sources, although the possible contributions of combustion-related emissions should be interpreted with caution because of the limited sample size and the potential for spurious correlations. In contrast, PET showed positive relationships with precipitation-related meteorological variables and negative relationships with PM mass concentrations and several aerosol ionic species. These results suggest that PET may have behaved differently from ordinary aerosol components during rainfall events, possibly due to precipitation-associated surface resuspension or rain-splash processes. Backward trajectory analysis suggested that the Southwest Monsoon may have influenced air-mass transport pathways from the Indian Ocean, the Arabian Sea, and the Andaman Sea, while the Mekong Delta and regional coastal zones may have served as potential upwind regions influencing AMP transport.
Overall, this study highlights the importance of further AMP observations in Cambodia and Southeast Asia using standardized sampling, pretreatment, and analytical methods. Because the present study was based on a limited number of rainy-season samples, further multi-seasonal observations are needed to clarify temporal variability, source contributions, and regional transport processes of AMPs in Cambodia.
Supplementary Materials
The following supporting information can be downloaded at: Preprints.org, Figure S1: Wind speed in Phnom Penh, Cambodia from September 01-13, 2025; Figure S2: Scatter plots between major polymer compositions and meteorological variables; Figure S3: Scatter plots between major polymer compositions and gaseous pollutants; Figure S4: Scatter plots between major polymer compositions and particulate matter and optical black carbon; Figure S5: Scatter plots between major polymer compositions and water-soluble ionic tracers; Figure S6: Scatter plots between airborne microplastics in different aerodynamic diameters and meteorological variables; Figure S7: Scatter plots between airborne microplastics in different aerodynamic diameters and gaseous pollutants; Figure S8: Scatter plots between airborne microplastics in different aerodynamic diameters and particulate matters and optical black carbons; Figure S9: Scatter plots between airborne microplastics in different aerodynamic diameters and water-soluble ionic tracers; Table S1: Summarizes of AMPs concentration, gaseous pollutant concentrations, and meteorological condition from September 01 to 13, 2025, classified into 4 periods based on 72-hour sampling interval. The concentration of the variables was the mean value, except the variables were reported in prefix of maximum and total thereof; Table S2: Regional comparison of AMP number concentrations, particle characteristics, and sampling and analytical methods in Cambodia and other Asian countries.
Author Contributions
Conceptualization and methodology, H.O.; software, R.K., Y.W., Y.N.; validation, H.O., Y.W., H.H.; formal analysis, R.K.; investigation, R.K., S.D., C.O.; resources, H.O., C.O., M.H.; data curation, R.K.; writing—original draft preparation, R.K.; writing—review and editing, H.O., Y.W., H.H., C.O., S.D., Y.N., F.I., M.H.; visualization, R.K., H.O., Y.W., H.H.; supervision, H.O.; project administration, H.O., S.D., Y.W.; funding acquisition, H.O., C.O., M.H. All authors have read and agreed to the published version of the manuscript.
Funding
This research was funded by the Environment Research and Technology Development Fund of the Environmental Restoration and Conservation Agency of Japan (JPMEERF20215003 and JPMEERF20245004), JICA (AUN/SEED-Net D2502377), and JICA-JST SATREPS (JPMJSA2102).
Institutional Review Board Statement
Not applicable.
Informed Consent Statement
Not applicable.
Data Availability Statement
The data in this study are available on reasonable requests from the corresponding author.
Acknowledgments
The author (R.K.) is grateful to Mr. Chingthean Kem and Ms. Linit Thorn for supporting in filter and equipment preparation during the sampling in Cambodia. The authors gratefully acknowledge the NOAA Air Resources Laboratory (ARL) for the provision of the HYSPLIT transport and dispersion model used in this publication. The authors used a generative artificial intelligence tool for English language editing. All scientific content, analysis, and conclusions were developed and verified by the authors.
Conflicts of Interest
The authors declare no conflicts of interest.
Abbreviations
The following abbreviations are used in this manuscript:
| General | |
| µFTIR-ATR | Micro-Fourier transform infrared spectroscopy with attenuated total reflection |
| AMPs | Airborne microplastics |
| CI | Carbonyl index |
| CCN | Cloud condensation nuclei |
| HI | Hydroxyl index |
| HQI | Hit quality index |
| ITC | Institute of Technology of Cambodia |
| MMPs | Marine microplastics |
| MSW | Municipal solid waste |
| NOAA | National Oceanic and Atmospheric Administration |
| PCA | Principal component analysis |
| PM | Particulate matters |
| SG | Savitzky–Golay smoothing |
| SMPs | Soil microplastics |
| Ions and Chemicals | |
| Cl- | Chloride ion |
| NO3- | Nitrate ion |
| SO4- | Sulfate ion |
| Ca2+ | Calium ion |
| K+ | Potassium ion |
| Mg2+ | Magnesium ion |
| Na+ | Sodium ion |
| NH4+ | Ammonium ion |
| OBC | Optical black carbon |
| CO | Carbon monoxide |
| HNO3 | Nitric acid |
| H2O2 | Hydrogen peroxide |
| NaI | Sodium iodide |
| NH3 | ammonia |
| (NH4)2SO4 | Ammonium sulfate |
| NH4NO3 | Ammonium nitrate |
| NO | Nitric oxide |
| NO2 | Nitrogen dioxide |
| NOx | Nitrogen oxide |
| O3 | Ozone |
| SO2 | Sulfur dioxide |
| Polymers | |
| ABS | Acrylonitrile butadiene styrene |
| AR | Acrylic resin |
| AS | Acrylonitrile styrene |
| EP | Epoxy resin |
| EVA | Ethylene vinyl acetate |
| N-x / PA | Nylon (x is a number represented type of nylon) / Polyamide |
| PC | Polycarbonate |
| PE | Polyethylene |
| PES | Polyester |
| PET | Polyethylene terephthalate |
| PDAP | Polydially phthalate |
| PMMA | Polymethyl methacrylate |
| PP | Polypropylene |
| PS | Polystyrene |
| PTFE | Polytetrafluoroethylene |
| PUR | Polyurethane |
| PVA | Polyvinyl alcohol |
| PVC | Polyvinyl chloride |
| SBMA | Styrene butadiene methacrylate |
| SI | Silicone resin |
References
- Wang, Y.; Okochi, H.; Tani, Y.; Hayami, H.; Minami, Y.; Katsumi, N.; Takeuchi, M.; Sorimachi, A.; Fujii, Y.; Kajino, M.; Adachi, K.; Ishihara, Y.; Iwamoto, Y., Niida, Y. Airborne Hydrophilic Microplastics in Cloud Water at High Altitudes and Their Role in Cloud Formation. Environ. Chem. Lett. 2023, 21, 3055–3062. [CrossRef]
- Wang, Y.; Xu, X.; Wu, J.; Dong, Z.; Su, Y.; Huang, G.; Guo, Q.; Feng, Z.; Jia, H.; Zhao, J.; Xing, B. Microplastics and Nanoplastics on Mt. Everest. Cell Rep. Sustain. 2025, 2, 100467. [CrossRef]
- Evangeliou, N.; Grythe, H.; Klimont, Z.; Heyes, C.; Eckhardt, S.; Lopez-Aparicio, S.; Stohl, A. Atmospheric Transport Is a Major Pathway of Microplastics to Remote Regions. Nat. Commun. 2020, 11, 3381. [CrossRef]
- Stefánsson, H.; Peternell, M.; Konrad-Schmolke, M.; Hannesdóttir, H.; Ásbjörnsson, E.J.; Sturkell, E. Microplastics in Glaciers: First Results from the Vatnajökull Ice Cap. Sustainability 2021, 13. [CrossRef]
- Liu, Y.; Nie, Z.; Meng, Y.; Liu, G.; Chen, Y.; Chai, G. Influence of Meteorological Conditions on Atmospheric Microplastic Transport and Deposition. Environ. Res. 2025, 265, 120460. [CrossRef]
- Rahim, N.N.A.; Peng, P.W.Y.; Shahrir, N.F.; Mahiyuddin, W.R.W.; Zain, S.M.S.M.; Ismail, R. Characteristics, Distribution, and Sources of Atmospheric Microplastics in Southeast Asia: A Scoping Review. Atmosphere 2025, 16. [CrossRef]
- Ali, A.A.M.; Khalid, A.A.; Razak, N.I.A.; Maulana, N.S.M.; Roslan, N.S.; Razmi, R.S.B.; Ruseli, W.M.A.W.; Ibrahim, Y.S.; Jaafar, M.; Shahrudin, R.; Ismail, K.; Anuar, S.T. A Review on the Presence of Microplastics in Environmental Matrices within Southeast Asia: Elucidating Risk Information through an Analysis of Microplastic Characteristics Such as Size, Shape, and Type. Water Emerg. Contam. Nanoplastics 2024, 3, 12. [CrossRef]
- Collard, F.; Galtung, K.; Mosberg, M. Baseline Study on Microplastics in ASEAN; Deutsche Gesellschaft für Internationale Zusammenarbeit (GIZ) and Norwegian Institute for Water Research (NIVA), 2024.
- National Plastic Action Partnership Cambodia Journey towards a Circular Plastic Economy: Plastic Action Roadmap in Cambodia; 2026.
- Dek, V.P.; Quan, N.V.; Khanh, T.D.; Xuan, T.D. Challenges and Priorities of Municipal Solid Waste Management in Cambodia. Int. J. Environ. Res. Public. Health 2022, 19, 8458. [CrossRef]
- Ministry of Environment of Cambodia The 4th State of Environment Report (In Khmer); Ministry of Environment of Cambodia: Phnom Penh, Cambodia, 2021.
- Seng, B.; Fujiwara, T.; Seng, B. Suitability Assessment for Handling Methods of Municipal Solid Waste. Glob. J. Environ. Sci. Manag. 2018, 4, 113–126. [CrossRef]
- Tun, T.Z.; Kunisue, T.; Tanabe, S.; Prudente, M.; Subramanian, A.; Sudaryanto, A.; Viet, P.H.; Nakata, H. Microplastics in Dumping Site Soils from Six Asian Countries as a Source of Plastic Additives. Sci. Total Environ. 2022, 806, 150912. [CrossRef]
- Mendrik, F.; Hackney, C.R.; Cumming, V.M.; Waller, C.; Hak, D.; Dorrell, R.; Hung, N.N.; Parsons, D.R. The Transport and Vertical Distribution of Microplastics in the Mekong River, SE Asia. J. Hazard. Mater. 2025, 484, 136762. [CrossRef]
- Babel, S.; Dork, H. Identification of Micro-Plastic Contamination in Drinking Water Treatment Plants in Phnom Penh, Cambodia. J. Eng. Technol. Sci. 2021, 53, 210307. [CrossRef]
- Grigorescu, R.M.; Grigore, M.E.; Iancu, L.; Ghioca, P.; Ion, R.-M. Waste Electrical and Electronic Equipment: A Review on the Identification Methods for Polymeric Materials. Recycling 2019, 4, 32. [CrossRef]
- Niida, Y.; Fujii, Y.; Inatsugi, Y.; Takenaka, N. Quantifying UV-Driven Aging of Sub-10 Μm Airborne Microplastics with High-Resolution µFTIR-ATR Imaging. Atmosphere 2026, 17. [CrossRef]
- Tokunaga, Y.; Okochi, H.; Tani, Y.; Niida, Y.; Tachibana, T.; Saigawa, K.; Katayama, K.; Moriguchi, S.; Kato, T.; Hayama, S. Airborne Microplastics Detected in the Lungs of Wild Birds in Japan. Chemosphere 2023, 321, 138032. [CrossRef]
- Stein, A.F.; Draxler, R.R.; Rolph, G.D.; Stunder, B.J.B.; Cohen, M.D.; Ngan, F. NOAA’s HYSPLIT Atmospheric Transport and Dispersion Modeling System. Bull. Am. Meteorol. Soc. 2015, 96, 2059–2077. [CrossRef]
- Rolph, G.; Stein, A.; Stunder, B. Real-Time Environmental Applications and Display sYstem: READY. Environ. Model. Softw. 2017, 95, 210–228. [CrossRef]
- Severe, E.; Surridge, B.W.J.; Fiener, P.; Coogan, M.P.; Platel, R.H.; James, M.R.; Quinton, J. The Transport of Microplastics from Soil in Response to Surface Runoff and Splash Erosion. Environ. Sci. Technol. 2025, 59, 14063–14074. [CrossRef]
- Lehmann, M.; Oehlschlägel, L.M.; Häusl, F.P.; Held, A.; Gekle, S. Ejection of Marine Microplastics by Raindrops: A Computational and Experimental Study. Microplastics Nanoplastics 2021, 1, 18. [CrossRef]
- Turk, K.; Kalčikova, G.; Kokalj, A.J.; Mušič, B. From Plastic Use in the Construction and Built Environment to State-of-the-Art Circular Economy Solutions to Combat Microplastic Pollution. Environ. Sci. Eur. 2025, 37, 185. [CrossRef]
- Gaylarde, C.C.; Neto, J.A.B.; da Fonseca, E.M. Paint Fragments as Polluting Microplastics: A Brief Review. Mar. Pollut. Bull. 2021, 162, 111847. [CrossRef]
- Gewert, B.; Plassmann, M.M.; MacLeod, M. Pathways for Degradation of Plastic Polymers Floating in the Marine Environment. Environ. Sci. Process. Impacts 2015, 17, 1513–1521. [CrossRef]
- Rostampour, S.; Cook, R.; Jhang, S.-S.; Li, Y.; Fan, C.; Sung, L.-P. Changes in the Chemical Composition of Polyethylene Terephthalate under UV Radiation in Various Environmental Conditions. Polymers 2024, 16. [CrossRef]
- Kasuske, Z.A.; Arole, K.; Green, M.J.; Anderson, T.A.; Cañas-Carrell, J.E. Photo-Induced Degradation of Single-Use Polyethylene Terephthalate Microplastics under Laboratory and Outdoor Environmental Conditions. Environ. Toxicol. Chem. 2025, 44, 1525–1537. [CrossRef]
- Arredondo-Navarro, A.; Gallardo-Owens, D.; Scott, J.; Farias, S.; Wang, X.; Cochran, W.; Hayek, E.E.; Minghetti, M.; Cerrato, J.M.; Gonzalez-Estrella, J. Thermal Oxidation, Ultraviolet Radiation, and Mechanical Abrasion - Understanding Mechanisms of Microplastic Generation and Chemical Transformation. Microplastics Nanoplastics 2026, 6, 26. [CrossRef]
- Ben Stride; Abolfathi, S.; Bending, G.D.; Pearson, J. Quantifying Microplastic Dispersion Due to Density Effects. J. Hazard. Mater. 2024, 466, 133440. [CrossRef]
- Chen, Q.; Shi, G.; Revell, L.E.; Zhang, J.; Zuo, C.; Wang, D.; Le Ru, E.C.; Wu, G.; Mitrano, D.M. Long-Range Atmospheric Transport of Microplastics across the Southern Hemisphere. Nat. Commun. 2023, 14, 7898. [CrossRef]
- Gao, L.; Su, Y.; Mehmood, T.; Wang, Z.; Peng, L.; Zhang, N. UVA-Induced Weathering of Microplastics in Seawater: Surface Property Transformations and Kinetics. Front. Mar. Sci. 2025, 12. [CrossRef]
- Biswas, A.; Saini, N.; Chivukula, N.; Samal, A.; Jansari, M.R.; Bhadury, P.; Darbha, G.K. The Dawn of a New Air Pollutant: Inhalable Microplastics as Emerging Vectors of Hazardous Contaminants and Their Implications for Human Health. Environ. Int. 2025, 205, 109897. [CrossRef]
- Thinh, T.Q.; Sang, T.T.N.; Viet, T.Q.; Tam, L.T.M.; Dan, N.P.; Strady, E.; Chung, K.L.T. Preliminary Assessment on the Microplastic Contamination in the Atmospheric Fallout in the Phuoc Hiep Landfill, Cu Chi, Ho Chi Minh City. Vietnam J. Sci. Technol. Eng. 2020, 62, 83–89. [CrossRef]
- Hee, Y.Y.; Hanif, N.M.; Weston, K.; Latif, M.T.; Suratman, S.; Rusli, M.U.; Mayes, A.G. Atmospheric Microplastic Transport and Deposition to Urban and Pristine Tropical Locations in Southeast Asia. Sci. Total Environ. 2023, 902, 166153. [CrossRef]
- Hu, T.; Zhang, C.; Zhu, Y.; Duan, J.; Liu, S.; Jin, N.; Song, Y.; Wu, F.; Li, J.; Zhang, T.; Niu, H.; Li, X.; Huang, H.; Casuccio, G.S.; Huang, Y.; Ho, K.F.; Cao, J.; Zhang, D. Abundance of Microplastics and Nanoplastics in Urban Atmosphere. Sci. Adv. 2026, 12, eadz7779. [CrossRef]
- Joung, Y.S.; Buie, C.R. Aerosol Generation by Raindrop Impact on Soil. Nat. Commun. 2015, 6, 6083. [CrossRef]
- Jones, A.C.; Hill, A.; Hemmings, J.; Lemaitre, P.; Quérel, A.; Ryder, C.L.; Woodward, S. Below-Cloud Scavenging of Aerosol by Rain: A Review of Numerical Modelling Approaches and Sensitivity Simulations with Mineral Dust in the Met Office’s Unified Model. Atmospheric Chem. Phys. 2022, 22, 11381–11407. [CrossRef]
- Greenfield, S.M. Rain Scavenging of Radioactive Particulate Matter from the Atmosphere. J. Atmospheric Sci. 1957, 14, 115–125. [CrossRef]
- Amin, M.; Or, C.; Bory, S.; Dary, C.; Yim, R.; Sam, S.; Hata, M.; Masami, F. Investigation of Size-Segregated Particulate Matter and Carbonaceous Components in Phnom Penh, Cambodia. Environ. Sci. Pollut. Res. 2024, 31, 63993–64006. [CrossRef]
- Sarathana, D.; Winijkul, E. Concentrations of Airborne Microplastics during the Dry Season at Five Locations in Bangkok Metropolitan Region, Thailand. Atmosphere 2022, 14. [CrossRef]
- Zhu, X.; Huang, W.; Fang, M.; Liao, Z.; Wang, Y.; Xu, L.; Mu, Q.; Shi, C.; Lu, C.; Deng, H.; Dahlgren, R.; Shang, X. Airborne Microplastic Concentrations in Five Megacities of Northern and Southeast China. Environ. Sci. Technol. 2021, 55, 12871–12881. [CrossRef]
- Pathak, R.K.; Louie, P.K.K.; Chan, C.K. Characteristics of Aerosol Acidity in Hong Kong. Atmos. Environ. 2004, 38, 2965–2974. [CrossRef]
- Keck, L.; Wittmaack, K. Effect of Filter Type and Temperature on Volatilisation Losses from Ammonium Salts in Aerosol Matter. Atmos. Environ. 2005, 39, 4093–4100. [CrossRef]
- Romarate II, R.A.; Pacilan, C.J.M.; Shiu, R.-F.; Sinco, A.L.; Torres, A.G.; Tampus, A.D.; Ochigue, P.C.D.; Rodil, M.S.P.; Bacosa, H.P. Microplastics in the Air of Metro Manila, Philippines: Diurnal and Seasonal Dynamics and Potential Health Risk. J. Hazard. Mater. 2025, 500, 140455. [CrossRef]
- Perera, K.; Ziajahromi, S.; Bengtson Nash, S.; Manage, P.M.; Leusch, F.D.L. Airborne Microplastics in Indoor and Outdoor Environments of a Developing Country in South Asia: Abundance, Distribution, Morphology, and Possible Sources. Environ. Sci. Technol. 2022, 56, 16676–16685. [CrossRef]
- Quynh, A.L.N.; Fujii, Y.; Niida, Y.; Hoang, M.T.; Nguyen, N.T.; Nhon, N.T.T.; Tran, N.; Hien, T.T.; Takenaka, N.; Okochi, H. Observations of Size-Segregated Airborne Microplastics in Ho Chi Minh City, Vietnam. In Proceedings of the EGU General Assembly 2026; Copernicus Meetings: Vienna, Austria, March 14 2026; pp. EGU26-16846.
- Samsukamal, N.A.; Jamian, N.R.; Bahtiar, H.K.; Ishak, N.; Dewika, M.; Elias, M.S.; Yusuf, S.Y.; Irfan, N.A.; Abdah, M.A.A.M.; Khalid, M. Airborne Microplastics in Indoor and Outdoor Environments at Universiti Teknologi Malaysia, Kuala Lumpur Campus. J. Adv. Res. Micro Nano Eng. 2025, 32, 94–108. [CrossRef]
- Rao, M.N.; Ghude, S.D.; Nivdange, S.D.; Panchang, R.; Pipal, A.S.; Mukherjee, A.; Sharma, H.; Kumar, V. Characterization and Health Risk Assessment of Airborne Microplastics in Delhi NCR. Sci. Rep. 2025, 15, 25662. [CrossRef]
- Hidayat, N.A.A.; Kitano, K.; Tani, Y.; Lestari, P.; Iriana, W.; Fujii, Y.; Okochi, H.; Niida, Y. Airborne Microplastics in Bandung and Osaka: Concentration and Characteristics. E3S Web Conf. 2024, 485, 06004. [CrossRef]
- Arina, N.; Hanif, N.M.; Hee, Y.Y.; Ayoub, A.B.; Rodzi, S.N.M.; Haikal, S.A.; Zakaria, Y.; Latif, M.T. The Influence of Different Seasonal Monsoon Seasons on Airborne and Marine Microplastics at Selected Stations on the West Coast of Peninsular Malaysia. Atmospheric Pollut. Res. 2025, 16, 102681. [CrossRef]
- Tran-Nguyen, Q.A.; Vo, M.V.; Nguyen, H.N.Y.; Phan, L.T.T.; Le, M.T.; Trinh-Dang, M. Microplastics in the Environment and Biota in Vietnam: A Review of Occurrence, Characteristics, Sources, and Risks. Environ. Monit. Assess. 2026, 198, 519. [CrossRef]
- Wang, X.; Liu, K.; Zhu, L.; Li, C.; Song, Z.; Li, D. Efficient Transport of Atmospheric Microplastics onto the Continent via the East Asian Summer Monsoon. J. Hazard. Mater. 2021, 414, 125477. [CrossRef]
- Mehmood, T.; Peng, L.; Salam, A.; Prakash, J.; Haider, M. Neglected Atmospheric Microplastic Pollution in South Asia Reflects a Wider Failure. Ecol. Inform. 2023, 73, 101949. [CrossRef]
- Shunki, S.; Okochi, H.; Gu, Y.; Onozuka, Y.; Komatsu, M.; Hayami, H.; Wang, Y.; Takeuchi, M.; Kashimoto, M.; Banmachi, A.; Fujii, Y.; Noriyuki, T.; Yamaguchi, T.; Bunshu, C.; Katsumi, N.; Matsuki, A.; Mizuo, K.; Adachi, K.; Ishihara, Y.; Iwamoto, Y.; Kobayashi, T.; Kato, S.; Niida, Y. Occurrence, behavior, fate, and health impact of airborne microplastics (AMPs) (20):National Survey of AMPs in Aerosols and Estimation of Their Origins (In Japanese). In Proceedings of the Proceedings of the Symposium on Environmental Chemistry; Japan Society for Environmental Chemistry: Hiroshima, Japan, July 2 2024; pp. 833–834.
- Chang, D.Y.; Jeong, S.; Shin, J.; Park, J.; Park, C.R.; Choi, S.; Chun, C.-H.; Chae, M.-Y.; Lim, B.C. First Quantification and Chemical Characterization of Atmospheric Microplastics Observed in Seoul, South Korea. Environ. Pollut. 2023, 327, 121481. [CrossRef]
- Myat, Y.N.; Kongpran, J.; Vattanasit, U.; Tanaka, S. Airborne Microplastics in the Roadside and Residential Areas of Southern Thailand. Case Stud. Chem. Environ. Eng. 2024, 9, 100682. [CrossRef]
Figure 1.
AMP sampling site at the Institute of Technology of Cambodia (ITC), Phnom Penh, Cambodia, located approximately 4.0 km from the Steung Meanchey Landfill (inactive landfill since 2009) and approximately 9.5 km from the Dangkor Landfill (active landfill).
Figure 1.
AMP sampling site at the Institute of Technology of Cambodia (ITC), Phnom Penh, Cambodia, located approximately 4.0 km from the Steung Meanchey Landfill (inactive landfill since 2009) and approximately 9.5 km from the Dangkor Landfill (active landfill).
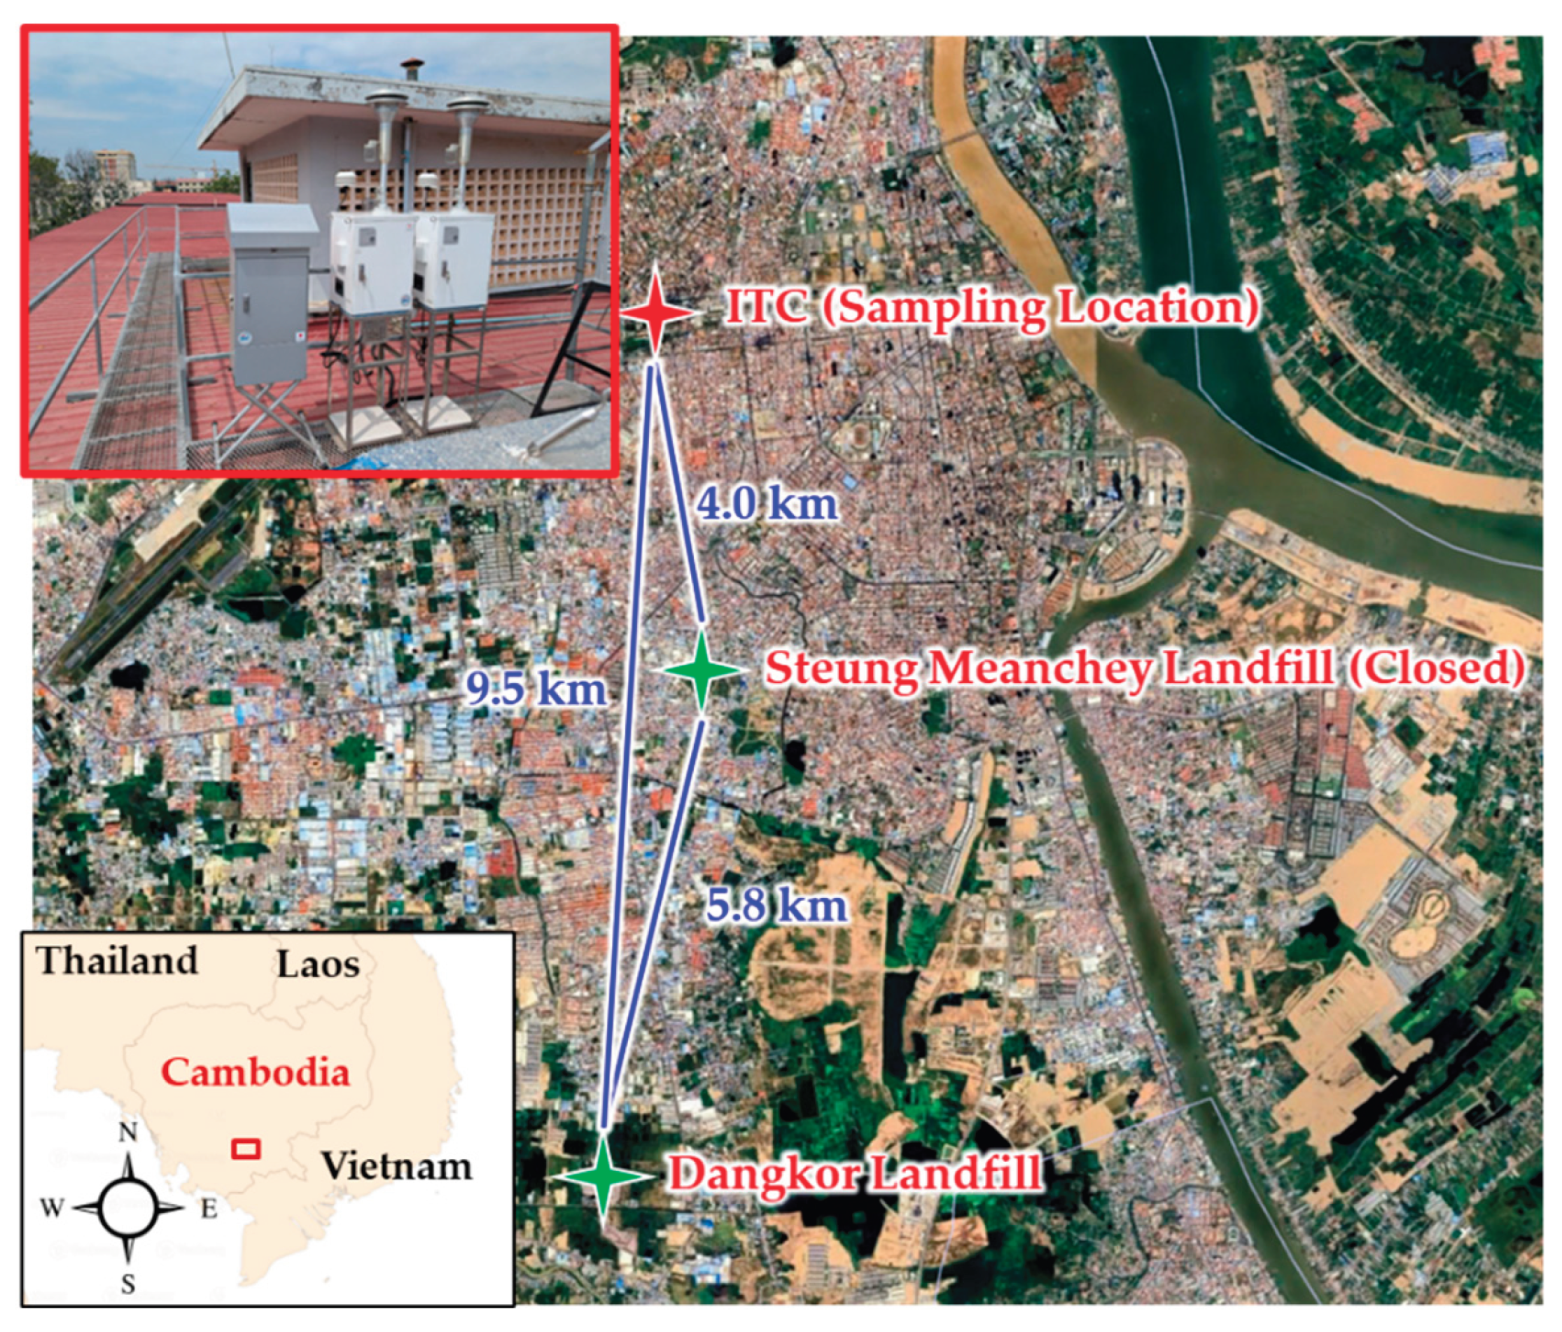
Figure 2.
Analytical workflow of AMP analysis: (a) pretreatment procedure including water extraction, organic removal, and mineral separation; (b) measurement parameters of AMPs using µFTIR-ATR imaging; and (c) identification workflow of AMP candidates.
Figure 2.
Analytical workflow of AMP analysis: (a) pretreatment procedure including water extraction, organic removal, and mineral separation; (b) measurement parameters of AMPs using µFTIR-ATR imaging; and (c) identification workflow of AMP candidates.
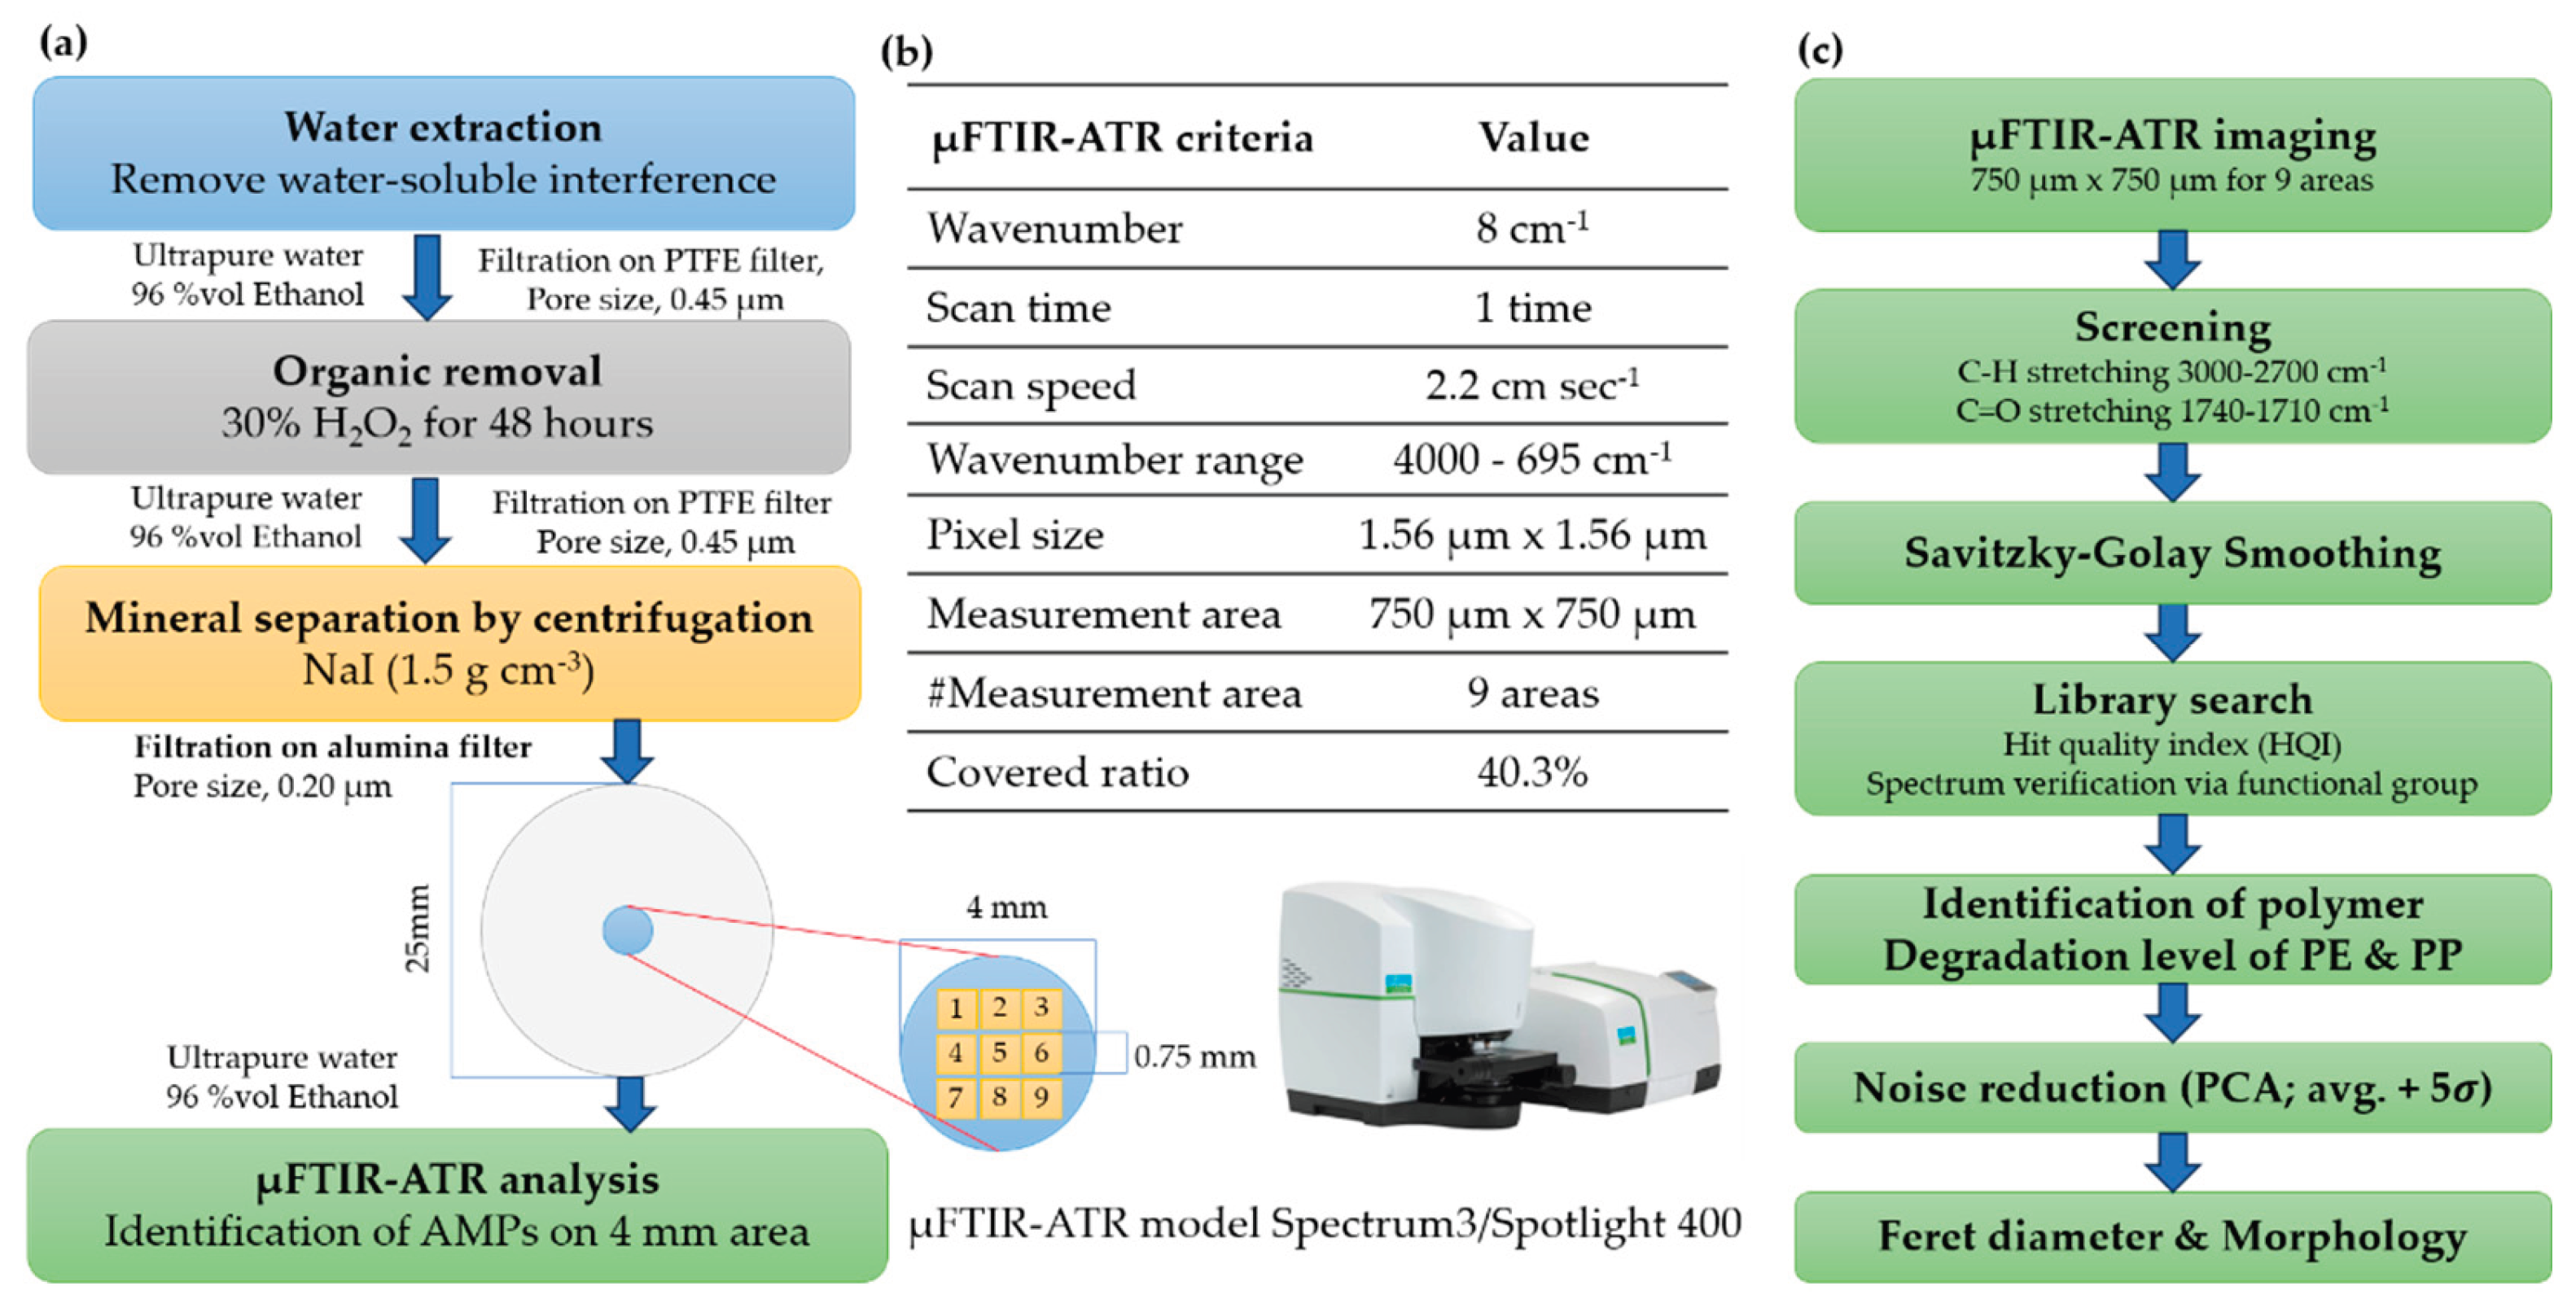
Figure 3.
Characteristics of AMPs observed in Phnom Penh, Cambodia, from September 1 to 13, 2025: (a) number concentrations and polymer composition in PM10+, PM10-2.5, PM2.5; (b) morphology classified as fragments, granules, fibers, unmeasurable particles (protrusion of plastic particles), and particles below the limit of detection (<LOD; below the threshold defined as the mean blank signal plus 5σ); (c) Feret diameter distributions of AMPs with their mean plastic sizes.
Figure 3.
Characteristics of AMPs observed in Phnom Penh, Cambodia, from September 1 to 13, 2025: (a) number concentrations and polymer composition in PM10+, PM10-2.5, PM2.5; (b) morphology classified as fragments, granules, fibers, unmeasurable particles (protrusion of plastic particles), and particles below the limit of detection (<LOD; below the threshold defined as the mean blank signal plus 5σ); (c) Feret diameter distributions of AMPs with their mean plastic sizes.
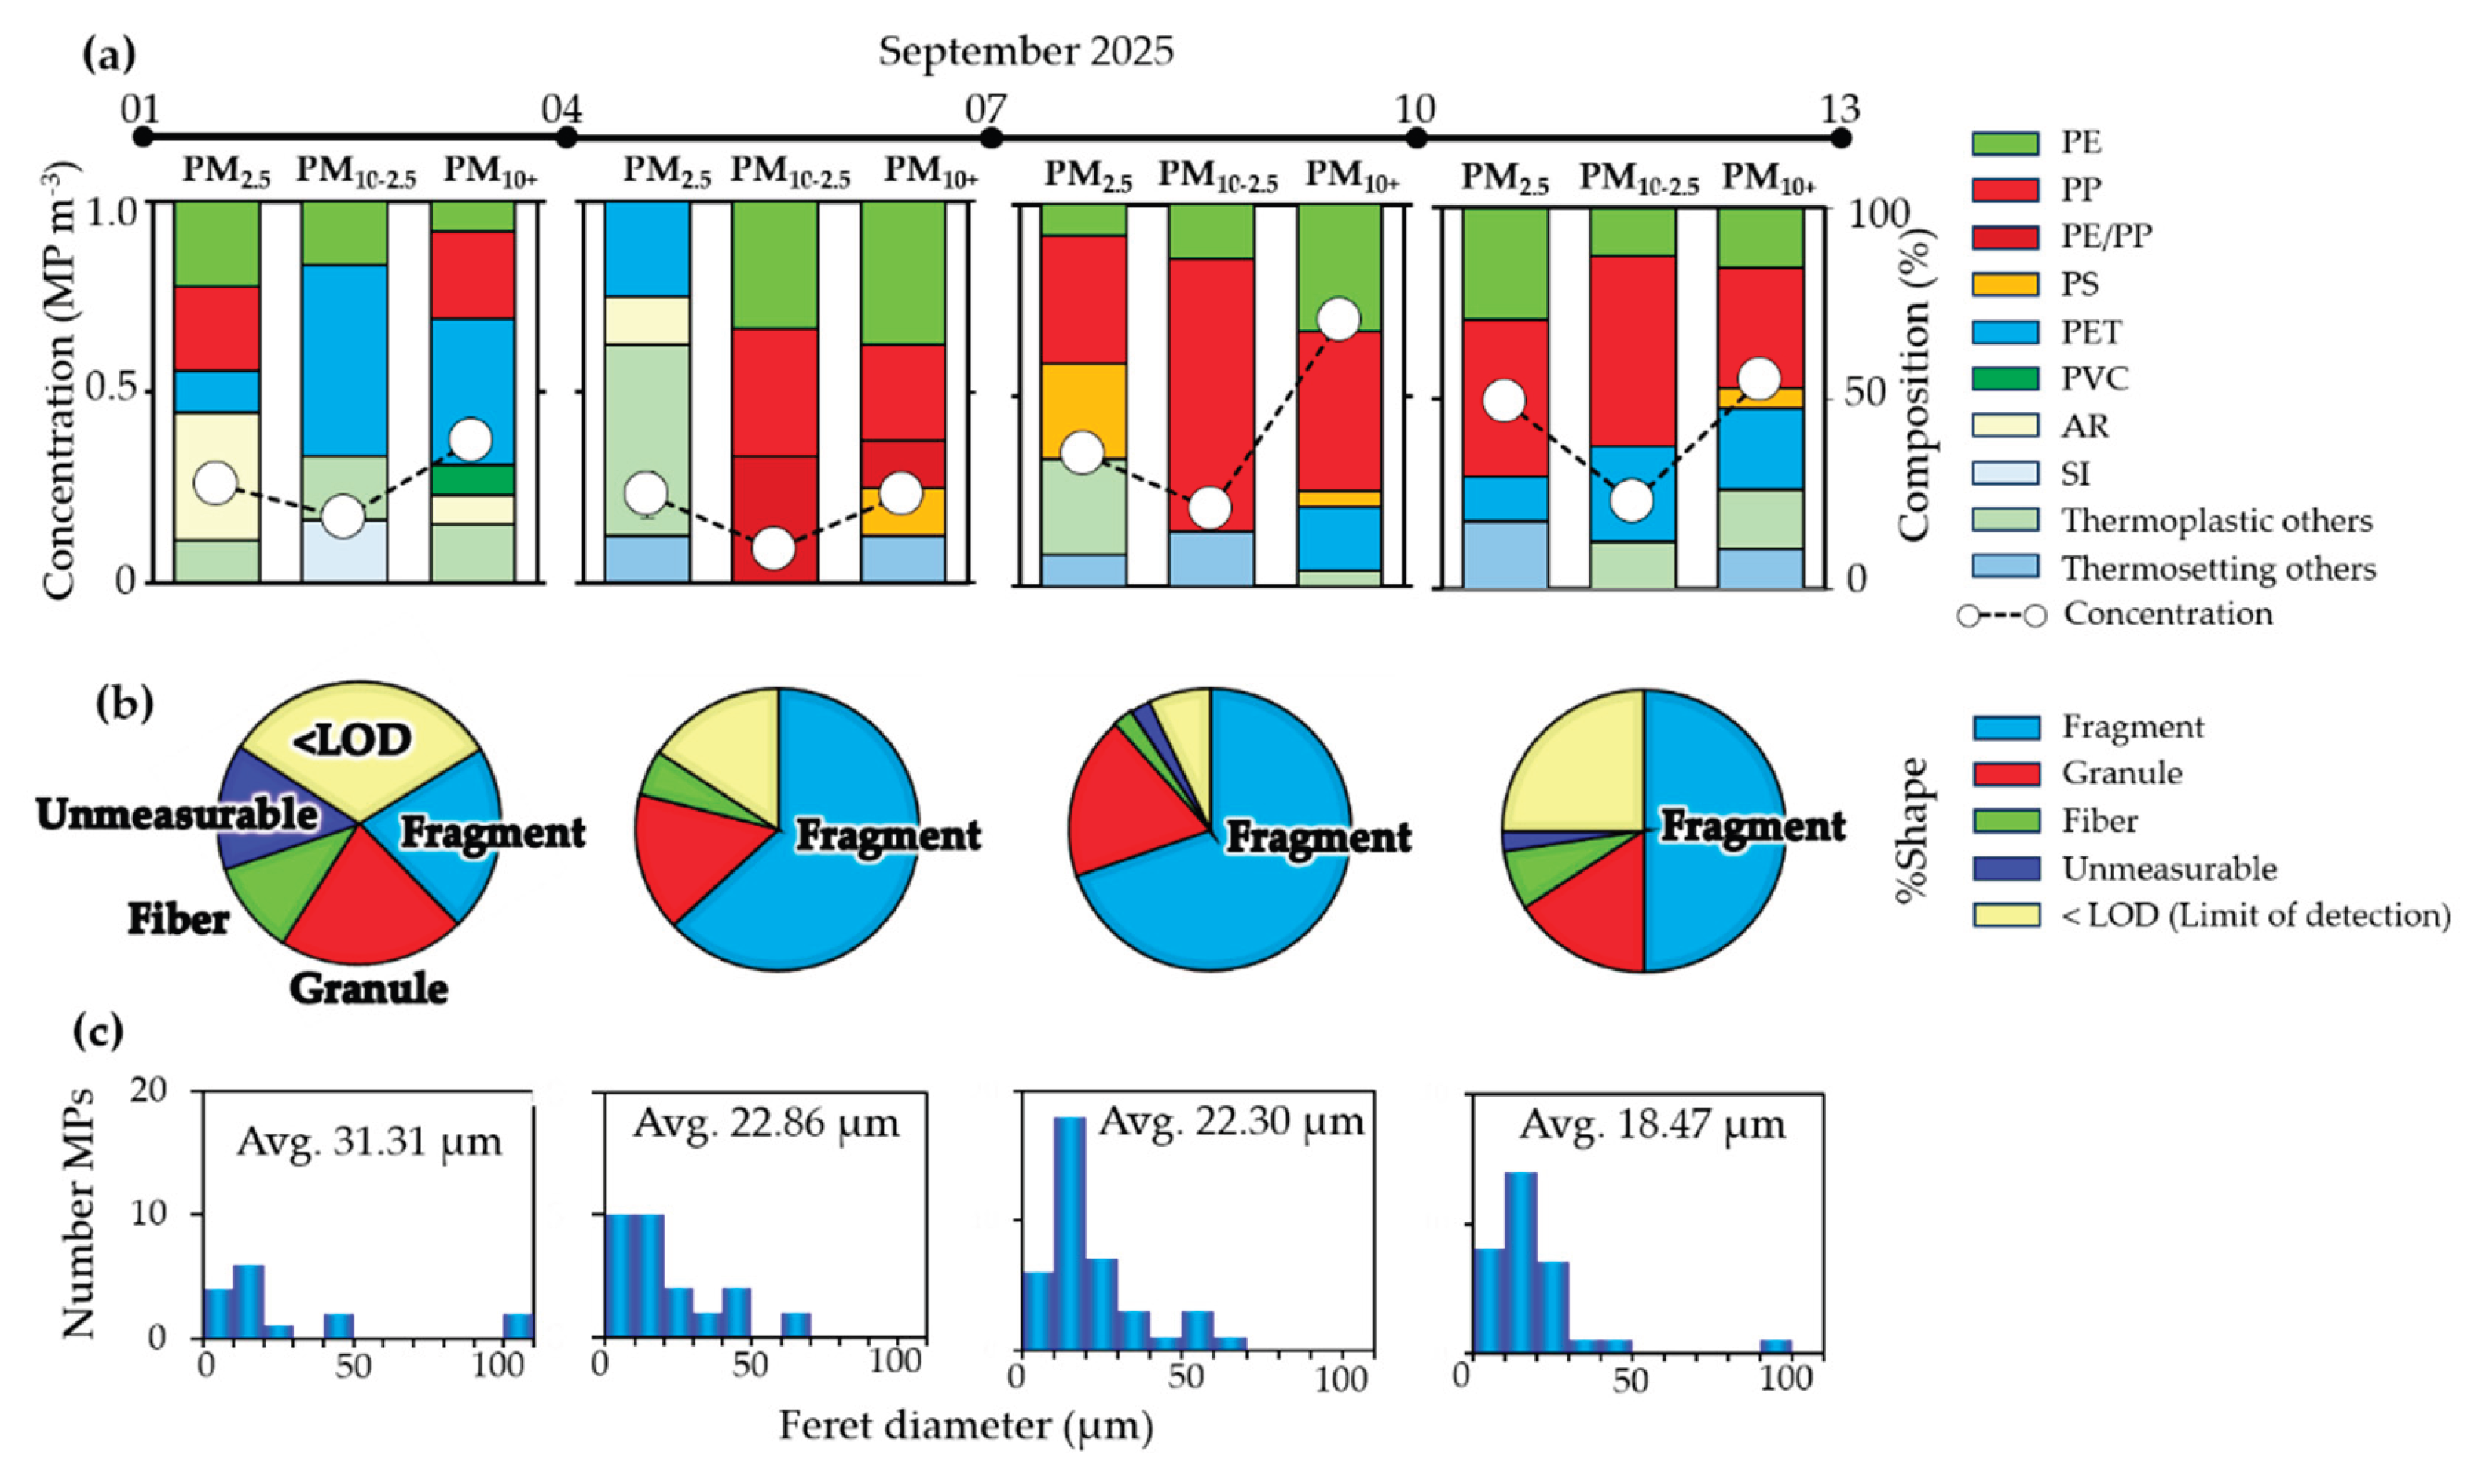
Figure 4.
Degree of degradation for dominant polymer compositions evaluated by carbonyl index and hydroxyl index: (a) PE (n = 27); (b) PP (n = 45).
Figure 4.
Degree of degradation for dominant polymer compositions evaluated by carbonyl index and hydroxyl index: (a) PE (n = 27); (b) PP (n = 45).
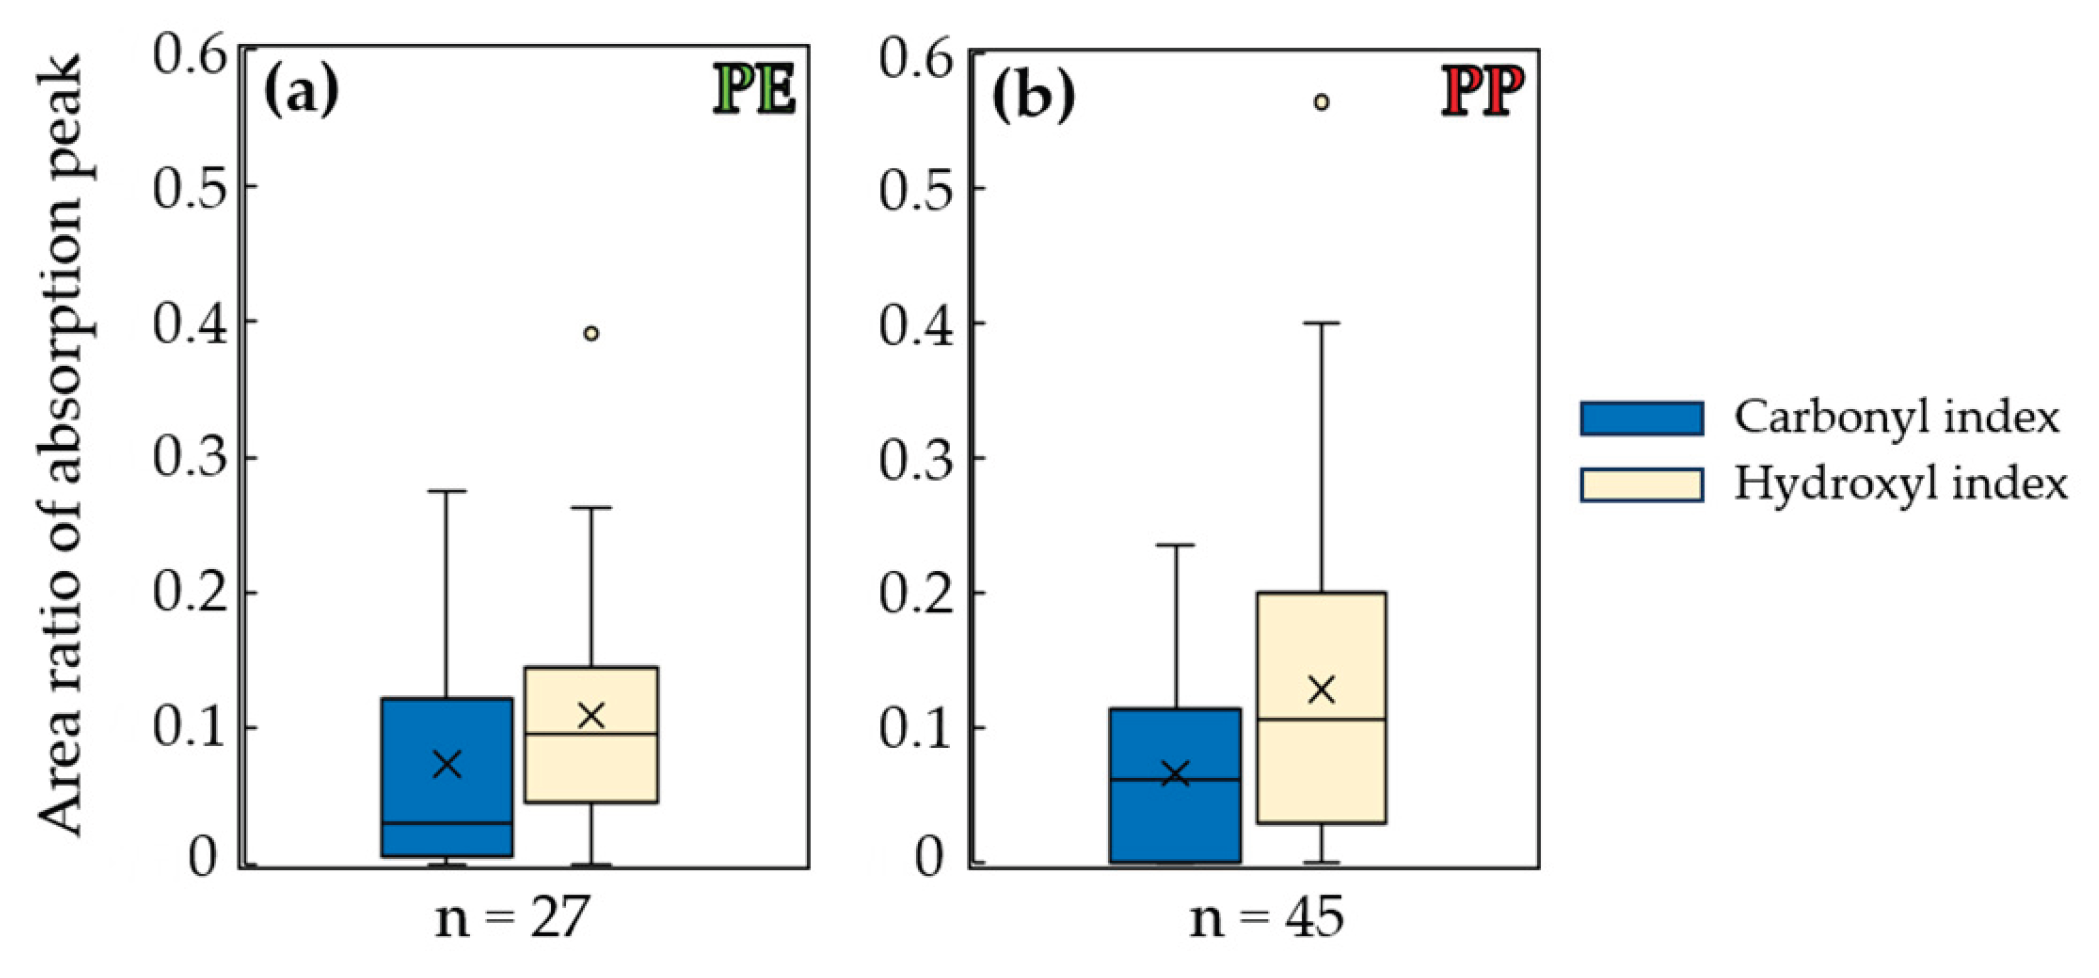
Figure 5.
Pearson correlation heat map of AMP focus with meteorology (temperature, humidity, wind speed, precipitation, rain frequency, rainfall intensity, and maximum solar radiation), particulate matters (PM2.5, PM10-2.5, OBC), gases (NO, NOx, NO2, SO2, CO, O3), and ions (Na+, K+, Mg2+, Ca2+, Cl-, NO3-, SO42-). Significant results indicate as *p < 0.05 and **p ≤ 0.01.
Figure 5.
Pearson correlation heat map of AMP focus with meteorology (temperature, humidity, wind speed, precipitation, rain frequency, rainfall intensity, and maximum solar radiation), particulate matters (PM2.5, PM10-2.5, OBC), gases (NO, NOx, NO2, SO2, CO, O3), and ions (Na+, K+, Mg2+, Ca2+, Cl-, NO3-, SO42-). Significant results indicate as *p < 0.05 and **p ≤ 0.01.
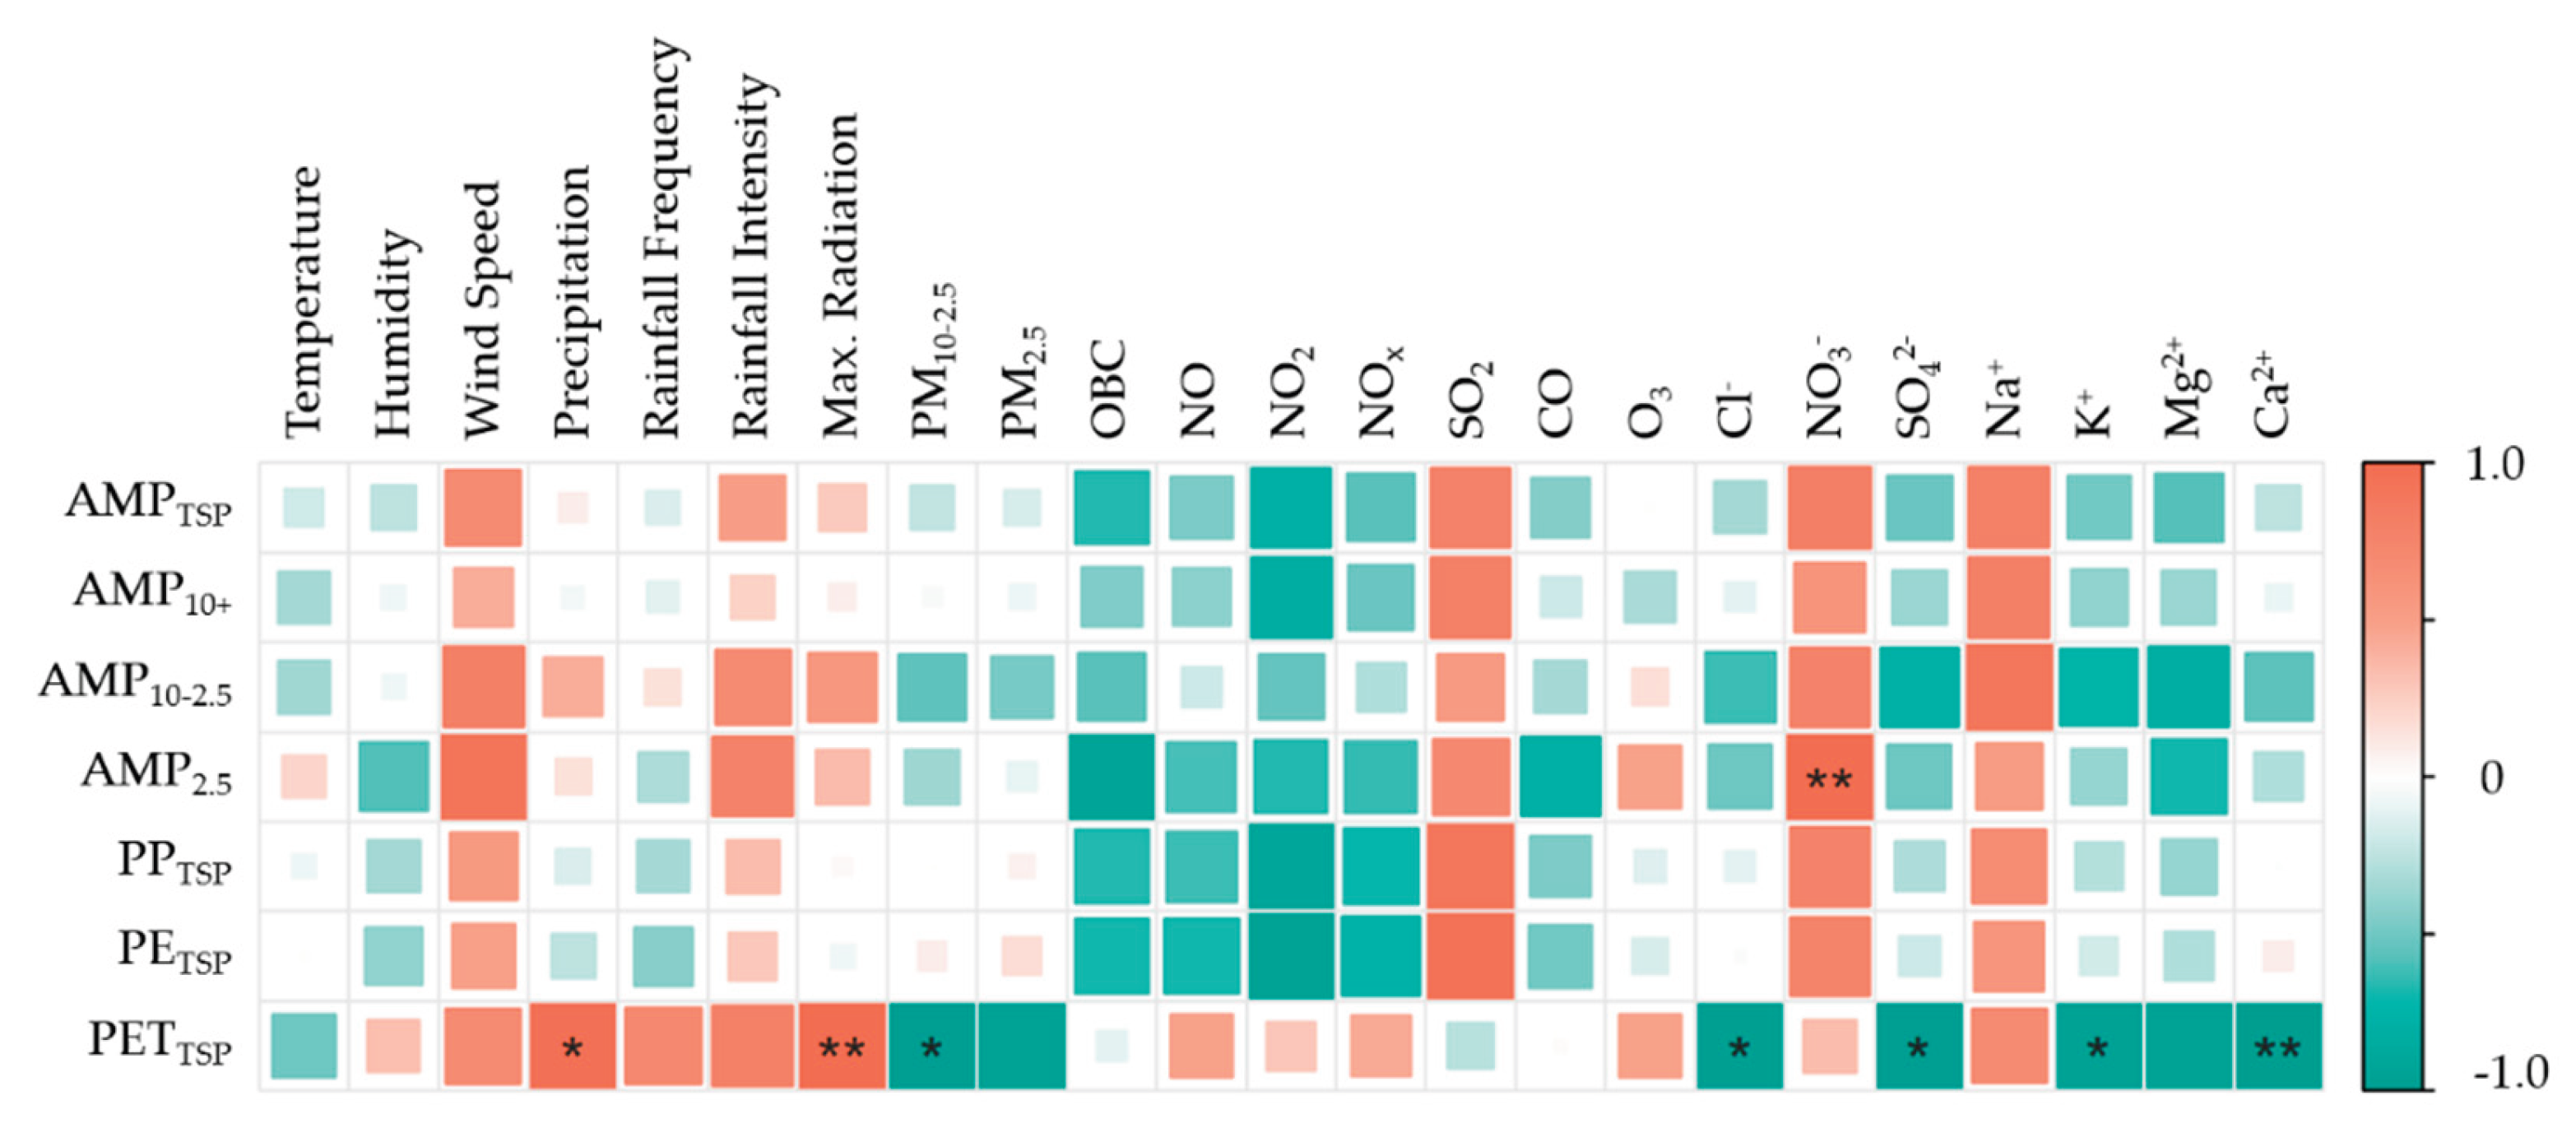
Figure 6.
Backward trajectory of air mass: (a) map showing air mass direction clustered in percentage; (b) 3D map of source route of air mass in altitude, latitude, and longitude; (c) profile of atmospheric pressure with 120-hour backward trajectory.
Figure 6.
Backward trajectory of air mass: (a) map showing air mass direction clustered in percentage; (b) 3D map of source route of air mass in altitude, latitude, and longitude; (c) profile of atmospheric pressure with 120-hour backward trajectory.
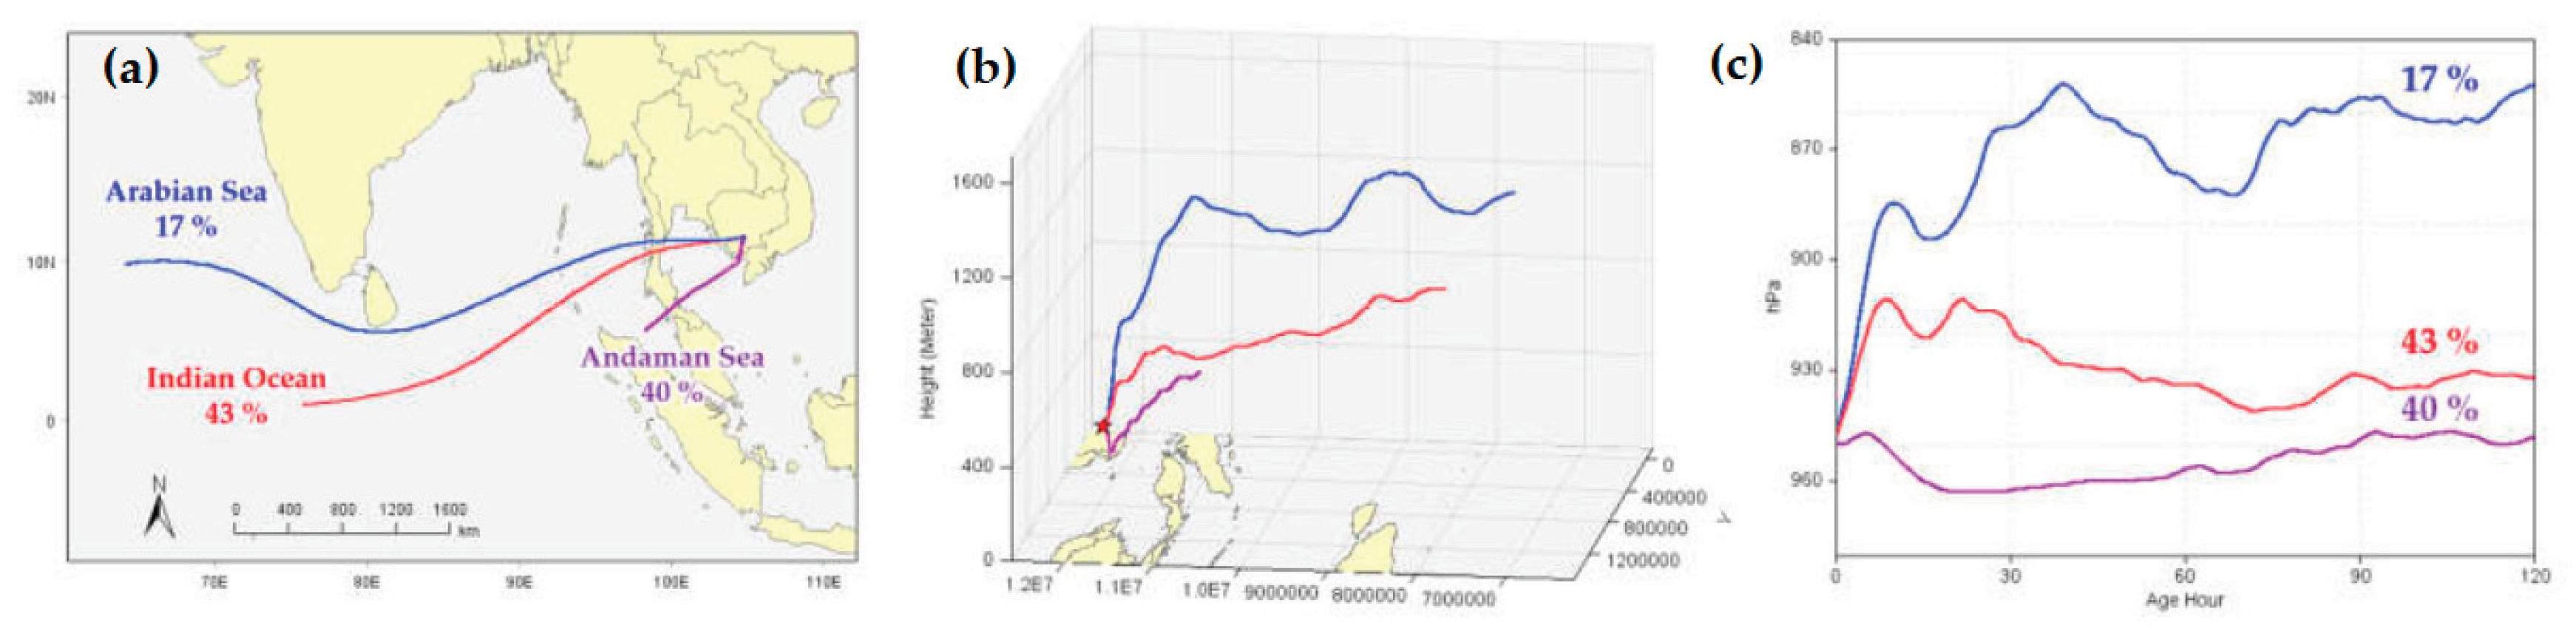
Figure 7.
Regional comparison of AMP number concentrations in Cambodia and other Asian countries.
Disclaimer/Publisher’s Note: The statements, opinions and data contained in all publications are solely those of the individual author(s) and contributor(s) and not of MDPI and/or the editor(s). MDPI and/or the editor(s) disclaim responsibility for any injury to people or property resulting from any ideas, methods, instructions or products referred to in the content. |
© 2026 by the authors. Licensee MDPI, Basel, Switzerland. This article is an open access article distributed under the terms and conditions of the Creative Commons Attribution (CC BY) license (http://creativecommons.org/licenses/by/4.0/).
Copyright: This open access article is published under a Creative Commons CC BY 4.0 license, which permit the free download, distribution, and reuse, provided that the author and preprint are cited in any reuse.


