
Submitted:
04 July 2026
Posted:
07 July 2026
You are already at the latest version
Abstract
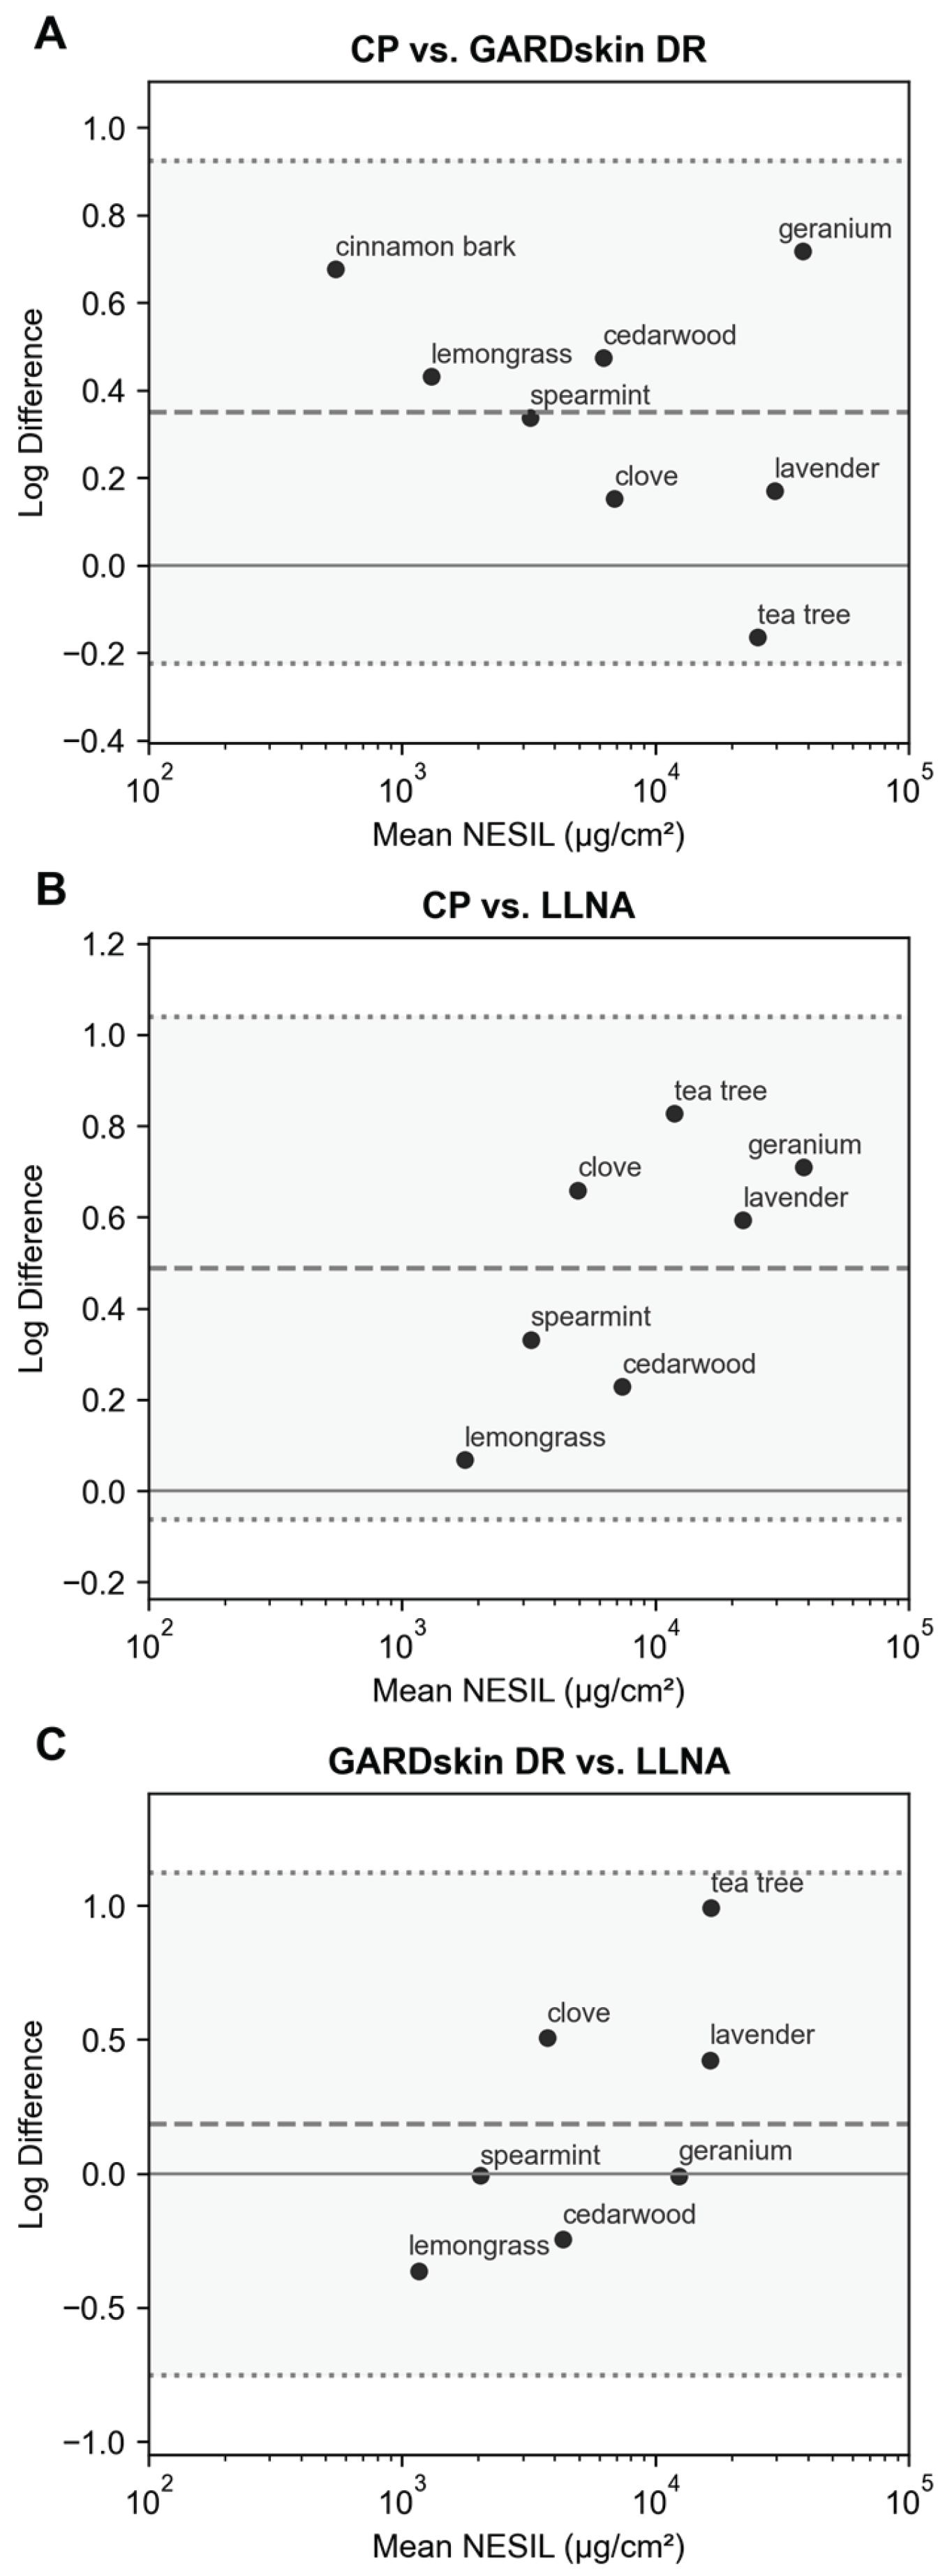
The GARDskin DR assay is a non-animal method that predicts dermal sensitization potency of discrete compounds. This comparative analysis evaluates outputs from a component-based prediction model (CP), GARDskin DR, and historical local lymph node assays (LLNA) exploring the applicability of CP and GARDskin DR for evaluating the sensitization potencies of essential oils. Eight well-studied essential oils were selected including cedarwood, cinnamon bark, clove bud, geranium, lavender, lemongrass, spearmint, and tea tree oils. Each underwent GC-MS and GARDskin DR analysis. CP model outputs, GARDskin DR and reference LLNA data were compared using standard statistical methods. Spearman’s test shows significant correlation between NESILCP vs. NESILGARD (0.881, p = 0.007) and NESILLLNA (0.929, p = 0.007) but not between NESILGARD vs. NESILLLNA (0.607, p = 0.17). Friedman’s test detected a significant difference among methods (χ²(2) = 7.71, p = 0.021), with post hoc tests showing relatively greater NESILCP values. Kendall’s W shows overall strong statistical concordance between methods (0.857, p = 0.017). NESILGARD and NESILCP generally align with NESILLLNA for the essential oils tested, although the CP method yields greater values. With the limited number of materials tested, results should be interpreted descriptively but show promise for GARDskin DR and CP for evaluating dermal sensitization potency of essential oils.
Keywords:
1. Introduction
2. Materials and Methods
2.1. Test Materials
2.2. GC-MS Analysis
2.3. Component-Based Prediction Model
2.4. GARDskin DR
2.5. LLNA Potency Measures
2.6. NESIL Comparison and Statistics
3. Results
3.1. GC-MS Analysis
3.2. Component-Based Prediction Model
3.3. GARDskin DR
3.4. NESIL Comparisons
4. Discussion
5. Conclusions
Author Contributions
Funding
Data Availability Statement
Acknowledgments
Conflicts of Interest
Abbreviations
| %AUC | percent area under the curve |
| cDV0 | the minimal concentration required to exceed the binary classification in GARDskin (DV ≥ 0) |
| CNIH | confirmation of no induction in human |
| CP | component-based prediction model |
| DV | Decision Value |
| GARDskin DR | dose-response adaptation of the Genomic Allergen Rapid Detection for skin sensitizers |
| GC-MS | gas chromatography-mass spectrometry |
| GHS | Global Harmonized System of Classification and Labeling of Chemicals |
| HRIPT | human repeat insult patch test |
| LLNA | local lymph node assay |
| LogP | logarithm of the octanol-water partition coefficient |
| MW | molecular weight |
| NAM | new approach methodology/method |
| NCS | natural complex substance |
| NESIL | no expected sensitization induction level |
| nPACds | normalized percentage of assessed constituents for dermal sensitization |
| OECD TG | Organisation for Economic Co-operation and Development Test Guideline |
| POD | point of departure |
| RI | retention index |
| RIFM | Research Institute for Fragrance Materials |
| SARA-ICE | skin allergy risk assessment-integrated chemical environment |
| WOE | weight of evidence |
Appendix A

| RI | Compound | IUPAC | CAS | %AUC | MW (g/mol) | LogP |
|---|---|---|---|---|---|---|
| 1419 | alpha-cedrene | (1S,2R,5S,7S)-2,6,6,8-tetramethyltricyclo [5.3.1.01,5]undec-8-ene | 469-61-4 | 31.8% | 204.35 | 4.6 |
| 1437 | cis-thujopsene | (1aS,4aS,8aS)-2,4a,8,8-tetramethyl-1,1a,4,5,6,7-hexahydrocyclopropa[j]naphthalene | 470-40-6 | 19.6% | 204.35 | 4.8 |
| 1611 | cedrol | (1S,2R,5S,7R,8R)-2,6,6,8-tetramethyltricyclo [5.3.1.01,5]undecan-8-ol | 77-53-2 | 10.9% | 222.37 | 3.9 |
| 1609 | widdrol | (7S,9aS)-4,4,7,9a-tetramethyl-1,2,3,6,8,9-hexahydrobenzo [7]annulen-7-ol | 6892-80-4 | 10.2% | 222.37 | 4.1 |
| 1625 | beta-cedrene | (1S,2R,5S,7S)-2,6,6-trimethyl-8-methylidenetricyclo [5.3.1.01,5]undecane | 546-28-1 | 5.8% | 204.35 | 4.9 |
| 1502 | alpha-cuprenene | 1-methyl-4-(1,2,2-trimethylcyclopentyl)cyclohexa-1,3-diene | 29621-78-1 | 2.7% | 204.35 | 4.8 |
| 1533 | gamma-cuprenene | 1-Methyl-4-[(1S)-1,2,2-trimethylcyclopentyl]-1,4-cyclohexadiene | 4895-23-2 | 1.8% | 204.35 | 4.8 |
| 1480 | gamma-gurjunene | (1R,3aR,4R,7R)-1,4-dimethyl-7-prop-1-en-2-yl-1,2,3,3a,4,5,6,7-octahydroazulene | 22567-17-5 | 1.6% | 204.35 | 5.3 |
| 1503 | pseudowiddrene | (4aS)-4,4,4a,7-tetramethyl-3,5,8,9-tetrahydro-2H-benzo [7]annulene | 32540-28-6 | 1.3% | 204.35 | 4.3 |
| 1507 | cuparene | 1-methyl-4-[(1R)-1,2,2-trimethylcyclopentyl]benzene | 16982-00-6 | 1.3% | 202.33 | 5.5 |
| 1505 | alpha-chamigrene | (6R)-1,5,5,9-tetramethylspiro [5.5]undeca-1,9-diene | 19912-83-5 | 1.1% | 204.35 | 4.4 |
| RI | Compound | IUPAC | CAS | %AUC | MW (g/mol) | LogP |
|---|---|---|---|---|---|---|
| 1277 | trans-cinnamaldehyde | (E)-3-phenylprop-2-enal | 104-55-2 | 64.2% | 132.16 | 1.9 |
| 1415 | trans-beta-caryophyllene | (1R,4E,9S)-4,11,11-trimethyl-8-methylidenebicyclo [7.2.0]undec-4-ene | 87-44-5 | 5.8% | 204.35 | 4.4 |
| 1355 | eugenol | 2-methoxy-4-(prop-2-en-1-yl)phenol | 97-53-0 | 5.4% | 164.20 | 2.0 |
| 1027 | beta-phellandrene | 3-methylidene-6-propan-2-ylcyclohexene | 555-10-2 | 3.1% | 136.23 | 3.4 |
| 1099 | linalool | 3,7-dimethylocta-1,6-dien-3-ol | 78-70-6 | 2.9% | 154.25 | 2.7 |
| 1021 | para-cymene | 1-methyl-4-propan-2-ylbenzene | 99-87-6 | 2.4% | 134.22 | 4.1 |
| 1003 | alpha-phellandrene | 2-methyl-5-propan-2-ylcyclohexa-1,3-diene | 99-83-2 | 2.1% | 136.23 | 3.2 |
| 929 | alpha-pinene | 2,6,6-trimethylbicyclo [3.1.1]hept-2-ene | 80-56-8 | 2.0% | 136.23 | 2.8 |
| 1440 | trans-cinnamyl acetate | [(E)-3-phenylprop-2-enyl] acetate | 103-54-8 | 1.5% | 176.21 | 2.3 |
| 1450 | alpha-humulene | (1E,4E,8E)-2,6,6,9-tetramethylcycloundeca-1,4,8-triene | 6753-98-6 | 1.0% | 204.35 | 4.5 |
| 1026 | limonene | (4R)-1-methyl-4-prop-1-en-2-ylcyclohexene | 5989-27-5 | 1.0% | 136.23 | 3.4 |
| RI | Compound | IUPAC | CAS | %AUC | MW (g/mol) | LogP |
|---|---|---|---|---|---|---|
| 1355 | eugenol | 2-methoxy-4-(prop-2-en-1-yl)phenol | 97-53-0 | 73.0% | 164.20 | 2.0 |
| 1511 | eugenol acetate | (2-methoxy-4-prop-2-enylphenyl) acetate | 93-28-7 | 15.1% | 206.24 | 2.3 |
| 1415 | trans-beta-caryophyllene | (1R,4E,9S)-4,11,11-trimethyl-8-methylidenebicyclo [7.2.0]undec-4-ene | 87-44-5 | 8.7% | 204.35 | 4.4 |
| 1450 | alpha-humulene | (1E,4E,8E)-2,6,6,9-tetramethylcycloundeca-1,4,8-triene | 6753-98-6 | 1.4% | 204.35 | 4.5 |
| 1576 | caryophyllene oxide | (1R,4R,6R,10S)-4,12,12-trimethyl-9-methylidene-5-oxatricyclo [8.2.0.04,6]dodecane | 1139-30-6 | 0.4% | 220.35 | 3.6 |
| RI | Compound | IUPAC | CAS | %AUC | MW (g/mol) | LogP |
|---|---|---|---|---|---|---|
| 1227 | citronellol | 3,7-dimethyloct-6-en-1-ol | 106-22-9 | 32.1% | 156.26 | 3.2 |
| 1250 | geraniol | (2E)-3,7-dimethylocta-2,6-dien-1-ol | 106-24-1 | 11.8% | 154.25 | 2.9 |
| 1270 | citronellyl formate | 3,7-Dimethyloct-6-en-1-yl formate | 105-85-1 | 10.0% | 184.27 | 3.8 |
| 1161 | isomenthone | cis-(2S,5S)-5-methyl-2-propan-2-ylcyclohexan-1-one | 491-07-6 | 6.3% | 154.25 | 2.7 |
| 1623 | 10-epi-gamma-eudesmol | 2-[(2R,4aS)-4a,8-dimethyl-2,3,4,5,6,7-hexahydro-1H-naphthalen-2-yl]propan-2-ol | 15051-81-7 | 5.0% | 222.37 | 3.4 |
| 1096 | linalool | 3,7-dimethylocta-1,6-dien-3-ol | 78-70-6 | 4.4% | 154.25 | 2.7 |
| 1294 | geranyl formate | (2E)-3,7-Dimethylocta-2,6-dien-1-yl formate | 105-86-2 | 3.6% | 182.26 | 3.5 |
| 1476 | germacrene d | (1E,6E,8S)-1-methyl-5-methylidene-8-propan-2-ylcyclodeca-1,6-diene | 23986-74-5 | 1.6% | 204.35 | 4.7 |
| 1550 | geranyl butyrate | (2E)-3,7-Dimethylocta-2,6-dien-1-yl butanoate | 106-29-6 | 1.5% | 224.34 | 4.3 |
| 1690 | geranyl tiglate | [(2E)-3,7-dimethylocta-2,6-dienyl] (E)-2-methylbut-2-enoate | 7785-33-3 | 1.5% | 236.35 | 4.7 |
| 1152 | menthone | trans-(2S,5R)-5-methyl-2-propan-2-ylcyclohexan-1-one | 14073-97-3 | 1.4% | 154.25 | 2.7 |
| 1415 | trans-beta-caryophyllene | (1R,4E,9S)-4,11,11-trimethyl-8-methylidenebicyclo [7.2.0]undec-4-ene | 87-44-5 | 1.4% | 204.35 | 4.4 |
| 1106 | cis-rose oxide | 4-methyl-2-(2-methylprop-1-enyl)oxane | 876-17-5 | 1.4% | 154.25 | 2.9 |
| 1380 | beta-bourbonene | (1S,2R,6S,7R,8S)-1-methyl-5-methylidene-8-propan-2-yltricyclo [5.3.0.02,6]decane | 5208-59-3 | 1.3% | 204.35 | 4.7 |
| 1512 | delta-cadinene | (1S,8aR)-4,7-dimethyl-1-propan-2-yl-1,2,3,5,6,8a-hexahydronaphthalene | 483-76-1 | 1.1% | 204.35 | 3.8 |
| 1576 | phenyl ethyl tiglate | 2-phenylethyl (E)-2-methylbut-2-enoate | 55719-85-2 | 1.1% | 204.26 | 3.3 |
| 1464 | geranyl propionate | [(2E)-3,7-dimethylocta-2,6-dien-1-yl] propanoate | 105-90-8 | 1.0% | 210.31 | 3.9 |
| RI | Compound | IUPAC | CAS | %AUC | MW (g/mol) | LogP |
|---|---|---|---|---|---|---|
| 1099 | linalool | 3,7-dimethylocta-1,6-dien-3-ol | 78-70-6 | 32.2% | 154.25 | 2.7 |
| 1249 | linalyl acetate | 3,7-dimethylocta-1,6-dien-3-yl acetate | 115-95-7 | 28.3% | 196.29 | 3.3 |
| 1449 | trans-beta-farnesene | (6E)-7,11-dimethyl-3-methylidenedodeca-1,6,10-triene | 18794-84-8 | 5.0% | 204.35 | 6.2 |
| 1280 | lavandulyl acetate | (5-methyl-2-prop-1-en-2-ylhex-4-en-1-yl) acetate | 25905-14-0 | 4.6% | 196.29 | 3.6 |
| 1033 | cis-beta-ocimene | (3Z)-3,7-dimethylocta-1,3,6-triene | 3338-55-4 | 4.3% | 136.23 | 4.3 |
| 1415 | trans-beta-caryophyllene | (1R,4E,9S)-4,11,11-trimethyl-8-methylidenebicyclo [7.2.0]undec-4-ene | 87-44-5 | 3.9% | 204.35 | 4.4 |
| 1178 | terpinen-4-ol | 4-methyl-1-propan-2-ylcyclohex-3-en-1-ol | 562-74-3 | 3.6% | 154.25 | 2.2 |
| 1043 | trans-beta-ocimene | (3E)-3,7-dimethylocta-1,3,6-triene | 3779-61-1 | 2.9% | 136.23 | 4.3 |
| 1192 | alpha-terpineol | 2-(4-methylcyclohex-3-en-1-yl)propan-2-ol | 98-55-5 | 1.4% | 154.25 | 1.8 |
| 981 | 3-octanone | Octan-3-one | 106-68-3 | 1.1% | 128.21 | 2.3 |
| 1029 | 1,8-cineole | 1,3,3-trimethyl-2-oxabicyclo [2.2.2]octane | 470-82-6 | 1.0% | 154.25 | 2.5 |
| RI | Compound | IUPAC | CAS | %AUC | MW (g/mol) | LogP |
|---|---|---|---|---|---|---|
| 1270 | geranial | (2E)-3,7-dimethylocta-2,6-dienal | 141-27-5 | 41.5% | 152.23 | 3.0 |
| 1240 | neral | (2Z)-3,7-dimethylocta-2,6-dienal | 106-26-3 | 31.1% | 152.23 | 3.0 |
| 1250 | geraniol | (2E)-3,7-dimethylocta-2,6-dien-1-ol | 106-24-1 | 7.5% | 154.25 | 2.9 |
| 1375 | geranyl acetate | (2E)-3,7-dimethylocta-2,6-dien-1-yl acetate | 105-87-3 | 5.0% | 196.29 | 3.5 |
| 1177 | trans-isocitral | (3E)-3,7-dimethylocta-3,6-dienal | 72203-98-6 | 1.5% | 152.23 | 2.9 |
| 1415 | trans-beta-caryophyllene | (1R,4E,9S)-4,11,11-trimethyl-8-methylidenebicyclo [7.2.0]undec-4-ene | 87-44-5 | 1.3% | 204.35 | 4.4 |
| 1068 | 4-nonanone | Nonan-4-one | 4485-09-0 | 1.2% | 142.24 | 2.8 |
| 1099 | linalool | 3,7-dimethylocta-1,6-dien-3-ol | 78-70-6 | 1.1% | 154.25 | 2.7 |
| 981 | 6-methyl-5-hepten-2-one | 6-methylhept-5-en-2-one | 110-93-0 | 1.1% | 126.2 | 1.9 |
| 1509 | gamma-cadinene | (1R,4aS,8aS)-7-methyl-4-methylidene-1-propan-2-yl-2,3,4a,5,6,8a-hexahydro-1H-naphthalene | 1460-97-5 | 1.1% | 204.35 | 4.3 |
| RI | Compound | IUPAC | CAS | %AUC | MW (g/mol) | LogP |
|---|---|---|---|---|---|---|
| 1249 | carvone | (5R)-2-methyl-5-prop-1-en-2-ylcyclohex-2-en-1-one | 6485-40-1 | 59.4% | 150.22 | 2.4 |
| 1026 | limonene | (4R)-1-methyl-4-prop-1-en-2-ylcyclohexene | 5989-27-5 | 22.5% | 136.23 | 3.4 |
| 1029 | 1,8-cineole | 1,3,3-trimethyl-2-oxabicyclo [2.2.2]octane | 470-82-6 | 2.0% | 154.25 | 2.5 |
| 987 | myrcene | 7-methyl-3-methylideneocta-1,6-diene | 123-35-3 | 1.7% | 136.23 | 4.3 |
| 1380 | beta-bourbonene | (1S,2R,6S,7R,8S)-1-methyl-5-methylidene-8-propan-2-yltricyclo [5.3.0.02,6]decane | 5208-59-3 | 1.4% | 204.35 | 4.7 |
| 1196 | cis-dihydro-carvone | cis-(2R,5S)-2-methyl-5-prop-1-en-2-ylcyclohexan-1-one | 3792-53-8 | 1.4% | 152.23 | 2.7 |
| 975 | beta-pinene | 6,6-dimethyl-2-methylidenebicyclo [3.1.1]heptane | 127-91-3 | 1.1% | 136.23 | 3.1 |
| 1415 | trans-beta-caryophyllene | (1R,4E,9S)-4,11,11-trimethyl-8-methylidenebicyclo [7.2.0]undec-4-ene | 87-44-5 | 1.0% | 204.35 | 4.4 |
| RI | Compound | IUPAC | CAS | %AUC | MW (g/mol) | LogP |
|---|---|---|---|---|---|---|
| 1178 | terpinen-4-ol | 4-methyl-1-propan-2-ylcyclohex-3-en-1-ol | 562-74-3 | 41.4% | 154.25 | 2.2 |
| 1052 | gamma-terpinene | 1-methyl-4-propan-2-ylcyclohexa-1,4-diene | 99-85-4 | 20.6% | 136.23 | 2.8 |
| 1010 | alpha-terpinene | 1-methyl-4-propan-2-ylcyclohexa-1,3-diene | 99-86-5 | 10.7% | 136.23 | 2.8 |
| 1029 | 1,8-cineole | 1,3,3-trimethyl-2-oxabicyclo [2.2.2]octane | 470-82-6 | 3.8% | 154.25 | 2.5 |
| 1085 | terpinolene | 1-methyl-4-propan-2-ylidenecyclohexene | 586-62-9 | 3.5% | 136.23 | 2.8 |
| 1187 | alpha-terpineol | 2-(4-methylcyclohex-3-en-1-yl)propan-2-ol | 98-55-5 | 3.0% | 154.25 | 1.8 |
| 925 | alpha-pinene | 2,6,6-trimethylbicyclo [3.1.1]hept-2-ene | 80-56-8 | 2.5% | 136.23 | 2.8 |
| 1021 | para-cymene | 1-methyl-4-propan-2-ylbenzene | 99-87-6 | 1.9% | 134.22 | 4.1 |
| 918 | alpha-thujene | 2-methyl-5-propan-2-ylbicyclo [3.1.0]hex-2-ene | 2867-05-2 | 1.0% | 136.23 | 2.8 |
| 1026 | limonene | (4R)-1-methyl-4-prop-1-en-2-ylcyclohexene | 5989-27-5 | 1.0% | 136.23 | 3.4 |
Appendix B
| Material Name | EC3 (%) | NESILLLNA (µg/cm2) |
Reference |
|---|---|---|---|
| Cedarwood Oil | 22% | 5500 | [33] |
| Cinnamon Bark Oil | n/a | n/a | n/a |
| Clove Bud Oil | 7.1% | 1775 | [34] |
| Geranium Oil | >50% | >12,500 | [35] |
| Lavender Oil | 36% | 9000 | [36] |
| Lemongrass Oil | 6.5% | 1625 | [35] |
| Spearmint Oil | 8.2% | 2050 | [34] |
| Tea Tree Oil | 4.4% | 1100 | [37] |
| Tea Tree Oil | 8.3% | 2075 | [37] |
| Tea Tree Oil | 24.3% | 6075 | [37] |
| Tea Tree Oil | 25.5% | 6375 | [37] |
References
- UN. Globally Harmonized System of Classification and Labeling of Chemicals (GHS), 10th revised edition.; United Nations: New York and Geneva, 2023; pp. 169–190. [Google Scholar]
- Api, A. M.; Belsito, D.; Bruze, M.; Cadby, P.; Calow, P.; Dagli, M. L.; Dekant, W.; Ellis, G.; Fryer, A. D.; Fukayama, M.; Griem, P.; Hickey, C.; Kromidas, L.; Lalko, J. F.; Liebler, D. C.; Miyachi, Y.; Politano, V. T.; Renskers, K.; Ritacco, G.; Salvito, D.; Schultz, T. W.; Sipes, I. G.; Smith, B.; Vitale, D.; Wilcox, D. K. Criteria for the Research Institute for Fragrance Materials, Inc. (RIFM) Safety Evaluation Process for Fragrance Ingredients. Food Chem. Toxicol. 2015, 82, S1–S19. [Google Scholar] [CrossRef] [PubMed]
- Api, A. M.; Basketter, D.; Bridges, J.; Cadby, P.; Ellis, G.; Gilmour, N.; Greim, H.; Griem, P.; Kern, P.; Khaiat, A.; O’Brien, J.; Rustemeyer, T.; Ryan, C.; Safford, B.; Smith, B.; Vey, M.; White, I. R. Updating Exposure Assessment for Skin Sensitization Quantitative Risk Assessment for Fragrance Materials. Regul. Toxicol. Pharmacol. 2020, 118, 104805. [Google Scholar] [CrossRef] [PubMed]
- Api, A. M.; Belsito, D.; Botelho, D.; Bruze, M.; Burton, G. A.; Buschmann, J.; Cancellieri, M. A.; Dagli, M. L.; Date, M.; Dekant, W.; Deodhar, C.; Fryer, A. D.; Jones, L.; Joshi, K.; Kumar, M.; Lapczynski, A.; Lavelle, M.; Lee, I.; Liebler, D. C.; Moustakas, H.; Na, M.; Penning, T. M.; Ritacco, G.; Romine, J.; Sadekar, N.; Schultz, T. W.; Selechnik, D.; Siddiqi, F.; Sipes, I. G.; Sullivan, G.; Thakkar, Y.; Tokura, Y. The RIFM Approach to Evaluating Natural Complex Substances (NCS). Food Chem. Toxicol. 2022, 159 Suppl 1, 112715. [Google Scholar] [CrossRef] [PubMed]
- SCCS (Scientific Committee on Consumer Safety), Opinion on Skin Sensitisation Quantitative Risk Assessment for Fragrance Ingredients (QRA2), preliminary version of 24-25 October 2017, final version of 30 July 2018, SCCS/1589/17.
- Loveless, S. E.; Api, A.-M.; Crevel, R. W. R.; Debruyne, E.; Gamer, A.; Jowsey, I. R.; Kern, P.; Kimber, I.; Lea, L.; Lloyd, P. Potency Values from the Local Lymph Node Assay: Application to Classification, Labelling and Risk Assessment. Regul. Toxicol. Pharmacol. 2010, 56(1), 54–66. [Google Scholar] [CrossRef] [PubMed]
- Politano, V. T.; Api, A. M. The Research Institute for Fragrance Materials’ Human Repeated Insult Patch Test Protocol. Regul. Toxicol. Pharmacol. 2008, 52(1), 35–38. [Google Scholar] [CrossRef] [PubMed]
- ICCS - International Collaboration on Cosmetic Safety. ICCS New Approach Methodologies (NAMs) definition - Advancing Animal-Free Assessments of Cosmetics and Their Ingredients. Available online: https://www.iccs-cosmetics.org/iccs-nams-definition (accessed on 14 June 2026).
- Prescott, M. J.; Lidster, K. Improving Quality of Science through Better Animal Welfare: The NC3Rs Strategy. Lab Anim. 2017, 46(4), 152–156. [Google Scholar] [CrossRef] [PubMed]
- Islas-Robles, A.; Ramani, M.; Phillips, J.; Costin, G.-E.; Islas-Robles, A.; Ramani, M.; Phillips, J.; Costin, G.-E. New Horizons in Skin Sensitization Assessment of Complex Mixtures: The Use of New Approach Methodologies Beyond Regulatory Approaches. Toxics 2025, 13(8). [Google Scholar] [CrossRef] [PubMed]
- Reinke, E. N.; Reynolds, J.; Gilmour, N.; Reynolds, G.; Strickland, J.; Germolec, D.; Allen, D. G.; Maxwell, G.; Kleinstreuer, N. C. The Skin Allergy Risk Assessment-Integrated Chemical Environment (SARA-ICE) Defined Approach to Derive Points of Departure for Skin Sensitization. Curr. Res. Toxicol. 2025, 8, 100205. [Google Scholar] [CrossRef] [PubMed]
- Donthamsetty, S.; Forreryd, A.; Sterchele, P.; Huang, X.; Gradin, R.; Johansson, H.; Mattson, U.; Lee, I.; Api, A. M.; Ladics, G. GARDskin Dose-Response Assay and Its Application in Conducting Quantitative Risk Assessment (QRA) for Fragrance Materials Using a Next Generation Risk Assessment (NGRA) Framework. Regul. Toxicol. Pharmacol. 2024, 149, 105597. [Google Scholar] [CrossRef] [PubMed]
- Gradin, R.; Tourneix, F.; Mattson, U.; Andersson, J.; Amaral, F.; Forreryd, A.; Alépée, N.; Johansson, H. In Vitro Prediction of Skin-Sensitizing Potency Using the GARDskin Dose–Response Assay: A Simple Regression Approach. Toxics 2024, 12(9), 626. [Google Scholar] [CrossRef] [PubMed]
- Luechtefeld, T.; Maertens, A.; Russo, D. P.; Rovida, C.; Zhu, H.; Hartung, T. Analysis of Publically Available Skin Sensitization Data from REACH Registrations 2008–2014. ALTEX 2016, 33(2), 135–148. [Google Scholar] [CrossRef] [PubMed]
- Maertens, A.; Golden, E.; Luechtefeld, T. H.; Hoffmann, S.; Tsaioun, K.; Hartung, T. Probabilistic Risk Assessment – The Keystone for the Future of Toxicology. ALTEX 2022, 39(1), 3–29. [Google Scholar] [CrossRef] [PubMed]
- Roberts, D. W.; Api, A. M. Chemical Applicability Domain of the Local Lymph Node Assay (LLNA) for Skin Sensitisation Potency. Part 4. Quantitative Correlation of LLNA Potency with Human Potency. Regul. Toxicol. Pharmacol. 2018, 96, 76–84. [Google Scholar] [CrossRef] [PubMed]
- Dumont, C.; Barroso, J.; Matys, I.; Worth, A.; Casati, S. Analysis of the Local Lymph Node Assay (LLNA) Variability for Assessing the Prediction of Skin Sensitisation Potential and Potency of Chemicals with Non-Animal Approaches. Toxicol. In Vitro 2016, 34, 220–228. [Google Scholar] [CrossRef] [PubMed]
- Natsch, A.; Kleinstreuer, N.; Asturiol, D. Reduced Specificity for the Local Lymph Node Assay for Lipophilic Chemicals: Implications for the Validation of New Approach Methods for Skin Sensitization. Regul. Toxicol. Pharmacol. 2023, 138, 105333. [Google Scholar] [CrossRef] [PubMed]
- Nonclinical Evaluation of the Immunotoxic Potential of Pharmaceuticals; Guidance for Industry; Pharmacology/Toxicology; U.S. Department of Health and Human Services Food and Drug Administration Center for Drug Evaluation and Research: Silver Spring, MD, USA, 2023, pp. 7.
- OECD. Test No. 442E: In Vitro Skin Sensitisation: In Vitro Skin Sensitisation Assays Addressing the Key Event on Activation of Dendritic Cells on the Adverse Outcome Pathway for Skin Sensitisation; OECD Guidelines for the Testing of Chemicals; OECD Publishing: Paris, 2024. [CrossRef]
- OECD. Guideline No. 497: Defined Approaches on Skin Sensitisation; OECD Guidelines for the Testing of Chemicals; OECD Publishing: Paris, 2025. [Google Scholar] [CrossRef]
- NTP/NICEATM. Evaluation of the GARDTMskin Sensitization Test Method Using Substances of Regulatory Interest; National Institute of Environmental Health Sciences NIH DHHS, 2025. [CrossRef]
- Lee, I.; Forreryd, A.; Na, M.; Schember, I.; Lavelle, M.; Gradin, R.; Mattson, U.; Johansson, H.; Donthamsetty, S.; Ladics, G.; Api, A. M. Determining a Point of Departure for Skin Sensitization Potency and Quantitative Risk Assessment of Fragrance Ingredients Using the GARDskin Dose-Response Assay. ALTEX 2025, 42(2), 263–277. [Google Scholar] [CrossRef] [PubMed]
- Gradin, R.; Forreryd, A.; Mattson, U.; Jerre, A.; Johansson, H. Quantitative Assessment of Sensitizing Potency Using a Dose-Response Adaptation of GARDskin. Sci. Rep. 2021, 11(1), 18904. [Google Scholar] [CrossRef] [PubMed]
- Desai, K. R.; Ranade, J. R.; Nagane, R. M.; Patel, M. V.; Deshpande, A. D.; Roper, C. S.; Kantli, G. B.; Desai, K. R.; Ranade, J. R.; Nagane, R. M.; Patel, M. V.; Deshpande, A. D.; Roper, C. S.; Kantli, G. B. Comprehensive In Vitro Safety Assessment of Acorus Calamus Rhizome Oil Using OECD-Compliant New Approach Methods: Classification as a GHS Category 1B Sensitiser and Category 2 Irritant. Toxics 2025, 13(12), 1006. [Google Scholar] [CrossRef] [PubMed]
- Omeragic, E.; Dedic, M.; Elezovic, A.; Becic, E.; Imamovic, B.; Kladar, N.; Niksic, H. Application of Direct Peptide Reactivity Assay for Assessing the Skin Sensitization Potential of Essential Oils. Sci. Rep. 2022, 12(1), 7470. [Google Scholar] [CrossRef] [PubMed]
- Mitchell, C. A.; Roe, A. L.; Auerbach, S.; Bascoul, C.; Embry, M.; Ferguson, S.; Gafner, S.; Gossmann, M.; Gurley, B. J.; Johnson, H.; Kelber, O.; Krzykwa, J.; Larson, J.; Liu, Y.; Mahony, C.; Monteiro da Rocha, A.; Pfuhler, S.; Sica, V.; Waidyanatha, S.; Westerink, R. H. S.; Rider, C. From Vision to Reality: Five Years of the Botanical Safety Consortium. Pharm. Biol. 2025, 63(1), 800–818. [Google Scholar] [CrossRef] [PubMed]
- Puginier, M.; Roso, A.; Groux, H.; Gerbeix, C.; Cottrez, F. Strategy to Avoid Skin Sensitization: Application to Botanical Cosmetic Ingredients. Cosmetics 2022, 9(2), 40. [Google Scholar] [CrossRef]
- Imai, K.; Hatakeyama, Y.; Atobe, T.; Ohtake, T.; Oeda, S.; Hirota, M. Case Studies on Skin Sensitization Risk Assessment: Estimating the PoD Using Artificial Neural Network-Based Models for Substances with Known and Unknown Structure. Regul. Toxicol. Pharmacol. 2026, 164, 105978. [Google Scholar] [CrossRef] [PubMed]
- Adams, R. P. Identification of Essential Oil Components by Gas Chromatography/Quadrupole Mass Spectroscopy, 4th ed.; Allured Publishing: Carol Stream, IL, USA, 2007. [Google Scholar]
- Satyal, P. Development of GC-MS Database of Essential Oil Components by the Analysis of Natural Essential Oils and Synthetic Compounds and Discovery of Biologically Active Novel Chemotypes in Essential Oils. PhD Dissertation, University of Alabama in Huntsville, Huntsville, AL, USA, 2015. Available online: https://louis.uah.edu/uah-dissertations/63.
- Johansson, H.; Lindstedt, M.; Albrekt, A.-S.; Borrebaeck, C. A. K. A Genomic Biomarker Signature Can Predict Skin Sensitizers Using a Cell-Based in Vitro Alternative to Animal Tests. BMC Genom. 2011, 12, 399. [Google Scholar] [CrossRef] [PubMed]
- ECHA. Juniper, Juniperus Virginiana, Ext. EC Number 285-370-3 CAS Number 85085-41-2 - Registration Dossier; REACH Registration; Helsinki, Finland, 2017. Available online: https://chem.echa.europa.eu/100.077.582/dossier-view/0d373a93-35d0-4459-a324-b99ad2a4c0be/d3aa1c34-aef6-4882-a6ab-83aa1b06ce76_d3aa1c34-aef6-4882-a6ab-83aa1b06ce76?searchText=juniperus%20virginiana (accessed on 2 March 2026).
- NTP. ICCVAM Evaluations of the Murine Local Lymph Node Assay (LLNA), 2013. Available online: https://ntp.niehs.nih.gov/iccvam/methods/immunotox/niceatm-llnadatabase-23dec2013.xls (accessed on 2 March 2026).
- Lalko, J.; Api, A. M. Investigation of the Dermal Sensitization Potential of Various Essential Oils in the Local Lymph Node Assay. Food Chem. Toxicol. 2006, 44(5), 739–746. [Google Scholar] [CrossRef] [PubMed]
- Hagvall, L.; Sköld, M.; Bråred-Christensson, J.; Börje, A.; Karlberg, A.-T. Lavender Oil Lacks Natural Protection against Autoxidation, Forming Strong Contact Allergens on Air Exposure. Contact Dermat. 2008, 59(3), 143–150. [Google Scholar] [CrossRef] [PubMed]
- ECHA. Melaleuca Alternifolia, Ext. EC Number 285-377-1 CAS Number 85085-48-9 - Registration Dossier; REACH Registration; Helsinki, Finland, 2018. Available online: https://chem.echa.europa.eu/100.077.588/dossier-view/69b92e4a-e867-4745-8fbf-637d789a2217/372bcf33-7b77-438a-88fe-e9e3a1b24ac7_372bcf33-7b77-438a-88fe-e9e3a1b24ac7?searchText=melaleuca (accessed on 2 March 2026).
- Basketter, D. A.; Clapp, C.; Jefferies, D.; Safford, B.; Ryan, C. A.; Gerberick, F.; Dearman, R. J.; Kimber, I. Predictive Identification of Human Skin Sensitization Thresholds. Contact Dermat. 2005, 53(5), 260–267. [Google Scholar] [CrossRef] [PubMed]
- Api, A. M.; Bartlett, A.; Belsito, D.; Botelho, D.; Bruze, M.; Bryant-Friedrich, A.; Burton, G. A.; Cancellieri, M. A.; Chon, H.; Cronin, M.; Crotty, S.; Dagli, M. L.; Dekant, W.; Deodhar, C.; Farrell, K.; Fryer, A. D.; Jones, L.; Joshi, K.; Lapczynski, A.; Laskin, D. L.; Lavelle, M.; Lee, I.; Moustakas, H.; Muldoon, J.; Penning, T. M.; Piersma, A. H.; Ritacco, G.; Sadekar, N.; Schember, I.; Schultz, T. W.; Siddiqi, F.; Sipes, I. G.; Sullivan, G.; Thakkar, Y. RIFM Fragrance Ingredient Safety Assessment, Cedrene, CAS Registry Number 11028-42-5. Food Chem. Toxicol. 2025, 206 Suppl 1, 115835. [Google Scholar] [CrossRef] [PubMed]
- Api, A. M.; Belmonte, F.; Belsito, D.; Biserta, S.; Botelho, D.; Bruze, M.; Burton, G. A.; Buschmann, J.; Cancellieri, M. A.; Dagli, M. L.; Date, M.; Dekant, W.; Deodhar, C.; Fryer, A. D.; Gadhia, S.; Jones, L.; Joshi, K.; Lapczynski, A.; Lavelle, M.; Liebler, D. C.; Na, M.; O’Brien, D.; Patel, A.; Penning, T. M.; Ritacco, G.; Rodriguez-Ropero, F.; Romine, J.; Sadekar, N.; Salvito, D.; Schultz, T. W.; Sipes, I. G.; Sullivan, G.; Thakkar, Y.; Tokura, Y.; Tsang, S. RIFM Fragrance Ingredient Safety Assessment, Cinnamaldehyde, CAS Registry Number 104-55-2. Food Chem. Toxicol. 2019, 134 Suppl 1, 110710. [Google Scholar] [CrossRef] [PubMed]
- Api, A. M.; Belsito, D.; Botelho, D.; Bruze, M.; Burton, G. A.; Buschmann, J.; Cancellieri, M. A.; Dagli, M. L.; Date, M.; Dekant, W.; Deodhar, C.; Fryer, A. D.; Jones, L.; Joshi, K.; Kumar, M.; Lapczynski, A.; Lavelle, M.; Lee, I.; Liebler, D. C.; Moustakas, H.; Na, M.; Penning, T. M.; Ritacco, G.; Romine, J.; Sadekar, N.; Schultz, T. W.; Selechnik, D.; Siddiqi, F.; Sipes, I. G.; Sullivan, G.; Thakkar, Y.; Tokura, Y. Update to RIFM Fragrance Ingredient Safety Assessment, Eugenol, CAS Registry Number 97-53-0. Food Chem. Toxicol. 2022, 163 Suppl 1, 113027. [Google Scholar] [CrossRef] [PubMed]
- Api, A. M.; Belsito, D.; Botelho, D.; Bruze, M.; Burton, G. A.; Buschmann, J.; Cancellieri, M. A.; Dagli, M. L.; Date, M.; Dekant, W.; Deodhar, C.; Fryer, A. D.; Jones, L.; Joshi, K.; Kumar, M.; Lapczynski, A.; Lavelle, M.; Lee, I.; Liebler, D. C.; Moustakas, H.; Na, M.; Penning, T. M.; Ritacco, G.; Romine, J.; Sadekar, N.; Schultz, T. W.; Selechnik, D.; Siddiqi, F.; Sipes, I. G.; Sullivan, G.; Thakkar, Y.; Tokura, Y. RIFM Fragrance Ingredient Safety Assessment, Citronellyl Formate, CAS Registry Number 105-85-1. Food Chem. Toxicol. 2021, 158 Suppl 1, 112621. [Google Scholar] [CrossRef] [PubMed]
- Api, A. M.; Bartlett, A.; Belsito, D.; Botelho, D.; Bruze, M.; Bryant-Freidrich, A.; Burton, G. A.; Cancellieri, M. A.; Chon, H.; Dagli, M. L.; Dekant, W.; Deodhar, C.; Farrell, K.; Fryer, A. D.; Jones, L.; Joshi, K.; Lapczynski, A.; Lavelle, M.; Lee, I.; Moustakas, H.; Muldoon, J.; Penning, T. M.; Ritacco, G.; Sadekar, N.; Schember, I.; Schultz, T. W.; Siddiqi, F.; Sipes, I. G.; Sullivan, G.; Thakkar, Y.; Tokura, Y. Update to RIFM Fragrance Ingredient Safety Assessment, Linalyl Acetate, CAS Registry Number 115-95-7. Food Chem. Toxicol. 2024, 192 Suppl 1, 114805. [Google Scholar] [CrossRef] [PubMed]
- Api, A. M.; Bartlett, A.; Belsito, D.; Botelho, D.; Bruze, M.; Bryant-Friedrich, A.; Burton, G. A.; Cancellieri, M. A.; Chon, H.; Cronin, M.; Crotty, S.; Dagli, M. L.; Dekant, W.; Deodhar, C.; Farrell, K.; Fryer, A. D.; Jones, L.; Joshi, K.; Lapczynski, A.; Laskin, D. L.; Lavelle, M.; Lee, I.; Moustakas, H.; Muldoon, J.; Penning, T. M.; Piersma, A. H.; Ritacco, G.; Sadekar, N.; Schember, I.; Schultz, T. W.; Siddiqi, F.; Sipes, I. G.; Sullivan, G.; Thakkar, Y. Update to RIFM Fragrance Ingredient Safety Assessment, Citral, CAS Registry Number 5392-40-5. Food Chem. Toxicol. 2026, 210 Suppl 1, 115950. [Google Scholar] [CrossRef] [PubMed]
- Api, A. M.; Belsito, D.; Botelho, D.; Bruze, M.; Burton, G. A.; Buschmann, J.; Cancellieri, M. A.; Dagli, M. L.; Date, M.; Dekant, W.; Deodhar, C.; Fryer, A. D.; Jones, L.; Joshi, K.; Kumar, M.; Lapczynski, A.; Lavelle, M.; Lee, I.; Liebler, D. C.; Moustakas, H.; Na, M.; Penning, T. M.; Ritacco, G.; Romine, J.; Sadekar, N.; Schultz, T. W.; Selechnik, D.; Siddiqi, F.; Sipes, I. G.; Sullivan, G.; Thakkar, Y.; Tokura, Y. RIFM Fragrance Ingredient Safety Assessment, l-Carvone, CAS Registry Number 6485-40-1. Food Chem. Toxicol. 2022, 163 Suppl 1, 112975. [Google Scholar] [CrossRef] [PubMed]
- Api, A. M.; Belsito, D.; Botelho, D.; Bruze, M.; Burton, G. A.; Buschmann, J.; Cancellieri, M. A.; Dagli, M. L.; Date, M.; Dekant, W.; Deodhar, C.; Fryer, A. D.; Jones, L.; Joshi, K.; Kumar, M.; Lapczynski, A.; Lavelle, M.; Lee, I.; Liebler, D. C.; Moustakas, H.; Na, M.; Penning, T. M.; Ritacco, G.; Romine, J.; Sadekar, N.; Schultz, T. W.; Selechnik, D.; Siddiqi, F.; Sipes, I. G.; Sullivan, G.; Thakkar, Y.; Tokura, Y. RIFM Fragrance Ingredient Safety Assessment, p-Mentha-1,3-Diene, CAS Registry Number 99-86-5. Food Chem. Toxicol. 2022, 159 Suppl 1, 112712. [Google Scholar] [CrossRef] [PubMed]
- Roberts, D. W.; Api, A. M.; Aptula, A. O. Chemical applicability domain of the Local Lymph Node Assay (LLNA) for skin sensitisation potency. Part 2. The biological variability of the murine Local Lymph Node Assay (LLNA) for skin sensitization. Regul. Toxicol. Pharmacol. 2016, 80, 255–259. [Google Scholar] [CrossRef] [PubMed]
- Hoffmann, S. LLNA Variability: An Essential Ingredient for a Comprehensive Assessment of Non-Animal Skin Sensitization Test Methods and Strategies. ALTEX 2015, 32(4), 379–383. [Google Scholar] [CrossRef] [PubMed]
- Nilsson, A.-M.; Bergström, M. A.; Luthman, K.; Nilsson, J. L. G.; Karlberg, A.-T. An Alpha,Beta-Unsaturated Oxime Identified as a Strong Contact Allergen. Indications of Antigen Formation via Several Pathways. Food Chem. Toxicol. 2005, 43(11), 1627–1636. [Google Scholar] [CrossRef] [PubMed]
- Kern, P. S.; Gerberick, G. F.; Ryan, C. A.; Kimber, I.; Aptula, A.; Basketter, D. A. Local Lymph Node Data for the Evaluation of Skin Sensitization Alternatives: A Second Compilation. Dermat. Contact Atopic Occup. Drug 2010, 21(1), 8–32. [Google Scholar] [CrossRef]
- Takeyoshi, M.; Noda, S.; Yamazaki, S.; Kakishima, H.; Yamasaki, K.; Kimber, I. Assessment of the Skin Sensitization Potency of Eugenol and Its Dimers Using a Non-Radioisotopic Modification of the Local Lymph Node Assay. J. Appl. Toxicol. 2004, 24(1), 77–81. [Google Scholar] [CrossRef] [PubMed]
- Sköld, M.; Hagvall, L.; Karlberg, A.-T. Autoxidation of Linalyl Acetate, the Main Component of Lavender Oil, Creates Potent Contact Allergens. Contact Dermat. 2008, 58(1), 9–14. [Google Scholar] [CrossRef] [PubMed]
- SCCS (Scientific Committee on Consumer Safety), Scientific Opinion on Tea Tree Oil (CAS/EC No. 68647-73-4 /285-377-1) used in cosmetic products, preliminary version of 28 May 2025, final version of 30 October 2025, SCCS/1681/25. 28 May.
- Aspres, N.; Freeman, S. Predictive Testing for Irritancy and Allergenicity of Tea Tree Oil in Normal Human Subjects. Exog. Dermatol. 2003, 2(5), 258–261. [Google Scholar] [CrossRef]
- SCCP (Scientific Committee on Consumer Products), Opinion on Tea Tree Oil, final version of 16 December 2008, SCCP/1155/08.
- Bergström, M. A.; Luthman, K.; Nilsson, J. L.; Karlberg, A. T. Conjugated dienes as prohaptens in contact allergy: in vivo and in vitro studies of structure-activity relationships, sensitizing capacity, and metabolic activation. Chem. Res. Toxicol. 2006, 19(6), 760–769. [Google Scholar] [CrossRef] [PubMed]
- Api, A. M.; Belsito, D.; Botelho, D.; Bruze, M.; Burton, G. A.; Buschmann, J.; Cancellieri, M. A.; Dagli, M. L.; Date, M.; Dekant, W.; Deodhar, C.; Fryer, A. D.; Jones, L.; Joshi, K.; Kumar, M.; Lapczynski, A.; Lavelle, M.; Lee, I.; Liebler, D. C.; Moustakas, H.; Na, M.; Penning, T. M.; Ritacco, G.; Romine, J.; Sadekar, N.; Schultz, T. W.; Selechnik, D.; Siddiqi, F.; Sipes, I. G.; Sullivan, G.; Thakkar, Y.; Tokura, Y. RIFM Fragrance Ingredient Safety Assessment, Cedrol, CAS Registry Number 77-53-2. Food Chem. Toxicol. 2022, 163 Suppl 1, 112998. [Google Scholar] [CrossRef] [PubMed]
- Api, A. M.; Bartlett, A.; Belsito, D.; Botelho, D.; Bruze, M.; Bryant-Freidrich, A.; Burton, G. A.; Cancellieri, M. A.; Chon, H.; Dagli, M. L.; Dekant, W.; Deodhar, C.; Farrell, K.; Fryer, A. D.; Jones, L.; Joshi, K.; Lapczynski, A.; Lavelle, M.; Lee, I.; Moustakas, H.; Muldoon, J.; Penning, T. M.; Ritacco, G.; Sadekar, N.; Schember, I.; Schultz, T. W.; Siddiqi, F.; Sipes, I. G.; Sullivan, G.; Thakkar, Y.; Tokura, Y. RIFM Fragrance Ingredient Safety Assessment, Cis-3-Hexenyl Benzoate, CAS Registry Number 25152-85-6. Food Chem. Toxicol. 2024, 194 Suppl 1, 115034. [Google Scholar] [CrossRef] [PubMed]
- Api, A. M.; Belmonte, F.; Belsito, D.; Biserta, S.; Botelho, D.; Bruze, M.; Burton, G. A.; Buschmann, J.; Cancellieri, M. A.; Dagli, M. L.; Date, M.; Dekant, W.; Deodhar, C.; Fryer, A. D.; Gadhia, S.; Jones, L.; Joshi, K.; Lapczynski, A.; Lavelle, M.; Liebler, D. C.; Na, M.; O’Brien, D.; Patel, A.; Penning, T. M.; Ritacco, G.; Rodriguez-Ropero, F.; Romine, J.; Sadekar, N.; Salvito, D.; Schultz, T. W.; Sipes, I. G.; Sullivan, G.; Thakkar, Y.; Tokura, Y.; Tsang, S. RIFM Fragrance Ingredient Safety Assessment, Benzyl Benzoate, CAS Registry Number 120-51-4. Food Chem. Toxicol. 2020, 144 Suppl 1, 111500. [Google Scholar] [CrossRef] [PubMed]
- Tisserand, R.; Young, R. Essential Oil Safety: A Guide for Healthcare Professionals, 2nd ed.; Elsevier: Edinburgh, Scotland, 2014; pp. 292–294. [Google Scholar] [CrossRef]
- Barra, A. Factors Affecting Chemical Variability of Essential Oils: A Review of Recent Developments. Nat. Prod. Commun. 2009, 4(8), 1147–1154. [Google Scholar] [CrossRef]
- Heinrich, M.; Jalil, B.; Abdel-Tawab, M.; Echeverria, J.; Kulić, Ž.; McGaw, L. J.; Pezzuto, J. M.; Potterat, O.; Wang, J.-B. Best Practice in the Chemical Characterisation of Extracts Used in Pharmacological and Toxicological Research-The ConPhyMP-Guidelines. Front. Pharmacol. 2022, 13, 953205. [Google Scholar] [CrossRef] [PubMed]
- Heinrich, M.; Appendino, G.; Efferth, T.; Fürst, R.; Izzo, A. A.; Kayser, O.; Pezzuto, J. M.; Viljoen, A. Best Practice in Research - Overcoming Common Challenges in Phytopharmacological Research. J. Ethnopharmacol. 2020, 246, 112230. [Google Scholar] [CrossRef] [PubMed]
- Kim, S.; Chen, J.; Cheng, T.; Gindulyte, A.; He, J.; He, S.; Li, Q.; Shoemaker, B. A.; Thiessen, P. A.; Yu, B.; Zaslavsky, L.; Zhang, J.; Bolton, E. E. PubChem 2025 Update. Nucleic Acids Res. 2025, 53(D1), D1516–D1525. [Google Scholar] [CrossRef] [PubMed]
| Material Name | CAS | Botanical Name | Plant Part | Country of Origin | Extraction Method |
|---|---|---|---|---|---|
| Cedarwood Oil | 8000-27-9 | Juniperus virginiana | Wood | United States | Steam Distillation |
| Cinnamon Bark Oil | 8007-80-5 | Cinnamomum zeylanicum | Bark | Sri Lanka | Steam Distillation |
| Clove Bud Oil | 8000-34-8 | Eugenia caryophyllata | Bud | Indonesia | Steam Distillation |
| Geranium Oil | 8000-46-2 | Pelargonium graveolens | Aerial Parts | Egypt | Steam Distillation |
| Lavender Oil | 90063-37-9 | Lavandula angustifolia | Aerial Parts | Bulgaria | Steam Distillation |
| Lemongrass Oil | 8007-02-1 | Cymbopogon citratus | Aerial Parts | India | Steam Distillation |
| Spearmint Oil | 8008-79-5 | Mentha spicata | Leaf, Stem | India | Steam Distillation |
| Tea Tree Oil | 68647-73-4 | Melaleuca alternifolia | Aerial Parts | Kenya | Steam Distillation |
| Material Name | Exposure Limiting Constituent | Constituent Concentration (%) |
Constituent WOE NESIL (µg/cm2) |
nPACds | NESILCP (µg/cm2) |
|---|---|---|---|---|---|
| Cedarwood Oil | cedrene | 37.6% | 3500 [39] | 50% | 9300 |
| Cinnamon Bark Oil | trans-cinnamaldehyde | 64.2% | 590 [40] | 82% | 900 |
| Clove Bud Oil | eugenol | 73.0% | 5900 [41] | 73% | 8100 |
| Geranium Oil | citronellyl formate | 10.0% | 6400 [42] | 77% | 64,000 |
| Lavender Oil | linalyl acetate | 28.3% | 10,000 [43] | 73% | 35,300 |
| Lemongrass Oil | citral | 72.6% | 1400 [44] | 92% | 1900 |
| Spearmint Oil | carvone | 59.4% | 2600 [45] | 90% | 4400 |
| Tea Tree Oil | alpha-terpinene | 10.7% | 2200 [46] | 26% | 20,600 |
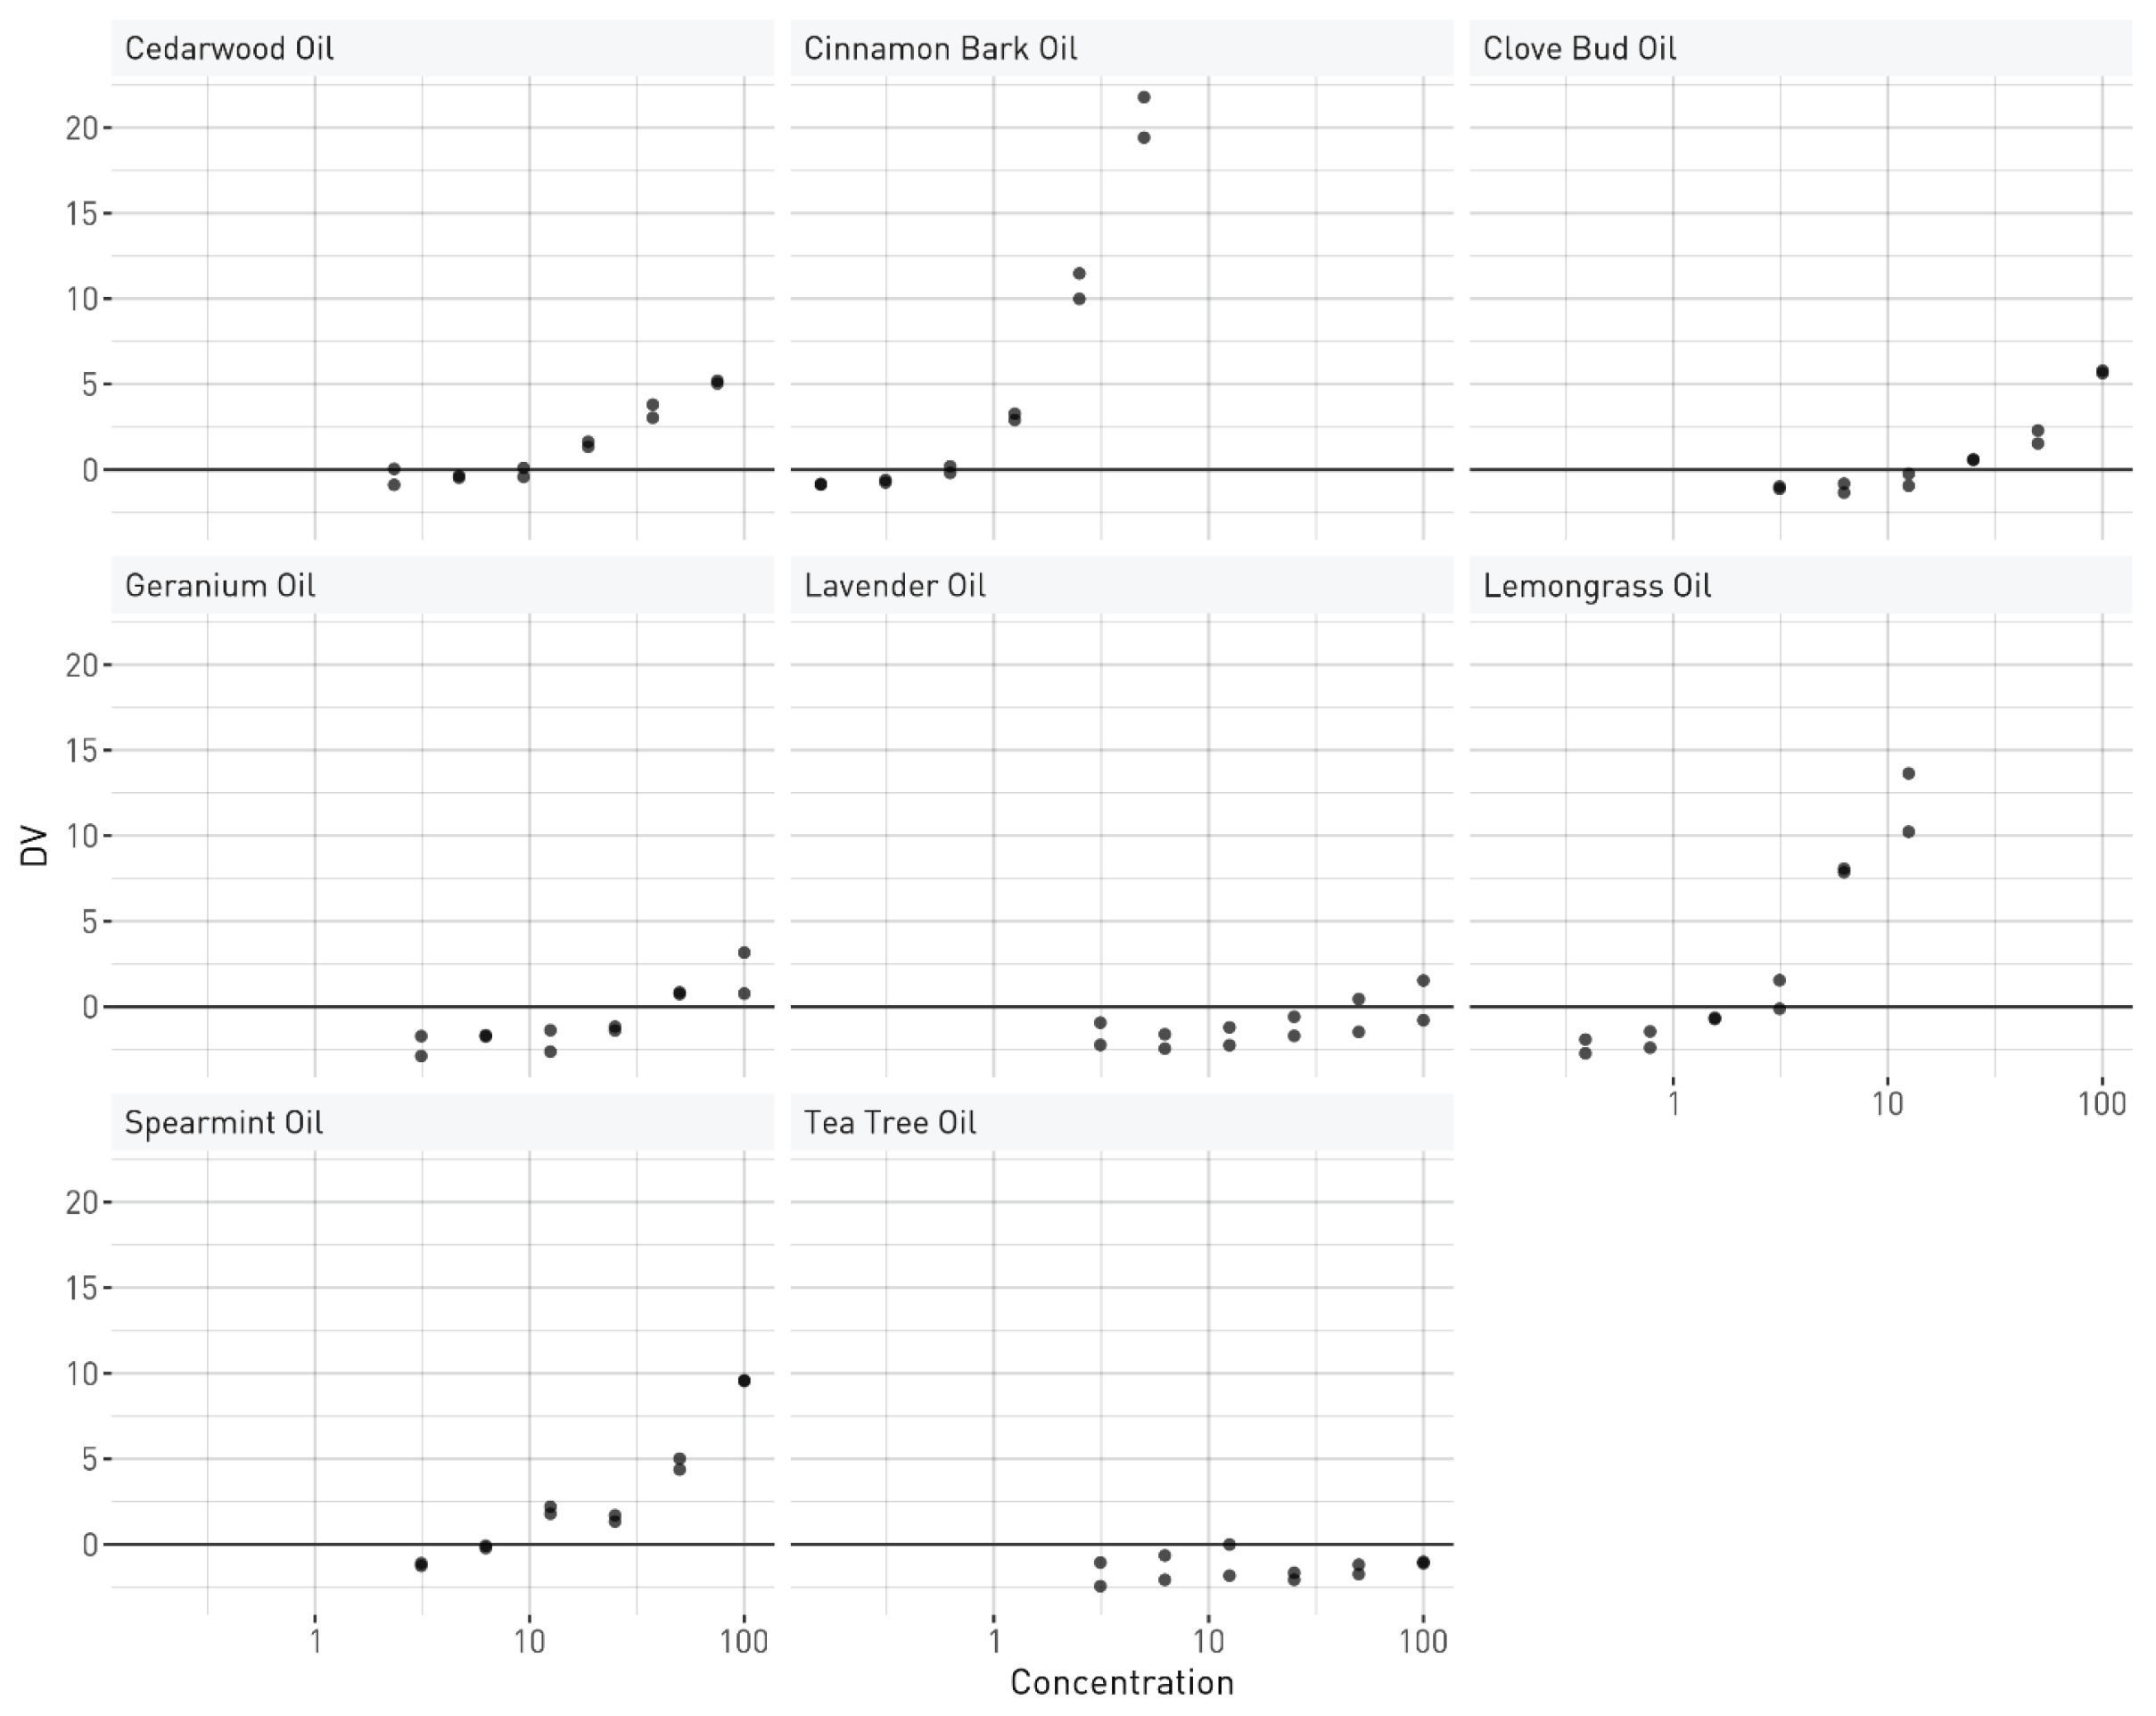
| Material Name | cDV0 (µg/mL) | NESILGARD (95% CI) (µg/cm2) | Stimulation Concentration (µg/mL) |
Vehicle | Determined In-Well Solubility (µg/mL) |
|---|---|---|---|---|---|
| Cedarwood Oil | 10.3 | 3120 (2125, 4580) | 2.3–75 | DMSO | 100 |
| Cinnamon Bark Oil | 0.622 | 189 (129, 277) | 0.2–5.0 | DMSO | 100 |
| Clove Bud Oil | 18.8 | 5690 (3880, 8360) | 3.1–100 | DMSO | 100 |
| Geranium Oil | 40.3 | 12,240 (8337, 17,971) | 3.1–100 | DMSO | 100 |
| Lavender Oil | 78.4 | 23,800 (16,200, 34,900) | 3.1–100 | DMSO | 100 |
| Lemongrass Oil | 2.32 | 703 (479, 1032) | 0.4–12.5 | DMSO | 100 |
| Spearmint Oil | 6.66 | 2020 (1376, 2966) | 3.1–100 | DMSO | 100 |
| Tea Tree Oil | NS | NS | 3.1–100 | DMSO | 100 |
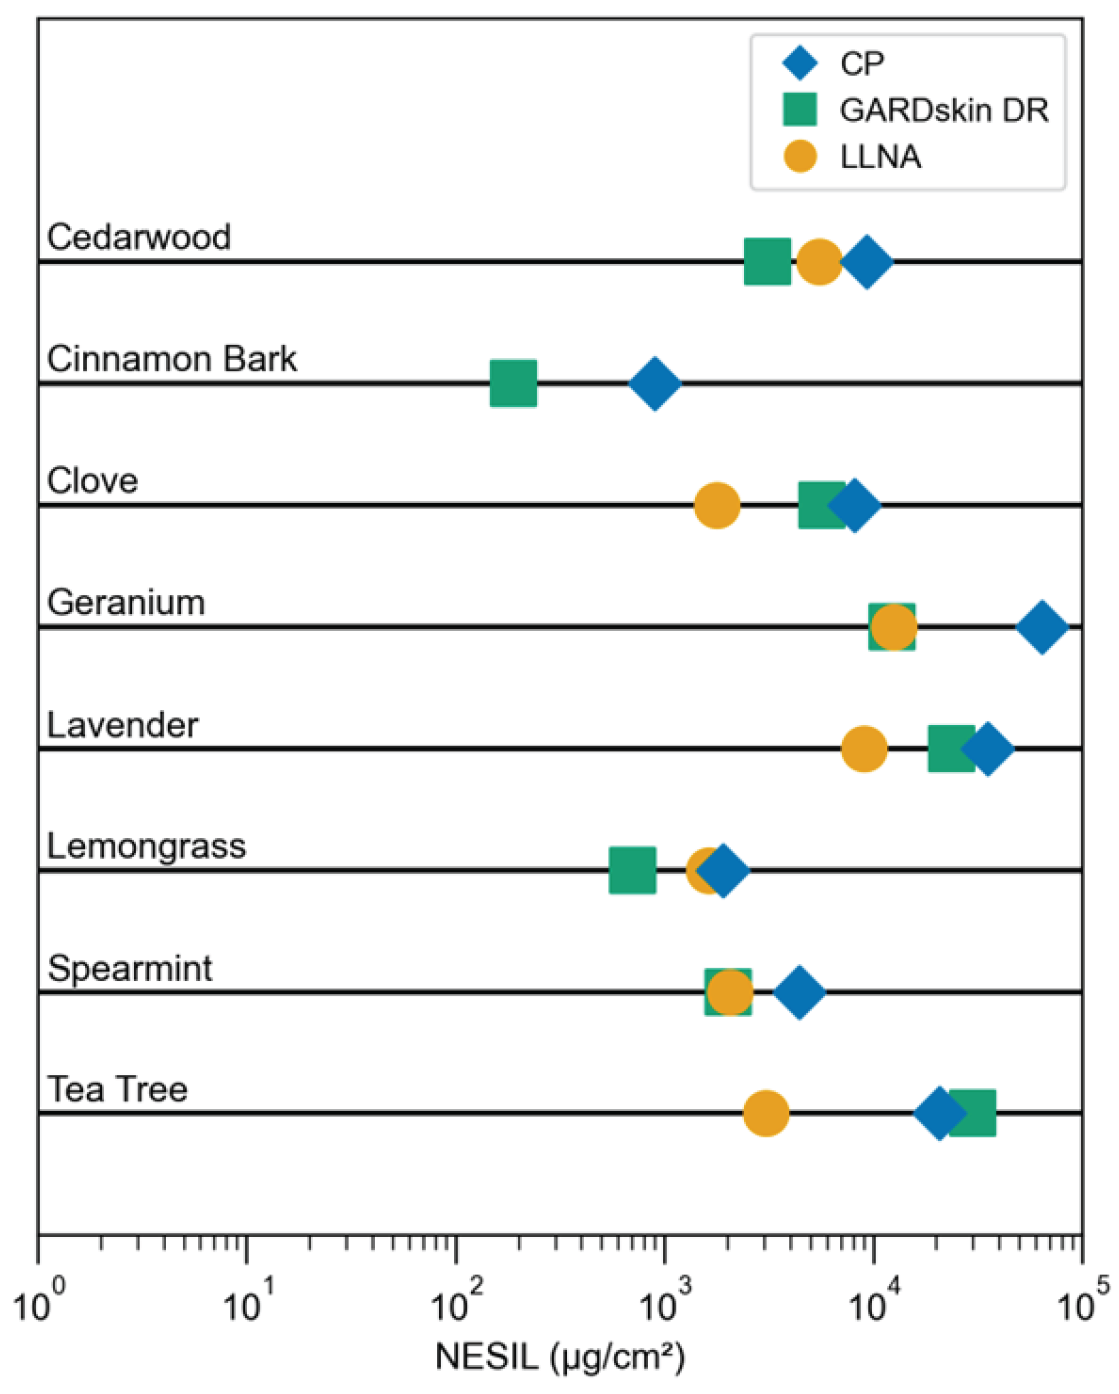
| Material Name | NESILCP (µg/cm2) | NESILGARD (µg/cm2) | NESILLLNA (µg/cm2) |
|---|---|---|---|
| Cedarwood Oil | 9300 | 3120 | 5500 |
| Cinnamon Bark Oil | 900 | 189 | n/a |
| Clove Bud Oil | 8100 | 5690 | 1775 |
| Geranium Oil | 64,000 | 12,240 | >12,500 |
| Lavender Oil | 35,300 | 23,800 | 9000 |
| Lemongrass Oil | 1900 | 703 | 1625 |
| Spearmint Oil | 4400 | 2020 | 2050 |
| Tea Tree Oil | 20,600 | >30,000 | 3066 |
Disclaimer/Publisher’s Note: The statements, opinions and data contained in all publications are solely those of the individual author(s) and contributor(s) and not of MDPI and/or the editor(s). MDPI and/or the editor(s) disclaim responsibility for any injury to people or property resulting from any ideas, methods, instructions or products referred to in the content. |
© 2026 by the authors. Licensee MDPI, Basel, Switzerland. This article is an open access article distributed under the terms and conditions of the Creative Commons Attribution (CC BY) license (http://creativecommons.org/licenses/by/4.0/).


