

Submitted:
03 July 2026
Posted:
06 July 2026
You are already at the latest version
Abstract
Muscle strength and bilateral asymmetry of the lower limbs are central determinants of injury risk and performance in football, yet their age-related development in adolescent players outside elite Western European cohorts remains insufficiently described. This study determined age-related differences in lower-limb muscle strength and muscular balance in Bulgarian male football players. A total of 122 players aged 13 to over 19 years from three clubs were assessed at the end of the competitive season. Maximal concentric knee extension and flexion strength of both legs were measured at 60°/s using a system with electronically controlled resistance (Kineo). Relative strength, bilateral asymmetry, hamstring-to-quadriceps (H/Q) ratios and a knee muscle balance index were calculated. Age differences were analysed using one-way ANOVA with Tukey post-hoc tests (extension) and the Kruskal–Wallis test with DSCF comparisons (flexion). Strength increased by 132–149% in extension and 186–191% in flexion, with the largest gains at 13–14 years and a second peak around 16 years; the effect of age was large (η²p = 0.59–0.61; ε² = 0.58). The balance index ranged from 0.48 to 0.62. These findings have direct implications for individualised strength and injury-prevention programming in youth football.
Keywords:
strength training
; development
; injury prevention
; isokinetic testing
; youth football
; bilateral asymmetry
1. Introduction
The structure of movements and the nature of football place the players’ locomotor system under enormous strain, and the majority of injuries occur in the lower extremities [1,2,3,4,5,6]. Beyond the purely conditioning dimension, injuries also have sports-technical and financial aspects, expressed in reduced sports form, game rhythm and player value [7,8,9]. The problem of injuries in football is comprehensive and widely studied because of its significant impact on the training process of both young and professional players [7,8,9]. Several approaches to the prevention of sports injuries have emerged and been thoroughly studied [1,6,8,10,11]. Injuries are defined as a complex phenomenon in which muscle strength and imbalance, sports experience, and previous trauma or overload stand out as factors [1,2,5,6,12].
The emphasis of the present study is on the lower-limb muscles and their main characteristics. We hypothesised that lower-limb muscle strength would increase non-linearly across age groups, with the most pronounced gains occurring during peak adolescence, while the H/Q ratio and bilateral asymmetry would exhibit age-specific fluctuations before stabilising in adulthood. The study aimed to determine age-related differences in lower-limb muscle strength, and specifically (i) to determine the strength indicators of the lower extremities and (ii) to study the bilateral muscular asymmetry of the lower extremities.
2. Materials and Methods
2.1. Participants
The study sample comprised 122 male football players aged 13 to over 19 years with complete strength measurements; a further five players from the original cohort were excluded because no strength data were recorded. A detailed breakdown of participant characteristics is presented in Table 1. The study was conducted at the end of the competitive period over 10 days, between 14:00 and 18:00. All participants were injury-free and had not sustained an injury in the two months before testing. Age and dominant leg were registered prior to testing. The study was conducted in accordance with the Declaration of Helsinki and approved by the University Human Research Ethics Committee of the National Sports Academy “Vassil Levski”, Sofia (No. 1456/06.04.26). Written informed consent was obtained from all adult participants and from a parent or legal guardian for participants under 18 years of age.
2.2. Anthropometry
Body weight was recorded using an InBody 230 analyser (InBody Co., Ltd., Seoul, South Korea) and stature using a Seca 213 stadiometer (SECA GmbH & Co. KG, Hamburg, Germany). Body weight was measured in the morning, wearing football shorts and no shoes, in kilograms. Stature was measured barefoot with an accuracy of 0.1 cm.
2.3. Strength Assessment
Muscle strength was assessed using a training system with electronically controlled resistance (Kineo Intelligent Load System, Technogym S.p.A., Cesena, Italy) at an angular velocity of 60°/s. Before the test, participants were informed verbally and visually about the procedure and asked to apply maximal force. The Kineo system operates in an electronically controlled isokinetic mode in which cable velocity is held constant by a servo-controlled motor while resistance is continuously adjusted to the force applied by the participant. Devices of this type, in which a load cell is integrated into a motor-driven resistance unit, have demonstrated excellent test–retest reliability and high concurrent validity against criterion isokinetic dynamometry for lower-limb strength assessment, supporting their use for the evaluation of maximal knee extensor and flexor strength [13,14]. All measurements were performed in the concentric isokinetic mode.
Strength was measured for the quadriceps and hamstring musculature of both legs. Bilateral leg asymmetry and hamstring-to-quadriceps (H/Q) ratios for both legs were additionally calculated. Relative strength was calculated as maximal isokinetic strength divided by body weight. Each athlete performed three repetitions per leg, with 30 s of rest between legs. All athletes first performed leg extension, then rested for 5 min before leg curl. The highest values at this angular velocity were retained, and H/Q ratios were computed from them.
2.4. Procedures
Prior to testing, all players performed a standardised warm-up: 4 min of cycle-ergometer pedalling (90 rpm), 4 min of general exercise and stretching, and 10 squats and 10 lunges. Leg-extension exercises were performed seated in a fixed position, with the athlete belted to the seat to minimise hip movement; the leg pads were positioned at the ankle joint. The leg curl was executed from a standing position, with the pelvis on an adjusted cushioned plate and the leg pad on the distal third of the calf, the athlete pushing using only the hamstrings without moving the pelvis.
2.5. Statistical Analysis
Analyses were performed using SPSS (v27.0; IBM Corp., Armonk, NY, USA) and jamovi (v2.6). Normality was assessed with the Shapiro–Wilk test and homogeneity of variances with the Levene test. One-way ANOVA (with Welch’s ANOVA where variances were unequal) and Tukey post-hoc tests were used for normally distributed extension variables; the Kruskal–Wallis test with Dwass–Steel–Critchlow–Fligner (DSCF) post-hoc comparisons was used for non-normally distributed flexion variables. Effect sizes were reported as partial eta-squared (η²p) for ANOVA and epsilon-squared (ε²) for the Kruskal–Wallis test. Significance was set at p < 0.05.
3. Results
Maximal muscle strength of both legs is presented in Figure 1. In knee extension, the dominant leg was stronger than the non-dominant leg only in players up to 13 years and up to 19 years; in all other groups, including players over 19 years, the non-dominant leg was stronger. The increase in dominant-leg extension strength was 132% over the studied range and 149% for the non-dominant leg (Table 2). The bilateral difference in extension strength varied between 4.3% and 11.7% across ages.
In knee flexion, absolute values ranged from 12.0 to 35.4 kg for the dominant leg and from 12.0 to 34.9 kg for the non-dominant leg. The increase in dominant-leg flexion strength was 23.0 kg (186%) and 22.9 kg (191%) for the non-dominant leg. The bilateral difference in flexion strength varied between 5.4% and 10.4% across ages (Table 3).
The knee muscle balance index (Figure 2) ranged from 0.48 to 0.62 across ages, with the most pronounced imbalance (lowest ratio) at 15 years of age.
The effect of age on extension strength was large (dominant leg: F = 26.0, p < 0.001, η²p = 0.61; non-dominant leg: F = 23.8, p < 0.001, η²p = 0.59). Tukey post-hoc analysis showed that 13-year-olds had significantly lower dominant-leg extension strength at 60°/s than all older groups (14–>19 years; p < 0.05), and the 14-year group differed significantly from the 16–>19 year groups (p < 0.05); no significant differences were found among the 15–>19 year groups except 15-vs-16 years (p > 0.05 for all other pairs), broadly consistent with previous reports [15]. For flexion, the effect of age was also large (dominant leg: H = 73.3, p < 0.001, ε² = 0.58; non-dominant leg: H = 73.7, p < 0.001, ε² = 0.59); 13-year-olds had significantly lower peak flexion strength for both legs than all older groups (p < 0.05), with no significant differences among the 15–>19 year groups (p > 0.05).
4. Discussion
Several factors influence age-related differences in isokinetic strength, including muscle quality, muscle group and movement speed [16,17]. Muscle strength generally declines with age in older adults [18,19,20,21]; the present study focuses on the opposite, developmental end of the lifespan. From the age of 13 onward, the increase in peak force during knee flexion (about 186–191%) substantially exceeded that during extension (about 132–149%), indicating a more intensive development of the posterior muscle group during sports specialisation. This may be considered a favourable adaptation for muscle balance and injury prevention, contrary to the common training emphasis on the anterior thigh. The largest increase occurred at 13–14 years, possibly connected with the onset of puberty (85–96% for extension; 127–129% for flexion), with a second smaller peak around 16 years. In the transition to the senior game, dominant-leg extension strength did not continue to rise and even declined slightly (about −8% from 19 to over-19 years), whereas flexion strength continued to increase modestly.
Muscle strength increases with age in children and adolescents, with significant gains up to about 15 years, after which the rate slows [28]. Our findings confirm this, showing a gradual increase up to 14–15 years followed by statistical stabilisation. The largest between-group differences were observed between the youngest and the older groups [29], and analysis of variance indicated that strength at 13 years differed significantly from all other groups. The overall pattern suggests early-age differences followed by stabilisation in later adolescence [30].
In most age groups, the non-dominant leg produced greater or equal isokinetic extension force, which we attribute to the stabilising role of the supporting leg during sport-specific movements; this pattern held even in the over-19 group and is supported by other studies [15,30]. Bilateral asymmetry usually ranges from 7% to 9% [31,32], and higher values within the 10–15% range are considered a prerequisite for injury [27,31]. In our data, bilateral asymmetry approached or exceeded 10–11% mainly in the youngest (13 years; extension 11.7%) and oldest (over 19 years; extension 10.6%) groups, together with the 14-year flexion value (10.4%), indicating a lack of specific adaptation in the youngest players and a re-emergence of asymmetry in the senior group. Greater asymmetry is reported in athletes with shorter experience [30].
The frequent use of the preferred leg can lead to bilateral asymmetry, as the quadriceps are used mainly in concentric movements while the biceps femoris stabilises, decelerates and controls the knee [35,36]. During running, starting, kicking and stopping, both muscle groups play key roles [35,37,38,39]. Other authors report greater asymmetry during eccentric than concentric contractions [31]; such a comparison cannot be made here, as only concentric strength was measured. The H/Q ratio is one of the most widely used indicators of injury risk and is affected more by angular velocity than by age, sex or limb dominance [40]. Our ratios of about 0.5–0.6 indicate that the quadriceps can generate roughly twice the force of the hamstrings. Across age, the balance index was lowest around 15 years (0.48) and recovered to its highest values in the senior group (0.62). A plausible explanation for the mid-adolescent dip is that, during the years of fastest quadriceps development, extensor strength rises faster than flexor strength, transiently depressing the ratio; the subsequent recovery is consistent with the disproportionately large flexor development observed here. Conversely, where the ratio falls in individual players entering the men’s game, the explosive demands placed on the quadriceps (repeated sprinting and powerful kicking) can drive extensor hypertrophy and a corresponding contraction of the H/Q ratio. Combined with bilateral asymmetry, low ratios place players in a higher-risk group for injury [35].
The hamstrings play a crucial role during running and stability tasks [35,41], and hamstring training should include both hip- and knee-dominant exercises for elite football [42,43], based on the eccentric function of the hamstrings during the late swing phase of running [38]. A combined programme targeting all hamstring heads is more effective at preventing injuries. These findings are useful for sports specialists and strength and conditioning coaches when planning strength work in youth football.
4.1. Limitations and Future Research
Participants were drawn from only three Bulgarian clubs, and the sample (122 players with complete data, unevenly distributed across age groups, with only five players in the 19-year group) was modest; the small size of some groups limits the precision of comparisons at the upper age range, and the cross-sectional design precludes inferences about individual trajectories. Only concentric strength was measured. The Kineo system also permits eccentric and concentric/eccentric assessment, and eccentric hamstring strength in particular is a central determinant of hamstring-injury risk; assessment of eccentric strength and of functional H/Q ratios therefore represents the logical next step for future research using the same system.
5. Conclusions
The most marked increases in lower-limb strength occur at 13–14 years and around 16 years, with stabilisation after 14–15 years of age. The Bulgarian football population studied here demonstrates a level of bilateral asymmetry typical of the sport, approaching or exceeding the 10–11% range mainly in the youngest and oldest groups. The disproportionately large development of the posterior thigh musculature, and the recovery of the H/Q balance index in older players, support an emphasis on extensive hamstring development, ideally complemented by eccentric assessment and training in future work.
Supplementary Materials
The following supporting information can be downloaded at the website of this paper posted on Preprints.org: S1 Dataset (raw individual data for 122 players).
Author Contributions
Conceptualization, P.P.; methodology, P.P. and D.I.; formal analysis, D.I.; investigation, P.P. and G.G.; data curation, D.I.; writing—original draft preparation, P.P.; writing—review and editing, D.I. and G.G.; project administration, D.I. All authors have read and agreed to the published version of the manuscript.
Funding
This research received no external funding.
Institutional Review Board Statement
The study was conducted in accordance with the Declaration of Helsinki and approved by the University Human Research Ethics Committee of the National Sports Academy “Vassil Levski”, Sofia (No. 1456/06.04.26).
Informed Consent Statement
Written informed consent was obtained from all adult participants and from a parent or legal guardian for all participants under 18 years of age.
Data Availability Statement
The data presented in this study are available in the Supplementary Materials (S1 Dataset).
Conflicts of Interest
The authors declare no conflicts of interest.
References
- Arnason, A.; Sigurdsson, S.B.; Gudmundsson, A.; Holme, I.; Engebretsen, L.; Bahr, R. Risk factors for injuries in football. Am. J. Sports Med. 2004, 32 (1 Suppl.), 5S–16S. [Google Scholar] [CrossRef]
- Hägglund, M.; Waldén, M.; Ekstrand, J. Risk factors for lower extremity muscle injury in professional soccer: the UEFA Injury Study. Am. J. Sports Med. 2013, 41, 327–335. [Google Scholar] [PubMed]
- López-Valenciano, A.; Ruiz-Pérez, I.; Garcia-Gómez, A.; Vera-Garcia, F.J.; De Ste Croix, M.; Myer, G.D.; Ayala, F. Epidemiology of injuries in professional football: a systematic review and meta-analysis. Br. J. Sports Med. 2020, 54, 711–718. [Google Scholar] [PubMed]
- Drummond, F.A.; Soares, D.d.S.; Silva, H.d.; Entrudo, D.; Younes, S.D.; Neves, V.d.S.; et al. Incidence of injuries in soccer players – mapping foot: a prospective cohort study. Rev. Bras. Med. Esporte 2021, 27, 189–194. [Google Scholar]
- Ekstrand, J.; Ueblacker, P.; Van Zoest, W.; Verheijen, R.; Vanhecke, B.; Van Wijk, M.; Bengtsson, H. Risk factors for hamstring muscle injury in male elite football: medical expert experience and conclusions from 15 European Champions League clubs. BMJ Open Sport Exerc. Med. 2023, 9, e001597. [Google Scholar] [CrossRef]
- Zeng, Y.; Ji, W.; Shi, Y.; Liu, W.; Ji, W. Sports injuries in elite football players: classification, prevention, and treatment strategies update. Front. Sports Act. Living 2025, 7, 1643789. [Google Scholar] [CrossRef] [PubMed]
- Vasileiadis, I. Injury prevention strategies in football: a systematic review. Sport Mont. 2020, 18, 109–113. [Google Scholar] [CrossRef]
- da Fonseca, G.I. Comprehensive injury prevention strategies for football players. Int. Seven J. Multidiscip. 2022, 1, 1–13. [Google Scholar] [CrossRef]
- Serner, A.; Chamari, K.; Hassanmirzaei, B.; Moreira, F.; Bahr, R.; Massey, A.; et al. Time-loss injuries and illnesses at the FIFA World Cup Qatar 2022. Sci. Med. Footb. 2025, 9, 275–282. [Google Scholar] [PubMed]
- Ekstrand, J.; Hägglund, M.; Waldén, M. Epidemiology of muscle injuries in professional football (soccer). Am. J. Sports Med. 2011, 39, 1226–1232. [Google Scholar] [CrossRef] [PubMed]
- Eustace, S.J.; Page, R.M.; Greig, M. Contemporary approaches to isokinetic strength assessments in professional football players. Sci. Med. Footb. 2017, 1, 251–257. [Google Scholar] [CrossRef]
- Namazi, P.; Zarei, M.; Hovanloo, F.; Abbasi, H. The association between isokinetic muscle strength and lower extremity injuries in young male football players. Phys. Ther. Sport 2019, 39, 76–81. [Google Scholar] [CrossRef] [PubMed]
- Sahu, P.K.; Goodstadt, N.; Ramakrishnan, A.; Silfies, S.P. Test-retest reliability and concurrent validity of knee extensor strength measured by a novel device incorporated into a weight stack machine vs. handheld and isokinetic dynamometry. PLoS ONE 2024, 19, e0301872. [Google Scholar] [CrossRef] [PubMed]
- Andrade, A.C.; Caserotti, P.; de Carvalho, C.M.; Abade, E.A.; Sampaio, J.E. Reliability of concentric, eccentric and isometric knee extension and flexion when using the REV9000 isokinetic dynamometer. J. Hum. Kinet. 2013, 37, 47–53. [Google Scholar] [CrossRef]
- Maly, T.; Ford, K.R.; Sugimoto, D.; Izovska, J.; Bujnovsky, D.; Hank, M.; et al. Isokinetic strength, bilateral and unilateral strength differences: variation by age and laterality in elite youth football players. Int. J. Morphol. 2021, 39, 296–303. [Google Scholar] [CrossRef]
- Ardern, C.L.; Pizzari, T.; Wollin, M.R.; Webster, K.E. Hamstrings strength imbalance in professional football (soccer) players in Australia. J. Strength Cond. Res. 2015, 29, 997–1002. [Google Scholar] [CrossRef] [PubMed]
- Ferreira, J.C.; Araujo, S.R.S.; Pimenta, E.M.; Menzel, H.J.K.; Medeiros, F.B.; Andrade, A.G.P.; et al. Impact of competitive level and age on the strength and asymmetry of young soccer players. Rev. Bras. Med. Esporte 2018, 24, 357–360. [Google Scholar] [CrossRef]
- Denis, R.; Korff, T. Joint-dependence of isometric and isokinetic strength in children and adults. Isokinet. Exerc. Sci. 2009, 17, 181–188. [Google Scholar] [CrossRef]
- Gerstner, G.R.; Giuliani, H.K.; Mota, J.A.; Ryan, E.D. Age-related reductions in muscle quality influence the relative differences in strength and power. Exp. Gerontol. 2017, 99, 27–34. [Google Scholar] [CrossRef] [PubMed]
- Haynes, E.M.; Neubauer, N.A.; Cornett, K.M.; O’Connor, B.P.; Jones, G.R.; Jakobi, J.M. Age- and sex-related decline of muscle strength across the adult lifespan: a scoping review of aggregated data. Appl. Physiol. Nutr. Metab. 2020, 45, 1185–1196. [Google Scholar] [CrossRef] [PubMed]
- Genç, H.; Demircioğlu, G. Age-related differences in low back pain and lower extremity isokinetic muscle strength and balance. J. Back. Musculoskelet. Rehabil. 2025. [Google Scholar] [PubMed]
- Teixeira, J.; Carvalho, P.; Moreira, C.; Santos, R. Isokinetic assessment of muscle imbalances and bilateral differences between knee extensor and flexor strength in basketball, football, handball and volleyball athletes. Rev. Port. Cien. Desp. 2014, 14, 9–20. [Google Scholar]
- Iga, J.; George, K.; Lees, A.; Reilly, T. Cross-sectional investigation of indices of isokinetic leg strength in youth soccer players and untrained individuals. Scand. J. Med. Sci. Sports 2009, 19, 714–719. [Google Scholar] [PubMed]
- Gkrilias, P.; Zavvos, A.; Fousekis, K.; Billis, E.; Matzaroglou, C.; Tsepis, E. Dynamic balance asymmetries in pre-season injury-prevention screening in healthy young soccer players using the Modified Star Excursion Balance Test—a pilot study. J. Phys. Ther. Sci. 2018, 30, 1141–1144. [Google Scholar] [PubMed]
- Franca, C.; Martins, F.; Martinho, D.V.; Ihle, A.; Marques, A.; Sarmento, H.; et al. Bilateral asymmetry and the relationship between unilateral isokinetic strength and balance performance in male adolescent football players. Monten. J. Sports Sci. Med. 2023, 19, 47–54. [Google Scholar]
- Lehance, C.; Binet, J.; Bury, T.; Croisier, J.L. Muscular strength, functional performances and injury risk in professional and junior elite soccer players. Scand. J. Med. Sci. Sports 2009, 19, 243–251. [Google Scholar] [CrossRef] [PubMed]
- Pavlova, I.; Roztorhui, M.; Petrytsa, P.; Melnyk, T.; Nalyvayko, N.; Ohnystyi, A. Well-being and life satisfaction of strength athletes during war: role of individual and health-related determinants. Monten. J. Sports Sci. Med. 2023, 12, 25–31. [Google Scholar] [CrossRef]
- Li, X.F.; Feng, G.Q.; Chen, Y.J.; Li, L. Isokinetic muscle strength test of flexion and extension muscles of the knee joint in naturally developing boys. J. Clin. Rehabil. Tissue Eng. Res. 2009, 13, 8709–8712. [Google Scholar]
- Bishop, C.; Coratella, G.; Beato, M. Intra- and inter-limb strength asymmetry in soccer: a comparison of professional and under-18 players. Sports 2021, 9, 129. [Google Scholar] [CrossRef] [PubMed]
- Fousekis, K.; Tsepis, E.; Vagenas, G. Multivariate isokinetic strength asymmetries of the knee and ankle in professional soccer players. J. Sports Med. Phys. Fit. 2010, 50, 465–474. [Google Scholar]
- Croisier, J.L.; Forthomme, B.; Namurois, M.H.; Vanderthommen, M.; Crielaard, J.M. Hamstring muscle strain recurrence and strength performance disorders. Am. J. Sports Med. 2002, 30, 199–203. [Google Scholar] [CrossRef] [PubMed]
- Menzel, H.J.; Chagas, M.H.; Szmuchrowski, L.A.; Araujo, S.R.; de Andrade, A.G.; de Jesus-Moraleida, F.R. Analysis of lower limb asymmetries by isokinetic and vertical jump tests in soccer players. J. Strength Cond. Res. 2013, 27, 1370–1377. [Google Scholar] [CrossRef] [PubMed]
- Knapik, J.J.; Bauman, C.L.; Jones, B.H.; Harris, J.M.; Vaughan, L. Preseason strength and flexibility imbalances associated with athletic injuries in female collegiate athletes. Am. J. Sports Med. 1991, 19, 76–81. [Google Scholar] [CrossRef] [PubMed]
- Ruas, C.V.; Brown, L.E.; Pinto, R.S. Lower-extremity side-to-side strength asymmetry of professional soccer players according to playing position. Kinesiology 2015, 47, 188–192. [Google Scholar]
- Yıldız, M.; Kale, M. The effects of kicking leg preference on the bilateral leg strength asymmetries of amateur football players. Isokinet. Exerc. Sci. 2018, 26, 37–42. [Google Scholar] [CrossRef]
- Peev, P.; Gadev, M. Correlation of ball speed and relative strength and explosive power of the lower limbs in the instep kick of low-qualified football players. Leka Atlet. Nauka 2019, 1, 66–71. [Google Scholar]
- Zakas, A.; Mandroukas, K.; Vamvakoudis, E.; Christoulas, K. Peak torque of quadriceps and hamstring muscles in basketball and soccer players of different divisions. J. Sports Med. Phys. Fit. 1995, 35, 199–205. [Google Scholar]
- Higashihara, A.; Nagano, Y.; Ono, T. Differences in activation properties of the hamstring muscles during overground sprinting. Gait Posture 2015, 42, 360–364. [Google Scholar] [CrossRef] [PubMed]
- Owen, A.; Wong, D.; Dellal, A.; Paul, D.; Orhant, E.; Collie, S. Effect of an injury-prevention programme on muscle injuries in elite professional soccer. J. Strength Cond. Res. 2013, 27, 3275–3285. [Google Scholar] [PubMed]
- Yilmaz, A.K.; Kabadayi, M.; Mayda, M.H.; Birinci, M.C. Examination of isokinetic strength rates of the knee joint (H/Q) in football players. J. Soc. Sci. Res. 2016, 10, 2248–2253. [Google Scholar] [CrossRef]
- Yu, B.; Queen, R.M.; Abbey, A.N.; Liu, Y.; Moorman, C.T.; Garrett, W.E. Hamstring muscle kinematics and activation during overground sprinting. J. Biomech. 2008, 41, 3121–3126. [Google Scholar] [CrossRef] [PubMed]
- Bahr, R.; Thorborg, K.; Ekstrand, J. Evidence-based hamstring injury prevention is not adopted by the majority of Champions League or Norwegian Premier League football teams: the Nordic Hamstring survey. Br. J. Sports Med. 2015, 49, 1466–1471. [Google Scholar] [CrossRef] [PubMed]
- Oakley, A.J.; Jennings, J.; Bishop, C.J. Holistic hamstring health: not just the Nordic hamstring exercise. Br. J. Sports Med. 2018, 52, 816–817. [Google Scholar] [PubMed]
Figure 1.
Maximal isokinetic strength (mean ± SD) of the dominant and non-dominant legs in (A) knee extension and (B) knee flexion across age groups.
Figure 1.
Maximal isokinetic strength (mean ± SD) of the dominant and non-dominant legs in (A) knee extension and (B) knee flexion across age groups.
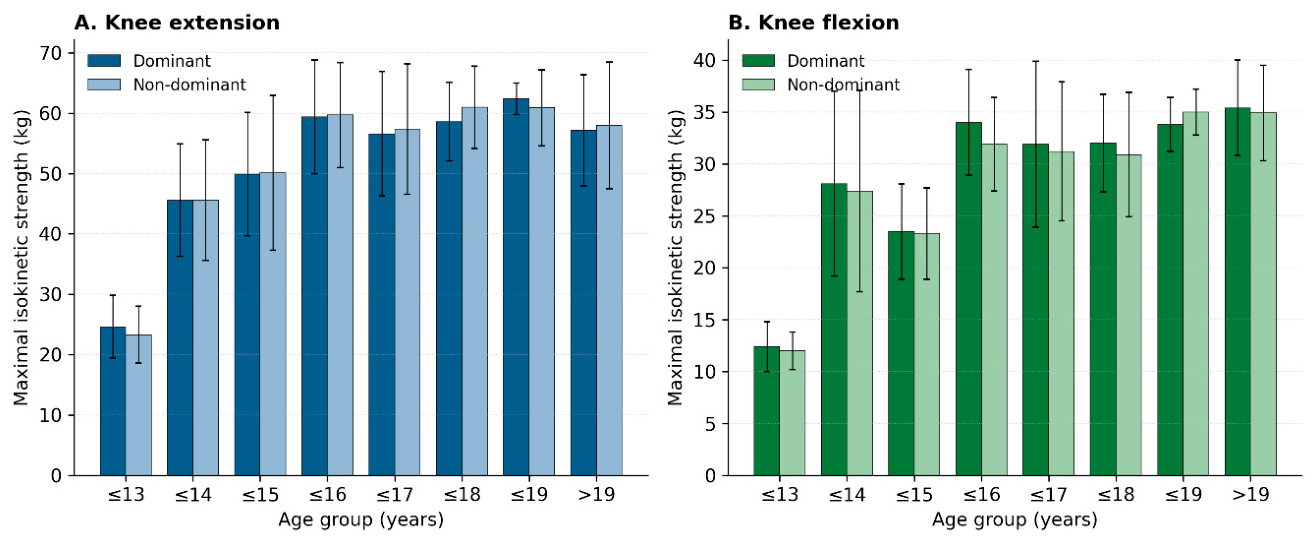
Figure 2.
Knee muscle balance index (hamstring-to-quadriceps ratio) across age groups.
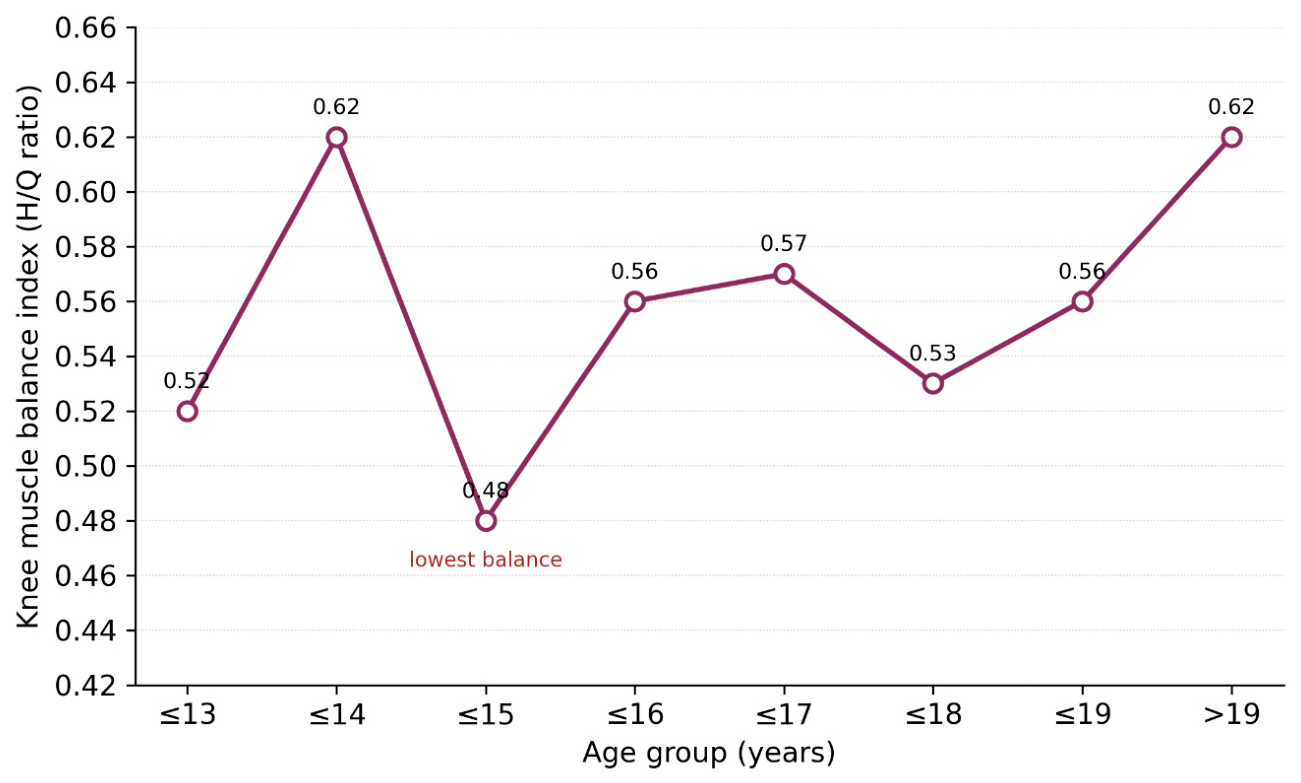

Table 1.
Sample size, height and body mass (mean ± SD) of the athletes by age group.
| Age Group | n | Height (cm) | Weight (kg) |
|---|---|---|---|
| Up to 13 years | 16 | 156 | 39.8 ± 4.3 |
| Up to 14 years | 19 | 162 | 60.4 ± 10.7 |
| Up to 15 years | 19 | 173 | 62.6 ± 11.1 |
| Up to 16 years | 17 | 176 | 66.6 ± 7.8 |
| Up to 17 years | 11 | 177 | 70.9 ± 6.9 |
| Up to 18 years | 10 | 179 | 71.9 ± 5.6 |
| Up to 19 years | 5 | 177 | 72.0 ± 2.1 |
| Over 19 years | 25 | 182 | 78.0 ± 7.4 |
Values are mean ± SD. Height is reported as the group mean (individual height values were not available for the standard deviation).
Table 2.
Relative change (%) of isokinetic strength between consecutive age groups.
| Variable | 13–14 | 14–15 | 15–16 | 16–17 | 17–18 | 18–19 | 19–>19 | Total |
|---|---|---|---|---|---|---|---|---|
| Dominant leg extension | 85.3 | 9.4 | 19.1 | -4.6 | 3.4 | 6.6 | -8.4 | 132.4 |
| Non-dominant leg extension | 95.6 | 9.8 | 19.2 | -3.9 | 6.3 | -0.1 | -4.7 | 148.7 |
| Dominant leg curl | 126.9 | -16.2 | 44.4 | -6.1 | 0.2 | 5.7 | 4.6 | 186.1 |
| Non-dominant leg curl | 128.8 | -15.0 | 37.0 | -2.5 | -1.0 | 13.3 | -0.3 | 190.6 |
Table 3.
Average percentage difference between the dominant and non-dominant leg in knee extension and flexion.
Table 3.
Average percentage difference between the dominant and non-dominant leg in knee extension and flexion.
| Peak-Force Delta (%) | ≤13 | ≤14 | ≤15 | ≤16 | ≤17 | ≤18 | ≤19 | >19 |
|---|---|---|---|---|---|---|---|---|
| Leg extension | 11.7 | 8.9 | 8.3 | 7.9 | 4.3 | 6.6 | 7.6 | 10.6 |
| Leg curl | 7.3 | 10.4 | 8.8 | 7.3 | 7.0 | 9.3 | 5.4 | 7.2 |
Disclaimer/Publisher’s Note: The statements, opinions and data contained in all publications are solely those of the individual author(s) and contributor(s) and not of MDPI and/or the editor(s). MDPI and/or the editor(s) disclaim responsibility for any injury to people or property resulting from any ideas, methods, instructions or products referred to in the content. |
© 2026 by the authors. Licensee MDPI, Basel, Switzerland. This article is an open access article distributed under the terms and conditions of the Creative Commons Attribution (CC BY) license (http://creativecommons.org/licenses/by/4.0/).
Copyright: This open access article is published under a Creative Commons CC BY 4.0 license, which permit the free download, distribution, and reuse, provided that the author and preprint are cited in any reuse.


