

Submitted:
02 July 2026
Posted:
06 July 2026
You are already at the latest version
Abstract
Cold ironing, also known as electrification of onshore power systems, is an important strategy for reducing emissions from vessels while berthed at port. However, effective planning of cold ironing infrastructure requires reliable estimation of the electrical power demand of different vessel categories, especially in ports where measured ship consumption data are limited or unavailable. This paper presents a data-driven approach to synthetic ship power demand modelling for cold ironing decision support, with a case study focused on Cyprus Port of Limassol. Using data collected from various sources, a Random Forest Regression model is developed which creates a relationship between vessel characteristics and power demand. This relationship is expressed as a power density coefficient and is employed to generate a synthetic power consumption profile of each ship visiting the port. The individual ship demand values are then aggregated to determine the total daily power consumption required for cold ironing operation at the port. The results provide insights into vessel-level and port-level electrical demand, supporting cold ironing feasibility studies, shore-side infrastructure sizing, port electrification planning, and energy management decisions.
Keywords:
cold-ironing
; ship load forecasting
; regression model
1. Introduction
Cold ironing has become a practical pathway for reducing emissions from ships during berthing by allowing vessels to connect to shore-side electricity instead of relying on auxiliary engines [1]. Adding to that, EU regulation requires ships at berth to connect to onshore power for their electrical needs instead of using their own engines, with the objective of reducing greenhouse gas emissions and noise pollution in ports [2]. It is therefore obvious that its successful implementation depends not only on the availability of shore power infrastructure, but also on the ability to estimate the electrical demand created by different vessel types, port calls, and berthing activities.
1.1. Existing Literature
Following an extensive review of the literature, several studies were identified that employ data-driven, bottom-up, and forecasting methodologies to estimate ship power requirements. These works demonstrate the relevance of vessel characteristics, operational profiles, and maritime data in supporting energy planning for port electrification [3] [4] [5].
In [6], Probabilistic bottom-up models have been used to create synthetic electrical load profiles for cruise ship cabins by combining passenger behaviour, key-card data, electrical consumer characteristics, route information, and climate effects on air-conditioning demand. The functionality of this model directly follows the definition of this research where power demand can be inferred from structured maritime datasets.
Similarly, other bottom-up approaches, such as the MariTEAM model [7], estimate ship resistance and power consumption using operational profiles, weather conditions, and fleet-level ship data, demonstrating the value of well-designed modelling for energy and emissions assessment. These studies show that synthetic or estimated load information can support decision-making where measured data are incomplete.
Data-driven techniques have also been applied in maritime energy studies to capture nonlinear relationships between ship operating conditions and power-related outputs. For example, authors in [8] employed machine learning models such as Deep Neural Networks to predict generator load in a shipboard microgrid, using fuel propulsion demand. Another study [9] implemented machine learning techniques to extract representative templates for ship-propulsion. This highlights that data-driven applications can prove to be a robust framework for load demand forecasting.
Accurate berthing duration is also important for improving cold ironing planning and management. Although this research does not directly address load forecasting [10], it remains beneficial for the needs of this study, as it demonstrates the use of forecasting techniques to provide valuable insights into ship berthing schedules, which are closely related to the operational requirements of shore-side electricity systems.
Similar to previous studies employing data-driven approaches to estimate vessel load demand where direct measurements are unavailable, this research utilises vessel characteristics and route information to predict power requirements. While existing approaches provide valuable insights into individual vessel energy demand, the proposed method extends this capability by estimating the accumulated power demand of vessels intending to berth at a port. This enables port operators to anticipate demand fluctuations, optimise shore power allocation, reduce peak grid stress, support renewable energy and storage integration, and inform strategic infrastructure planning.
2. Methodology
2.1. Problem Definition
This study develops a methodology that responds to the volatile nature of energy management in ports during cold ironing planning. Onshore power supply allows berthed ships to switch off their auxiliary engines and receive electricity from the port network; however, this transfers a highly variable electrical load from the vessel to the shore-side energy system. This variability is influenced by uncertain berthing duration, changes in arrival and departure schedules, loading and unloading activities, and congestion caused by overlapping ship calls. The challenge is further increased by the limited availability of measured ship-level consumption data, as ports often have access only to general vessel information, arrival records, schedules, and berth allocation data rather than detailed onboard power measurements. Therefore, forecasting ship power and energy demand provides a necessary decision-support tool for estimating the expected electrical load of individual vessels and the accumulated demand at port level, enabling more reliable cold ironing planning, improved energy management, and more efficient port operation.
2.2. Data Acquisition
The effectiveness of a data-driven forecasting approach is largely dependent on the availability of well-structured and representative datasets. Consequently, accurate acquisition of the input dataset will directly affect completeness of the study, hence, to ensure reliability, data collection was divided into two sections. The first section focused on gathering and organising relevant vessel information from available sources, including insights provided by ship operators and data obtained from subscription-based maritime platforms [11] [12]. This stage was essential for identifying key vessel characteristics, such as vessel type, gross tonnage, and available power demand indicators, which formed the basis of the modelling process. The second section used this structured information to generate synthetic power demand data for vessels where direct measurements were unavailable. These synthetic data were then used to support ship load demand forecasting, enabling the estimation of individual vessel power consumption and the aggregated cold ironing demand at port level.
2.3. Data Processing
The gathered information including vessel type, gross tonnage, available power consumption values, and peak power demand indicators, were arranged into a structured database for subsequent modelling. Since the raw dataset contained different vessel classes, inconsistent entries, and varying levels of completeness, a preprocessing stage was required to improve consistency and prepare the data for the learning procedure. A sorting algorithm was therefore applied to classify each vessel according to its type, category, and relevant operational characteristics. This process enabled vessels with similar technical features and expected operational profiles to be grouped together, ensuring consistency in comparison and reducing the computational burden during the estimation process. The resulting structured dataset forms the basis for the synthetic power demand generation process and supports the estimation of individual ship power consumption and aggregated cold ironing demand at port level. Table 1 illustrates Cargo and Tanker ship characteristics provided by port operators showing real power demand during loading and rest operation.

Table 1.
Build and Power characteristics of ships served in Limassol Port.
| Flag | Length | Max Amps | Power During Loading kW | Power During Rest kW | On-shore connection |
| PORTUGAL | 129.62 | 400 | 1000 | 350 | YES |
| LIBERIA | 147.87 | 400 | 330 | 300 | YES |
| MARSHA ISLANDS | 147.83 | 115 | 660 | 550 | YES |
| LIBERIA | 170.15 | 125 | 500 | 450 | YES |
| CYPRUS | 121.75 | 400 | 150 | 120 | YES |
| CYPRUS | 133.34 | 650 | 250 | 220 | YES |
| LIBERIA | 134.61 | 320 | 240 | 140 | YES |
| LIBERIA | 192.92 | 380 | 650 | 500 | YES |
| PANAMA | 333.96 | 380 | 2000 | 1700 | YES |
| SINGAPORE | 366.107 | 1200 | 2000 | 1500 | YES |
| SINGAPORE | 334.98 | 1250 | 2000 | 1200 | YES |
| PANAMA | 333.96 | 380 | 2000 | 1700 | YES |
Table 2.
Real recordings of ship arrivals in Limassol port.
| Type | GT | Date in Port | Duration in Port |
| Passenger | 167704 | 15/09/2025 | 10h15m |
| Passenger | 82820 | 06/10/2025 | 10h26m |
| Passenger | 42,363 | 10/10/2025 | 10h55m |
| Passenger | 69472 | 05/11/2025 | 16h11m |
| Passenger | 44697 | 27/11/2025 | 1d5h22m |
| Cargo | 95,514 | 07/12/2025 | 16h29m |
| Cargo | 35,574 | 21/07/2025 | 15h |
| Cargo | 35,878 | 27/07/2025 | 1d11h11m |
| Cargo | 32427 | 03/11/2025 | 1d8h34m |
| Cargo | 21,092 | 23/08/2025 | 19h27m |
| Tanker | 1896 | 01/07/2025 | 1d2h44m |
| Tanker | 30069 | 12/11/2025 | 15h |
| Tanker | 3828 | 22/10/205 | 12h53m |
2.4. Empirical Utilisation of Data
As established in the preceding literature review, ship electrical demand can be estimated by examining the relationship between a vessel’s physical and operational characteristics and its reported power consumption. Previous data-driven studies have demonstrated that variables such as vessel type, size, operational role, and usage profile can significantly influence onboard power demand, particularly during berthing when shore-side electricity is required for cold ironing operation. Building on this principle, the present study develops a data-driven regression-based methodology to generate synthetic power demand values for vessels where direct consumption measurements are unavailable.
The approach uses the three main data classes collected during the initial data-gathering stage: vessel type, gross tonnage, and reported power demand or peak power demand. These variables were selected because they provide a practical representation of the vessel’s category, scale, and electrical load requirement. Therefore, it is important to learn the underlying relationship between these input characteristics and vessel power demand, and to use this association to produce realistic synthetic estimates for ships with incomplete power data.
In this study, Random Forest Regression is employed due to its ability to capture nonlinear relationships between mixed data types and to reduce the limitations associated with simple linear assumptions [13]. In summary, the three types of data can be described as:
Vessel Type-Gross Tonnage
Peak Demand-Gross Tonnage
Vessel Type-Peak Demand
Utilising the linear regression approach, the model is trained to identify the relationship between vessel characteristics and power demand. Associating vessel types with GT and known peak power demand creates a power density coefficient. This ratio expressed in kW/GT describes the relationship between vessel tonnage and power demand and is later used to calculate peak power for unknown data. Eq. 4 displays the relationship between Peak power and Gross Tonnage with αtype being the power density coefficient for each type of vessel.
For that, the information fed into the model comprised of ship type, gross tonnage and peak power demand. Specifically, GT was used as the main size-related predictor, while vessel type was included as a categorical variable to account for operational differences between cruise ships, ferries, container ships, and tankers. During training, the Random Forest model constructed a set of (B) decision trees, where each tree was trained on a randomly selected bootstrap sample of the training data. At each node, the algorithm attempts to select the best Power value that reduces the Mean Squared Error. The final Random Forest prediction was obtained by averaging the outputs of all trees where B is the total number of trees and Tb is the prediction by each tree using the X input characteristics.
The predicted power demand was then used to calculate new vessel-type power density coefficients, expressed as
Continuing with the learning process, the raw information gathered from port operators and subscription databases was employed to classify each ship with the appropriate coefficient. Based on these characteristics, ships with similar characteristics and operational profiles were grouped together to ensure consistency in comparison and computational burden. Figure 1 illustrates the sorting algorithm flow diagram that categorises the ships into broader classes as mentioned in the previous section.
To evaluate the performance of the model over the large databases, a combined 80:20 train-test split with the Root Mean Squared Error is employed. This ensures that power density coefficients are not guessed nor based only on the proportional relationship between GT and Vessel type whereas, large prediction errors are penalised. This is illustrated in Eq8 where the difference between real and predicted values are squared which means large errors contribute more to the error. Essentially the dataset is first divided so that 80% of the vessel records are used for training and 20% are kept aside for testing. The model learns the relationship between vessel type, gross tonnage, and power demand using only the training data. After training, the model is applied to the unseen 20% testing data, and its predicted power demand values are compared with the known reported values. This approach is suitable for a large dataset because the model has enough data to learn from, while the testing subset remains large enough to give a reliable indication of how well the model performs on new vessel records.
Eventually, these coefficients provide a standardised way to quantify differences in power use across ship classes and form the basis for later estimating the overall power demand of each vessel. Table 3 shows the examples of the power density coefficient allocations. Power density coefficient is shown in Column 4.
3. Results
3.1. Ship Daily Load Profile
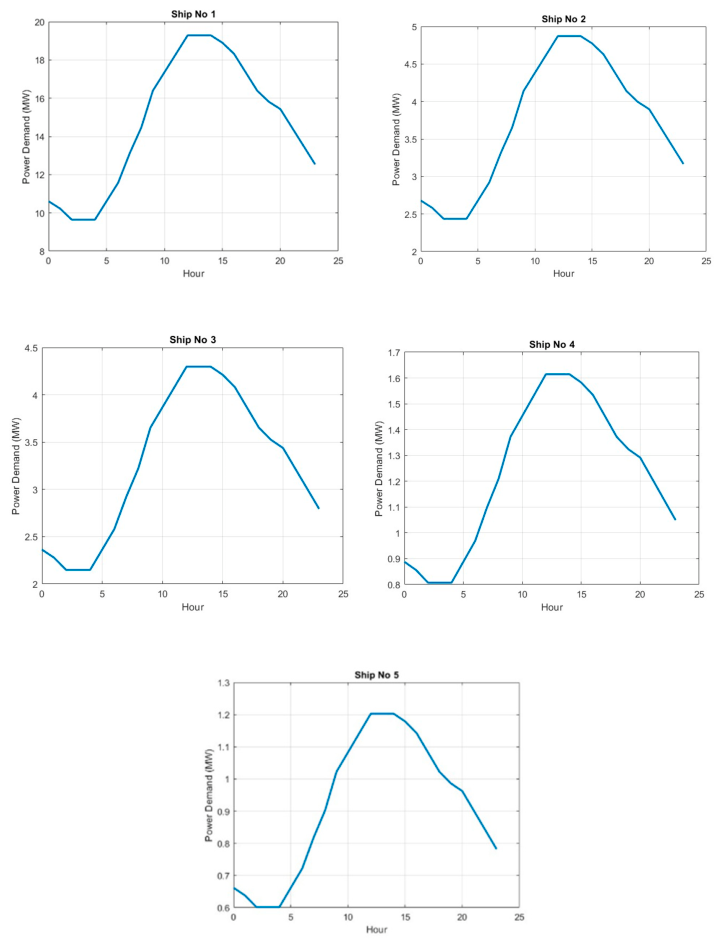
Since a power demand coefficient was established for each vessel type, it was possible to predict a load demand daily curve for ships berthing in Limassol port. Initially, a load demand weight assumption was made depending on the vessel’s assigned power density coefficient. For instance, the typical daily demand profiles for ships follow a characteristic pattern. Passenger vessels experience higher loads during daytime and evening periods due to passenger activities, food preparation, and entertainment systems. Night-time loads remain significant due to HVAC and hotel services. Cargo vessels, in contrast, show relatively flatter load profiles because their electrical demand is primarily associated with auxiliary machinery and cargo handling systems operating only momentarily.
Hence, using the berthing records acquired from the Limassol port databases, 5 different ships were simulated to generate 24-hour operation cycle of vessels arriving in Limassol port. Table 4 illustrates the characteristics of the 5 ships in question.
For each ship, the trained model estimated the expected electrical demand profile throughout a 24-hour period by considering operational characteristics such as vessel category, gross tonnage, passenger capacity, and berth duration. At the same point, to ensure accuracy, the load curve was cross-checked with the real readings available. The generated load curves reflect variations between peak and off-peak operating states, reproducing realistic fluctuations in onboard energy consumption during real life conditions. By integrating real vessel schedules and operational constraints, the simulations were able to emulate dynamic port-side demand with improved accuracy compared to static estimation methods.
Figure 2.
Output load demand cycles of 5 different vessels.
3.2. Accumulated Power Demand in Port
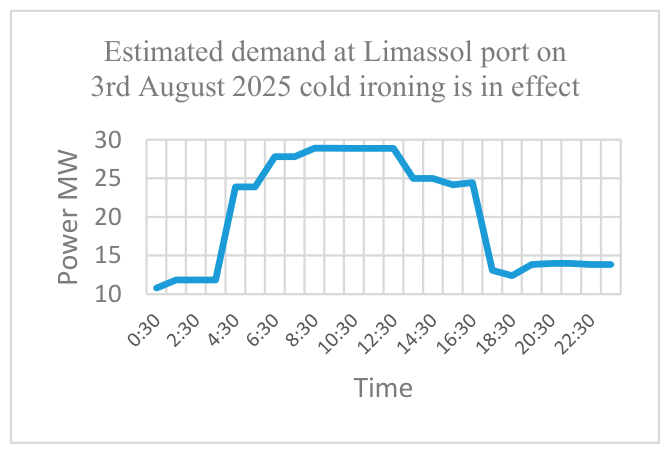
Ultimately, the previously defined datasets and computational procedures were utilised to derive an aggregated daily power demand profile for the port of Limassol. The modelling framework integrated the vessel classification algorithm and the power density coefficients assigned per category as well as temporal operational parameters extracted from berthing datasets such as arrival times and total berthed durations. These inputs were combined within a unified simulation environment to represent the time-dependent allocation of energy demand across port activities. The resulting formulation produces a continuous aggregate load curve, in 30-minute intervals, capturing the temporal progress of total electrical demand at the port of Limassol over a 24-hour operational cycle. Eq. 9 displays the number of intervals when calculating the accumulated power demand in the 24-hour operation cycle.
The simulation begins with the reading of the database containing vessel type and gross tonnage. Then, the model searches for the corresponding power density coefficient generated in the previous simulation. Once the correct coefficient is identified, the model calculates the peak power demand for the vessel in question. This carries on for all the ships arriving in port that single day. Subsequently, for each time interval if there is a ship berthed in port, its peak power demand is added to the loop. If there are multiple ships overlapping, their peak power demand is summed and added to the demand for that time instance. In essence, a nested loop is created that generates the accumulated power needs of the port for that day.
Figure 3.
Accumulated forecasted power demand of all ships berthed in Limassol port for 03/08/2025.
4. Conclusion
Cold ironing, also referred to as shore-to-ship power or onshore power supply, enables vessels to receive electrical energy while berthed, allowing auxiliary engines to be shut down during port stays. In isolated electrical networks, cold ironing can also provide an opportunity to utilise surplus renewable energy that might otherwise be curtailed. However, the successful implementation of cold ironing infrastructure requires a reliable assessment of the electrical demand imposed by different vessel categories, making demand estimation essential for port planning, grid integration, and energy management.
This study developed a data-driven methodology for estimating ship power demand using vessel type, gross tonnage, and reported or peak power demand as the primary inputs. The application of Random Forest Regression enabled the identification of relationships between vessel characteristics and electrical demand, allowing the generation of synthetic demand values for vessels lacking direct measurements. A vessel-type power density coefficient was derived and used to estimate individual ship demand and construct representative daily power profiles for cruise ships, cargo vessels, and tankers during berthing. By aggregating these individual demand estimates, the study provided an assessment of the accumulated port-level power requirement, supporting the evaluation of future capacity needs and grid reinforcement requirements. The main contribution of this work to both research and industry lie in the development of a practical and transferable framework for estimating cold ironing demand from limited vessel data, offering a valuable tool for port operators, infrastructure developers, and energy planners in the design and deployment of sustainable port electrification systems. Furthermore, the connection of large maritime loads may introduce power quality challenges, including voltage fluctuations, harmonic distortion, and sudden load variations during connection or disconnection events. Therefore, future cold ironing deployment should integrate demand forecasting with detailed assessments of grid stability, infrastructure capacity, and power quality mitigation measures.
5. Acknowledgements
This work was supported by the projects CODEVELOP-AG-SH-HE/0823/0197 (P2P-Ironing) implemented within the framework of the Cyprus Recovery and Resilience Plan ‘Cyprus_tomorrow’, with funding from the European Union -Next Generation EU, through the Research and Innovation Foundation, Cyprus.
It is also supported by the project EP/CETP/0923/0010 (CoEnerBuild), implemented under the Cohesion Policy Funds “THALIA 2021–2027” with EU co-funding.
The authors also acknowledge the support received from EUROGATE Container Terminal Limassol Ltd.
The authors further acknowledge the support received from DP World Limassol, the multipurpose operator at Limassol Port and a global end-to-end supply chain solutions provider.
References
- Directorate-General for Mobility and Transport. European Commission: Mobility and Transport. 10 January 2025. Available online: https://transport.ec.europa.eu/news-events/news/new-eu-rules-aiming-decarbonise-maritime-sector-take-effect-2025-01-10_en?utm_source=chatgpt.com (accessed on May 2026).
- “European Union: EUR-Lex,” 22 September 2023. Available online: https://eur-lex.europa.eu/legal-content/EN/TXT/PDF/?uri=CELEX:32023R1805 (accessed on May 2026).
- Mallouppas, G.; Kumar, A.; Loizou, P.; Petrakides, S. Emissions Performance Assessment of a Retrofitted Marine Genset Combusting Biomethane in Dual-Fuel Mode. J. Mar. Sci. Eng. 2025, vol. 13(no. 12), 2389. [Google Scholar] [CrossRef]
- Pruyn; Jeroen; Willeijns; Jelle. Cold ironing: Modelling the interdependence of terminals and vessels in their choice of suitable systems. J. Shipp. Trade (JST) 2022, 7*17. [Google Scholar] [CrossRef]
- Ünlübayir, C.; Mierendorff, U. H.; Börner, M. F.; Quade, K. L.; Blömeke, A.; Ringbeck, F.; Sauer, D. U. A Data-Driven Approach to Ship Energy Management. Mar. Sci. Eng. 2023, vol. 11. [Google Scholar] [CrossRef]
- Schwager, P.; Bekebrok, H.; Gehrke, K.; Vehse, M. A probabilistic bottom-up modelling approach for synthetic load profiles within the energy efficiency management of cruise ship cabins. J. Mar. Eng. Technol. 2023, vol. 22(no. 6), 304–312. [Google Scholar] [CrossRef]
- Kim, Y.-R.; Steen, S.; Kramel, D.; Muri, H.; Strømman, A. H. Modelling of ship resistance and power consumption for the global fleet: The MariTEAM model. Ocean Eng. 2023, vol. 281. [Google Scholar] [CrossRef]
- Uyanık, T.; Abu Bakar, N. N.; Kalenderli, Ö.; Arslanoglu, Y.; Guerrero, J. M. A Data-Driven Approach for Generator Load Prediction in Shipboard Microgrid: The Chemical Tanker Case Study. Energies 2023, vol. 16(no. 5092). [Google Scholar] [CrossRef]
- Planakis, N.; Papalambrou, G.; Kyrtatos, N. Ship energymanagementsystemdevelopmentandexperimentalevaluation utilizing marine loading cycles based onmachinelearningtechniques. AppliedEnergy 2022, vol. 307. [Google Scholar] [CrossRef]
- Abu Bakar, N. N.; Bazmohammadi, N.; Çimen, H.; Uyanik, T.; Vasquez, C. J.; Guerrero, J. M. Data-driven ship berthing forecasting for cold ironing in maritime transportation. Appl. Energy 2022, vol. 326, 1–12. [Google Scholar] [CrossRef]
- Ammar, N. R.; Seddiek, I. S. Evaluation of the environmental and economic impacts of electric propulsion systems onboard ships: case study passenger vessel. Environ. Sci. Pollut. Res. 2021, vol. 28, 37851–37866. [Google Scholar] [CrossRef] [PubMed]
- S&P Global, “Maritime Portal,” 2026. Available online: https://maritime.ihs.com/Account2/Index.
- Yan, 13 R.; Yang, D.; Wang, T.; Mo, H.; Wang, S. Improving ship energy efficiency: Models, methods, and applications. Appl. Energy 2024, vol. 368. [Google Scholar] [CrossRef]
Figure 1.
Flow diagram of sorting algorithm.
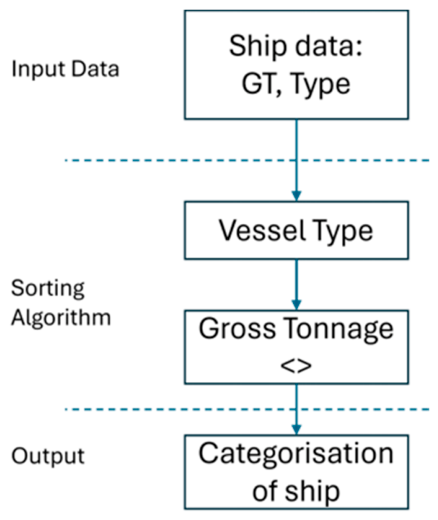
Table 3.
Output of power density coefficient allocations.
| Port | Vessel Type | GT | Power Density Coefficient |
| Limassol | TANKER | 3828 | 0.015 |
| Limassol | SUPPLY SHIP (O.R.S.V.) | 3601 | 0.015 |
| Limassol | CONTAINER SHIP | 32245 | 0.012 |
| Limassol | PASSENGER/RO CARGO/FERRY | 23922 | 0.012 |
| Limassol | VEHICLES CARRIER | 51823 | 0.01 |
| Limassol | TANKER | 1896 | 0.015 |
| Limassol | FISHING | 33 | 0.015 |
| Limassol | CONTAINER SHIP | 6701 | 0.015 |
| Limassol | PASSENGER | 98785 | 0.01 |
| Limassol | CONTAINER SHIP | 21583 | 0.012 |
| Limassol | TUG | 149 | 0.015 |
Table 4.
Characteristics of real vessels used to generate operation cycles. Recordings are from [12].
Table 4.
Characteristics of real vessels used to generate operation cycles. Recordings are from [12].
| Number | Type of Vessel | Gross Tonnage [Ton] | Date in Port |
| Ref ship | Passenger | 228,081 | n/a |
| 1 | Passenger | 167,704 | 15/09/2025 |
| 2 | Passenger | 42,363 | 10/10/2025 |
| 3 | Cargo | 95,514 | 07/12/2025 |
| 4 | Cargo | 35,878 | 27/07/2025 |
| 5 | Tanker | 30,069 | 12/11/2025 |
Disclaimer/Publisher’s Note: The statements, opinions and data contained in all publications are solely those of the individual author(s) and contributor(s) and not of MDPI and/or the editor(s). MDPI and/or the editor(s) disclaim responsibility for any injury to people or property resulting from any ideas, methods, instructions or products referred to in the content. |
© 2026 by the authors. Licensee MDPI, Basel, Switzerland. This article is an open access article distributed under the terms and conditions of the Creative Commons Attribution (CC BY) license (http://creativecommons.org/licenses/by/4.0/).
Copyright: This open access article is published under a Creative Commons CC BY 4.0 license, which permit the free download, distribution, and reuse, provided that the author and preprint are cited in any reuse.


