

Submitted:
24 June 2026
Posted:
06 July 2026
You are already at the latest version
Abstract
Many companies are re-examining their integration architectures as the pace of Digital Transformation in enterprise E-Commerce (B2B and B2C) accelerates. New integration architectures will depend on the ecosystem of services offered by partners. Integration patterns, including API-led connectivity and Pub-Sub messaging, have become essential in implementing such changes. This paper details a comparative study of two API orchestration paradigms synchronous request-response and asynchronous event-driven using MuleSoft Platform. This paper provides an example of the orchestration and reusability capabilities of the MuleSoft platform. The paper assesses several factors scalability, resilience, resource usage, and operational expenses and the influence of each orchestration model. The paper brings to the fore the performance trade-offs of each of these strategies using production deployment benchmark and industry-reported data: Thread-blocking constraints of synchronous systems. Eventual-consistency issues of an asynchronous messaging system. Trade-offs of point-to-point integration architecture. Thus, we can conclude that asynchronous integration architecture is applicable for the organizations where same data must be sent to multiple different downstream systems. Also, synchronous integration is useful where real time processing is needed for the end user. Research introduces a decision roadmap for integration architects to navigate modernization programs. Based on the business context and significance of the service, hybrid orchestration will create the most scalable and cost-effective results. This research was also conducted on the real production deployed applications using API-LED architecture pattern (experience layer, process layer and system layer) and evaluated 14M+ transactions in production system.
Keywords:
API-led connectivity
; enterprise integration
; synchronous communication
; asynchronous communication
; MuleSoft Anypoint Platform
; enterprise e-commerce
; AMQ
1. Introduction
The combination of cloud computing, mobile first design, and real-time data requirements have drastically transformed what enterprise integration should be able to provide. A significant challenge in the current IT leadership is that today they must connect old systems of record to new multi-channel digital experiences, which, in many cases, are not designed to work with one another (thousands of applications). According to MuleSoft’s Connectivity Benchmark Report, which says most enterprise organizations design and implement more than a thousand applications, but fewer than one-third are fully integrated. As a result, most organizations continue to contend with endemic data silos which limit innovation, increase maintenance costs, and slacken strategic decision-making [1].
One of the leading healthcare providers Healthcare Client A (anonymized per client agreement) eCommerce client has traditionally used the monolithic architecture, in which all the integrations are synchronous and point-to-point from front-end application to back-end systems. This also causes tight coupling of all the systems. Initially, this architecture was straightforward where only few integrations were needed to support end-to-end checkout journey. However, as the architecture grows more complex and target systems start increasing, the requirement of additional integration grew. Long development time, difficult debugging production issues, requirement of deploying the complete package even after one attribute change. Adding resources to the monolithic architecture is more difficult and expensive, even to support very small integration, as it is packaged in a single package.
API-Led architecture has emerged as an effective solution to this tight coupling and point-to-point integration problems. This architecture decomposed monolithic integrations into small entities of micro-services, each representing a unique purpose in the whole integration eco-system. These small entities can be deployed independently without impacting any other functionality which results in faster time to market and less investment in validation/regression testing. This modularity allows development team to develop faster, develop in parallel and test as a whole connected integration. Previous research in Microservice architecture has shown that this type of architecture can improve performance by reducing latency & increasing flexibility. Moreover, this architecture also increases reliability on data processing, less packet loss with less operational cost and fewer production issues [5]. Anypoint CloudHub also provides a playground to deploy integration and flexibility to use advanced features like real-time monitoring in cloud-based ecosystem. Several months of implementation and monitoring of the integrations, show that Mulesoft integrations handle higher transactions volumes effectively with very few errors and minimal vCore utilization. As shown in Figure 1, the API-Led architecture for Asynchronous pattern processed 3.2 million messages in the last 30 days. For the same Integration, Figure 2 shows that system utilization and JVM used over last 30 days with 0.2 x 3 workers configuration.
Figure 1 and Figure 2 clearly illustrate the architectural benefits of adopting API-LED architecture by projecting number of messages processed with very low infrastructure cost which is very difficult to achieve using traditional monolithic integration architecture. This pattern reduces operational strain on backend systems without increasing the infrastructure on backend systems side. Additionally, modularity provides flexibility to the organization to target scaling and resource utilization challenges and provide stable operational system for long-term use. To improve services, real-time data processing, and system resilience, a microservice-based middleware architecture is used that utilizes an API Gateway to manage services [7]. Authentication and authorization at each individual micro-services layer improve system security and any future threats of cyber-attacks, while maintaining good response time and performance of the systems [8].
This study assesses the integration patterns, performance, scalability and availability of integration architecture compared to monolithic point-to-point integration for the Healthcare E-Commerce website/domain at Healthcare Client A (anonymized per client agreement). The assessment uses transaction volumes, performance metrics, response time metrics, number of failed transactions, CPU utilization, Heap memory and integration pattern used (Synchronous vs. Asynchronous).
There are 4 main causes. We propose a 3-dimensional orchestration pattern selection framework which is the most practically significant organized around latency tolerance, consistency requirement and failure mode preference. This enables integration architects to adopt the right patterns, synchronous or asynchronous at the design time rather than finding the mismatch in production. This is framework is not similar to other frameworks in the literature, which are in Production. Additionally, this paper also shows production evidence at an unusually high scale for the academic integration literature. There were 10M+ synchronous login transactions with a success rate of 99.8% (95% CI: [99.797%, 99.803%]). Moreover, there were 4M+ async order history messages with 98.2% success (95% CI: [98.186%, 98.214%]). Both were on 0.2 vCore × 2 worker CloudHub 2.0 configurations. Due to sample sizes used, the confidence intervals are very tight. Thus, these figures have statistical weight that is not derived from synthetic load studies only. The construction of the study at 4.7 does not entail a MuleSoft-specific implementation. The decision dimension in Azure Integration Services has a similar construct to that in AWS EventBridge. So, you can apply this to whichever iPaaS vendor you choose. Furthermore, it also details the architecture and running configuration for a 100+ application MuleSoft deployment at a multinational Fortune 500 health distributor. There is limited literature on how enterprises integrate with their suppliers and customers.
This paper also shows monthly transaction data for an eCommerce site for Healthcare Client A (anonymized per client agreement) for Order processing are shown in Figure 3 to further highlight the scale of service utilization. Between April 2026 and May 2026, this chart shows the total number of transactions and the number of successful transactions. The difference and gap between total transactions and successful transactions shows that the system's high reliability and effectiveness of this architecture without disrupting service continuity during the high API traffic.
The remainder of this paper is organized as follows. The next section presents work related to application integration, synchronous and asynchronous communication patterns, API-led architecture, and AI-augmented governance. Section 3 briefly describes the system architecture, evaluation methodology, and measurement parameters. Section 4 is devoted to explaining the results of the comparative evaluation across the two orchestration paradigms with production deployment evidence. Section 5 discusses threats to the validity of the findings. Section 6 presents conclusions and directions for future research.
2. Related Work
2.1. Enterprise Application Integration
Enterprise application integration (EAI) technologies have evolved for two decades now. Many companies are making the shift to a more decoupled and API-based architecture to avoid point-to-point coupling. A middleware framework that is centralized is its alternative. Hohpe and Woolf (2004), EAI refers to channels, routers, transformers, and endpoints. The distinct designs connect and display patterns, the core Mulesoft Anypoint Platform integration design patterns.
The launch of an enterprise service bus (ESB) emphasizes integration and modularity. Josuttis reveals that an implementation of a central ESB often became an organizational bottleneck. Consequently, the IT Teams were unable to align with the business change. Thus, it made the integration not as straightforward as intended [4].
Other writings were done to study middleware platforms and their respective operating performance for agile migration from monolith to microservices.
Fauziah and Surantha carried out experimental research to find out about middleware assessment in microservices migration using banking app. According to their performance assessments, users reported tangible improvements in CPU utilization, memory utilization, latency, and throughput, and reported that their middleware based on microservices architecture achieves improvements along all these dimensions over a monolith baseline [6].
This study is quite similar to the present research study. The eCommerce and finance industries conduct high-volume transactions. Implementation of a layered API architecture with an appropriate gateway management can help enhance service reliability and keep per-transaction infrastructure cost low [7,12]. This study will assist in choosing orchestration patterns for API-led integrations. The choice of synchronous vs. asynchronous in a three-tier integration architecture of a healthcare Fortune 500 company is analyzed. Furthermore, it also expands on a previous study.
2.2. Communication Patterns: Synchronous and Asynchronous
As per the literature more specifically the literature distributed system and software engineering literature there is a lot of impact on performance and trade-off in both cases. Nonetheless, due to saturation of threadpool, sustained batch of games in category APIs is restricted [8]. The design of microservices system which communicates with the unique authentication and security of each company introduces aggregate latency overhead down the service hops through synchronous HTTP based request chains. Architectural awareness is necessary to prevent these types of failures in tightly coupled flow.
Systems designed using asynchronous event-driven architectures often yield superior throughput characteristics due to the separate timing of producer and consumer functions. Although the benefits of eventual consistency are clear, the price can be high. Research reveals that integration portfolios are becoming more complex to coordinate. The governance frameworks are important to manage inter-service dependencies. Consequently, it is recommended that message-passing service graphs do likewise [9]. Literature shows IoT/Cloud integration is an expanding trend. According to the given reference, an asynchronous queue-based message delivery system helps reduce peak utilisation of infrastructure and provides high availability during variable or bursty load conditions. According to the findings in section 4, an order history message total of over 4 million can be processed asynchronously with a CPU utilization less than 25% on a 0.2 vCore × 3 worker CloudHub configuration. You will recall this may make it impossible to use a synchronous architecture.
Performance evaluation over various popular message queues like Redis, RabbitMQ, Kafka and ActiveMQ Artemis shows that broker selection puts a significant impact on latency and throughput behaviour. The Kafka framework gets defaulted to, in areas that need a high throughput. In general, EDA has a lower usage of CPU, memory, response time and other monolithic communication patterns [17]. As noted in [16], EDA implementation has produced up to a 20% increase in yield (and thus profit), on several benchmark designs. The evaluation of environments that detected cloud-native micro-services necessitates assessing not only the individual micro-services throughput but also that of the entire end-to-end system [18].
2.3. API-Led Architecture and Microservices
In the past, Newman has established the micro-services architectural patterns including design principles of service decomposition and independent deployability, which became the backbone of future API-led connectivity frameworks [5]. The three-layered API-led design pattern which includes System, Process and Experience layers extend these principles which allow defining architectural boundaries and also enables multiple scrum team to do parallel development to reduce regression risk across large-scale integration networks [2]. Delivery timelines can be improved and reduced by adopting Mulesoft's API-led connectivity framework, same framework can also improve the reusability of integrations across multi-cloud enterprise environments [1].
Choi et al. investigated adaptive microservice orchestration under resource balance constraints in cloud environments, demonstrating that dynamic service allocation and orchestration policies significantly impact both service quality metrics and infrastructure cost-efficiency [7]. This finding is directly applicable to the orchestration scheduling decisions analyzed in the present study. Recent work on static analysis of microservice evolution provides methodological frameworks for assessing architectural debt and communication complexity in large integration portfolios, relevant to the 100+ application deployment environment analyzed herein [9]. Complementary research has demonstrated that implementing layered authentication and authorization with dedicated microservices improves security posture while maintaining acceptable response times at scale [8], an observation echoed in the synchronous login authentication results presented in Section 4.5, which showed a 99.8% success rate across 10M+ login transactions. Collectively, these studies establish the architectural and empirical foundation for the comparative orchestration framework proposed in this paper.
2.4. AI-Augmented Integration Governance
Research has begun to examine the intersection of large language models (LLMs) and enterprise integration governance, a convergence with profound consequences for the operational management of large API networks. To reduce specification authoring effort, Lazar et al. proposed automated way of generating OpenAPI specification from API documentation using LLMs, this also demonstrate the future opportunities of AI-assisted API lifecycle management including cross-team documentation consistency improvement [10]. Another framework proposed by Daunis also mention that LLP-powered framework can be used to create a declarative language framework for building and orchestrating LLM-powered agent workflows. The narrow line between API orchestration and AI orchestration is becoming increasingly coming closer as autonomous agents adopt REST and event-driven communication protocols [11].
These developments have real consequences for the operating governance of enterprise integration programs at the level examined in this research, with manual API policy management across 100+ integrated applications not scaling sustainably. With the evolution of integration platforms, we expect the introduction of AI-augmented capabilities for anomaly detection, policy enforcement recommendation, and flow optimization. It offers a major direction for future research on enterprise integration architecture.

Table 1.
Summary of Related Study.
| Ref | Title | Method | Key Result | Proposed Model |
|---|---|---|---|---|
| Fauziah & Surantha 2026 [6] | Middleware perf in monolith-to-microservices transition | JMeter stress testing, 30-60 TPS | 40-50% CPU reduction, 61% faster recovery | Microservices + middleware + dual-layer auth |
| Blinowski et al. 2022 [14] | Monolithic vs microservices performance | CPU, throughput, RAM comparison | Monolith superior in simple systems | Java + Spring Boot + .NET ASP.NET Core |
| Choi et al. 2025 [7] | Adaptive microservice orchestration | Resource balance constraints | Dynamic allocation improves QoS | Cloud VR microservice orchestration |
| Cabane & Farias 2024 [17] | Event-driven architecture performance | Exploratory performance study | EDA outperforms monolith by 19% response time | Event-driven architecture model |
| Chy et al. 2023 [13] | JVM message queue comparison | Benchmark: Kafka, Artemis, Pulsar, RocketMQ | Redis best for latency, Kafka for throughput | JVM-based message queue selection |
| Maharjan et al. 2023 [15] | Message queue benchmarking | Redis, RabbitMQ, ActiveMQ, Kafka | Broker choice significantly affects latency profile | Queue selection framework |
There is already a significant body of literature related to microservices architecture and API management. That said, there is very little literature that has validated practical guidance that relates to platform specifications. Furthermore, there are also no resources regarding the selection of orchestration pattern in API-led connectivity (ALC) frameworks at the enterprise level. According to current research on the subject, orchestration is studied in general context of distributed systems or the fault tolerance or performance benchmarking in isolation [6,7,8,9]. There are no such studies that show practitioner-validated decision framework for hybrid orchestration pattern selection across synchronous and asynchronous patterns for enterprise integration deployments involving more than 100 production-grade integrated applications. This paper tries to connect the dots with a systematic comparative study backed by first-hand deployment experience from a Fortune 500 healthcare eCommerce setting, giving a quantified performance comparison of the related techniques and a three-dimensional orchestration decision-making framework to be used in enterprise integration modernization programs.
3. Methodology
Most of the previous researches were relied on synthetic load generation tools like Apache jMeter which can generate the load in controlled manner to assess performance of the system, CPU utilization, success rate, error rate, but unlike this simulation of generating transaction volumes this research investigates actual enterprise monitoring of production data from 100+ Mulesoft integrations deployed for e-commerce system capable of handling 14M+ real user transactions across two distinct orchestration paradigms. This method provides the real performance evidence that is not influenced by any assumption or synthetic load generation. This study uses Cloudhub 2.0 Anypoint monitoring dashboard in real time, CPU utilization data, memory consumption data, API response times data, message queue processing and transaction success rate and all these details are collected for all the deployed integration applications.
The architecture of the proposed system is API-LED design pattern based and the main entry point for handling requests coming from any one of the user channels (Web, Mobile, Kiosk) or other frontend interfaces (Angular, HTML, NodeJS). The Anypoint CloudHub out-of-the-box API Gateway completes initial authentication using existing policies, modifies the request and response formats if necessary, and then sends the requests to the relevant MuleSoft Application for additional business logic execution and processing. To improve security without increasing computational complexity, an extra authentication step is performed at the application level.
Synchronous orchestration is most used and commonly API communication mechanism in today's enterprise integration ecosystem. It works on request-response blocking model where a client triggers a request, and the server blocks the thread until it replies with the correct response back to the calling system. This model uses HTTP/REST protocol for communication and offers a safe and recognizable programming model. This synchronous flow is easy to implement, design, test and debug, and it has business logic capability that explain why it has remained popular in integrations that are point-to-point. API-Led Architecture pattern is based on Experience, Process and System layers provide well defined partition of business logic and validation. Process Layer is most useful for this design, it orchestrates responses from many System APIs, different response data formats and returns one unified payload to the Experience layer and then returns to the consuming system. This orchestration will reduce the number of synchronous API calls initiated by the client systems, and enhance the responsiveness of the application, which is shown in Figure 4.
On the other hand, asynchronous orchestration separates interaction between the services by removing the need to be available at the same time as shown in Figure 5. Message producer (system that generates a message) does not wait for the target system service to return the response back immediately but it just publishes the message and get the acknowledge from the message broker, in this case its Anypoint MQ (AMQ) that message has been received and published, in integration term it is known as "Fire and Forget". The message is received and processed by the consumer, at his/her own pace. It is the architectural base of resilient high throughput distributed systems using this fire-and-forget model or event-driven model.
The Anypoint Cloudhub platform offers two different types of mechanisms to implement asynchronous Mulesoft flows. First mechanism is using Virtual Memory (VM) queues, which are lightweight, asynchronous, in-memory queues and can be implemented using a connector in a single Mule runtime instance. VM queues are also helpful in decoupling integration points without adding any extra complexity of implementing external broker. Second mechanism is using Anypoint MQ (AMQ) which is multi-tenant, fully cloud managed broker service offers persistent storage of the messages in availability zones and very useful for the organization's ecosystem where cross-application communication is needed including durability and delivery of the messages are essential. Asynchronous architectures also offer structural fault tolerance which is very hard to achieved in synchronous systems. For example, if any of the target system's service is unavailable then messages are continuing to be held in the queue, and when the target system service is available again then integration will start processing the messages again without any manual intervention. This mechanism can easily be achieved using the Circuit Breaker configuration of Anypoint MQ which is one of the out-of-the-box features of Mulesoft and can be configured directly on AMQ connector. Dead Letter Queues (DLQs) is also one of the great ways of ensuring zero message loss, where messages which are not processed (due to Technical or Business errors) are sent to the DLQ and then another process can be built to read the DLQ messages and sent the automatic error feedback to the source system.
The minimum possible observability infrastructure to include in an asynchronous deployment is CorrelationIDs and Dead Letter Queues, these are important for debugging and error handling. After implementing these two, the next step would be to add distributed tracing systems like Anypoint Monitoring, Splunk Dashboards/logs or Kibana to ensure end-to-end visibility of all the transactions along with decoupled processing chains.
The sizing of each Mulesoft application at the time of Anypoint cloudhub deployment was set as 0.2 vCores x 2 workers (overall 0.4 vCore memory). To communicate between Front-End, Integration layer and Backend over HTTP protocol, we need service orchestrator and Integration server.
Few performance indicators were used for evaluation which are CPU utilization, memory utilization, throughput, latency, number of instances, error rate, success rate, and time to recovery. These parameters are summarized in Table 2. These are the parameters which can be used through-out the evaluation process to determine architecture's resilience and efficiency.
3.1. Performance Measurement Framework
We didn't set up a separate test environment for this. The numbers in Section 4 come straight off the Anypoint Monitoring dashboard that was already running in production — no JMeter, no synthetic load, no traffic replay. That distinction matters because production data is real time customer transaction data, which includes all the different types of operation customer does directly on the website, traffic pattern for example Monday morning is less as compare to Friday evening and even slightly higher over the weekend.
Success rate is SR = (N_success / N_total) × 100. N_success is every transaction that returned HTTP 200; N_total is everything that came in. Straightforward — but at 10M+ transactions, even a 0.1% shift is the customer traffic pattern or error rate, that would directly impact the overall metrics.
Response time is mean wall-clock elapsed time per transaction, from API Gateway receipt to HTTP response out. Network latency time was excluded due to multiple different factors like Akamai being in the front of all the API gateway and Anypoint policy execution time also impact the overall time. CPU is the 30-day mean sampled at 60-second intervals per worker, expressed against the vCore allocation. Heap follows the same cadence against the configured ceiling.
Thirty days as the window wasn't arbitrary. This window is important for the client and for this paper as it includes 4 weekend data, starting of the month rush and also 4 weekdays of data where transactions on few days (middle of the month) is lower as compare to other days (starting or end of the month).
4. Results and Discussion
This section presents the results of evaluating monolithic and API-LED integration architectures, supplemented by an interpretation of the test results and the conclusions that can be drawn based on the tested parameters.
To validate the comparative framework in a production environment, this section presents deployment evidence from an enterprise API-led integration program at a Fortune 500 healthcare eCommerce website Healthcare Client A (anonymized per client agreement). The organization serves 1M+ healthcare practitioners globally and operates in different countries including US, Canada, UK, Ireland, and France, with 100+ MuleSoft applications deployed as a part of transformation.
Architecture: CloudHub2.0 was used as the deployment platform for Mulesoft applications. API-LED architecture (three layered API architecture) was used to provide abstraction over SAP CCv2 (commerce system), Angular (Front-end layer), SAP ECC (ERP system), Legacy databases and custom platforms. There are 20+ System APIs, 70+ Process APIs and 20+ Experience APIs were deployment as a part of complete Integration ecosystem. System APIs are used to communicate with the downstream systems, Process APIs were implemented for business orchestration/logic and Experience APIs were used to serve different web channels like mobile, web and partner channels. Along with these there are 100+ Anypoint MQ created to support asynchronous data processing to downstream systems.
Orchestration Pattern identification: For Price calculation on PDP/Checkout page, Inventory reservation, Payment Auth+Capture, User authentication and order submission we used Synchronous pattern as it required immediate responses before downstream system processing. For Order submission to ERP system, Order status updated from ERP to commerce system, Account create/update synchronization and Notification services we used Asynchronous patterns using Anypoint MQ as these are high-volume, non-blocking events.
4.1. Applications Involved
For the analysis, two application use cases are considered:
4.1.1. Asynchronous
This flow consumes the messages published in AMQ and sends it to commerce engine (SAP CCv2); this is the order status update which MuleSoft receives from ERP system for the customer to track the progress of the orders. Apps: 1) jde-order-history-consumer-v1-app; 2) order-history-v1-papi; 3) sapccv2-oh-header-v1-proxy.
4.1.2. Synchronous
This flow directly serves real-time login for the customer after validating the credentials. Apps: 1) web-accounts-login-v1-eapi; 2) accounts-login-v1-papi; 3) sapccv2-accounts-login-proxy.
4.2. Total Messages Processed
4.2.1. Order History transaction (Asynchronous) — 4M+ (Figure 6). 4.2.2. Login transaction (Synchronous) — 10M+ (Figure 7).
4.3. Performance Evaluation
In the old monolithic architecture of Healthcare eCommerce client A (anonymized per client agreement), the request volume handling capacity was very low, but with the new API-LED Architecture pattern, integrations can handle much more volume of transactions per day as compared to monolithic legacy webservices. Figure 8 shows the average response time (30-day window) of order history messages which is under 5 sec for 4M+ messages. On the other hand, for login transaction the average response time (30-day window) is less than 1.5 sec for 10M+ messages, as shown in Figure 9.
4.4. CPU and Memory Utilization
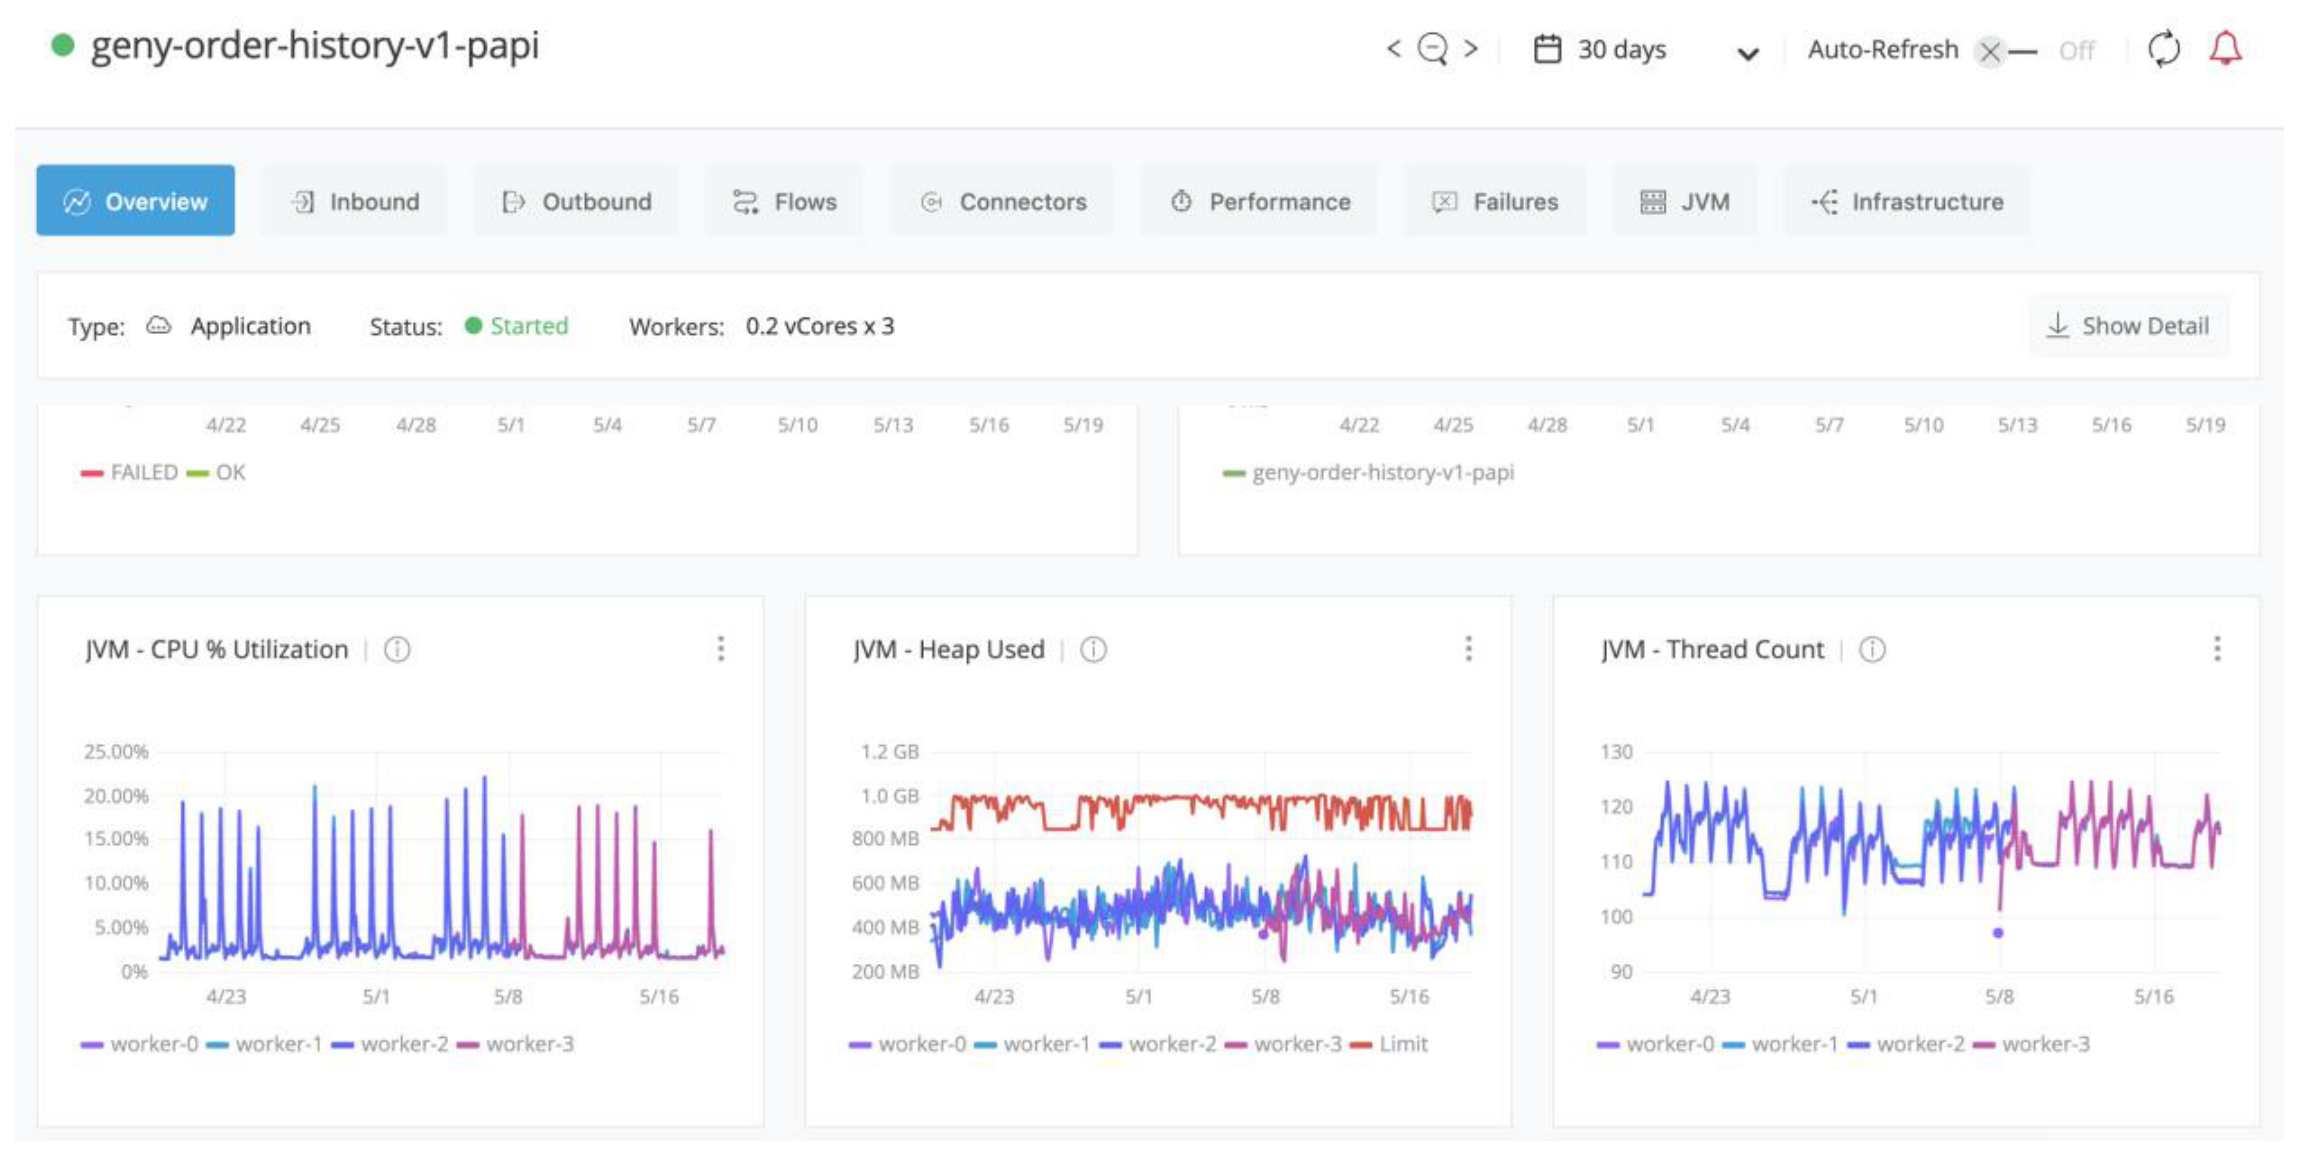
According to Figure 10, CPU utilization of the synchronous login application is less than 5% in the last 30 days and memory utilization is also less than 80%, showing good performance of the API-LED architecture to support real-time login for the user. On the other hand, for asynchronous order history transaction the CPU utilization is less than 25% and memory utilization is less than 60%. This transaction data shows that even after 10M+ messages API-LED architecture is stable and serving the transactions without any instability issues.
Figure 10.
CPU & Memory utilization for login application.
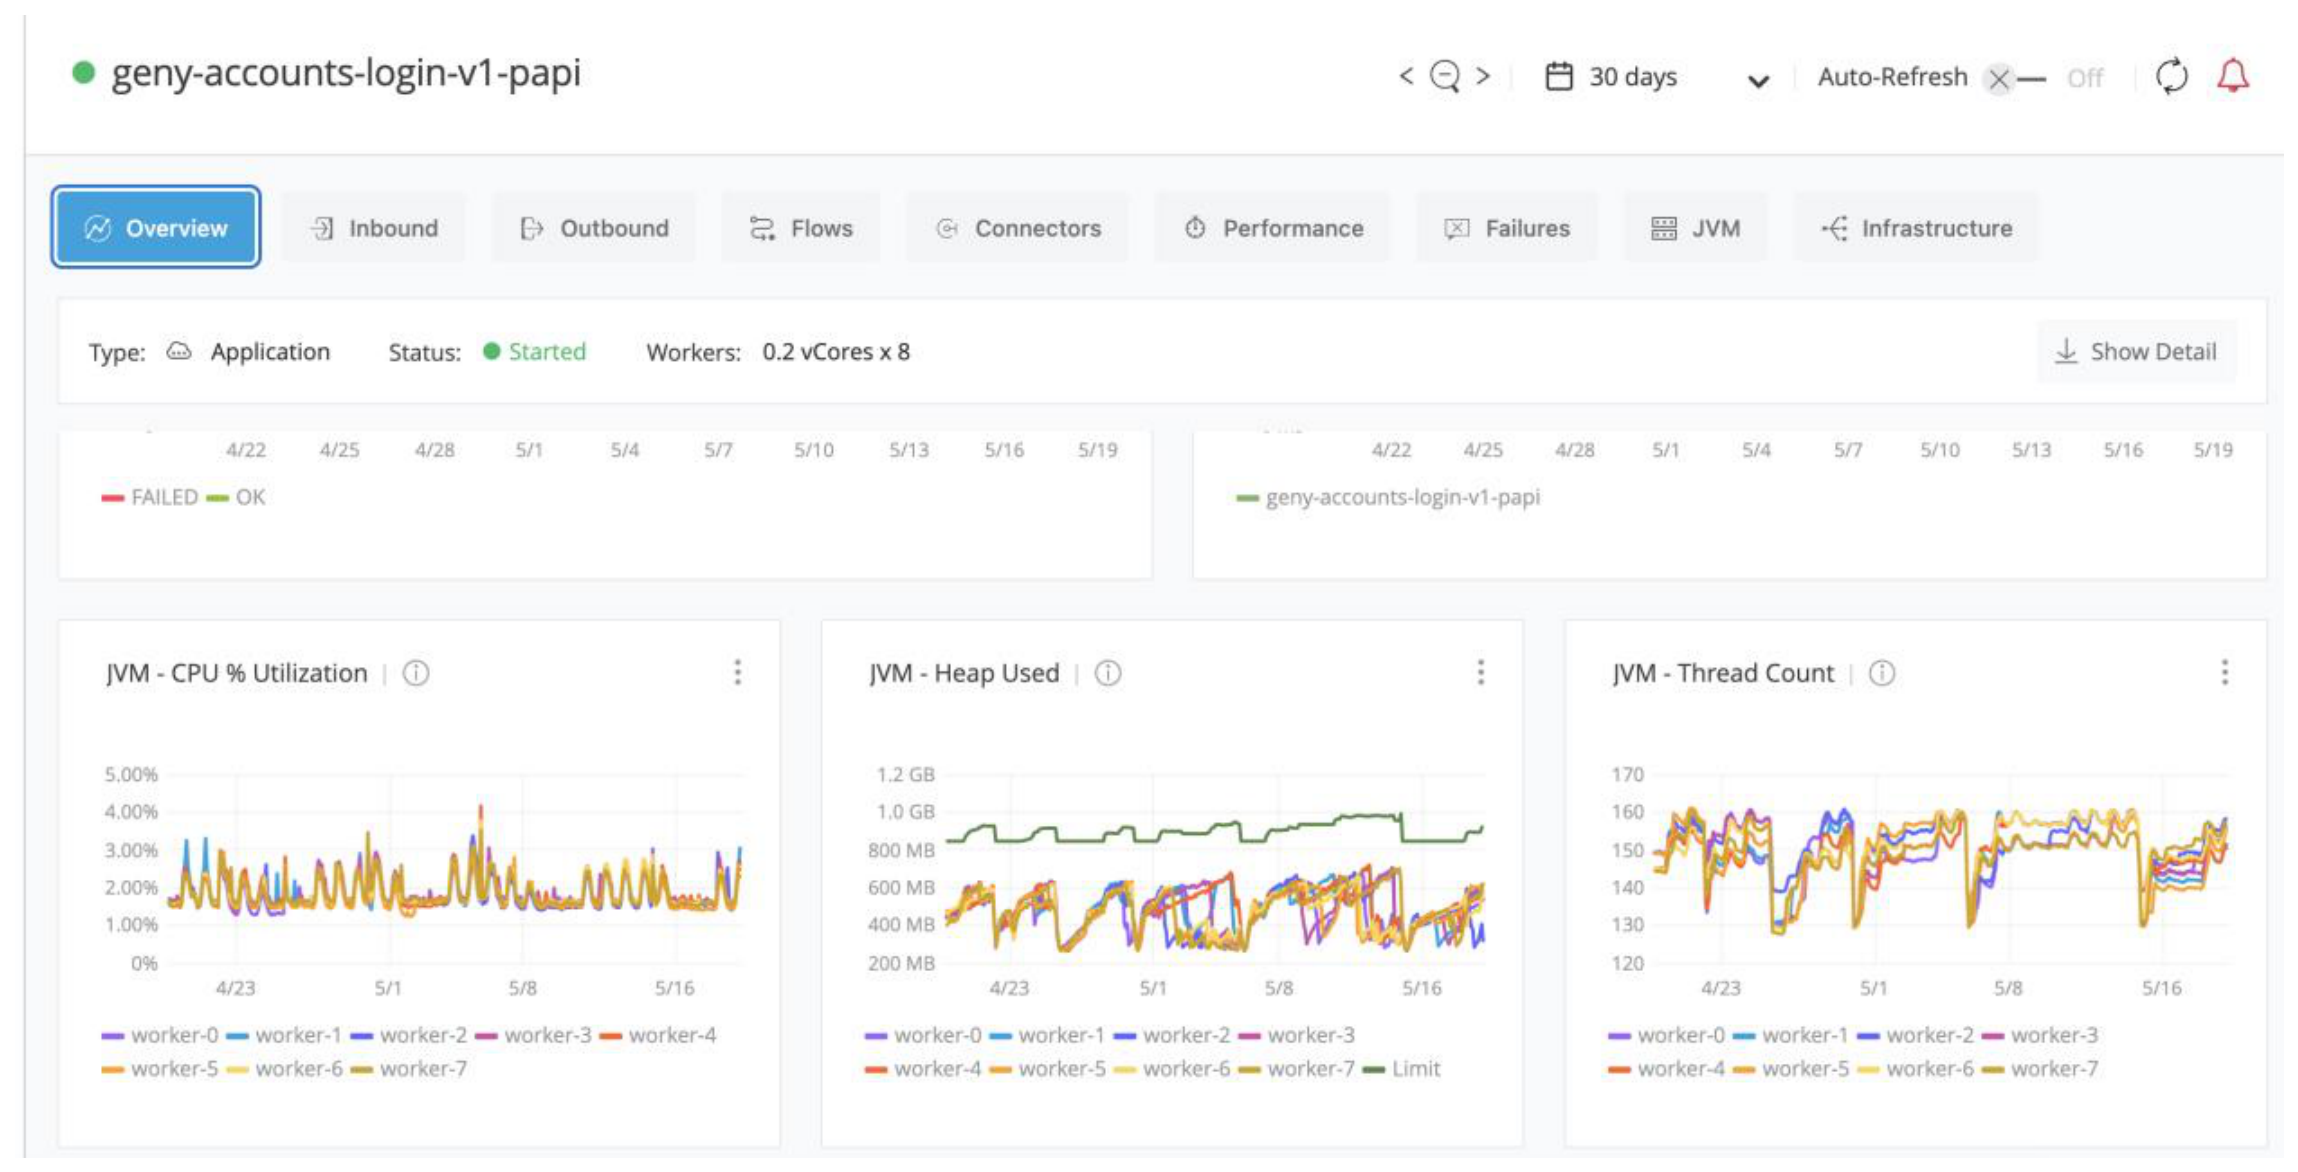
Figure 11.
CPU and Memory utilization for order history transaction.
4.5. Success Rate, Error Rate and Error Handling
The success rate of the synchronous login flow is 99.8% for 10M+ transactions. On the other hand, the success rate for Monolithic architecture was coming down to 90% for significantly lower transaction volume, which clearly reflects that how API-led architecture reduce the failure rate even with very high-volume scenario. Now, the questions here why there still a chance of 1-1.2% failure rate? The answer is due to either customer data inconsistency (invalid credentials, deactivated account or non-existent username) rather than any infrastructure problems.
The asynchronous order history flow returned a 98.2% success rate across 4M+ messages. The 1–2% error rate breaks into two distinct categories that are worth distinguishing: technical errors (HTTP 5xx codes), where a 5-minute interval retry mechanism raises the effective success rate to 98.9%, and business errors (HTTP 4xx codes), which represent data inconsistencies in the source message and are correctly not retried — instead, MuleSoft writes the error detail back to the originating system so the data can be corrected and resubmitted. The differentiation between errors which are required to be retried or not is necessary, the retry should only be done for any technical error (5xx errors) and not for any data related error (4xx), otherwise it'll put unnecessary load on the system and create data problem in the ERP system.
10M+ and 4M+ are the sample sizes, which make the statical confidence in these figures high for the case study. Table 4 represents the comparison including 95% Wilson score intervals. The differences between API-led success and monolithic success are wide enough that one can be sure of them at any reasonable significance level.
4.6. Discussion
The results shown in Section 4.2, Section 4.3, Section 4.4 and Section 4.5 were derived by analyzing/observing three-dimensional framework, this consideration is important before any conclusions are drawn. This matters because the utility of this framework is the explanation it offers as to why performance profiles differ, not that they do differ.
To identify latency tolerance, we calculated the mean response time of the synchronous login flow which was deployed in Production environment. The 1.5 second mean response time is a real production data without any guess work or accident. The login (user authentication) synchronous flow was considered to demonstrate the number because this is a very sensitive integration and a gateway to the Website. The healthcare practitioner will not wait after entering the credentials on the portal, so the effectiveness of this integration is very critical. The login flow is very sensitive, and it can't be partially successful, the session of the user will be established completely once the integration is successful or user will see an error if integration fails. With a success rate of 99.8% and response time of less than 1.5 second, API led Synchronous design does deliver that requirement at 10M+ transaction scale without over consuming Infrastructure (CPU under 5%). The production data confirms the prediction made by the framework classification for Dimension 1.
On the other hand, order history transactions/flow works perfectly with asynchronously for the opposite reason. The end-user or customer does not require order status update instantly for the order and it'll take some time to process the order by ERP system. Instead, order status should be updated as soon as it is process by ERP and customer refreshes the page again, it may happen in few minutues or few hours. Delivery with a success rate of 98.2% on 4M+ messages which escalates 98.9% with retry demonstrates that at-least-once delivery with a well-configured retry mechanism and DLQ for this class of interaction is commercially reliable.
According to the failure mode preference dimension, the retry and DLQ functionality, explained in Section 4.5, is an executed reflection of Dimension 3. Asynchronous flows are created to prefer graceful degradation before fast failure, meaning that a message which cannot be processed is held and retried, and not fast-failed with an error surfaced to the upstream system. The operational implementation of this preference is the differentiation of 5xx technical errors as retriable and 4xx business errors as non-retriable which is written back to source. Had we applied Fast-Fail semantics for the 5xx category, the effective success rate would have been 98.2%, versus 98.9%.
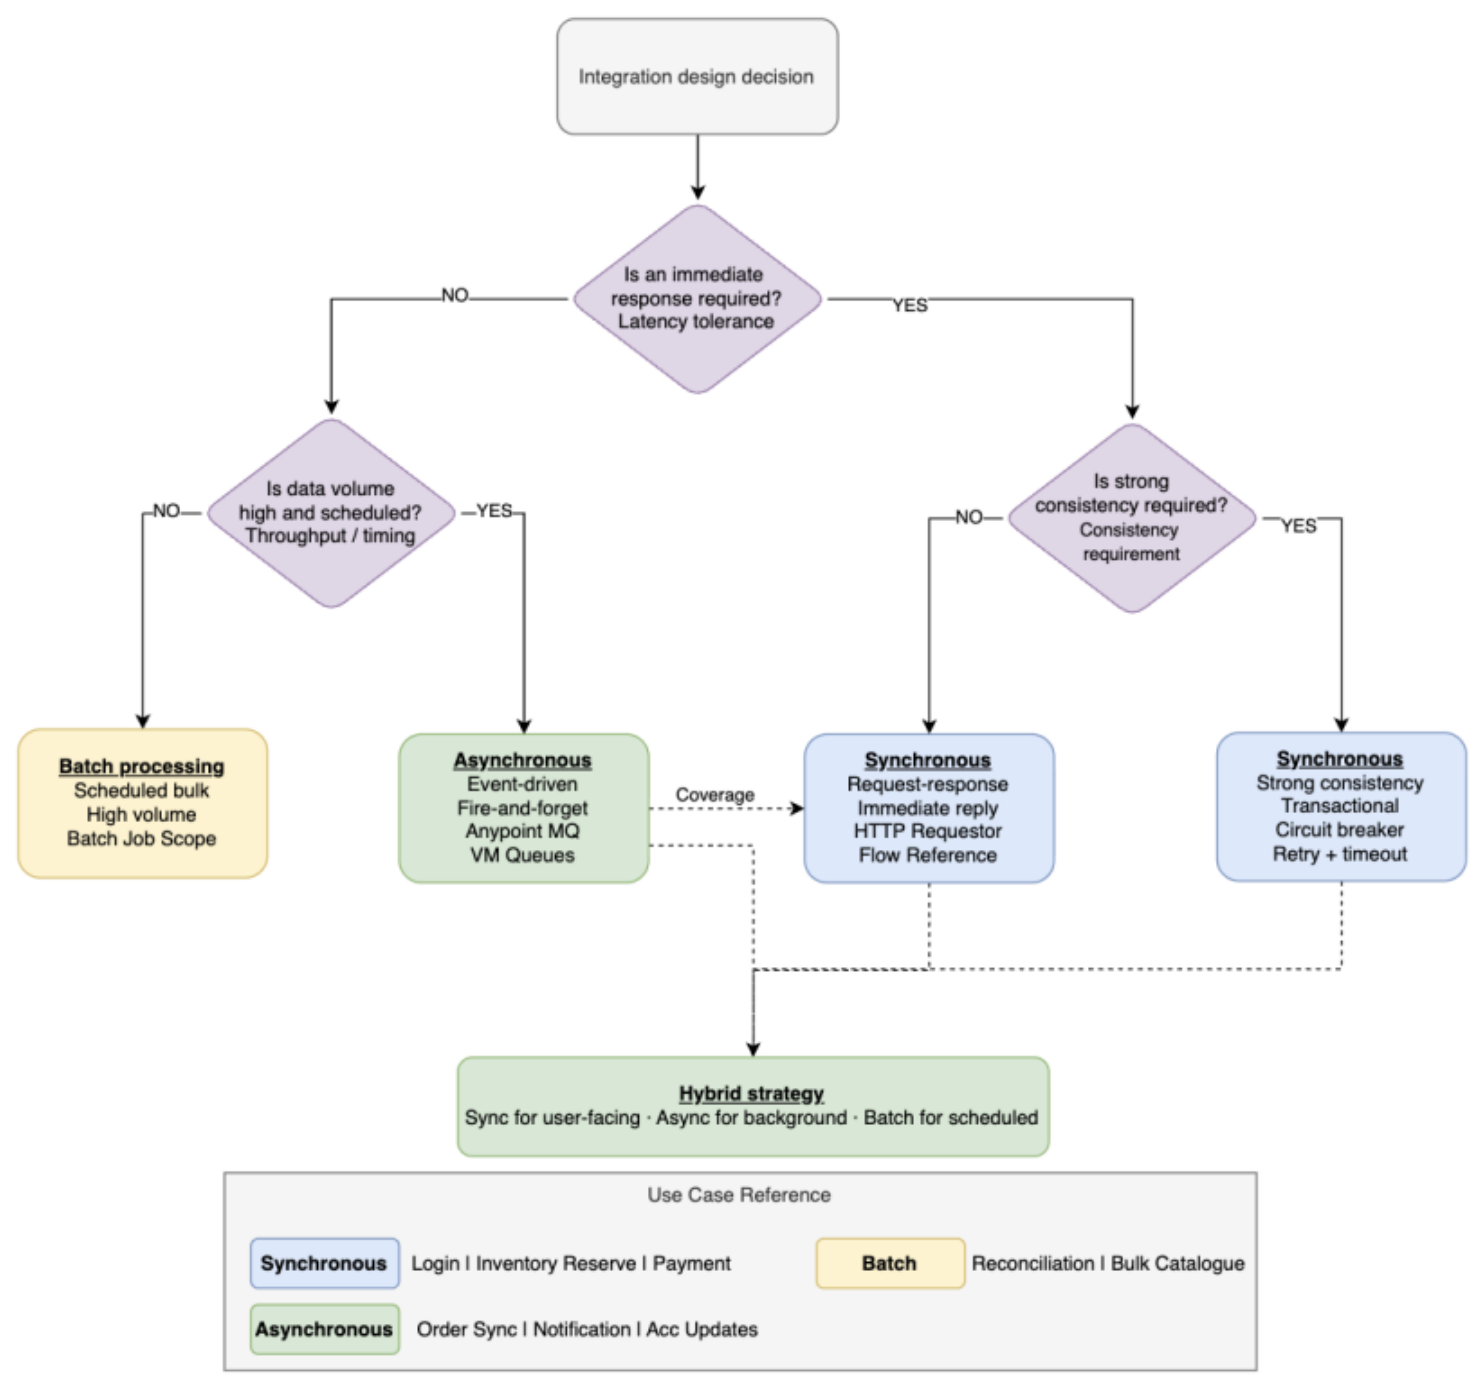
The comparison made in Table 3 should not be taken to indicate that any pattern is always better. Achieving synchronous orchestration at a 99.8 percent success rate, with a response time under 1.5 seconds is one thing but a massive leap from that to achieving all of this on a 0.2 vCore configuration processing over 4 million messages will surely need a lot of infrastructure to be built up! A base success rate of 98.2% with asynchronous orchestration means this approach makes commercial sense. However, it would be wrong for user-facing authentication where the user is waiting. The intention of this framework is the provide the practical use case which can be referenced by integration architects in the future to identify the classification of the integration, take the decision on synchronous/asynchronous integration pattern and choose the right architecture standard for any integration before deploying it to production. Operationalizing IT Integration Framework across a portfolio of integrations requires three organizational capabilities.
The first requirement is an API governance catalog that records the Dimension 1–3 classification for each flow at design time; without this, the classification is only in the heads of the individual architects and is lost on team turnover. Infrastructure of observability that can trace transactions across synchronous and asynchronous patterns.
Table 4.
Comparison test result.
| Architecture | Study | CPU Utilization | Success Rate | 95% CI (Success) | Transactions |
|---|---|---|---|---|---|
| Microservices (on-premises) | Fauziah & Surantha [6] | 8.65–16.84% | 98.58% | [98.51%, 98.65%] | ~3M/month |
| API-led Synchronous (CloudHub 2.0) | This study | <5% | 99.80% | [99.797%, 99.803%] | 10M+ login transactions |
| API-led Asynchronous (CloudHub 2.0) | This study | <25% | 98.20% | [98.186%, 98.214%] | 4M+ order history messages |
| API-led Async (post-retry) | This study | <25% | 98.90% | 98.90% | 4M+ order history |
4.7. Platform-Agnostic Applicability of the Framework
A great question about the multiple different study in the field of iPaaS deployment is whether the key findings will go far away for others to take advantage of. The Mulesoft data in Section 4 reflects that the runtime behavior of Mulesoft Anypoint Cloudhub is not a ordinary or generic cloud integration environment. Three-dimensional framework is not associated to any platform's implementation details. The three dimensional - latency tolerance, consistency requirement and failure mode preference are not considered to be part of platform execution. This section demonstrates that mapping by walking through how each dimension translates to the equivalent constructs in Azure Integration Services and AWS EventBridge.
The latency tolerance dimension maps to the trigger type in Azure Logic Apps: HTTP triggers execute synchronously (request-response), while Service Bus triggers execute asynchronously (fire-and-forget, consumer-paced). The equivalent choice in AWS is the Lambda invocation model: RequestResponse for synchronous blocking invocation, Event for asynchronous non-blocking. An integration architect using either platform faces exactly the same Dimension 1 question — will the initiating system wait, or can it proceed immediately? — and makes it by selecting the corresponding trigger or invocation type.
The dimension of consistency maps to the Azure Service Bus queue configuration. Organizations could create session-enabled queues to maintain the strict ordering of messages and to ensure only a single delivery of the message. On the other hand, basic AMQ provides a best-effort ordering. In AWS, you get to choose between the SQS FIFO queues (exactly-once, ordered) and SQS standard queues (at-least-once, best-effort). An option for FIFO queues is available on Anypoint MQ. Likewise, standard queues are also available. How much consistency does this interaction actually need? Is same on all the three platforms.
Every iPaaS Platform exposes the failure mode preference dimension map to retry and dead-letter configuration. What two features can you use to build a graceful degradation path? The DLQ configurations of AWS EventBridge work the same as Lambda's on-failure routing The MuleSoft implementation examined in this work utilizes the two key features identified in §3, namely, Anypoint MQ’s Circuit Breaker configuration and DLQ subscriber.
A condense form of this mapping is given in Table 5. It is not intended to imply that the behavior will be identical across platforms. The latency and throughput characteristics will be different. The aim is to illustrate the direct structural counterparts between each platform and the framework’s three decision dimensions. As a result, a team moving from a MuleSoft implementation to Azure IS or AWS can apply the same classification logic without new formulation of the framework.
Figure 12.
Hybrid orchestration selection framework: a three-dimensional decision model for API-led integration pattern selection based on latency tolerance, throughput requirements, and consistency guarantees.
Figure 12.
Hybrid orchestration selection framework: a three-dimensional decision model for API-led integration pattern selection based on latency tolerance, throughput requirements, and consistency guarantees.
5. Threats to Validity
This study represents the data based on a single production deployment environment on Mulesoft Anypoint Cloudhub and practitioners should still consider 3 important limitations before applying these findings. To start with, the data collected and presented in this paper is based on data captured by Mulesoft Anypoint Platform. The architectural principles of API-led connectivity and orchestration that we explored in the previous section can be applied to enterprise integration platforms in general. However, specific implementation decisions like to use VM queues or Anypoint MQ, how batch job works and whether other iPaaS providers provide the same functionality with any added advantage.
Second, regarding data provenance: all the metrics like performance, CPU usage, success/failure messages, number of threads are based on the actual production data rather than produced using controlled experimentation or studies, and the data is also not generated using the Load generator tools like jMeter or Load runner. These figures are presented as directionally indicative rather than statistically validated.
Third, regarding deployment context generalizability: the enterprise case study is only performed from a single healthcare industry data and taken from a single fortune 500 organization integration platform deployed on Anypoint Cloudhub. Integrations decision in different other sections like financial services, retail, manufacturing, eCommerce, Banking may show different behavior, and some alteration may need to these patterns based on the different data points. Multi-sector evaluation may add additional value to find the standardized industry-wise integration patterns.
6. Conclusions
One of the most importance decision/role of an Integration architect in an organization is the correct choice of design pattern for Integration layer. The selection of Synchronous or Asynchronous design pattern can directly impact the system performance, fault tolerance, infrastructure cost and also capability of how enterprise can adapt the recent market changes and how quickly it can be implemented.
The very critical decision for any organization is to design Synchronous integration and to implement the pattern for customer facing API integration with optimal error handling and fast processing with consistency. This is a right choice for the user facing interfaces which need immediate response for user requests. But careful analysis is needed before designing Synchronous integration as it may lead to thread exhaustion, dead-locks, high resource utilization, ability of an application to multi-task. Any wrong move may lead to lot of integration chokepoints for the overall integration ecosystem.
On the other hand, Asynchronous integration pattern allows fault tolerance, high throughput and decoupling of producers and consumers using different synchronous chains and this can be achieved using persistent message brokers. It also provides high efficiency, less idle processing time, thread overhead which leads to qualitative structural gains under high transaction volume with putting a lot of stress to the system.
The hybrid approach of designing integration framework present in this paper shows very structured data around latency tolerance, consistency requirement and success/failure rate which allows integration architects a very good, context aware basis for selection of integration pattern that addresses all the platform issues. Integration pattern shown in Section 4 of this paper considering the healthcare distribution deployment model help integration architects to take better infrastructure decisions which are economical, robust and reusable compared to other point-to-point integrations.
To summarize, the shift from monolithic to micro-services architecture has resulted in observable improvements in maintainability, scalability, and performance while maintaining security compliance. Results shown in this paper suggest that micro-services is a good architecture option that can be used for any enterprises which deal with eCommerce business modal. Future studies should focus on hybrid cloud deployment model which can minimize latency with a lower cost and advanced fault-tolerance for better and error-free integration system. Additionally, the introduction of AI-enhanced integration governance is worth in-depth research. Large language models that can be used to generate API specifications, conduct flow analysis, and detect anomalies are a recent research topic whose practical impacts on integration platform management are yet to be well defined.
Generative AI and AI-Assisted Technologies Disclosure: The author used a generative AI assistant to assist with the draft structuring of Related Work section during the preparation of this manuscript. All technical content, production deployment data, analytical conclusions, the three-dimensional decision framework, and all claims in Section 3, Section 4, Section 5 and Section 6 were developed, verified, and written entirely by the author. The AI tool was not used to generate experimental data, performance metrics, or original technical contributions.
Author Contributions
V.G. conceptualized the study framework; V.G. conducted the systematic comparative analysis; V.G. designed the enterprise case study protocol and collected deployment evidence; V.G. prepared the original draft; V.G. reviewed and approved the final version. The author has read and agreed to the published version of the manuscript.
Funding
This research received no external funding.
Data Availability Statement
The industry-reported performance benchmarks cited in this study are available from the sources referenced in the bibliography. Enterprise deployment data used in the case study (Section 4) were collected during professional practice and have been anonymized per client agreement. Anonymized data supporting this study's findings are available from the corresponding author upon reasonable request.
Conflicts of Interest
The author is employed by Deloitte Consulting LLP, which uses the MuleSoft Anypoint Platform in client engagement delivery. The Connectivity Benchmark Report cited in this paper [1] is published by Salesforce, Inc./MuleSoft. The author declares no financial or personal conflict of interest with respect to the research, authorship, or publication of this article. The views expressed are those of the author and do not represent the views of Deloitte Consulting LLP or its clients.
Abbreviations:
The following abbreviations are used in this manuscript:
ACK Acknowledge
API Application Programming Interface
CI/CD Continuous Integration/Continuous Delivery
DLQ Dead Letter Queue
EAI Enterprise Application Integration
ELK Elasticsearch, Logstash, Kibana
ESB Enterprise Service Bus
ERP Enterprise Resource Planning
HTTP Hypertext Transfer Protocol
iPaaS Integration Platform as a Service
IoT Internet of Things
LLM Large Language Model
MQ Message Queue
NACK Negative Acknowledge
REST Representational State Transfer
SOA Service-Oriented Architecture
TCO Total Cost of Ownership
VM Virtual Machine (in context of VM Queues).
References
- MuleSoft. Connectivity Benchmark Report; Salesforce: San Francisco, CA, USA, 2024; Available online: https://www.mulesoft.com/resources/research/connectivity-benchmark.
- MuleSoft. API-Led Connectivity: A New Way of Building Applications; Salesforce: San Francisco, CA, USA, 2023; Available online: https://www.mulesoft.com/resources/api/api-led-connectivity.
- Hohpe, G.; Woolf, B. Enterprise Integration Patterns: Designing, Building, and Deploying Messaging Solutions; Addison-Wesley: Boston, MA, USA, 2003. [Google Scholar]
- Josuttis, N.M. SOA in Practice: The Art of Distributed System Design; O'Reilly Media: Sebastopol, CA, USA, 2007. [Google Scholar]
- Newman, S. Building Microservices: Designing Fine-Grained Systems; O'Reilly Media: Sebastopol, CA, USA, 2015. [Google Scholar]
- Fauziah, R.; Surantha, N. Evaluating Middleware Performance in the Transition from Monolithic to Microservices Architecture for Banking Applications. Electronics 2026, 15, 221. [Google Scholar] [CrossRef]
- Choi, H.-J.; Kim, J.-H.; Lee, J.-H.; Han, J.-Y.; Kim, W.-S. Adaptive Microservice Architecture and Service Orchestration Considering Resource Balance to Support Multi-User Cloud VR. Electronics 2025, 14, 1249. [Google Scholar] [CrossRef]
- Aldea, C.L.; Bocu, R. Authentication Challenges and Solutions in Microservice Architectures. Appl. Sci. 2025, 15, 12088. [Google Scholar] [CrossRef]
- Abdelfattah, A.S.; Cerny, T.; Salazar, J.Y.; Li, X.; Taibi, D.; Song, E. Assessing Evolution of Microservices Using Static Analysis. Appl. Sci. 2024, 14, 10725. [Google Scholar] [CrossRef]
- Lazar, K.; Vetzler, M.; Uziel, G.; Boaz, D.; Goldbraich, E.; Amid, D.; Anaby-Tavor, A. SpeCrawler: Generating OpenAPI Specifications from API Documentation Using Large Language Models. arXiv 2024, arXiv:2402.11625. [Google Scholar]
- Daunis, I. A Declarative Language for Building and Orchestrating LLM-Powered Agent Workflows. arXiv 2025, arXiv:2512.19769. [Google Scholar]
- Almutairi, M.; Sheldon, F.T. IoT–Cloud Integration Security: A Survey. Electronics 2025, 14, 1394. [Google Scholar] [CrossRef]
- Chy, M.S.H.; Arju, M.A.R.; Tella, S.M.; Cerny, T. Comparative Evaluation of JVM-Based Message Queue Services: Kafka, Artemis, Pulsar, and RocketMQ. Electronics 2023, 12, 4792. [Google Scholar] [CrossRef]
- Blinowski, G.J.; Ojdowska, A.; Przybyłek, A. Monolithic vs. Microservice Architecture: A Performance and Scalability Evaluation. IEEE Access 2022, 10, 20357–20374. [Google Scholar] [CrossRef]
- Maharjan, R.; Chy, M.S.H.; Arju, M.A.; Cerny, T. Benchmarking Message Queues. Telecom 2023, 4, 298–312. [Google Scholar] [CrossRef]
- Weerasinghe, S.; Perera, I. Optimized Strategy in Cloud-Native Environment for Inter-Service Communication in Microservices. iJOE 2024, 20, 40–57. [Google Scholar] [CrossRef]
- Cabane, H.; Farias, K. On the impact of event-driven architecture on performance: An exploratory study. Future Gener. Comput. Syst. 2024, 153, 52–69. [Google Scholar] [CrossRef]
- Weerasinghe, S.; Perera, I. Optimized Strategy for Inter-Service Communication in Microservices. IJACSA 2023, 14(2). [Google Scholar] [CrossRef]
- Cerny, T.; Donahoo, M.J.; Trnka, M. Contextual understanding of microservice architecture. ACM SIGAPP Appl. Comput. Rev. 2018, 17, 29–45. [Google Scholar] [CrossRef]
- Jamshidi, P.; Pahl, C.; Mendonça, N.C. Microservices: The journey so far and challenges ahead. IEEE Softw. 2018, 35, 24–35. [Google Scholar] [CrossRef]
- Di Francesco, P.; Lago, P.; Malavolta, I. Migrating towards microservice architectures: An industrial survey. Proc. IEEE ICSA, Seattle; 2018; pp. 29–2909. [Google Scholar]
- Heinrich, R.; et al. Performance engineering for microservices: Research challenges and directions. Proc. ICPE, 2017; pp. 223–226. [Google Scholar]
- Kleppmann, M. Designing Data-Intensive Applications; O'Reilly: Sebastopol, CA, USA, 2017. [Google Scholar]
- Dragoni, N.; et al. Microservices: Yesterday, today, and tomorrow. Present Orient. Fut. Softw. Eng. 2017, 195–216. [Google Scholar] [CrossRef]
- Richardson, C. Microservices Patterns; Manning: Shelter Island, NY, USA, 2018. [Google Scholar]
- Taibi, D.; Lenarduzzi, V.; Pahl, C. Processes, motivations, and issues for migrating to microservices. IEEE Cloud Comput. 2017, 4, 22–32. [Google Scholar] [CrossRef]
- Soldani, J.; et al. The pains and gains of microservices: A systematic grey literature review. J. Syst. Softw. 2018, 146, 215–232. [Google Scholar] [CrossRef]
- Sridharan, C. Distributed Systems Observability; O'Reilly: Sebastopol, CA, USA, 2018. [Google Scholar]
- Fowler, M. Patterns of Enterprise Application Architecture; Addison-Wesley: Boston, MA, USA, 2002. [Google Scholar]
- Burns, B.; Beda, J.; Hightower, K. Kubernetes: Up and Running; O'Reilly: Sebastopol, CA, USA, 2019. [Google Scholar]
Figure 1.
Total number of messages processed in 30 days using different channels.
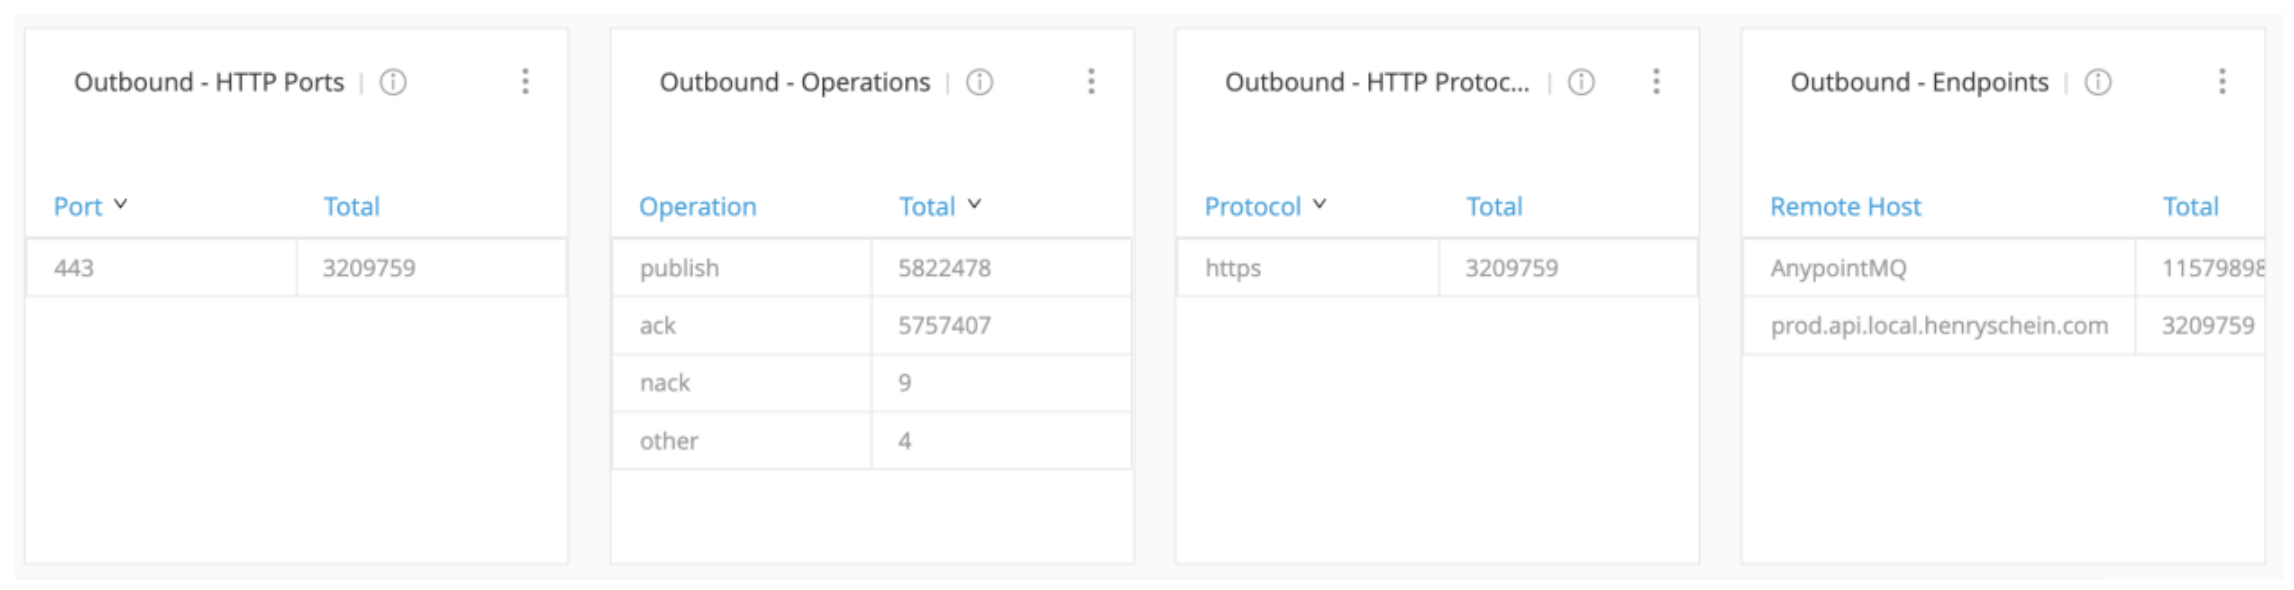
Figure 2.
CPU utilization, Heap used and Thread Counts with 0.2 x 3 vCores.
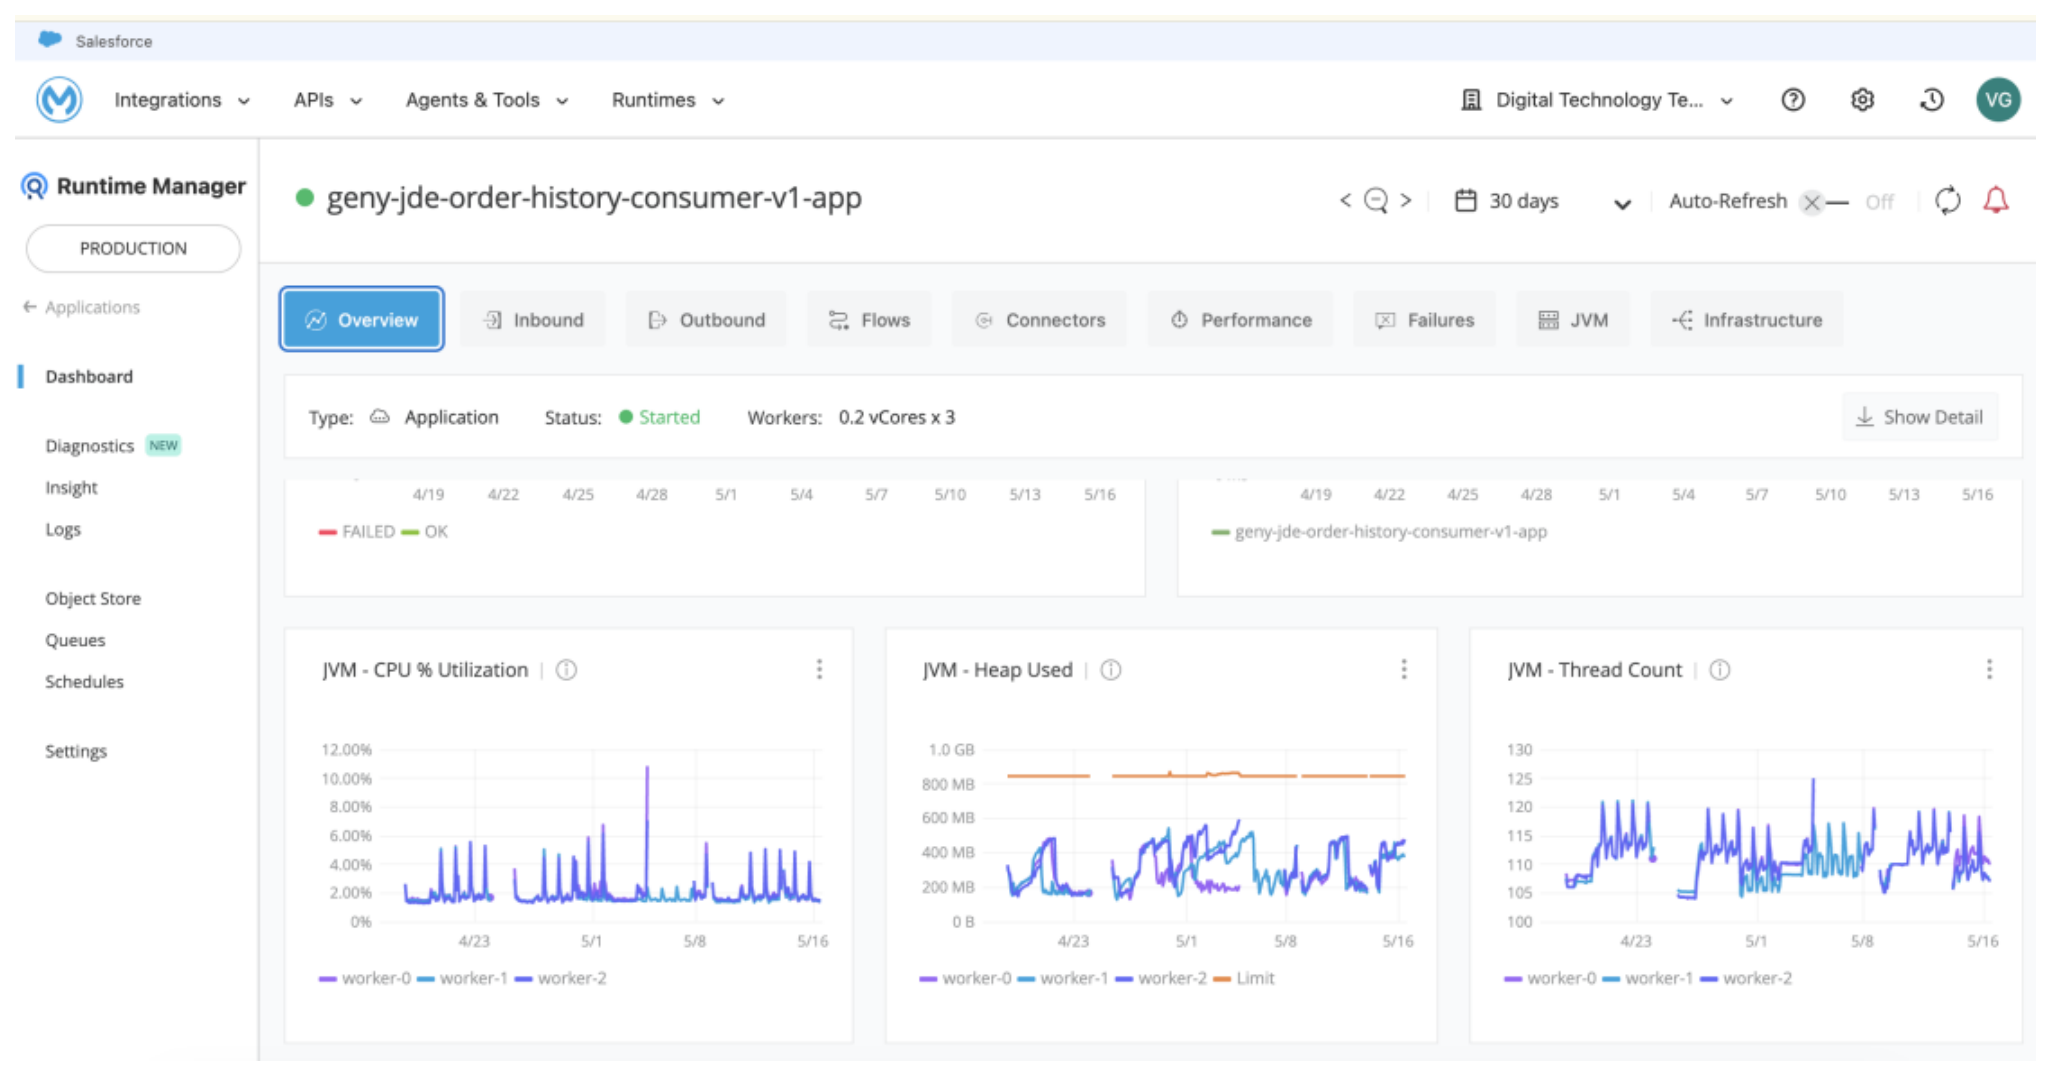
Figure 3.
Number of order messages/transactions at Healthcare Client A (anonymized per client agreement) Client.
Figure 3.
Number of order messages/transactions at Healthcare Client A (anonymized per client agreement) Client.
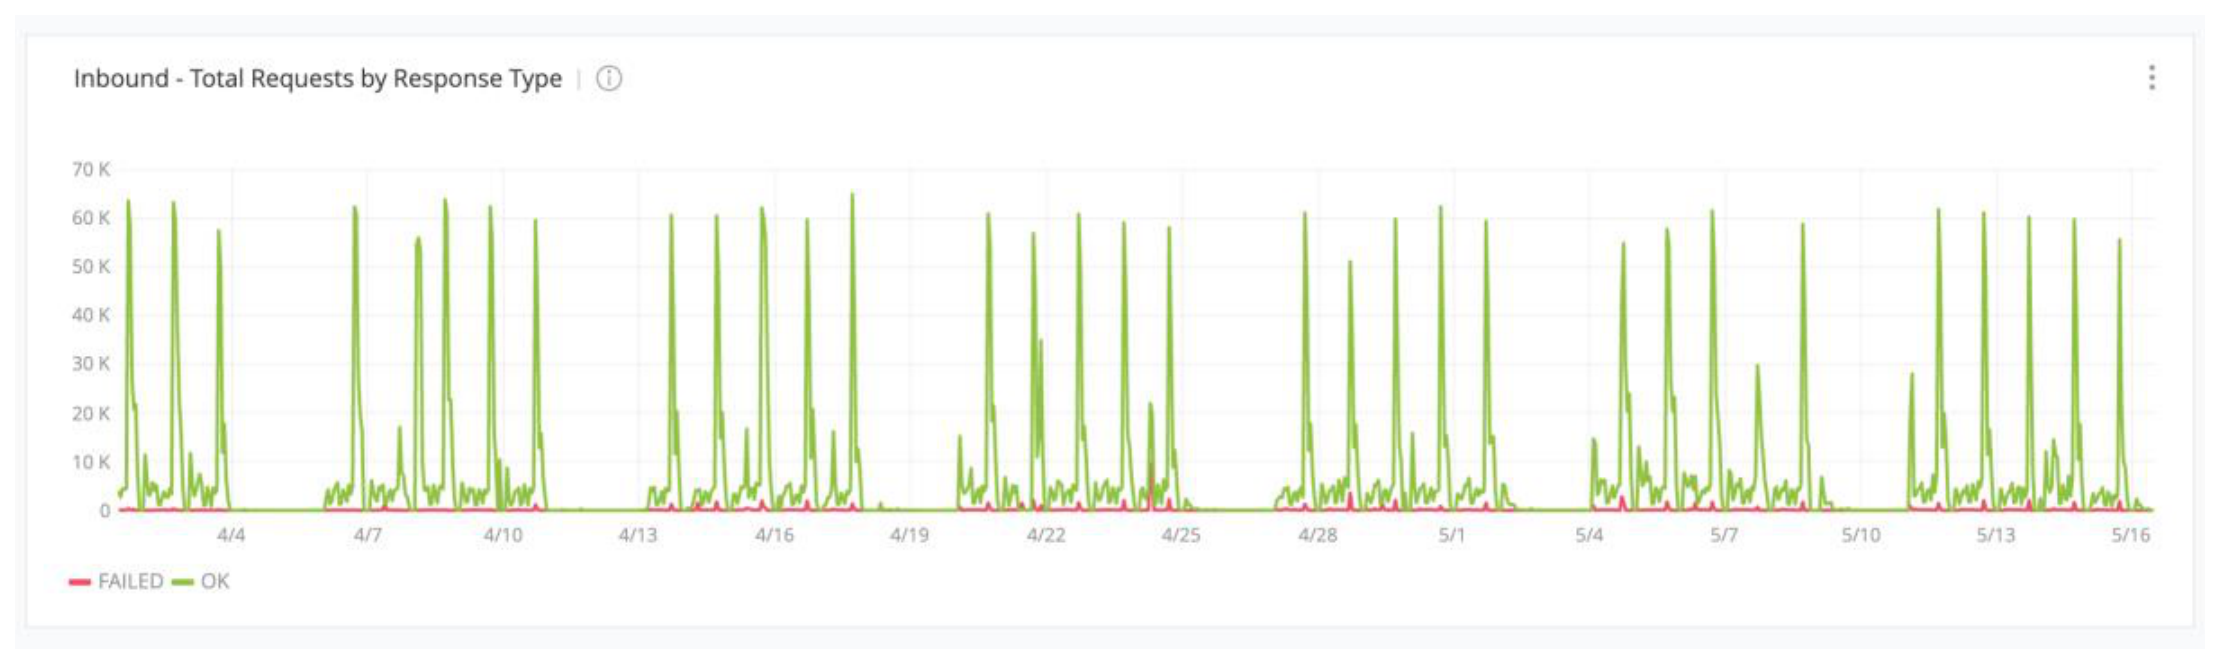
Figure 4.
Synchronous API Integration Pattern: Real-Time Inventory Update from E-Commerce Front End to Backend ERP System.
Figure 4.
Synchronous API Integration Pattern: Real-Time Inventory Update from E-Commerce Front End to Backend ERP System.
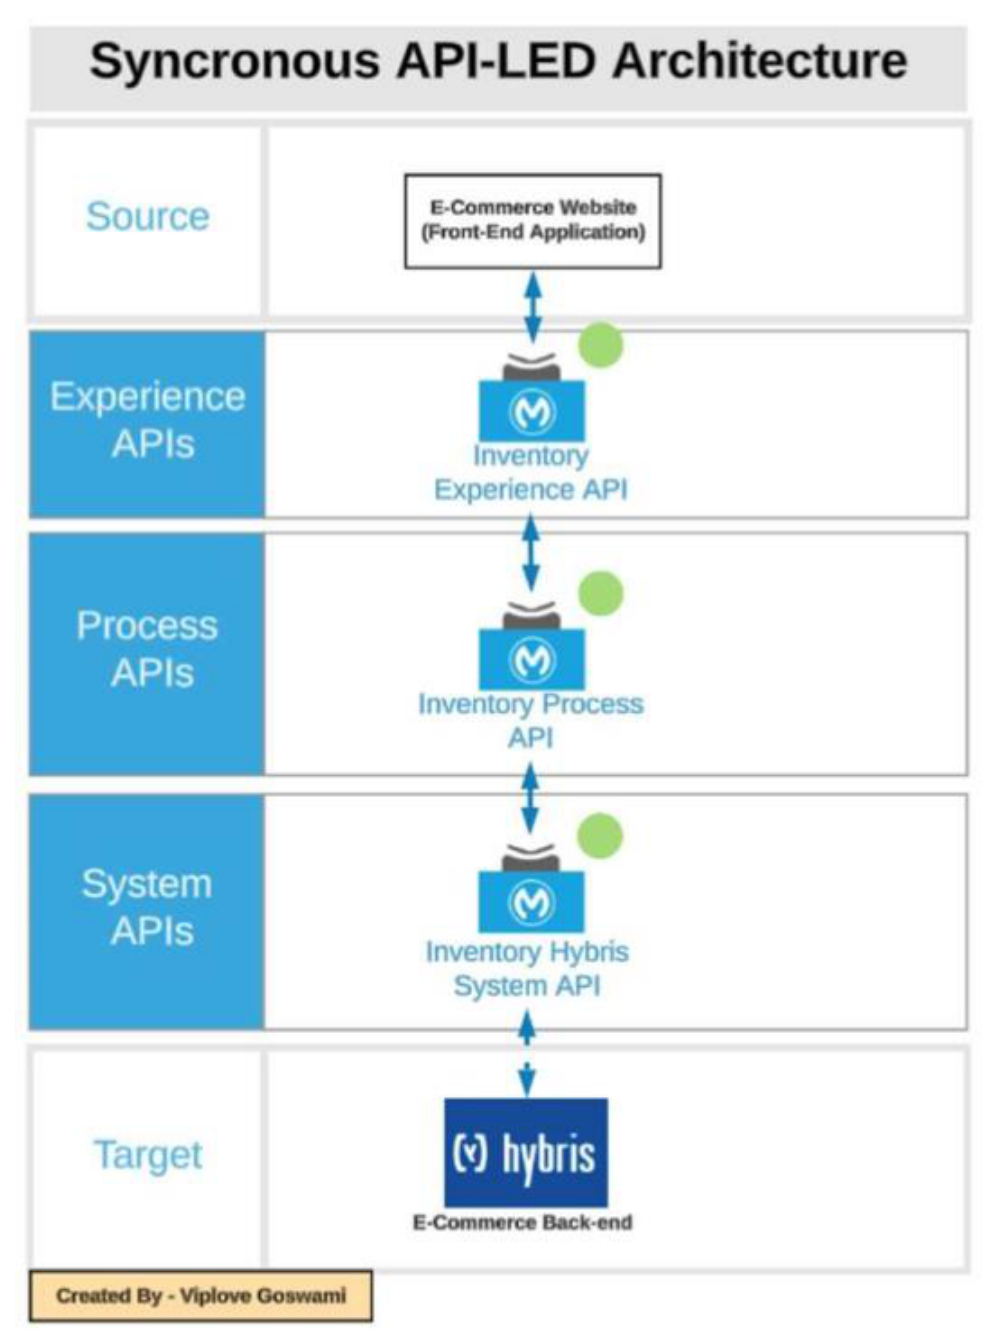
Figure 5.
Asynchronous API Integration Pattern: Event-Driven Account Update Synchronization to ERP System.
Figure 5.
Asynchronous API Integration Pattern: Event-Driven Account Update Synchronization to ERP System.
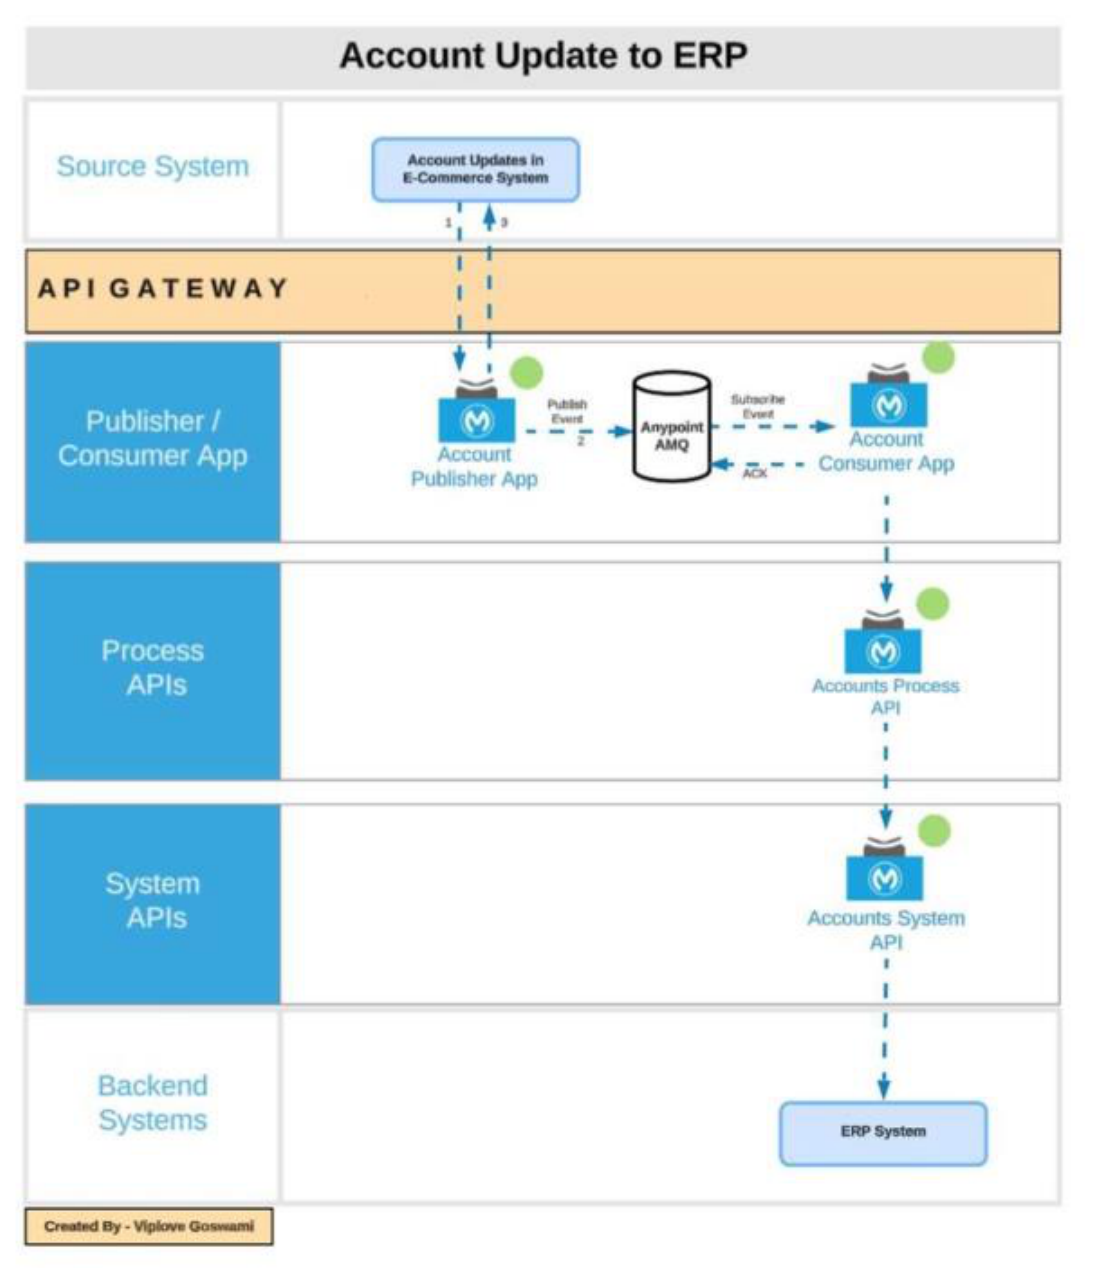
Figure 6.
Total number of order history messages processed.
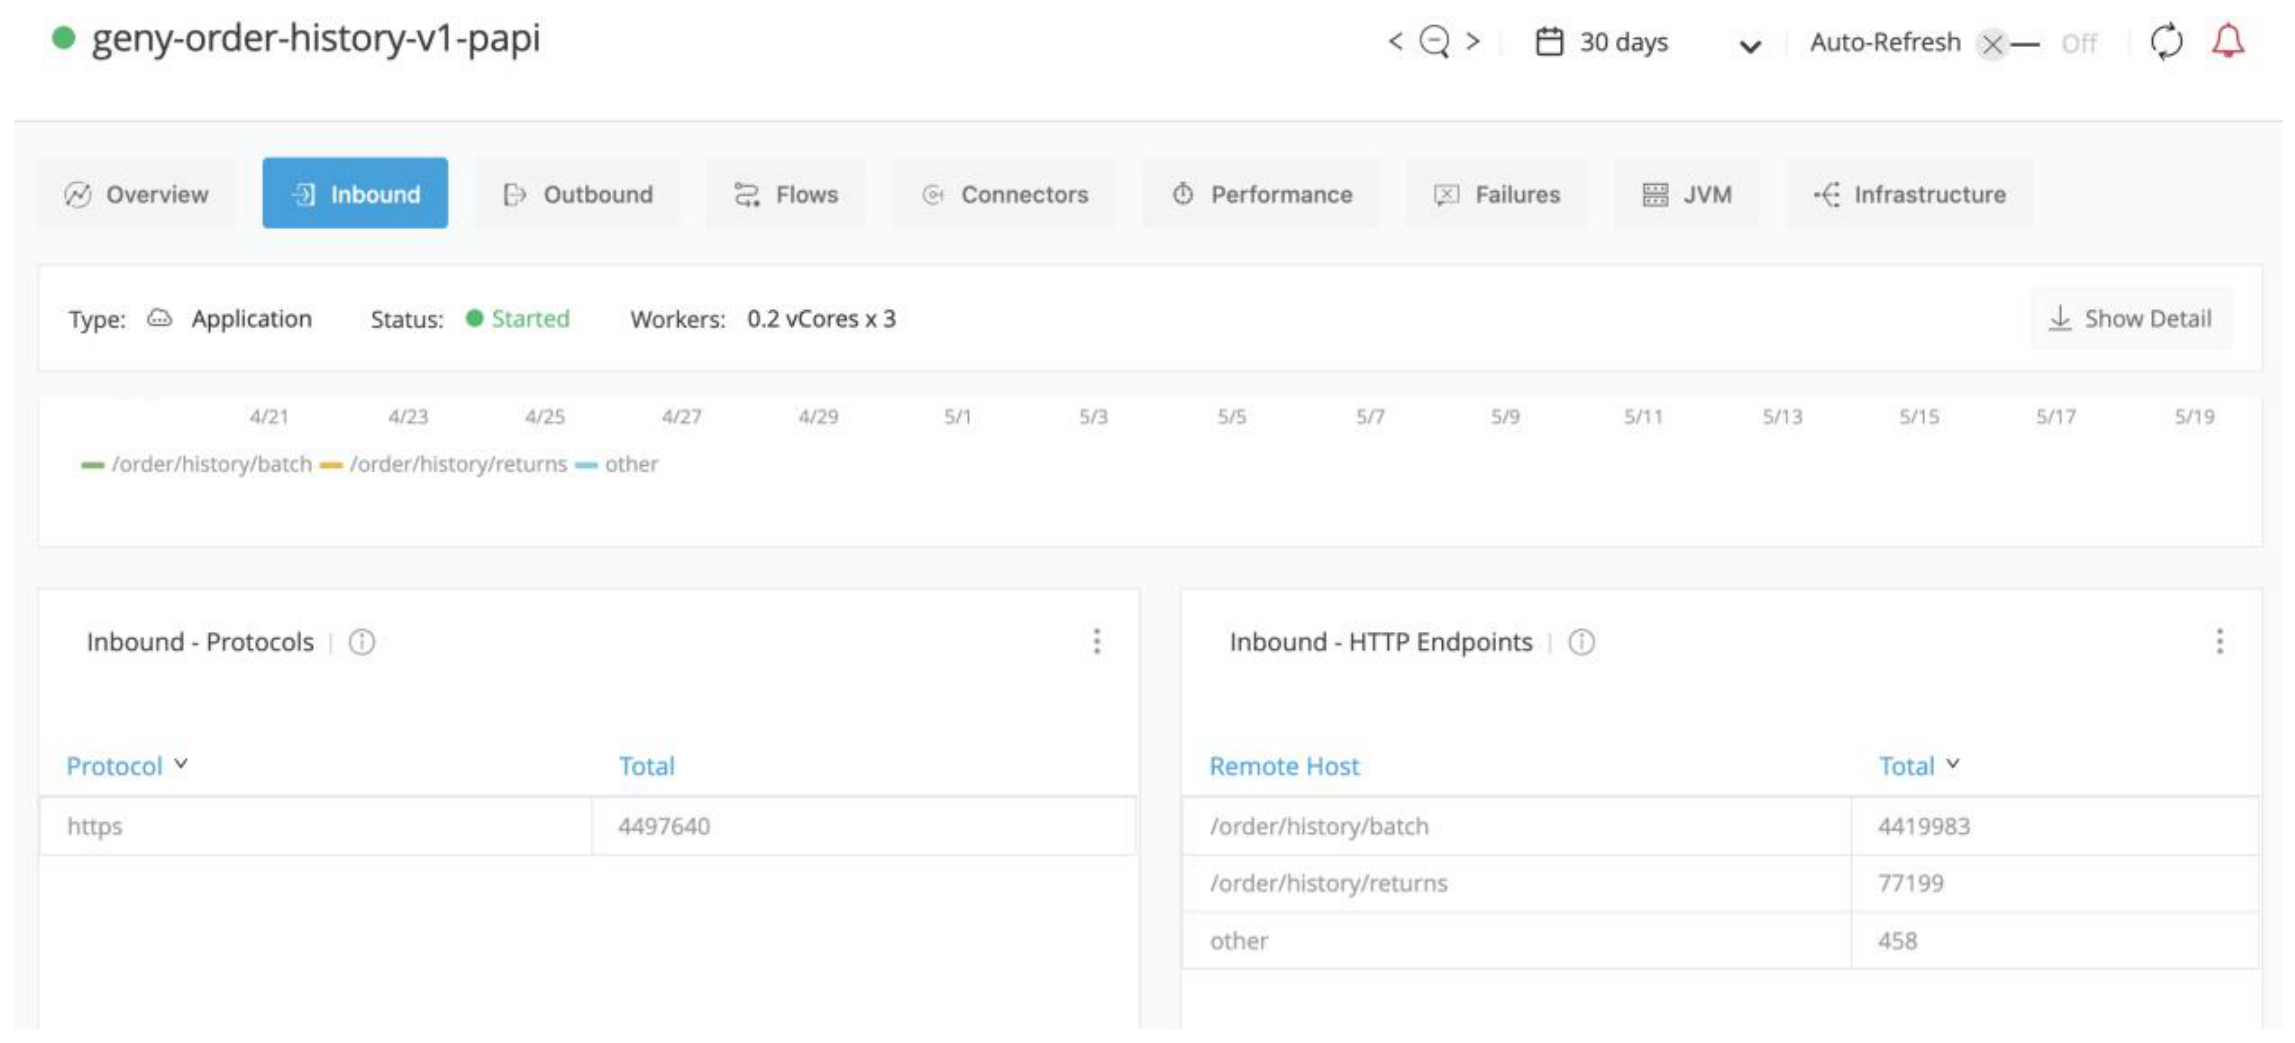
Figure 7.
Total number of login transactions processed.
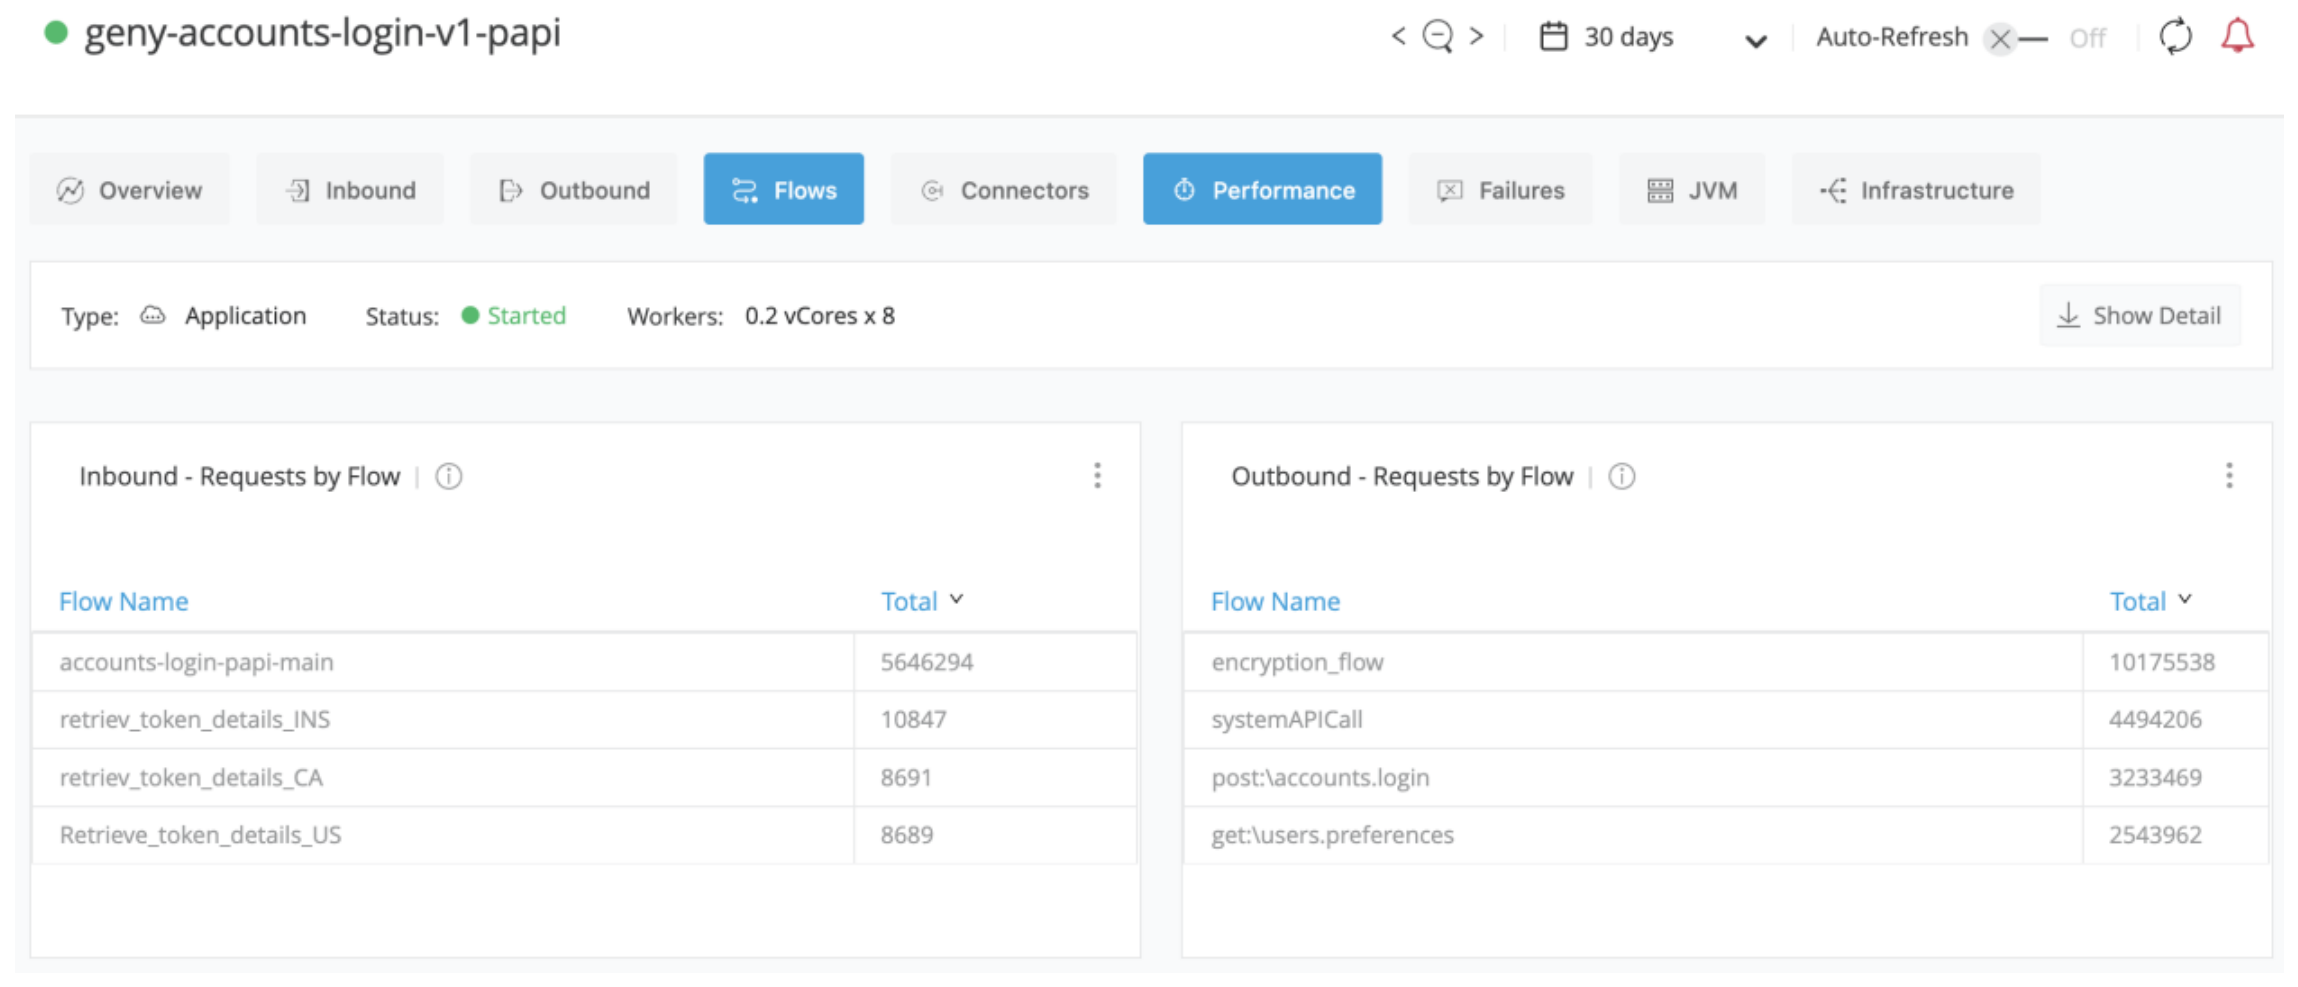
Figure 8.
Average response time of order history messages.
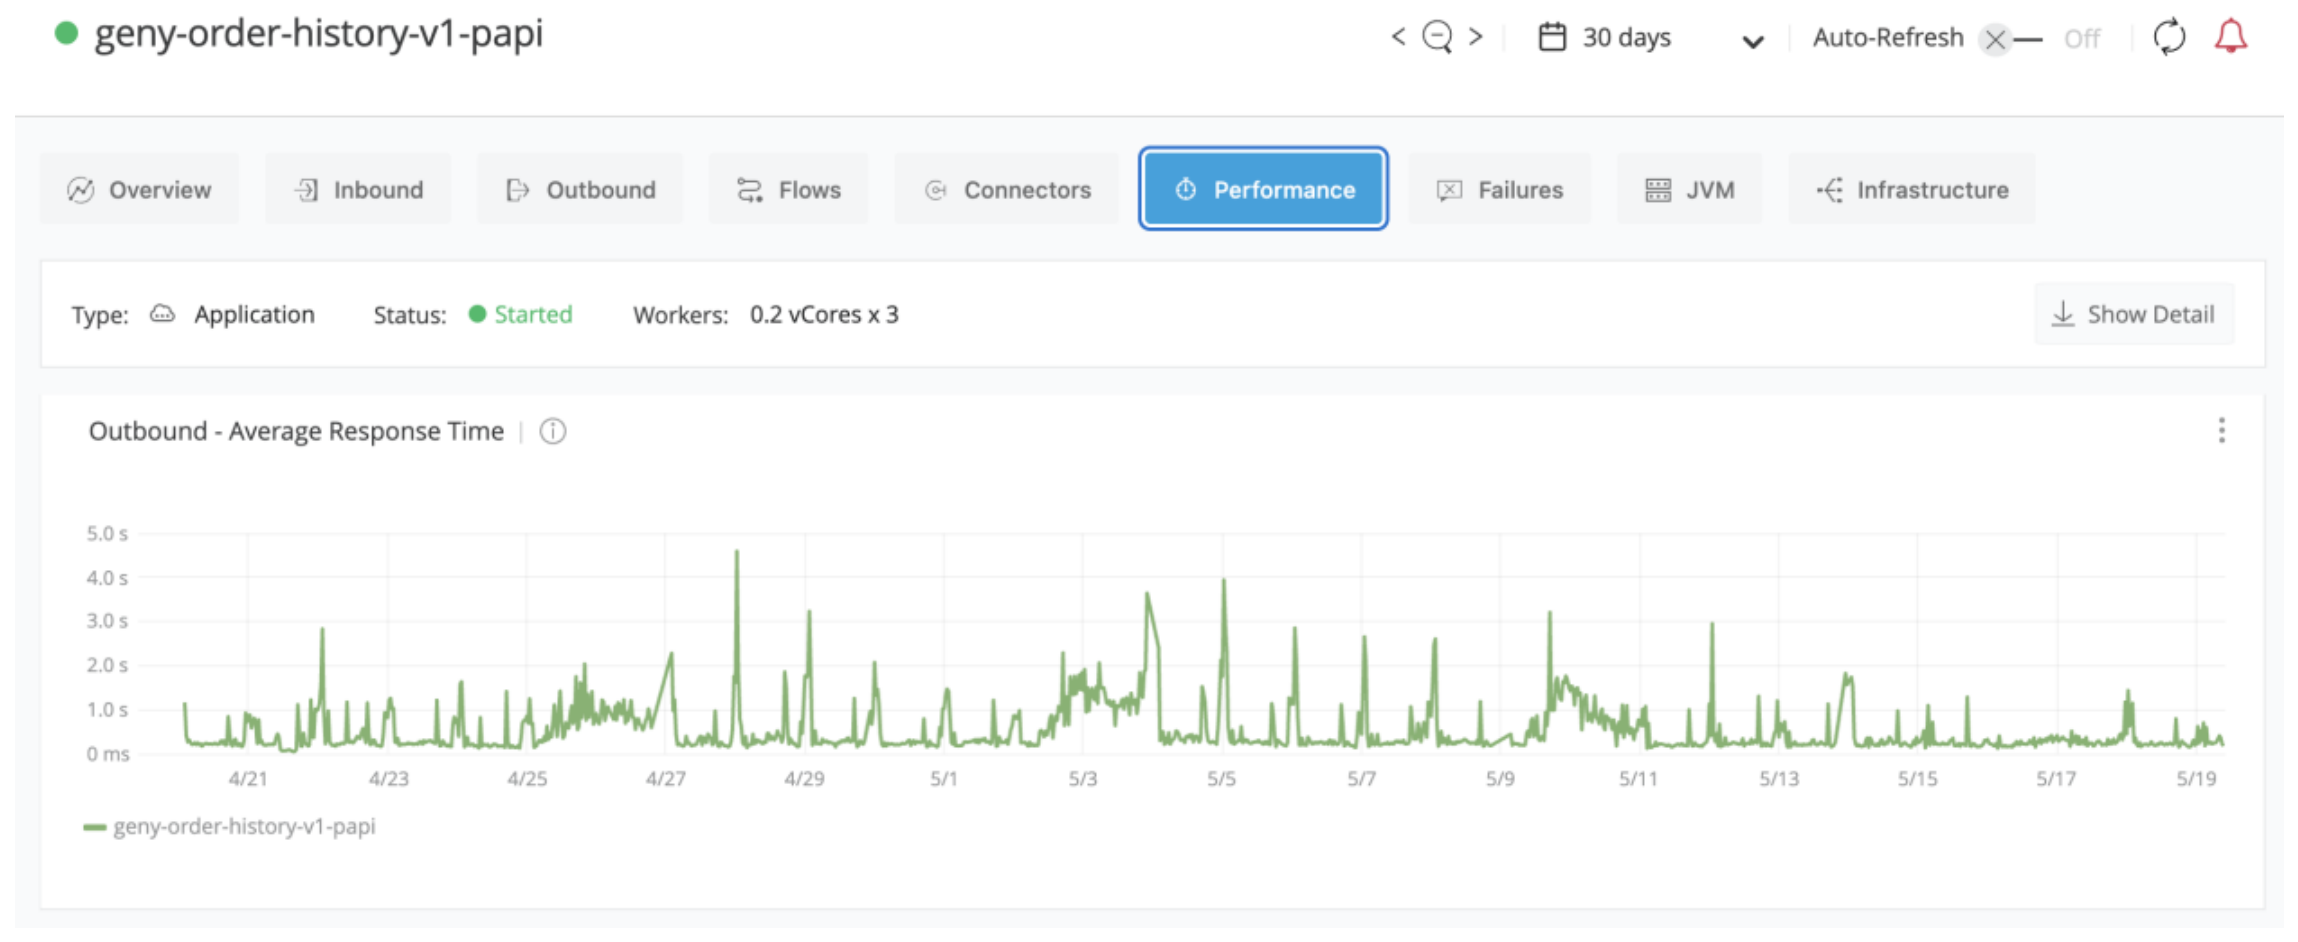
Figure 9.
Average response time of login messages.
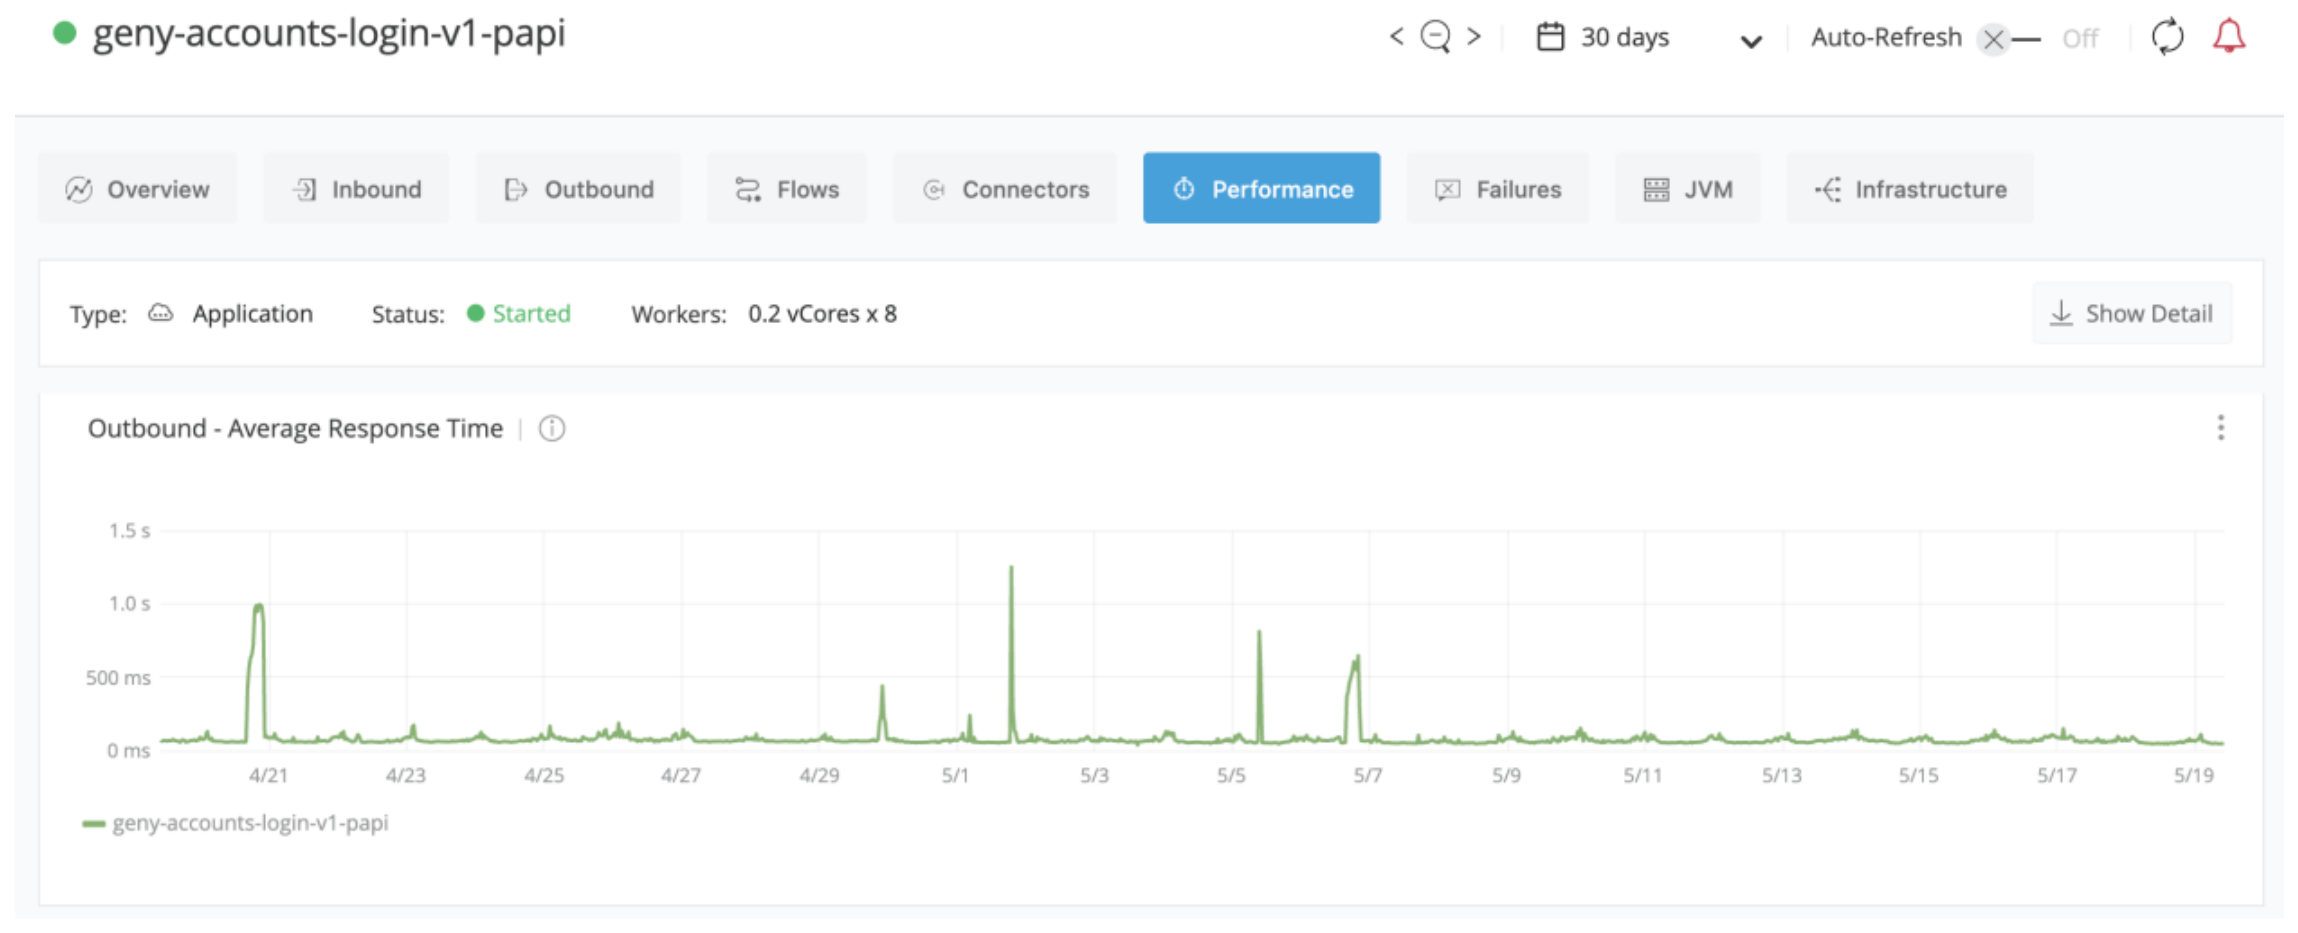
Table 2.
Measurement Parameters.
| Parameter | Information |
|---|---|
| CPU & Memory Utilization | By using correct combination of vCores and workers on Anypoint CloudHub. |
| Number of Instances | Instance represents as worker on Anypoint CloudHub for each application. 2 workers are recommended to support normal traffic. |
| Success & Error Rate | Comparison of total transactions, success transaction (status = 200) and failed transactions (status ≠ 200). |
| Time to Recovery | The time it takes for an application to recover after going down. |
Table 3.
Orchestration Pattern Comparison Matrix.
| Dimension | Synchronous | Asynchronous | Recommended Use Case |
|---|---|---|---|
| Execution Model | Blocking; caller waits for response | Non-blocking; fire-and-forget | User-facing CRUD ops | Event-driven pipelines | Nightly data loads |
| Latency | Low (immediate response) | Higher (eventual consistency) | Real-time UX | Background workflows | Large data migrations |
| Throughput | Limited by thread pool | High; decoupled producer/consumer | Low-volume critical | High-volume streaming | Massive datasets |
| Fault Isolation | Tight coupling; failure propagates | Strong; DLQs isolate failures | Simple systems | Resilient distributed | Long-running ETL |
| Debugging | Straightforward; linear stack trace | Complex; non-deterministic events | Rapid prototypes | Mature DevOps orgs | Ops teams with tooling |
| Resource Cost | High (vCore-intensive) | Lower (queue buffering) | Critical transactions | Cost-sensitive scale | Scheduled reporting |
| MuleSoft Pattern | HTTP Requestor / Flow Reference | Anypoint MQ / VM Queues | Experience → Process → System | PubSub | Scheduled Batch |
Table 5.
Integration mapping comparison.
| Framework Dimension |
MuleSoft Anypoint | Azure Integration Services | AWS |
|---|---|---|---|
| Latency tolerance | HTTP Request/Reply vs. Anypoint MQ consumer | HTTP trigger vs. Service Bus trigger | Lambda RequestResponse vs. Event invocation |
| Consistency requirement | Anypoint MQ FIFO vs. standard queue | Service Bus sessions vs. basic queues | SQS FIFO vs. standard queues |
| Failure mode preference | Circuit Breaker + DLQ subscriber | API Management retry + Service Bus DLQ | EventBridge DLQ + Lambda on-failure destination |
Disclaimer/Publisher’s Note: The statements, opinions and data contained in all publications are solely those of the individual author(s) and contributor(s) and not of MDPI and/or the editor(s). MDPI and/or the editor(s) disclaim responsibility for any injury to people or property resulting from any ideas, methods, instructions or products referred to in the content. |
© 2026 by the authors. Licensee MDPI, Basel, Switzerland. This article is an open access article distributed under the terms and conditions of the Creative Commons Attribution (CC BY) license (http://creativecommons.org/licenses/by/4.0/).
Copyright: This open access article is published under a Creative Commons CC BY 4.0 license, which permit the free download, distribution, and reuse, provided that the author and preprint are cited in any reuse.


