

Submitted:
02 July 2026
Posted:
06 July 2026
You are already at the latest version
Abstract
Background/Objectives: This study examined whether adding 10 g of protein to a high glycaemic index (GI) breakfast could attenuate postprandial glycaemic responses in children and young people (CYP) with type 1 diabetes (T1D). Postprandial glucose responses following this modified breakfast were compared with those after a high GI breakfast alone, a low GI breakfast, and participants’ usual breakfast. Methods: A pragmatic randomised crossover study was conducted in n=25 CYP aged 5–17 years. Participants consumed three standardised test breakfasts on two study occasions and their usual breakfast as a control. Test meals varied by GI, glycaemic load (GL), and protein content: high GI/high GL (HGL), high GI/high GL with an additional 10 g protein (HGLP), and low GI/medium GL (MGL). Continuous glucose monitoring data were collected for three hours following each meal. Linear mixed model analyses were used, and a subgroup analysis included participants using hybrid closed-loop (HCL) systems. Results: Participants (mean age 12.1 ± 3.6 years) mean postprandial glucose over three hour follow-up was significantly lower following the HGLP meal compared with the HGL meal (8.0 ± 2.2 vs 9.5 ± 2.5 mmol/L; p < 0.01). Time in Range (TIR) over 180 minutes was significantly shorter after the HGL meal compared with the control, HGLP, and MGL meals (p ≤ 0.03). Glucose excursions at 30 and 60 minutes were significantly higher following the HGL meal compared with all other meals, with differences persisting up to 120 minutes when compared with the HGLP meal. Results were not different for participants using HCL systems. Conclusions: Adding 10 g of protein to a high GI breakfast or choosing a lower GI option improves postprandial glycaemic control in CYP with type 1 diabetes.
Keywords:
carbohydrate
; continuous glucose monitoring
; diabetes mellitus
; glycaemic control
; meal
; nutrition
; protein
1. Introduction
Carbohydrate is the primary macronutrient influencing postprandial glycaemia in T1D, and dietary management is underpinned by quantifying carbohydrate intake and matching insulin dosing accordingly [1]. However, even with accurate carbohydrate counting, postprandial hyperglycaemia remains common in CYP with T1D and is particularly pronounced after breakfast compared with other meals [2,3,4]. This exaggerated breakfast response is multifactorial, but is strongly influenced by the composition of commonly consumed breakfast foods [5].
Ready-to-eat breakfast cereals are widely consumed by CYP in the UK [6]. While these foods may contribute to fibre and micronutrient intake [7,8,9], many have a high glycaemic index (GI) and glycaemic load (GL) [10] and are associated with pronounced postprandial glucose excursions [11,12]. Substitution of high-GI foods with lower-GI alternatives is recommended within the International Society of Pediatric and Adolescent Diabetes (ISPAD) nutritional guidelines; more recently, these guidelines also suggest modifying breakfast meals prone to postprandial hyperglycaemia with the addition of protein [1].
Dietary protein has been shown to modify postprandial glycaemic responses in T1D [13,14,15] however, the ISPAD guidelines [1] do not specify the quantity of protein required to meaningfully alter the glucose response to breakfast, highlighting an important evidence gap. Moreover, research examining protein-mediated modulation of postprandial glycaemia in T1D has largely focused on high-fat and high-protein meals, where delayed hyperglycaemia and increased insulin requirements are observed [13,15,16,17,18]. Breakfast-specific responses, particularly in the context of high GI meals, remain under-investigated.
In adults without diabetes, the addition of 30 g protein to a high-GI breakfast has been shown to significantly reduce the GI of the meal [19]. In adults with T1D the addition of both protein and fat in the form of peanut butter to a high and low GI meal of equal macronutrient composition produced no significant difference in glycaemic response between meals, suggesting the protein and or fat altered the GI of the meal [20]. Protein intakes of 22 g consumed at breakfast 15 minutes before a carbohydrate containing meal have been shown to attenuate early postprandial glucose rises, although short monitoring periods limit conclusions regarding delayed hyperglycaemia [21]. Studies employing longer postprandial observation periods, including those involving CYP with T1D, suggest that small-to-moderate protein intakes (≤28 g) consumed alongside carbohydrate can attenuate early glycaemic excursions without inducing late hyperglycaemia [13,14,22]. In contrast, larger protein loads (>40 g) have been associated with delayed hyperglycaemia several hours after ingestion [13,14,22,23,24].
Notably, studies examining protein addition at breakfast have not included high GI/GL breakfast cereal meals, despite their widespread consumption. In our previous research, CYP with T1D were observed to consume a wide variety in breakfast choices, with cereal-based meals the most frequent choice of food [25]. These meals were characterised by high GI and GL values and were associated with the largest postprandial glucose excursions. In contrast, breakfasts containing a protein-rich food were associated with significantly lower glycaemic responses. The mean difference in protein intake between meals with or without a protein rich food was 10.6 g (95% CI [9.1, 12.1], and had a total protein intake of 20.2 ± 9.3 g, a quantity that would be unlikely to provoke late postprandial hyperglycaemia [25].
Dietary interventions pose substantial logistical and acceptability challenges, often resulting in poorer recruitment and adherence than pharmaceutical trials. These challenges are amplified in paediatric populations, with children and young people (CYP) being under-represented in clinical trials [26], particularly for those living with a chronic condition such as type 1 diabetes (T1D). Low recruitment and retention rates are widely reported across paediatric randomised controlled trials (RCT), including trials in asthma [27], cancer [28], and T1D [29]. In T1D specifically, increased study complexity, older age, poorer baseline glycaemic control, and lower household income have been associated with reduced recruitment [30]. Poor recruitment limits validity [31] and reduces the translational value of findings to real-world dietary intake and clinical practice [32]. A recent scoping review highlighted a paucity of nutrition research addressing the practical realities of dietary management in paediatric T1D [33]. This underscores the need for pragmatic, clinically relevant dietary research in this population. While observational and pragmatic study designs are more susceptible to confounding than RCTs, they have been shown to produce comparable estimates of treatment effects [34] and offer advantages in capturing real-world dietary practices. Given the challenges inherent in conducting highly controlled nutritional RCTs in paediatric populations, pragmatic approaches provide more clinically meaningful evidence to inform nutritional guidelines.
To date, no studies have directly examined the effect of adding small amounts of protein to high-GI cereal breakfasts on postprandial glycaemic control in CYP with T1D using a pragmatic approach. Therefore, the aim of this study was to examine the effect of adding 10 g of protein to a high-GI breakfast and to compare the resulting three-hour postprandial glycaemic response with that of the same breakfast without added protein, and with a low-GI breakfast in children and young people with type 1 diabetes.
2. Materials and Methods
This was a pragmatic randomized crossover multicenter study of CYP with T1D who were recruited from 13 diabetes centres in the United Kingdom (UK) with data collection conducted over a one-year period. The inclusion criteria were age of 5-17 years, a diagnosis of T1D for more than one year and using insulin regimens of either multiple daily injections (MDI) or continuous subcutaneous insulin infusion (CSII) via an insulin pump, along with Dexcom continuous glucose monitoring (CGM). Those who had other medical conditions that may impact the digestion or absorption of nutrients including coeliac disease and gastroparesis or were taking anti-hyperglycaemic medication e.g. metformin and / or antidepressants were not eligible to participate in the study owing to the potential impact on glycaemic control. Owing to the types of foods in the test meals, vegans and those allergic to any of the food in the test meals were also not eligible to take part.
Eligible CYP were recruited by their local dietitian and invited to consume the test meals and submit a questionnaire about the meal and the three-hour postprandial period. Their diabetes management and insulin to carbohydrate ratios were optimised at the time of recruitment either by the recruiting dietitian or another member of the local diabetes team. Participant Information Sheets were provided, and consent forms obtained from the parents and the participants who were aged between 16-17 years, with assent forms obtained from the participants who were under 16 years.
Baseline information was collected at recruitment from clinical records by the recruiting dietitian. This included: sex, date of birth, Body Mass Index (BMI), HbA1c and insulin regimen. Online Surveys (Jisc, Bristol, UK) were used to gather information from participants and included questions about which meal was tested and the diabetes management as well as the postprandial period response. For control meals, the participants were asked to provide information on the meal including the type and amount of foods consumed.
For the intervention, there were three test meals repeated twice. Two of the test meals consisted of a high GI breakfast cereal which had a high glycaemic load (HGL) and the same HGL meal including a protein food providing 10 g of protein (HGLP). In order to reflect popular food choices there were two choices of cereal (rice snaps or corn flakes) and a choice of protein sources consisting of egg, cheese, or meats, or their combination. There were three different portion sizes for the HGL and HGLP meals providing 35g, 50g and 70g carbohydrate to accommodate the different age groups, only. The participants chose their own cereal, protein source and portion size but were asked to replicate these exactly when meals were repeated. The protein food was to be consumed ad libitum as part of the breakfast meal, with no restrictions on timing relative to carbohydrate intake. The final test meal had a low GI with a medium glycaemic load (MGL) which contained 40g carbohydrate and consisted of one slice of enriched fibre white bread with chocolate nut spread plus natural yoghurt and mixed berries.
Participants acted as their own controls with the control meal being their usual breakfast of choice. The participants were asked to consume each test meal and the control meal in a randomised order on two separate occasions. The randomisation was provided to them using Latin square randomisation. The participants were advised to follow their usual diabetes management for meals, which included the timing of their insulin dose. The participants were also asked to consume >75% of the test meals to ensure this achieved the glycaemic load category and to match consumption on repeat meals.
None of the meals were provided by the research team. As this was a pragmatic real world study the participants consumed the meals in their own home on days of their choosing. They were asked to test the meals on days when there had been no nocturnal hypoglycaemia and the CGM sensor reading was between 4-10 mmol/L prior to the breakfast meal commencing. The participants were asked to keep to the same meal choices and portion sizes when repeating the meals on a separate day. During the three-hour postprandial period, participants were also asked to keep physical activity to a maximum of 30 minutes and to replicate this on all repeat meals. Participants were also asked to avoid consuming any additional food during the post-prandial period other than for treating hypoglycaemia. This was to reflect a typical day when snacking often occurs within three hours of the breakfast meal as observed in our observation study [25].
The breakfast meals were reviewed and analysed by a registered dietitian (JJ) using Nutritics (Nutrition Analysis Software, 2019). The analysis included: energy (Kcal), fats (g), saturated fats (g), carbohydrate (g), sugars (g), protein (g), fibre, and salt (g) and glycaemic index (GI) and glycaemic load (GL). Macronutrient intakes were compared with ISPAD recommendations [1]. The GI values were obtained from the International tables of GI [10,35] and where the GI was not known, the GI of a similar food was used. The total GI of a meal was calculated as described in Dodd et al. (2011) [36]. The glycaemic load was calculated by multiplying the GI of the individual food by its available carbohydrate and dividing by 100 [37].
Participants used their own Dexcom G6 or G7 CGM devices during the study, with approval from Dexcom Inc. CGM data was collected retrospectively via Dexcom Clarity following each test meal. Only the meals which had ≥70% of CGM data were included in the analysis [38]. The primary outcome measurement was the mean glucose reading taken from CGM sensor readings over the three-hour postprandial period. Additional CGM-derived outcomes included pre-prandial glucose (defined as the closest reading prior to breakfast consumption), timing of insulin administration relative to meal onset, and postprandial metrics. These comprised mean glucose excursion, peak glucose excursion, time to peak glucose, glucose area under the curve (AUC), coefficient of variation (CV, %), time below range (TBR; <3.9 mmol/L), time in range (TIR; 3.9–10.0 mmol/L), time in tight range (TITR; 3.9–7.8 mmol/L), and time above range (TAR; >10.0 mmol/L).
Statistical analysis was performed using Jamovi (The Jamovi project, Sydney, Australia, 2023. Version 2.2.5 retrieved from https://www.jamovi.org). The figures were produced using GraphPad 9.5.0 (GraphPad Software, San Diego, California USA). The incremental AUC was calculated using the trapezoidal method via GraphPad 9.5.0 (GraphPad Software, San Diego, California USA). Parametric outcomes are presented as mean and standard deviation (SD) and for non-parametric the median and interquartile range (IQR) is presented. Linear mixed models were constructed to compare nutrient and glucose outcomes as well as for comparisons of the postprandial glucose readings between control and test meals for the whole of the three-hour postprandial period, and for 30min time periods, performed with Restricted Maximum Likelihood (REML), the Wald method for Confidence Intervals and Satterthwaite method for the degrees of freedom. The models included a fixed intercept and slope and a random intercept for the participants. Hypoglycaemic events were analysed using a Generalized Linear Mixed Model with logistic regression. The effect size for the linear mixed models was calculated using the suggested formula from Westfall et al. (2014) [39] (measured as d) using the formula applicable for one random factor from Brysbaert & Stevens (2018) [40]. The reliability of repeat meals were analysed via construction of an unconditional Linear Mixed Model to generate the Intraclass Correlation coefficient (ICC) with ICC of <0.50 judged to show poor reliability [41]. Where appropriate, post hoc tests were performed using the Bonferroni correction to manage the risk of a type 1 error occurring with multiple statistical tests. P<0.05 was considered statistically significant.
Similar previous studies have reported mean differences of 2 mmol/L [14,17,42,43] and a standard deviation of 3.1 mmol/L [44] for blood glucose, giving an effect size of 0.64. With this effect size and statistical power of 80% with alpha set at 0.05, a total sample size of n=22 was required for two tailed comparisons between two dependent means. We aimed to recruit n=50 to allow for expected high loss to follow-up.
3. Results
3.1. Participants
Forty-eight participants consented to join the study and provided the baseline information. Of these, five did not respond and eight withdrew before sharing their CGM data. Of the thirty-five who shared their CGM data, nine did not respond to the request to commence testing the meals and one started the meals however it was not possible to obtain their CGM data. This resulted in 25 participants testing the meals (Table 1).
Fourteen meal submissions were excluded. The reasons for exclusions were: pre-meal sensor reading did not meet protocol conditions (6 meals), duplicate submissions (3 meals), no CGM data available or CGM reported to be inaccurate (2 meals), family reported incorrect insulin dose given (2 meals) and incomplete information (1 meal). Including the addition of meals that were not completed a total of 149 meals were analysed (Figure 1).
3.2. Meal Choice and Composition
The majority of chosen meals were rice cereals of small portion size (Supplementary data, Table S1). Chosen protein sources were egg, cheese or meat or their combination (Supplementary data, Table S2). There was only one choice of meal for the MGL meal (Supplementary data Table S3). The carbohydrate content of the control meals was significantly higher than the HGLP (p=0.02) and MGL meals (p=0.002) however there was no significant difference in the mean carbohydrate content of the three types of test meals (p>0.05) (Supplementary data, Table S4). The mean protein of the HGLP meal was 18.5 ± 1.6 g. As the participants could choose from selection of protein foods the amount of fat in the HGLP meals varied. Many of the participants chose similar protein sources and 58.3% of the HGLP meals had a fat content of between 12-13 g. None of the HGLP meals contained more than 20 g of fat. There was no significant difference in the mean postprandial glucose over the 180min after ingestion of the HGLP meals containing less than 10 g fat (mean: 7.5 ± 2.1 mmol/L) compared with the HGLP meals containing more than 10 g of fat (mean: 8.1 ± 2.2 mmol/L) with a mean difference of 0.9mmol/L (95% CI [-0.9, 2.7], d=0.4, p=0.35). The saturated fat content of the HGLP meals (mean: 5.8 ± 2.6 g) was significantly greater than the HGL meals (mean: 2.1 ± 0.5 g) with a mean difference of 3.8g (95% CI [3.2, 4.4], d=2.5, p<0.001).
3.3. Glucose Outcome Measurements
There was no significant difference in the pre-prandial glucose or insulin dose timing between the control and any of the test meals (p>0.05) (Supplementary data, Table S5). The ingestion of the HGLP meal resulted in a significantly lower mean postprandial glucose (mean: 8.0 ± 2.2mmol/L) when compared to the HGL meal (mean: 9.5 ± 2.5 mmol/L) with a mean difference of 1.6mmol/L, 95% CI [0.7, 2.5], d=0.7, p<0.01). There were no other differences in the mean postprandial glucose between the meals.
There was no significant difference in the mean glucose excursion over the 180min following ingestion of the control compared with the test meals (p>0.05) (Supplementary data, Table S5). The mean glucose excursion was significantly higher following the ingestion of the HGL meal (mean: 2.8 ± 2.5 mmol/L) compared with the HGLP meal (mean: 1.3 ± 1.8 mmol/L) with a mean difference of 1.6mmol/L (95% CI [0.7, 2.5], d=0.7, p<0.01). There were no other significant differences in the glucose excursions between the test meals (Supplementary data, Table S5).
The peak excursion was significantly higher following the ingestion of the HGL meal (mean: 6.4 ± 2.8 mmol/L) compared with the control meal (mean: 4.6 ± 2.9 mmol/L) with a mean difference of 1.9mmol/L (95% CI [0.8, 3.0], d=0.7, p<0.01), the HGLP meal (mean: 4.2 ± 2.2 mmol/L) with a mean difference of 2.3mmol/L (95% CI [1.2, 3.3], d=0.9, p<0.001) and the MGL meal (mean: 4.5 ± 2.6 mmol/L) with a mean difference of 2.1mmol/L (95% CI [1.1, 3.1], d=0.8, p<0.01). There were no other significant differences in the peak excursion between the remaining meals (p>0.05) (Supplementary data, Table S5).
The time to peak (TTP) was significantly shorter following ingestion of the HGLP meal (mean: 58 ± 35min) compared with the control (mean: 81 ± 45min) with a mean difference of 24min (95% CI [8, 41], d=0.6, p=0.03) and the MGL meal (mean: 96 ± 46min) with a mean difference of 36min (95% CI [22, 51], d=1.0, p<0.01). There was no significant differences in the TTP between the remaining meals (p<0.05) (Supplementary data, Table S5).
The AUC was significantly higher following ingestion of the HGL meals (mean: 579 ± 396 (mmol/L)*3 h) compared with the HGLP meals (mean: 325 ± 242 (mmol/l)*3 h) with a mean difference of 264 (mmol/L)*3 h) (95% CI [126, 401], d=0.8, p<0.01). There was no significant difference in the AUC between the remaining meals (p>0.05) (Figure 2; Supplementary data, Table S5).
The %CV was significantly higher after the ingestion of the HGL meals (mean: 26.4 ± 9.5%) compared with the control meals (mean: 19.7 ± 8.9%) with a mean difference of 6.9% (95% CI [3.3, 10.4], d=0.8, p<0.01) and the MGL meals (mean: 19.8 ± 6.4%) with a mean difference of 6.7% (95% CI [3.6, 9.8], d=0.8, p<0.01). There were no significant differences in the %CV between the remaining meals (p>0.05) (Supplementary data, Table S6 and S7).
3.4. Time in Range
The TIR (min) after ingestion of the HGL meal over 180min (mean: 100 ± 56min) was significantly shorter than after ingestion of the control meals (mean: 135 ± 50min), with a mean difference of 35min (95% CI [14, 56], d=0.7, p=0.01). This was also significantly shorter compared with the HGLP meals (Mean: 132 ± 53min) with a mean difference of 33min (95% CI [12, 54], d=0.6, p=0.02) and MGL meals (mean: 131 ± 49min) with a mean difference of 31min (95% CI [10, 52], d=0.6, p=0.03). There were no significant differences in the TIR (min) between the remaining meals (p>0.05) (Supplementary data, Table S6 and S7).
The TITR was significantly longer following ingestion of the HGLP meal (mean: 97min ± 54min) compared with the HGL meal (mean: 60 ± 46min) with a mean difference of 38min (95 % CI [17, 58], d=0.8, p<0.01) and after the MGL meal (mean: 69 ± 50min) with a mean difference of 29min (95 % CI [8, 50], d=0.6, p=0.04). There were no significant differences in the TITR (min) between the remaining meals (p>0.05) (Supplementary data, Table S6 and S7).
3.5. Glucose Excursions at 30-Minute Time Intervals
At 30min, the ingestion of the HGL meal resulted in significantly higher glucose excursion (mean: 3.4 ± 2.2mmol/L) than the control meals (mean: 1.9 ± 2.1mmol/L) with a mean difference of 1.6mmol/L (95% CI [0.8, 2.4], d=0.7, p<0.001). This was also significantly higher than the HGLP meals (mean: 2.2 ± 2.1mmol/L) with a mean difference of 1.2mmol/L (95% CI [0.5, 2.0], d=0.6, p=0.01) and the MGL meals (mean: 1.5 ± 2.2mmol/L) with a mean difference of 1.9mmol/L (95 % CI [1.1, 2.6], d=0.9, p<0.001).
By 60min, the glucose excursion remained significantly higher after ingestion of the HGL meal (mean: 4.9 ± 3.0mmol/L) compared with the control meals (mean: 3.0 ± 2.9mmol/L) with a mean difference of 1.9mmol/L (95% CI [0.8, 3.0], d=0.7, p<0.001), the HGLP meals (mean: 2.9 ± 2.6mmol/L) with a mean difference of 2.0mmol/L (95% CI [1.0, 3.1], d=0.7, p<0.001) and the MGL meals (mean: 2.6 ± 3.0mmol/L) with a mean difference of 2.4mmol/L (95% CI [1.3, 3.4], d=0.8, p<0.001).
At 90min, the glucose excursion remained significantly higher after ingestion of the HGL meal (mean: 4.3 ± 3.6mmol/L) compared with the HGLP meal (mean: 1.9 ± 2.7mmol/L) with a mean difference of 2.4mmol/L (95% CI [1.1, 3.7], d=0.8, p=0.01). The glucose excursion remained significantly higher after ingestion of the HGL meal (mean: 3.1 ± 4.0mmol/L) compared with the HGLP meal (mean: 0.8 ± 2.7mmol/L) with a mean difference of 2.3mmol/L (95% CI [0.9, 3.7], d=0.7, p=0.01) (Figure 3a). These results were comparable for those using HCL (Figure 3b).
3.6. Repeat Meal Reliability
Repeat meal reliability, assessed using intraclass correlation coefficients (ICCs) of AUC data, was moderate for the control meal (ICC = 0.50) and for the HGL and HGLP meals (ICC = 0.60). In contrast, comparison of the area under the curve (AUC) for repeated MGL meals indicated poor reliability (ICC = 0.30).
3.7. Hypoglycaemic Events
There was no significant difference in the number of hypoglycaemia events between any of the meals (p>0.05).
4. Discussion
Consumption of the HGL test meal resulted in a significantly greater peak glucose excursion and reduced time spent within the target glucose range, compared with all other test meals. A key finding of the present study is that the addition of 10 g of protein to a HGL meal resulted in a substantially improved postprandial glycaemic response with a similar glucose response to consumption of the MGL meal. These findings align with previous test-meal studies demonstrating that high-GI breakfasts elicit pronounced postprandial glucose rises in children and young people (CYP) with type 1 diabetes (T1D), particularly when compared with lower-GI meals [11,45]. The new evidence presented here indicates that addition of 10g of protein to a high-GI breakfast meal is sufficient to make a meaningful difference in glycaemic control. In direct comparison with the MGL breakfast which had a low GI, the HGL meal produced a more rapid and greater initial glucose rise. Although rapid postprandial glucose increases following high-GI meals have been associated with postprandial hypoglycaemia [46], this was not observed in the present study, with no significant differences in hypoglycaemic events between meals. The AUC following the protein-enriched high-GI meal (HGLP) was almost half that observed following the HGL meal, and was comparable to that observed after ingestion of the low-GI MGL meal. Importantly, all assessed glycaemic outcome measures—including peak glucose, AUC, and time in range were significantly improved with the 10 g protein addition. Time spent in the target range exceeded recommended thresholds, supporting recent ISPAD recommendations that encourage optimising postprandial glycaemia and time in range as key goals of T1D management.
From a clinical perspective, these findings reinforce current ISPAD guidance emphasising carbohydrate quality, including glycaemic index, as an important determinant of postprandial glycaemia. However, the current study findings indicate that incorporating 10g of protein into high-GI breakfast meals could be an alternative to adopting lower-GI breakfast meal choices, representing a practical and sustainable strategy to improve postprandial glucose control and time in range in CYP with T1D, alongside carbohydrate counting and appropriate insulin dosing, without increasing hypoglycaemia risk.
Although overall postprandial glucose responses to the protein-enriched high-GI (HGLP) meal and the low-GI (MGL) meal were broadly similar, time spent in tight range was greater following ingestion of the HGLP meal. Repeat-meal reproducibility was lower for the MGL breakfasts compared with the HGL and HGLP meals. This may reflect greater intra-individual variability in postprandial glycaemic responses to carbohydrate, whereas protein ingestion has been shown to elicit more predictable and physiologically constrained glucose responses in adults with type 1 diabetes [20]. These findings suggest that modest protein enrichment may represent a flexible and pragmatic dietary strategy to mitigate post-breakfast hyperglycaemia, particularly if lower-GI alternatives are deemed impractical or unacceptable for individuals. These findings extend existing evidence and provide empirical support for ISPAD guidance recommending protein enrichment of breakfast meals known to elicit postprandial hyperglycaemia.
High-protein meals have previously been associated with delayed postprandial hyperglycaemia, particularly when protein intake exceeds 40 g, although definitions of “high protein” remain inconsistent due to substantial inter-individual variability [1]. In the present study, the addition of 10 g of protein (resulting in a mean total protein intake of 18.5 ± 1.6 g) did not result in late postprandial hyperglycaemia within the 180-minute observation period. This is consistent with findings by Paterson et al. (2017) [14], who reported glucose increases of approximately 0.27–0.64 mmol/L per 10 g protein between 150 and 300 minutes, and observed minimal absolute excursions at similar protein intakes. Although Smart et al. (2013) [13] demonstrated delayed hyperglycaemia beyond 180 minutes following high-fat, high-protein meals, those meals contained substantially higher amounts of protein (≥40 g) and fat (>35 g) than in the present study. In contrast, none of the HGLP meals in the present study meals exceeded 20 g fat, which may partially explain the absence of delayed hyperglycaemia.
Collectively, these findings support ISPAD guidance advocating protein inclusion to breakfast meals known to cause postprandial hyperglycaemia and provide preliminary evidence that modest protein enrichment (10 g) may be sufficient to improve postprandial glycaemia without increasing short-term risk of delayed hyperglycaemia. Whether similar effects persist beyond three hours remains uncertain. However, the 180 minute postprandial period reflects typical mid-morning snack timing in the UK, at which point insulin adjustment affords an opportunity to address emerging hyperglycaemia. Delayed hyperglycaemia beyond 180 minutes may therefore be of less clinical significance following breakfast than following the evening meal, which is often the final meal before sleep—a distinction previously highlighted by Smart et al. (2013) [13].
Despite the glycaemic benefits observed, an important nutritional consideration is that protein addition significantly increased the saturated fat and salt content of the HGLP meals. Some commonly chosen protein foods such as cheese, bacon, and sausages are high in saturated fat and were frequently selected in our previous observational work [25]. Given the elevated cardiovascular risk associated with T1D, dietary strategies should prioritise protein sources low in saturated fat. In the present study, the choice of protein sources for the HGLP meals reflected typical dietary behaviour. However, since amino acid composition and absorption rate determine the postprandial glycaemic response [47] this might have impacted the glycaemic response. Indeed, in healthy participants significant differences in glycaemic response and insulin secretion have been observed following the ingestion of different protein sources [48,49]. However, in a recent study including adults with T1D no significant differences in glycaemic outcomes between common protein sources were observed [20], suggesting that clinical recommendations need not differentiate by protein type for this population. Nevertheless, the potential influence of protein source warrants further investigation in larger, controlled studies and should explore the acceptability and glycaemic effects of lean protein options in this context.
In addition, the present study has shown that significant postprandial hyperglycaemia following the high-GI breakfast can still occur despite HCL systems use, reinforcing the limitations of current automated insulin delivery in responding to rapid glucose absorption. Managing postprandial glycaemia remains challenging even in individuals using HCL insulin delivery systems [50] and time above range in HCL users is largely attributable to postprandial hyperglycaemia, particularly after breakfast [51,52,53]. While some studies suggest HCL systems can attenuate glycaemic variability following high-protein meals [53], others show that high glycaemic load remains a strong predictor of reduced time in range [54]. These findings highlight the continued importance of dietary strategies to complement technological advances in insulin delivery.
Finally, we must acknowledge that the pragmatic design resulted in unsupervised meal consumption and reliance on self-reported dietary intake. Deviations from protocol and inaccuracies in food reporting cannot be excluded and could possibly have been improved with the addition of photographs and weighed meals, but this would likely impact upon recruitment and retention of participants. While our pragmatic approach enhances real-world relevance, it limits dietary standardisation and causal inference. The sample size was modest, and for effect sizes below 0.64 the study may be underpowered, although several outcomes exceeded this threshold. Furthermore, our participants demonstrated relatively good glycaemic control at baseline, with mean HbA1c below ISPAD targets, and inclusion was limited to users of Dexcom CGM, potentially introducing selection bias.
5. Conclusions
This pragmatic study demonstrates that the addition of 10 g of protein to a high glycaemic index breakfast meal can substantially improve postprandial glycaemic outcomes in children and young people with type 1 diabetes, without inducing short-term delayed hyperglycaemia. These findings have important practical relevance for nutritional guidance, and support modest protein enrichment as a flexible and achievable strategy to mitigate post-breakfast glycaemic excursions in real-world settings, including among individuals using hybrid closed-loop systems.
The nutritional quality of protein sources warrants careful consideration. Given the increased saturated fat and salt content associated with some commonly chosen protein foods, dietary advice should preferentially promote lower-fat, lower-salt protein options, particularly in this population with elevated long-term cardiovascular risk. Further research is required to confirm these findings in larger and more diverse cohorts, to evaluate longer-term effects on overall glycaemic control, and to assess the acceptability and feasibility of incorporating less processed protein sources into breakfast meals for children and young people with type 1 diabetes.
Supplementary Materials
The following supporting information can be downloaded at the website of this paper posted on Preprints.org, Table S1: The type of cereal and the portion size participants chose for the HGL and HGLP breakfast meals; Table S2: The type of protein food chosen by participants for the HGLP breakfast meal; Table S3: The contents of the MGL breakfast meal; Table S4: The nutrient composition of each of the control and test meals for the 25 participants; Table S5 The pre-prandial glucose, insulin dose timing and postprandial glucose measurements from CGM readings taken over 180min following ingestion of each type of meal.
Author Contributions
Julie Johnson: Conceptualization, Data Curation, Formal analysis, Investigation, Methodology, Project Administration, Resources, Visualization, Writing – original draft, Writing – review and editing. Victoria Franklin: Conceptualization, Methodology, Supervision, Writing – review and editing. Ashley Shepherd: Conceptualization, Methodology, Project administration, Supervision, Writing – review and editing. Sonja Allen: Investigation, Project Administration, Writing – review and editing. Debbie Blissitt: Investigation, Project Administration, Writing – review and editing. Kate Keen: Investigation, Project Administration, Writing – review and editing. Kirsty Maclean: Investigation, Project Administration, Writing – review and editing. Anne-Marie McKillup: Investigation, Project Administration, Writing – review and editing. Elizabeth Procter: Investigation, Project Administration, Writing – review and editing. Susan Roach: Investigation, Project Administration, Writing – review and editing. Adele Swart: Investigation, Project Administration, Writing – review and editing. Stuart Galloway: Conceptualization, Methodology, Project administration, Supervision, Validation, Writing – review and editing
Funding
This research received no external funding. This paper formed part of a Clinical Doctorate thesis for Julie Johnson titled ‘The Breakfast Rise Education and Knowledge Study (The BREAK study)’ and was presented in abstract form at the 50th Annual Conference of the ISPAD (2024) [55].
Institutional Review Board Statement
Ethical approval for the study was obtained via the University of Stirling (NHS, Invasive & Clinical Research (NICR) panel) and the North of Scotland (1) Research Ethics Committee (22/NS/0123). The study was registered with ClinicalTrials.Gov on 26th November 2022 https://clinicaltrials.gov/study/NCT05698875.
Informed Consent Statement
Informed consent was obtained from all subjects involved in the study.
Data Availability Statement
The data to support these findings are available from the corresponding author on request.
Acknowledgments
We wish to thank all the children and young people and their families who participated in this study. The abstract was presented at the 50th Annual Conference of the ISPAD (2024) [55].
Conflicts of Interest
The authors declare no conflicts of interest.
Abbreviations
The following abbreviations are used in this manuscript:
| GI CYP T1D GL HGL HGLP MGL HCL TIR ISPAD RCT MDI CSII CGM BMI HbA1C AUC CV TBR TITR TAR SD IQR REML ICC CI |
Glycaemic Index Children and Young People Type 1 Diabetes Glycaemic Load High Glycaemic Load High Glycaemic Load Protein Medium Glycaemic Load Hybrid Closed-Loop Time in Range International Society of Pediatric and Adolescent Diabetes Randomised Control Trial Multiple Daily Injections Continuous Subcutaneous Insulin Infusion Continuous Glucose Monitoring Body Mass Index Glycated Haemoglobin Area Under the Curve Coefficient of Variation Time below Range Time in Tight Range Time above Range Standard Deviation Interquartile range Restricted Maximum Likelihood Intraclass Correlation Coefficient Confidence Interval |
References
- Annan, S.F.; Higgins, L.A.; Jelleryd, E.; Hannon, T.; Rose, S.; Salis, S.; Baptista, J.; Chinchilla, P.; Marcovecchio, M.L. ISPAD Clinical Practice Consensus Guidelines 2022: Nutritional management in children and adolescents with diabetes. Pediatr. Diabetes 2022, 23, 1297–1321. [Google Scholar] [CrossRef] [PubMed]
- Heptulla, R.A.; Allen, H.F.; Gross, T.M.; Reiter, E.O. Continuous glucose monitoring in children with type 1 diabetes: before and after insulin pump therapy. Pediatr. Diabetes 2004, 5(1), 10–15. [Google Scholar] [CrossRef] [PubMed]
- Gandrud, L.M.; Xing, D.; Kollman, C.; Block, J.M.; Kunselman, B.; Wilson, D.M.; Buckingham, B.A. The Medtronic Minimed Gold continuous glucose monitoring system: an effective means to discover hypo-and hyperglycemia in children under 7 years of age. Diabetes Technol. Ther. 2007, 9(4), 307–316. [Google Scholar] [PubMed]
- Monzon, A.D.; Smith, L.B.; Powers, S.W.; Dolan, L.M.; Patton, S.R. The association between glycemic variability and macronutrients in young children with T1D. J. Pediatr. Psychol. 2020, 45(7), 749–758. [Google Scholar] [CrossRef] [PubMed]
- Quarta, A.; Guarino, M.; Tripodi, R.; Giannini, C.; Chiarelli, F.; Blasetti, A. Diet and glycemic index in children with type 1 diabetes. Nutrients 2023, 15(16), 3507. [Google Scholar] [CrossRef] [PubMed]
- McKevith, B.; Jarzebowska, A. The role of breakfast cereals in the UK diet: headline results from the National Diet and Nutrition Survey (NDNS) year 1. 2010. [Google Scholar] [CrossRef] [PubMed]
- Gibson, S. Micronutrient intakes, micronutrient status and lipid profiles among young people consuming different amounts of breakfast cereals: further analysis of data from the National Diet and Nutrition Survey of Young People aged 4 to 18 years. Public Health Nutr. 2003, 6(8), 815–820. [Google Scholar] [CrossRef] [PubMed]
- McKevith, B. Nutritional aspects of cereals. Nutr. Bull. 2004, 29(2), 111–142. [Google Scholar] [CrossRef]
- Aisbitt, B.; Caswell, H.; Lunn, J. Cereals–current and emerging nutritional issues. Nutr. Bull. 2008, 33(3), 169–185. [Google Scholar]
- Atkinson, F.S.; Brand-Miller, J.C.; Foster-Powell, K.; Buyken, A.E.; Goletzke, J. International tables of glycemic index and glycemic load values 2021: a systematic review. Am. J. Clin. Nutr. 2021, 114(5), 1625–1632. [Google Scholar] [CrossRef] [PubMed]
- Ryan, R.L.; King, B.R.; Anderson, D.G.; Attia, J.R.; Collins, C.E.; Smart, C.E. Influence of and optimal insulin therapy for a low–Glycemic index meal in children with type 1 diabetes receiving intensive insulin therapy. Diabetes Care 2008, 31(8), 1485–1490. [Google Scholar] [CrossRef] [PubMed]
- 12; Groele, L.; Golicki, D.; Błazik, M.; Pańkowska, E. Improving the Estimation of Meal-Time Insulin Dose Based On the Glycaemic Load of a Meal in Children with Type 1 Diabetes on Insulin Pump Therapy: A Randomized Study. J. Diabetes Metab. 2014, 5(435), 2. [Google Scholar]
- Smart, C.E.; Evans, M.; O’connell, S.M.; McElduff, P.; Lopez, P.E.; Jones, T.W.; Davis, E.A.; King, B.R. Both dietary protein and fat increase postprandial glucose excursions in children with type 1 diabetes, and the effect is additive. Diabetes Care 2013, 36(12), 3897–3902. [Google Scholar] [CrossRef] [PubMed]
- Paterson, M.A.; Smart, C.E.M.; Lopez, P.E.; Howley, P.; McElduff, P.; Attia, J.; Morbey, C.; King, B.R. Increasing the protein quantity in a meal results in dose-dependent effects on postprandial glucose levels in individuals with Type 1 diabetes mellitus. Diabet. Med. 2017, 34(6), 851–854. [Google Scholar] [PubMed]
- Paterson, M.A.; King, B.R.; Smart, C.E.M.; Smith, T.; Rafferty, J.; Lopez, P.E. Impact of dietary protein on postprandial glycaemic control and insulin requirements in type 1 diabetes: a systematic review. Diabet. Med. 2019, 36(12), 1585–1599. [Google Scholar] [CrossRef] [PubMed]
- Evans, M.; Smart, C.E.M.; Paramalingam, N.; Smith, G.J.; Jones, T.W.; King, B.R.; Davis, E.A. Dietary protein affects both the dose and pattern of insulin delivery required to achieve postprandial euglycaemia in type 1 diabetes: a randomized trial. Diabet. Med. 2019, 36(4), 499–504. [Google Scholar] [PubMed]
- Paterson, M.A.; Smart, C.E.M.; Howley, P.; Price, D.A.; Foskett, D.C.; King, B.R. High-protein meals require 30% additional insulin to prevent delayed postprandial hyperglycaemia. Diabet. Med. 2020, 37(7), 1185–1191. [Google Scholar] [PubMed]
- Smith, T.A.; Smart, C.E.; Fuery, M.E.; Howley, P.P.; Knight, B.A.; Harris, M.; King, B.R. In children and young people with type 1 diabetes using pump therapy, an additional 40% of the insulin dose for a high-fat, high-protein breakfast improves postprandial glycaemic excursions: a cross-over trial. Diabet. Med. 2021, 38(7), e14511. [Google Scholar] [PubMed]
- Hätönen, K.A.; Virtamo, J.; Eriksson, J.G.; Sinkko, H.K.; Sundvall, J.E.; Valsta, L.M. Protein and fat modify the glycaemic and insulinaemic responses to a mashed potato-based meal. Br. J. Nutr. 2011, 106(2), 248–253. [Google Scholar] [CrossRef] [PubMed]
- Li, X.; Wainwright, A.; Fio, C.Z.; Brodie, S.; Alexander, K.; McGill, M.; Duke, S.A.; Fulcher, G.; Twigg, S.; Wong, J.; Brand-Miller, J. Do the types of dietary carbohydrate and protein affect postprandial glycemia in type 1 diabetes? Nutrients 2025, 17(11), 1868. [Google Scholar] [CrossRef] [PubMed]
- Faber, E.M.; van Kampen, P.M.; Clement-de Boers, A.; Houdijk, E.C.; van der Kaay, D.C. The influence of food order on postprandial glucose levels in children with type 1 diabetes. Pediatr. Diabetes 2018, 19(4), 809–815. [Google Scholar] [CrossRef] [PubMed]
- Neu, A.; Behret, F.; Braun, R.; Herrlich, S.; Liebrich, F.; Loesch-Binder, M.; Schneider, A.; Schweizer, R. Higher glucose concentrations following protein-and fat-rich meals–the Tuebingen Grill Study: a pilot study in adolescents with type 1 diabetes. Pediatr. Diabetes 2015, 16(8), 587–591. [Google Scholar] [PubMed]
- Winiger, G.; Keller, U.; Laager, R.; Girard, J.; Berger, W. Protein content of the evening meal and nocturnal plasma glucose regulation in type-I diabetic subjects. Horm. Res. Paediatr. 1995, 44(3), 101–104. [Google Scholar] [CrossRef]
- Paterson, M.A.; Smart, C.; Mcelduff, P.; Lopez, P.; Morbey, C.; Attia, J.; King, B. Influence of pure protein on postprandial blood glucose levels in individuals with type 1 diabetes mellitus. Diabetes 2014, Vol. 63, A15–A15. [Google Scholar]
- Johnson, J.; Franklin, V.L.; Shepherd, A.; Chau, G.; Keen, K.; Lennon, S.; Leveridge, M.; Maclean, K.; Nicol, J.; Phillipson, V.; Roach, S.; Swart, A.; Galloway, S.D. Glucose Variability and Postprandial Hyperglycaemia after Breakfast in Children and Young People With Type 1 Diabetes. Pediatr. Diabetes 2025, 2025(1), 5545726. [Google Scholar] [CrossRef]
- Cohen, E.; Uleryk, E.; Jasuja, M.; Parkin, P.C. An absence of pediatric randomized controlled trials in general medical journals, 1985–2004. J. Clin. Epidemiol. 2007, 60(2), 118–123. [Google Scholar] [CrossRef] [PubMed]
- Kamps, J.L.; Rapoff, M.A.; Roberts, M.C.; Varela, R.E.; Barnard, M.; Olson, N. Improving adherence to inhaled corticosteroids in children with asthma: A pilot of a randomized clinical trial. Child. Health Care 2008, 37(4), 261–277. [Google Scholar] [CrossRef]
- Stehl, M.L.; Kazak, A.E.; Alderfer, M.A.; Rodriguez, A.; Hwang, W.T.; Pai, A.L.; Boeving, A.; Reilly, A. Conducting a randomized clinical trial of an psychological intervention for parents/caregivers of children with cancer shortly after diagnosis. J. Pediatr. Psychol. 2009, 34(8), 803–816. [Google Scholar] [PubMed]
- Wysocki, T.; Harris, M.A.; Buckloh, L.M.; Mertlich, D.; Lochrie, A.S.; Taylor, A.; Sadler, M.; Mauras, N.; White, N.H. Effects of behavioral family systems therapy for diabetes on adolescents’ family relationships, treatment adherence, and metabolic control. J. Pediatr. Psychol. 2006, 31(9), 928–938. [Google Scholar] [PubMed]
- Herbert, L.J.; Gillespie, C.; Monaghan, M.; Holmes, C.; Streisand, R. Factors associated with recruitment and retention in randomized controlled trials of behavioral interventions for patients with pediatric type 1 diabetes. J. Clin. Psychol. Med. Settings 2016, 23(2), 112–125. [Google Scholar] [PubMed]
- Patel, M.X.; Doku, V.; Tennakoon, L. Challenges in recruitment of research participants. Adv. Psychiatr. Treat. 2003, 9(3), 229–238. [Google Scholar] [CrossRef]
- Gough, T.; Haynes, A.; Clarke, K.; Hansell, A.; Kaimkhani, M.; Price, B.; Roberts, A.; Hardman, C.A.; Robinson, E. Out of the lab and into the wild: The influence of portion size on food intake in laboratory vs. real-world settings. Appetite 2021, 162, 105160. [Google Scholar] [CrossRef] [PubMed]
- Handu, D.; Piotrowski, M. Nutrition interventions in pediatric patients with type 1 diabetes: an evidence analysis center scoping review. J. Acad. Nutr. Diet. 2022, 122(2), 424–431. [Google Scholar] [CrossRef] [PubMed]
- Benson, K.; Hartz, A.J. A comparison of observational studies and randomized, controlled trials. In Research ethics; Routledge, 2017; pp. 213–221. [Google Scholar]
- Atkinson, F.S.; Foster-Powell, K.; Brand-Miller, J.C. International tables of glycemic index and glycemic load values. Diabetes Care 2008, 31, 2281–2283. [Google Scholar] [CrossRef] [PubMed]
- Dodd, H.; Williams, S.; Brown, R.; Venn, B. Calculating meal glycemic index by using measured and published food values compared with directly measured meal glycemic index. Am. J. Clin. Nutr. 2011, 94(4), 992–996. [Google Scholar] [CrossRef] [PubMed]
- Salmerón, J.; Ascherio, A.; Rimm, E.B.; Colditz, G.A.; Spiegelman, D.; Jenkins, D.J.; Stampfer, M.J.; Wing, A.L.; Willett, W.C. Dietary fiber, glycemic load, and risk of NIDDM in men. Diabetes Care 1997, 20(4), 545–550. [Google Scholar] [CrossRef] [PubMed]
- Schnell, O.; Barnard, K.; Bergenstal, R.; Bosi, E.; Garg, S.; Guerci, B.; Haak, T.; Hirsch, I.B.; Ji, L.; Joshi, S.R.; Kamp, M. Role of continuous glucose monitoring in clinical trials: recommendations on reporting. Diabetes Technol. Ther. 2017, 19(7), 391–399. [Google Scholar] [CrossRef] [PubMed]
- Westfall, J.; Kenny, D.A.; Judd, C.M. Statistical power and optimal design in experiments in which samples of participants respond to samples of stimuli. J. Exp. Psychol. General. 2014, 143(5), 2020. [Google Scholar] [CrossRef]
- Brysbaert, M.; Stevens, M. Power analysis and effect size in mixed effects models: A tutorial. J. Cogn. 2018, 1(1). [Google Scholar] [CrossRef] [PubMed]
- Koo, T.K.; Li, M.Y. A guideline of selecting and reporting intraclass correlation coefficients for reliability research. J. Chiropr. Med. 2016, 15(2), 155–163. [Google Scholar] [CrossRef] [PubMed]
- Paterson, M.A.; Smart, C.E.M.; Lopez, P.E.; McElduff, P.; Attia, J.; Morbey, C.; King, B.R. Influence of dietary protein on postprandial blood glucose levels in individuals with type 1 diabetes mellitus using intensive insulin therapy. Diabet. Med. 2016, 33(5), 592–598. [Google Scholar] [PubMed]
- Frohock, A.M.; Oke, J.; Yaliwal, C.; Edge, J.; Besser, R.E. Additional insulin dosing for fat and protein in children with type 1 diabetes using multiple daily injections. Pediatr. Diabetes 2022, 23(6), 742–748. [Google Scholar] [CrossRef] [PubMed]
- Smart, C.E.; Ross, K.; Edge, J.A.; Collins, C.E.; Colyvas, K.; King, B.R. Children and adolescents on intensive insulin therapy maintain postprandial glycaemic control without precise carbohydrate counting. Diabet. Med. 2009, 26(3), 279–285. [Google Scholar] [CrossRef] [PubMed]
- Birnbacher, R.; Waldhör, T.; Schneider, U.; Schober, E. Glycaemic responses to commonly ingested breakfasts in children with insulin-dependent diabetes mellitus. Eur. J. Pediatr. 1995, 154(5), 353–355. [Google Scholar] [CrossRef] [PubMed]
- Dżygało, K.; Szypowska, A. Impact of insulins glulisine and aspart on postprandial glycemia after a high-glycemic index meal in children with type 1 diabetes. Eur. J. Endocrinol. 2014, 170(4), 539–545. [Google Scholar] [CrossRef] [PubMed]
- He, T.; Giuseppin, M.L. Slow and fast dietary proteins differentially modulate postprandial metabolism. Int. J. Food Sci. Nutr. 2014, 65(3), 386–390. [Google Scholar] [PubMed]
- von Post-Skagegård, M.; Vessby, B.; Karlström, B. Glucose and insulin responses in healthy women after intake of composite meals containing cod-, milk-, and soy protein. Eur. J. Clin. Nutr. 2006, 60(8), 949–954. [Google Scholar] [CrossRef] [PubMed]
- Bell, K.J.; Petocz, P.; Colagiuri, S.; Brand-Miller, J.C. Algorithms to improve the prediction of postprandial insulinaemia in response to common foods. Nutrients 2016, 8(4), 210. [Google Scholar] [CrossRef] [PubMed]
- Gingras, V.; Taleb, N.; Roy-Fleming, A.; Legault, L.; Rabasa-Lhoret, R. The challenges of achieving postprandial glucose control using closed-loop systems in patients with type 1 diabetes. Diabetes Obes. Metab. 2018, 20(2), 245–256. [Google Scholar] [PubMed]
- Steil, G.M.; Rebrin, K.; Darwin, C.; Hariri, F.; Saad, M.F. Feasibility of automating insulin delivery for the treatment of type 1 diabetes. Diabetes 2006, 55(12), 3344–3350. [Google Scholar] [CrossRef] [PubMed]
- Weinzimer, S.A.; Bailey, R.J.; Bergenstal, R.M.; Nimri, R.; Beck, R.W.; Schatz, D.; Ambler-Osborn, L.; Schweiger, D.S.; von dem Berge, T.; Sibayan, J.; Johnson, M.L. A comparison of postprandial glucose control in the medtronic advanced hybrid closed-loop system versus 670G. Diabetes Technol. Ther. 2022, 24(8), 573–582. [Google Scholar] [CrossRef] [PubMed]
- Gingras, V.; Bonato, L.; Messier, V.; Roy-Fleming, A.; Smaoui, M.R.; Ladouceur, M.; Rabasa-Lhoret, R. Impact of macronutrient content of meals on postprandial glucose control in the context of closed-loop insulin delivery: A randomized cross-over study. Diabetes Obes. Metab. 2018, 20(11), 2695–2699. [Google Scholar] [PubMed]
- Vetrani, C.; Calabrese, I.; Cavagnuolo, L.; Pacella, D.; Napolano, E.; Di Rienzo, S.; Riccardi, G.; Rivellese, A.A.; Annuzzi, G.; Bozzetto, L. Dietary determinants of postprandial blood glucose control in adults with type 1 diabetes on a hybrid closed-loop system. Diabetologia 2022, 65, 79–87. [Google Scholar] [PubMed]
- Johnson, J.; Franklin, V.; Shepherd, A.; Galloway, S.D.R. The Breakfast Rise Education and Knowledge Study (the BREAK study) in Syplie, W., 2024. Abstract Book 50th Annual Conference ISPAD 2024. Horm. Res. Paediatr. 2024, 97 (Suppl. 2), 5–370. [Google Scholar]
Figure 1.
The number of participants who tested meals, repeated meals, and total number of each type of meal included in the analysis.
Figure 1.
The number of participants who tested meals, repeated meals, and total number of each type of meal included in the analysis.
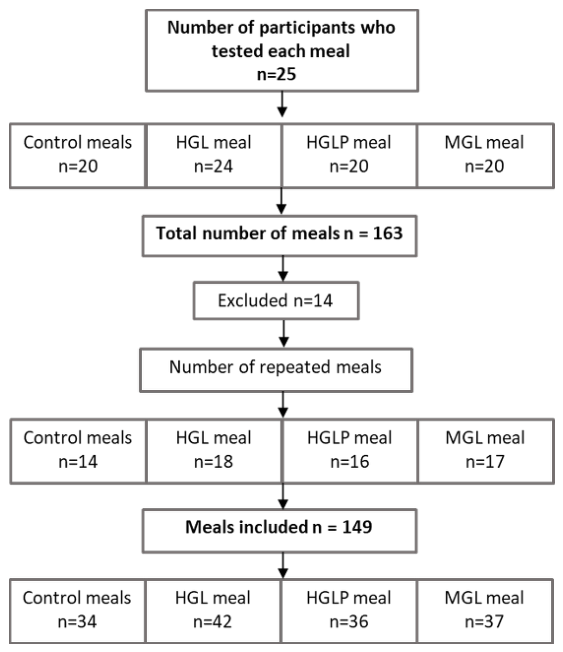
Figure 2.
AUC glucose over the 3-hour postprandial period (median, IQR, range) following the ingestion of the control and test meals. ** indicates significant difference between meals, p<0.01.
Figure 2.
AUC glucose over the 3-hour postprandial period (median, IQR, range) following the ingestion of the control and test meals. ** indicates significant difference between meals, p<0.01.
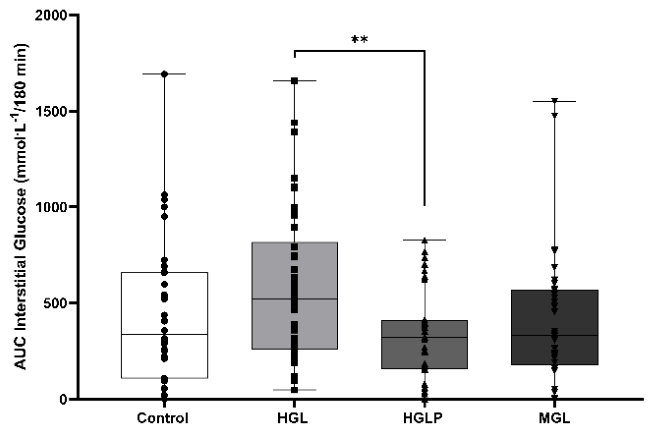
Figure 3.
The mean (95% CI) postprandial glucose excursion from 0 to 180 min for 25 participants following the ingestion of the breakfast test and control meals. (a) All insulin regimens. Significant differences and level after ingestion of the HGL meals compared with control and other test meals (at 30 and 60 min), and with the HGLP meal only (at 90 and 120 min) are shown by *** p<0.001, and ** p<0.01. (b) Shows data from meals managed with HCL systems only. Significant differences and level after ingestion of the HGL meal compared with the control and other test meals (at 30 and 60 min) and with the HGLP and MGL meals (at 90 min) and with the HGLP meal only (at 120 min) are shown by *** p<0.001, ** p<0.01, and *p<0.05.
Figure 3.
The mean (95% CI) postprandial glucose excursion from 0 to 180 min for 25 participants following the ingestion of the breakfast test and control meals. (a) All insulin regimens. Significant differences and level after ingestion of the HGL meals compared with control and other test meals (at 30 and 60 min), and with the HGLP meal only (at 90 and 120 min) are shown by *** p<0.001, and ** p<0.01. (b) Shows data from meals managed with HCL systems only. Significant differences and level after ingestion of the HGL meal compared with the control and other test meals (at 30 and 60 min) and with the HGLP and MGL meals (at 90 min) and with the HGLP meal only (at 120 min) are shown by *** p<0.001, ** p<0.01, and *p<0.05.
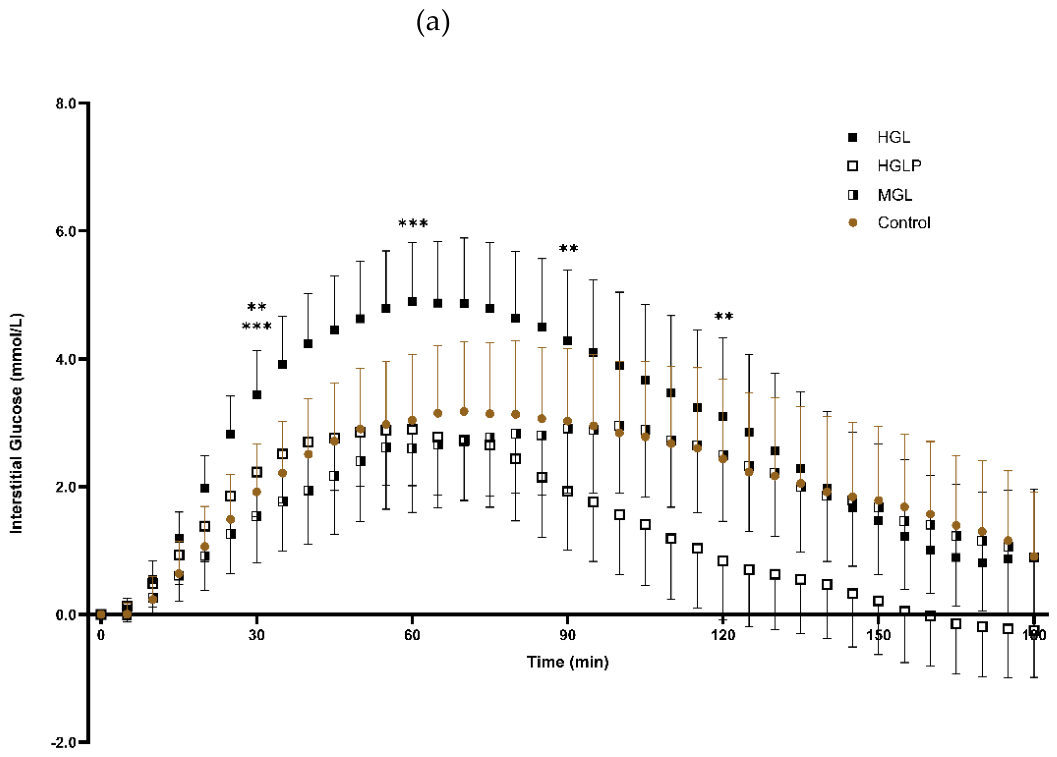
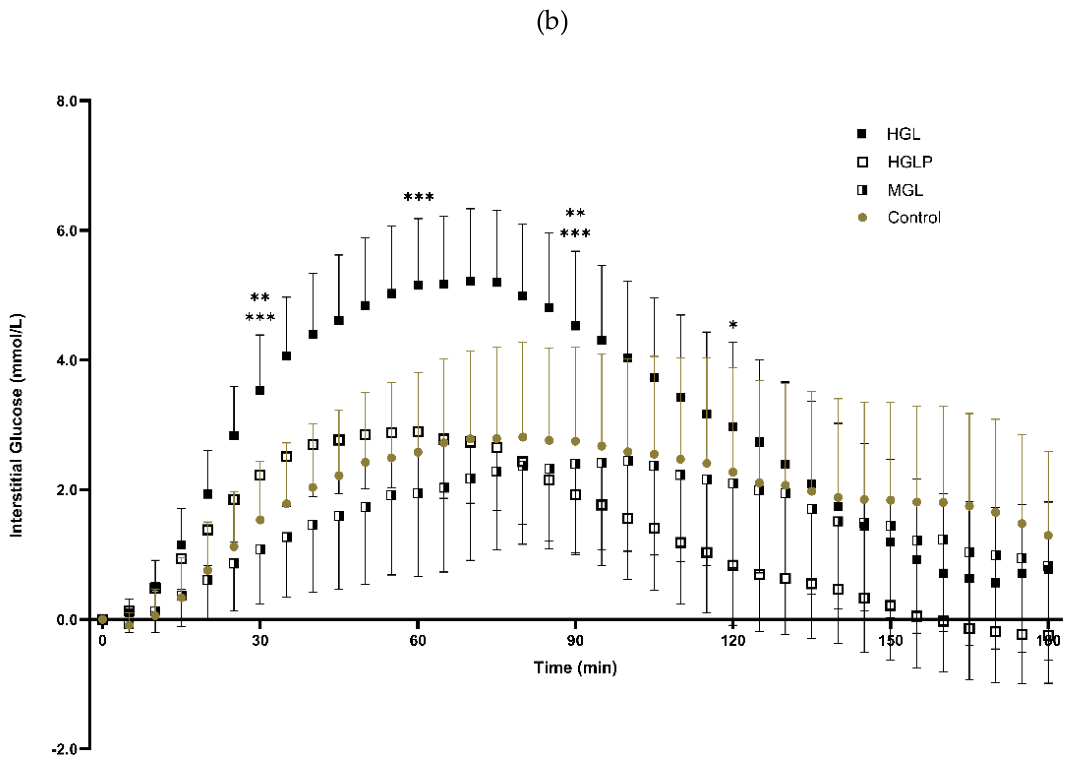

Table 1.
Participant demographic and diabetes characteristics.
| Characteristic | n=25 |
| Age (years) | 12.1 ± 3.6 |
| Females, n (%) | 10 (40) |
| Males, n (%) BMI z score |
15 (60) 0.42 (1.6) |
| Duration of T1D (years) | 4.3 ± 3.2 |
| HbA1c, mmol/mol | 48.4 ± 5.4 |
| Regimen, n (%): CSII MDI |
23 (92) 2 (80) |
| Type of CSII, n (%): Open |
6 (26.1) |
| HCL | 17 (73.9) |
Parametric data: mean ±SD, non-parametric data: median (IQR).
Disclaimer/Publisher’s Note: The statements, opinions and data contained in all publications are solely those of the individual author(s) and contributor(s) and not of MDPI and/or the editor(s). MDPI and/or the editor(s) disclaim responsibility for any injury to people or property resulting from any ideas, methods, instructions or products referred to in the content. |
© 2026 by the authors. Licensee MDPI, Basel, Switzerland. This article is an open access article distributed under the terms and conditions of the Creative Commons Attribution (CC BY) license (http://creativecommons.org/licenses/by/4.0/).
Copyright: This open access article is published under a Creative Commons CC BY 4.0 license, which permit the free download, distribution, and reuse, provided that the author and preprint are cited in any reuse.


