

Submitted:
02 July 2026
Posted:
03 July 2026
You are already at the latest version
Abstract
This study examines the relationships between human resource system performance, perceived process quality, and risk-related outcomes within an organizational systems framework. Using data from 750 respondents from the European Social Survey, Round 9, the study applies correlation, regression, mediation, and exploratory factor analyses. Since the dataset does not include direct organizational-level measures of formal HR systems, process quality, or corporate risk, a perception-based proxy approach is adopted. The findings indicate that human-resource-related indicators are significantly associated with perceived system stability and risk-related organizational outcomes, with general satisfaction and work engagement emerging as the most consistent predictors. Mediation analysis suggests that perceived process quality and reliability partially mediate the association between human resource system performance and risk-related outcomes. Exploratory factor analysis indicates a broadly interpretable two-dimensional structure of the examined indicators. The study contributes to systems-oriented organizational research by showing how human-resource-related conditions, perceived process quality, and risk-related outcomes may be interconnected within broader organizational systems. The findings offer practical implications for strengthening process reliability, organizational resilience, and risk-oriented management.
Keywords:
human resource system performance
; perceived process quality
; organizational systems
; risk-related outcomes
; organizational resilience
; mediation analysis
; perception-based proxy indicators
; European Social Survey
1. Introduction
The contemporary organizational environment is characterized by increasing complexity, uncertainty, and interdependence among human, process-related, managerial, and institutional factors. Under such conditions, organizations can be understood as complex social systems in which different subsystems interact and jointly shape system stability, process reliability, adaptability, and risk-related outcomes [1]. Traditional approaches that examine human resource management, quality management, and risk management as separate managerial domains are increasingly insufficient for explaining how organizations maintain continuity and functional stability in dynamic environments [2,3].
Quality management represents an important mechanism for improving the consistency, reliability, and efficiency of organizational processes, while risk management supports the identification, assessment, and control of potential disruptions that may affect system functioning. However, a significant part of the existing literature still examines these dimensions separately, without sufficiently considering their systemic interdependence or the role of human resource system performance as a connecting factor within organizational systems [4,5].
Human resource system performance is particularly important because work-related conditions, including satisfaction, engagement, autonomy, workload, and well-being, may influence the stability and reliability of organizational processes [6,7]. From a systems perspective, human resources do not represent only an operational element of organizational functioning, but a strategic subsystem that may shape process quality, decision-making reliability, coordination, and adaptive capacity. In this context, perceived process quality may be understood as a mediating mechanism through which human-resource-related conditions are associated with perceived system stability and risk-related organizational outcomes.
The relevance of this approach lies in the need to understand organizations as integrated systems rather than as collections of isolated managerial functions. System stability depends not only on formal procedures and structural arrangements, but also on the interaction between human-resource-related conditions, process reliability, cooperation, institutional trust, and perceived quality of management. Therefore, the integration of human resource system performance, perceived process quality, and risk-related outcomes provides a useful framework for examining how organizational systems function under conditions of complexity and uncertainty.
Based on these considerations, the aim of this study is to examine the relationships between human resource system performance, perceived process quality, and risk-related outcomes within an organizational systems framework. The empirical analysis is based on data obtained from the European Social Survey, Round 9 [9]. Since the dataset does not contain direct organizational-level measures of formal HR systems, process quality, or corporate risk, this study adopts a perception-based proxy approach, using selected work-related and institutional indicators to examine the proposed relationships.
The contribution of this study lies in the development and empirical assessment of a systems-oriented framework linking human resource system performance, perceived process quality, and risk-related organizational outcomes. By combining correlation, regression, mediation, exploratory factor, the study seeks to provide a more comprehensive understanding of how human-resource-related conditions and process-level mechanisms are associated with perceived system stability, process reliability, and risk-oriented organizational management.
2. Materials and Methods
2.1. Human Resource System Performance as a Subsystem of Organizational Performance
Contemporary organizational conditions are characterized by complexity, uncertainty, accelerated change, and increasing interdependence among organizational subsystems. These developments further emphasize the importance of systemic management, particularly within digitally transformed and Industry 4.0-oriented environments [10]. Within such a context, organizations may be conceptualized as integrated systems in which the performance of individual subsystems, including human resource systems, contributes to overall system efficiency, adaptability, and stability [11].
Recent studies indicate that human resource system performance represents an important component of organizational performance, as employee competencies, behavior, engagement, and work-related conditions may shape process quality, coordination, and system reliability [5,12,13]. Human resources should therefore not be understood only as an operational resource, but as a strategic subsystem that interacts with other organizational components and contributes to organizational resilience, process consistency, and adaptive capacity [6].
The Job Demands-Resources (JD-R) framework provides a relevant theoretical basis for understanding these relationships. According to this perspective, job resources, including autonomy, organizational support, and participation in decision-making, may enhance employee engagement and performance, whereas job demands, such as workload and stress, may increase the likelihood of process disruptions, errors, and risk-related perceptions [14,15]. Employee satisfaction and work engagement are particularly relevant within this framework because they reflect the functional condition of the human subsystem and may be associated with the consistency of task execution and the perceived stability of organizational processes [16,17,18].
At the same time, excessive workload and unfavorable working conditions may weaken process reliability and increase vulnerability to operational disturbances [19]. Work autonomy, as an indicator of system flexibility, may support more effective decision-making, faster adaptation, and improved coordination within organizational processes [20,21]. From an integrated systems perspective, human resource system performance can therefore be understood as an important condition for the stability, reliability, and functionality of organizational systems.
2.2. Perceived Process Quality as a Systemic Mechanism of Organizational Stability
Within contemporary management approaches, quality is commonly understood as the capacity of an organization to consistently satisfy requirements and continuously improve organizational processes, a principle formalized through standards such as ISO 9001 [2,22]. In parallel, risk management, as defined by ISO 31000, represents a systematic approach to identifying, assessing, and controlling risks in order to support organizational resilience and continuity [3,23].
The integration of quality and risk management contributes to the reduction of process variability, the improvement of system stability, and the strengthening of organizational performance [24,25]. This is consistent with recent studies emphasizing the importance of risk-based thinking within integrated management systems [26]. Within this context, Total Quality Management (TQM) conceptualizes quality as a strategic management approach that includes organizational processes, human resources, leadership, and organizational culture [27,28]. Empirical evidence indicates that the implementation of TQM principles may be associated with improved operational efficiency, more reliable processes, and lower exposure to operational disruptions [29,30].
Process quality, understood through process stability, consistency, and reliability, represents an important systemic mechanism for explaining organizational performance [31]. Higher perceived process quality may be associated with fewer errors, better coordination, improved productivity, and stronger organizational competitiveness [32,33,34,35,36]. From a systems perspective, process quality does not function as an isolated operational dimension, but as a connecting mechanism through which human, managerial, and structural factors influence the stability of the broader organizational system.
Related studies further emphasize the importance of integrating risk management and systems-oriented management within contemporary organizations, indicating that different categories of risk may influence the long-term stability and adaptability of organizational systems [37]. Human resource management also represents an important component of this relationship because employee-related conditions may contribute to process efficiency, coordination, and system adaptability [38]. Recent research additionally highlights the relationship between process quality, organizational reliability, and financial or performance-related stability [39].
Accordingly, perceived process quality may be interpreted as a systemic mechanism linking human resource system performance with risk-related outcomes, process reliability, and perceived organizational stability. In this study, process quality is therefore not treated as a directly measured organizational performance indicator, but as a perception-based construct that helps explain how human-resource-related conditions may be associated with broader risk-related outcomes within organizational systems.
2.3. Risk-Related Outcomes and System Stability
In contemporary organizations, risk represents a complex systemic phenomenon arising from the interaction between internal organizational conditions and external environmental factors. Traditionally, organizational risk has often been examined through financial, operational, or compliance-related dimensions. However, systems-oriented approaches conceptualize risk as an integral part of organizational functioning, emerging from the interdependence of human, process-related, managerial, and institutional components [40].
In addition to internal organizational factors, socio-institutional conditions may play an important role in shaping risk-related perceptions and system stability. Trust, cooperation, and perceptions of fairness can influence coordination, predictability, and process efficiency within broader organizational and institutional environments [41,42]. Higher levels of trust and cooperation may reduce uncertainty and support more effective coordination, while lower levels of trust may increase perceived vulnerability and instability [43,44].
Institutional reliability and the broader economic environment may also influence perceptions of risk-related organizational outcomes. Stable institutional frameworks contribute to predictability, consistency, and reduced uncertainty, whereas institutional instability may increase perceived exposure to risk and complicate decision-making processes [45,46]. From a systems perspective, these factors do not operate independently, but interact with human-resource-related conditions and process-level mechanisms in shaping perceived system stability.
Within this context, system stability may be understood as the capacity of an organizational system to maintain reliable, coordinated, and adaptive functioning under conditions of complexity and environmental change. The integration of human resource system performance, perceived process quality, and risk-related outcomes therefore provides a useful framework for examining how organizational systems sustain functional stability and resilience over time. In this study, risk-related outcomes are interpreted through perception-based proxy indicators rather than as direct measures of corporate risk.
2.4. Integrated Systems Model and Research Assumptions
Despite the substantial body of research addressing human resource management, quality management, and organizational risk, the existing literature still provides limited integrated evidence on how these dimensions interact within organizational systems. Many studies examine human resources, process quality, and risk-related outcomes as separate managerial domains, without sufficiently explaining their interdependence or their joint contribution to system stability, process reliability, and organizational resilience.
Within this context, the present study contributes to the literature by developing and empirically assessing an integrated systems model linking human resource system performance, perceived process quality, and risk-related organizational outcomes. This approach is consistent with contemporary perspectives that emphasize the importance of integrated management systems and risk-oriented management principles [26]. By adopting a systems-oriented perspective, the study moves beyond fragmented managerial interpretations and examines how human, process-related, and institutional factors may jointly shape perceived organizational stability.
A particularly important assumption of the proposed model is that perceived process quality and reliability may function as mediating mechanisms through which human resource system performance is associated with risk-related outcomes. In this sense, human resource system performance is treated as an important input subsystem, while perceived process quality represents a process-level mechanism that may help explain variations in perceived system stability, coordination, and reliability.
The integration of these dimensions enables the organization to be examined as a complex social system in which human resources, process quality, and risk-related conditions interact rather than operate independently. Such a framework provides a basis for understanding how organizational systems maintain functional stability, adaptability, and resilience under conditions of complexity, uncertainty, and environmental change.
The objective of this research is therefore to examine an integrated model in which human resource system performance is associated with risk-related organizational outcomes both directly and indirectly through perceived process quality and reliability. Since the empirical analysis is based on perception-based proxy indicators derived from the European Social Survey, the proposed model does not claim to directly measure formal HR systems, objective process quality, or corporate risk. Instead, it examines how selected work-related and institutional perceptions are associated within a systems-oriented analytical framework.
3. Research Methodology
This study is based on the secondary analysis of data obtained from the European Social Survey, Round 9 (ESS) [9], a large-scale comparative survey that provides relevant work-related, social, and institutional perception indicators across Europe. The dataset was retrieved in SPSS format from the official ESS platform and processed using IBM SPSS Statistics 26.
The final analytical sample consisted of 750 respondents with valid responses on all selected work-related, institutional, and perception-based indicators included in the model. Respondents with missing values on the selected variables were excluded from the analysis in order to ensure consistency across the applied statistical procedures. Since the analysis is based on a complete-case subset of respondents, the findings should be interpreted as applicable to the analyzed sample and not as direct evidence for all organizations or organizational systems in Europe.
The operationalization of the research variables was conducted using selected ESS Round 9 indicators. Since the ESS dataset does not provide direct organizational-level measures of formal HR systems, objective process quality, or corporate risk, the selected variables were used as perception-based proxy indicators. The constructs were defined in accordance with the theoretical framework of the study and recoded into Human Resource System Performance (HRSP), Perceived Process Quality and Reliability, and Organizational Risk-Related and Quality Perceptions (ORQP) in order to ensure conceptual consistency with the proposed systems-oriented model.
Human Resource System Performance (HRSP) was operationalized through selected indicators reflecting general satisfaction, subjective well-being, work autonomy, workload intensity, supervisory responsibility, and participation in organizational decision-making. More specifically, HRSP was represented through variables related to satisfaction with life as a whole, subjective happiness, the possibility to decide how daily work is organized, total working hours, responsibility for supervising other employees, and the possibility to influence decisions within an organization. These indicators were interpreted as perception-based proxies of employee-related stability, work-related well-being, process flexibility, system pressure, control mechanisms, and work engagement.
Organizational Risk-Related and Quality Perceptions (ORQP) were operationalized through selected indicators reflecting interpersonal trust, fairness, helpfulness, institutional reliability, perceived quality of governance, and economic stability. These indicators included perceptions of whether most people can be trusted, whether people generally try to be fair, whether people are helpful, trust in the legal system, satisfaction with the national government, and satisfaction with the present state of the economy. In this study, these variables were not treated as direct measures of corporate risk, formal quality management, or objective organizational performance. Instead, they were used as perception-based proxy indicators of system cohesion, process fairness, cooperation efficiency, institutional reliability, perceived management quality, and broader stability-related outcomes.
All selected indicators were recoded where necessary and standardized to a common analytical scale ranging from 1 to 9 in order to ensure comparability across the examined constructs. This approach enables the analysis of how work-related and socio-institutional perceptions are associated with perceived system stability, process reliability, and risk-related organizational outcomes within a systems-oriented analytical framework.
Descriptive statistics were used to present the basic characteristics of the sample and selected variables. Pearson correlation analysis was applied to examine the direction and strength of associations among the selected indicators. Multiple regression analysis was used to assess the predictive relationships between HRSP indicators, perceived process quality, and risk-related organizational outcomes. The results were interpreted as evidence of statistical association rather than as proof of causal relationships.
To examine the mediating role of perceived process quality and reliability, mediation analysis was conducted using a hierarchical regression approach. The mediation model assessed whether perceived process quality and reliability partially explains the association between human resource system performance and risk-related organizational outcomes.
3.1. Hypotheses Development
The Association Between Human Resource System Performance and Risk-Related Organizational Outcomes
Human resource system performance represents an important dimension of organizational functioning because work-related conditions may shape employee behavior, coordination, process stability, and perceived system reliability. From a systems perspective, human resources can be understood as a functional subsystem that interacts with other organizational components and contributes to the adaptability, efficiency, and resilience of the broader organizational system. Previous studies indicate that employee satisfaction, engagement, autonomy, and work-related well-being are associated with improved organizational performance, lower uncertainty, and stronger perceived organizational stability [6,7].
At the same time, unfavorable working conditions, excessive workload, and low levels of engagement may weaken process reliability and increase perceived organizational vulnerability. Therefore, human resource system performance may be considered an important factor associated with risk-related and quality-related perceptions within organizational systems.
H1:
Human Resource System Performance (HRSP) is significantly associated with risk-related and quality-related outcomes within organizational systems.
The Association Between Human Resource System Performance and Perceived Process Quality
Perceived process quality and process reliability represent important indicators of the functional stability of organizational systems. Process quality may be influenced by the stability, engagement, autonomy, and competencies of human resources, given that employees constitute key carriers of operational execution and coordination within organizational systems. Contemporary quality management approaches emphasize that human-related factors play an important role in ensuring process consistency, reliability, and operational stability [25,27].
Higher levels of employee engagement and satisfaction may be associated with lower process variability, while work autonomy may support faster and more adaptive decision-making. Conversely, excessive workload and system pressure may increase the likelihood of operational disturbances and reduce perceived process quality. These relationships indicate that the functioning of quality management systems cannot be fully separated from the performance and stability of the human resource subsystem.
From a systems perspective, human resource system performance may therefore be understood as an important condition associated with perceived process quality, process reliability, and operational coordination.
H2:
Human Resource System Performance (HRSP) is positively associated with perceived process quality and process reliability.
The Association Between Perceived Process Quality and Risk-Related Outcomes
Perceived process quality represents a systemic mechanism through which organizational systems maintain stability, coordination, and reliability. More reliable processes may reduce perceived uncertainty, support better coordination, and strengthen the capacity of the system to respond to internal and external disturbances. Empirical evidence indicates that quality management principles are associated with improved operational efficiency, greater process reliability, and lower exposure to operational disruptions [29,30].
Within this context, perceived process quality and process reliability may be understood as mechanisms linking operational activities with risk-related organizational outcomes. Stable and reliable processes can improve the predictability of organizational functioning and contribute to perceived system stability.
From a systems perspective, perceived process quality is therefore not only an operational dimension, but also an important component of organizational resilience and risk-oriented management.
H3:
Perceived process quality and process reliability are significantly associated with risk-related organizational outcomes and perceived system stability.
The Mediating Role of Perceived Process Quality
Contemporary systems-oriented perspectives indicate that the relationship between human resource systems and risk-related organizational outcomes is not exclusively direct, but may operate through intermediary mechanisms within the organizational system. Perceived process quality represents a potential mediating mechanism through which human resource system performance is associated with risk-related and quality-related outcomes.
Such an approach enables a deeper understanding of the internal dynamics of organizational systems and emphasizes the importance of connecting human resources, process quality, and risk-oriented management within an integrated analytical framework. Within this perspective, perceived process quality functions as a process-level mechanism through which work-related conditions may be associated with more stable, coordinated, and reliable organizational functioning.
Organizations characterized by more favorable human-resource-related conditions may be more likely to report higher perceived process quality and operational consistency, which in turn may be associated with more favorable risk-related outcomes. Consequently, the relationship between human resource system performance and risk-related outcomes may be more comprehensively understood through the mediating role of perceived process quality and reliability.
H4:
Perceived process quality and process reliability mediate the relationship between Human Resource System Performance (HRSP) and risk-related organizational outcomes.
Figure 1 presents the proposed integrated systems model in which Human Resource System Performance (HRSP) is associated with Organizational Risk-Related and Quality Perceptions (ORQP), both directly and indirectly through Perceived Process Quality and Reliability as a mediating mechanism. In this study, ORQP is not treated as a direct organizational-level measurement of corporate risk or formal quality performance, but as a perception-based proxy construct derived from selected ESS indicators related to institutional reliability, cooperation, process fairness, perceived management quality, and broader stability-related outcomes. The framework adopts a systems-oriented perspective and examines how selected work-related and institutional perceptions are associated within a broader organizational systems context.
4. Results
4.1. Sample Structure and Descriptive Statistics
The socio-demographic structure of the sample is presented in Table 1, providing an overview of the key characteristics of respondents included in the analysis.
The empirical analysis is based on 750 respondents from the European Social Survey Round 9 with valid responses on all selected variables included in the model. Respondents with missing values were excluded in order to ensure consistency across the applied statistical procedures. The resulting sample reflects a heterogeneous group of respondents across different socio-demographic and institutional contexts. Therefore, the results should be interpreted as evidence based on the analyzed complete-case sample rather than as direct evidence for all organizations or organizational systems.
The age structure indicates a relatively balanced distribution, with a somewhat higher share of respondents aged 55 and above. Gender distribution is also relatively balanced, with a moderate predominance of female respondents. In terms of education, the majority of respondents reported higher education qualifications, which is relevant for the analysis of work-related, institutional, and system-level perceptions. Income distribution is centered around the medium-income category, while the residence structure shows a slight predominance of urban respondents.
Regarding perception-based indicators, the results indicate differences in organizational governance interest and perceived organizational security. These variables are not interpreted as direct organizational-level measures, but as contextual indicators that provide additional insight into respondents’ perceptions of governance, security, and stability-related conditions.
Overall, the sample provides an appropriate empirical basis for examining associations between human resource system performance, perceived process quality, and risk-related organizational outcomes within a perception-based and systems-oriented analytical framework.
In order to examine the basic characteristics of the analyzed variables, descriptive statistical analysis was conducted. The results are presented in Table 2. This analysis provides an initial insight into the distribution of the selected indicators and enables the identification of dominant patterns within the dimensions of human resource system performance, perceived process quality, and risk-related organizational outcomes. All selected indicators were recoded or standardized to a common analytical scale ranging from 1 to 9 in order to ensure comparability across the examined constructs.
Descriptive indicators represent an important analytical step, as they allow the assessment of variability and distributional characteristics of the observed variables, thereby providing a basis for further correlation, regression, mediation, and exploratory factor analyses.
The results indicate a heterogeneous distribution of the selected indicators, suggesting that the analyzed sample captures different patterns of work-related, institutional, and stability-related perceptions within the examined context.
Within the Human Resource System Performance (HRSP) dimension, general satisfaction has the highest mean value, indicating a relatively favorable level of perceived stability and general satisfaction within the work-related context. In contrast, lower mean values for employee well-being and supervisory responsibility suggest that certain aspects of the human-resource-related subsystem are less pronounced in the analyzed sample.
Moderate levels of job autonomy and work engagement indicate that respondents report a partial degree of flexibility and participation in work-related or organizational decision-making processes. From a systems perspective, these indicators may be interpreted as relevant elements of the human subsystem, since autonomy, engagement, and participation can influence coordination, adaptability, and perceived process reliability.
Within the Organizational Risk-Related and Quality Perceptions (ORQP) dimension, the results show moderate to relatively high values across the selected indicators. Higher mean values for institutional reliability and economic/system stability suggest that respondents perceive a certain degree of predictability and stability in the broader institutional and socio-economic environment. At the same time, moderate values of interpersonal trust, process fairness, cooperation orientation, and perceived governance quality indicate that risk-related perceptions are not uniform across the analyzed dimensions.
These descriptive findings should not be interpreted as direct evidence of formal organizational risk, objective process quality, or corporate performance. Rather, they provide an initial overview of perception-based indicators that are used in this study as proxies for examining associations between human resource system performance, perceived process quality, and risk-related organizational outcomes.
Overall, the descriptive results provide an empirical basis for further correlation, regression, mediation, and exploratory factor analyses. They support the assumption that human-resource-related conditions, process-related perceptions, and broader stability-related outcomes may be interrelated within a systems-oriented analytical framework.
4.2. Correlation Analysis
To examine the relationships between the analyzed variables, Pearson correlation analysis was conducted. This method enabled the identification of the direction and strength of linear associations between Human Resource System Performance (HRSP) indicators and Organizational Risk-Related and Quality Perceptions (ORQP). Correlation analysis represents an important preliminary step in the empirical assessment, as it provides initial evidence of associations among the observed constructs within the proposed systems-oriented model.

Table 3.
Correlations between HRSP and ORQP variables.
| Variable | ORQP1 | ORQP2 | ORQP3 | ORQP4 | ORQP5 | ORQP6 |
| HRSP1 | 0.270** | 0.325** | 0.223** | 0.316** | 0.274** | 0.410** |
| HRSP2 | 0.093* | 0.105** | 0.133** | 0.050 | 0.128** | 0.092* |
| HRSP3 | 0.127** | 0.148** | 0.092* | 0.146** | 0.125** | 0.186** |
| HRSP4 | 0.123** | 0.110** | 0.133** | 0.089* | 0.120** | 0.045 |
| HRSP5 | 0.094* | 0.086* | 0.105** | 0.047 | 0.134** | 0.072* |
| HRSP6 | 0.232** | 0.227** | 0.208** | 0.132** | 0.147** | 0.157** |
*Pearson correlation coefficients are reported. Statistical significance is indicated as follows: *p<0.05; **p<0.01.
The results reveal a consistent pattern of positive associations between HRSP indicators and ORQP dimensions, providing preliminary support for the proposed integrated systems model. Although the strength of the correlations varies across indicators, the overall direction of the relationships suggests that more favorable human-resource-related conditions are generally associated with more favorable risk-related and quality-related perceptions.
General satisfaction (HRSP1) shows the strongest and most consistent correlation pattern across all ORQP dimensions. The strongest association is observed with ORQP6, indicating that higher levels of general satisfaction are associated with more favorable perceptions of broader system and economic stability. HRSP1 is also positively associated with interpersonal trust, process fairness, institutional reliability, and perceived governance quality, suggesting that general satisfaction may represent an important work-related indicator within the broader systems framework.
Work engagement (HRSP6) also demonstrates consistent positive associations with all ORQP dimensions. This finding suggests that participation and influence in organizational decision-making may be associated with more favorable perceptions of cooperation, process reliability, and system stability. From a systems perspective, this supports the assumption that active involvement within the human subsystem may be linked to more stable and coordinated system-level perceptions.
Job autonomy (HRSP3) shows weaker but generally significant positive associations with ORQP dimensions, indicating its potential role as a work-related resource connected with flexibility, adaptability, and perceived process reliability. Workload intensity (HRSP4) and supervisory responsibility (HRSP5) show weaker and less consistent associations, suggesting that these indicators may have a more limited or context-dependent relationship with risk-related and quality-related perceptions.
Employee well-being (HRSP2), although statistically significant in some cases, does not demonstrate a uniform correlation pattern across all ORQP dimensions. This may indicate that its relationship with system-level perceptions is weaker or potentially mediated through other work-related indicators, such as satisfaction, autonomy, or engagement.
Table 4.
Intercorrelations among Organizational Risk-Related and Quality Perceptions (ORQP).
| Variable | ORQP1 | ORQP2 | ORQP3 | ORQP4 | ORQP5 | ORQP6 |
| ORQP1 | 1 | |||||
| ORQP2 | 0.608** | 1 | ||||
| ORQP3 | 0.524** | 0.579** | 1 | |||
| ORQP4 | 0.392** | 0.390** | 0.426** | 1 | ||
| ORQP5 | 0.364** | 0.360** | 0.407** | 0.649** | 1 | |
| ORQP6 | 0.367** | 0.423** | 0.387** | 0.415** | 0.441** | 1 |
All correlations are significant at p<0.01.
The results indicate statistically significant intercorrelations among all ORQP dimensions. This pattern suggests that the selected ORQP indicators may function as an integrated perception-based construct rather than as fully independent dimensions. The strongest correlation is observed between institutional reliability and perceived governance quality, indicating that perceptions of institutional stability are closely associated with perceptions of governance and decision-making quality.
Strong correlations are also observed among interpersonal trust, process fairness, and cooperation orientation. These relationships emphasize the importance of trust, fairness, and cooperation as interconnected elements of perceived system stability. From a systems perspective, such interdependence suggests that relational and institutional perceptions may jointly shape broader risk-related and quality-related outcomes.
The observed intercorrelations support the interpretation of ORQP as a multidimensional, perception-based construct reflecting system cohesion, process fairness, cooperation, institutional reliability, perceived governance quality, and broader stability-related perceptions. These findings do not imply direct measurement of formal corporate risk or objective quality performance. Rather, they provide empirical support for treating ORQP as a proxy construct within the proposed systems-oriented analytical framework..
4.3. Regression Analysis
To assess the extent to which Human Resource System Performance (HRSP) indicators are associated with variations in Organizational Risk-Related and Quality Perceptions (ORQP), multiple regression analysis was conducted. This approach enables the estimation of the individual contribution of each HRSP indicator, as well as the overall explanatory capacity of the proposed systems-oriented model.
Table 5.
Results of Multiple Regression Analysis Between HRSP and ORQP Indicators.
| Variables | ORQP1 | ORQP2 | ORQP3 | ORQP4 | ORQP5 | ORQP6 |
| HRSP1 | 0.230* | 0.290* | 0.190* | 0.290* | 0.250* | 0.380* |
| HRSP2 | 0.010 | 0.030 | 0.060 | -0.010 | 0.050 | 0.050 |
| HRSP3 | 0.050 | 0.070 | 0.020 | 0.080* | 0.050 | 0.100* |
| HRSP4 | 0.090* | 0.070 | 0.080* | 0.080 | 0.050 | -0.020 |
| HRSP5 | 0.010 | 0.000 | 0.000 | -0.010 | 0.070 | 0.040 |
| HRSP6 | 0.180* | 0.170* | 0.160* | 0.080* | 0.080* | 0.080* |
| R² | 0.120 | 0.150 | 0.100 | 0.120 | 0.110 | 0.190 |
| F (6,743) | 17.53 | 22.12 | 13.43 | 16.68 | 14.92 | 29.45 |
| p-value | <0.001 | <0.001 | <0.001 | <0.001 | <0.001 | <0.001 |
*Standardized regression coefficients are reported. Statistical significance is indicated as follows: p<0.05.
The results indicate that all regression models are statistically significant (p < 0.001), providing empirical support for the proposed integrated systems framework. The coefficients of determination (R²) range from 0.10 to 0.19, suggesting that HRSP indicators explain between 10% and 19% of the variance in ORQP dimensions. Although these values are moderate, they are acceptable within complex socio-organizational and perception-based research contexts, where outcomes are influenced by multiple interacting human, process-related, institutional, and environmental factors.
The highest explanatory power is observed for the economic/system stability dimension (ORQP6), where the model explains approximately 19% of the variance. This finding suggests that human-resource-related indicators are most strongly associated with broader stability-related perceptions. Within a systems-oriented framework, this result indicates that perceived stability may be linked not only to institutional and economic conditions, but also to work-related characteristics of the human subsystem.
Among the predictors, general satisfaction (HRSP1) emerges as the most consistent predictor across all models. Its strongest association is observed in relation to ORQP6 (β = 0.38), indicating that higher levels of general satisfaction are associated with more favorable perceptions of system and economic stability. HRSP1 also shows statistically significant associations with all other ORQP dimensions, suggesting that general satisfaction represents an important human-resource-related indicator within the proposed systems model.
Work engagement (HRSP6) also demonstrates a consistent statistically significant association across all ORQP dimensions. This finding indicates that participation and influence in organizational decision-making may be associated with more favorable perceptions of trust, cooperation, process fairness, institutional reliability, governance quality, and broader system stability. From a systems perspective, this supports the assumption that active involvement within the human subsystem may be linked to more favorable risk-related and quality-related perceptions.
Job autonomy (HRSP3) shows selective but meaningful effects, particularly in relation to institutional reliability and economic/system stability. This suggests that autonomy may function as an enabling work-related resource associated with flexibility, adaptability, and perceived system reliability. In contrast, employee well-being (HRSP2) and supervisory responsibility (HRSP5) do not show statistically significant direct effects in most models, suggesting that their associations with ORQP dimensions may be weaker, indirect, or context-dependent.
Workload intensity (HRSP4) shows limited and inconsistent effects across the models. Although it is statistically significant in relation to selected ORQP dimensions, its overall role appears less stable than that of general satisfaction and work engagement. This indicates that not all HRSP indicators contribute equally to explaining risk-related and quality-related perceptions.
Overall, the regression results indicate that HRSP indicators are differentially associated with ORQP outcomes, thereby providing empirical support for Hypothesis H1. The findings suggest that general satisfaction and work engagement are the most consistent human-resource-related indicators within the proposed model, while autonomy, workload intensity, well-being, and supervisory responsibility show more selective or weaker associations.
These results are consistent with the proposed integrated systems model, which conceptualizes HRSP as a human subsystem associated with risk-related and quality-related perceptions. However, the findings should be interpreted as evidence of statistical association within a cross-sectional and perception-based proxy framework, rather than as proof of direct causal effects or objective organizational risk reduction.
4.4. Mediation Analysis
In order to examine the mediating role of perceived process quality and reliability in the relationship between Human Resource System Performance (HRSP) and Organizational Risk-Related and Quality Perceptions (ORQP), mediation analysis was conducted using a hierarchical regression approach.
This approach enabled the assessment of direct and indirect association patterns within the proposed systems-oriented model. The mediation procedure followed a stepwise approach: first, the direct association between HRSP and ORQP was examined; second, the association between HRSP and perceived process quality and reliability was tested; third, the association between perceived process quality and reliability and ORQP was assessed; and finally, the change in the direct HRSP–ORQP association was examined after the inclusion of the mediator.
The mediation results indicate that Human Resource System Performance (HRSP) is positively associated with Perceived Process Quality and Reliability (β = 0.41, p < 0.05), while Perceived Process Quality and Reliability is positively associated with Organizational Risk-Related and Quality Perceptions (ORQP) (β = 0.48, p < 0.05). The direct association between HRSP and ORQP decreased from β = 0.30 before the inclusion of the mediator to β = 0.22 after the inclusion of Perceived Process Quality and Reliability, while remaining statistically significant. This reduction suggests the presence of a partial mediation pattern.
The indirect association of HRSP with ORQP through Perceived Process Quality and Reliability was positive (β = 0.20), while the total association amounted to β = 0.42. This pattern indicates that part of the relationship between HRSP and ORQP may operate through perceived process quality and reliability.
Therefore, the results provide support for Hypothesis H4. However, since the analysis is based on cross-sectional data and perception-based proxy indicators, the mediation findings should be interpreted as evidence of an indirect association pattern rather than as proof of causal influence at the organizational level. The presence of partial mediation suggests that both direct and indirect pathways are relevant within the proposed organizational systems model.
Figure 2 presents the mediation model results, illustrating the direct and indirect associations between Human Resource System Performance (HRSP), Perceived Process Quality and Reliability, and Organizational Risk-Related and Quality Perceptions (ORQP).
Figure 2 presents the mediation model in which Human Resource System Performance (HRSP) is associated with Organizational Risk-Related and Quality Perceptions (ORQP) both directly and indirectly through Perceived Process Quality and Reliability as a mediating construct. The direct association between HRSP and ORQP remains statistically significant after the inclusion of the mediator, although its magnitude is reduced, suggesting a partial mediation pattern.
The indirect pathway indicates that higher levels of HRSP may be associated with more favorable ORQP outcomes through higher perceived process quality and reliability. In this model, perceived process quality is treated as a mediating construct, while ORQP is treated as an integrated perception-based outcome construct derived from selected ESS indicators. Therefore, the model should be interpreted as evidence of association and partial mediation within a perception-based proxy framework, rather than as proof of direct causal effects or objective organizational risk reduction.
4.5. Factor Analysis
To examine the latent structure of the analyzed indicators and provide exploratory support for the proposed systems-oriented model, exploratory factor analysis was conducted using the Principal Component Analysis (PCA) method.
Prior to extraction, the suitability of the data for factor analysis was assessed. The Kaiser-Meyer-Olkin (KMO) measure of sampling adequacy was 0.815, indicating a satisfactory level of sampling adequacy. Bartlett’s test of sphericity was statistically significant (χ² = 2499.877; df = 66; p < 0.001), confirming the presence of sufficient correlations among the selected indicators.
The results presented in Table 6 indicate that the first two retained components jointly explain 47.40% of the total variance. The first component accounts for 31.18% of the variance, while the second explains 16.22%. Although the third component shows an eigenvalue slightly above 1.00, a two-component solution was retained because it provides a clearer and theoretically more meaningful distinction between risk-related and quality perception indicators on the one hand and selected human-resource-related indicators on the other. Therefore, the factor solution should be interpreted as theoretically guided and exploratory rather than as a definitive validation of the measurement model.
Table 7.
Component Matrix of HRSP and ORQP Indicators.
| Variable | Component 1 | Component 2 |
| HRSP1 | 0.511 | - |
| HRSP2 | - | 0.731 |
| HRSP3 | <0.30 | <0.30 |
| HRSP4 | - | 0.738 |
| HRSP5 | - | 0.798 |
| HRSP6 | 0.368 | - |
| ORQP1 | 0.713 | - |
| ORQP2 | 0.743 | - |
| ORQP3 | 0.719 | - |
| ORQP4 | 0.698 | - |
| ORQP5 | 0.697 | - |
| ORQP6 | 0.670 | - |
| Extraction Method: Principal Component Analysis. Two components were extracted. | ||
Note: Only factor loadings above 0.30 are reported as salient. HRSP3 did not show a salient loading above the reporting threshold.
The component matrix indicates a partial differentiation between two broad latent dimensions. The first component is predominantly defined by ORQP indicators, with salient loadings ranging from 0.670 to 0.743. This suggests a cohesive perception-based dimension related to interpersonal trust, process fairness, cooperation orientation, institutional reliability, perceived governance quality, and broader economic/system stability.
The second component is primarily characterized by selected HRSP indicators, particularly employee well-being, workload intensity, and supervisory responsibility, which show salient loadings above 0.70. This component reflects work-related and human-resource-related characteristics of the analyzed respondents. Job autonomy did not show a salient loading above the reporting threshold, suggesting that this indicator may represent a more independent aspect of work organization and should be interpreted with caution.
General satisfaction and work engagement show moderate associations with the broader system-level component. This finding suggests that these indicators may have an integrative role, linking human-resource-related conditions with broader risk-related and quality-related perceptions. However, the factor structure does not provide full confirmation of a strict measurement separation between HRSP and ORQP indicators.
Overall, the exploratory factor analysis provides preliminary support for the interpretation of the selected variables as two broadly meaningful dimensions within the proposed systems-oriented framework. However, the results should be interpreted cautiously, since the explained variance is moderate and the constructs are based on perception-based proxy indicators rather than direct organizational-level measures. Therefore, the factor analysis should be understood as an exploratory structural assessment, not as definitive validation of the measurement mode.
5. Discussion
5.1. Main Findings
The primary objective of this study was to examine the relationships between Human Resource System Performance (HRSP), perceived process quality and reliability, and Organizational Risk-Related and Quality Perceptions (ORQP) within an integrated systems-oriented framework. The empirical findings provide support for the proposed model and suggest that the examined human-resource-related, process-related, and risk-related perception indicators are interconnected within broader organizational systems.
The results of the correlation and regression analyses provide support for Hypothesis H1, indicating that HRSP indicators are statistically associated with ORQP dimensions. Among the examined predictors, general satisfaction (HRSP1) and work engagement (HRSP6) emerged as the most consistent indicators associated with ORQP outcomes. This finding is consistent with previous research emphasizing the relevance of employee satisfaction, engagement, and perceived HR practices for organizational effectiveness, stability, and performance-related outcomes [4,7]. Respondents reporting higher levels of general satisfaction and work engagement also tended to report more favorable indicators of trust, fairness, institutional reliability, perceived governance quality, and broader system stability.
The findings also provide support for Hypothesis H2, as HRSP indicators were positively associated with perceived process quality and reliability. In particular, general satisfaction, job autonomy, and work engagement were linked to more favorable perceptions of process stability, cooperation, and system reliability. From a systems perspective, this suggests that human-resource-related conditions may represent an important subsystem associated with the perceived quality and consistency of organizational processes. These findings are also consistent with strategic HRM perspectives, which emphasize that human resources contribute to organizational reliability and performance through competencies, motivation, engagement, and work-related conditions [6,12,13].
Hypothesis H3 is also supported, as perceived process quality and reliability were significantly associated with ORQP dimensions. The results suggest that higher levels of perceived cooperation, institutional reliability, process fairness, and perceived governance quality are linked to more favorable risk-related and quality-related perceptions. This supports the assumption that process-related mechanisms represent an important component of perceived system stability and risk-oriented organizational functioning. Such an interpretation is in line with studies emphasizing the role of quality management, process reliability, and risk-based thinking in strengthening organizational stability and reducing exposure to operational disturbances [24,25,26,29,30].
The mediation analysis additionally provides support for Hypothesis H4. The findings suggest that perceived process quality and reliability may function as a partial mediating mechanism through which HRSP is associated with ORQP dimensions. The reduction of the direct HRSP–ORQP association after the inclusion of the mediator indicates that the relationship operates through both direct and indirect pathways. This interpretation is consistent with systems-oriented approaches, according to which organizational outcomes emerge from the interaction of human, process-related, managerial, and institutional components rather than from isolated organizational factors.
The results of the exploratory factor analysis provide preliminary support for the structural interpretation of the proposed model. The findings suggest the existence of two broad and theoretically meaningful dimensions: one predominantly related to ORQP indicators and another related to selected HRSP indicators. The first component was mainly defined by interpersonal trust, process fairness, cooperation orientation, institutional reliability, perceived governance quality, and economic/system stability. This indicates that ORQP may be interpreted as an integrated perception-based construct reflecting system cohesion, process reliability, institutional confidence, and broader stability-related perceptions. Similar conclusions have been emphasized in studies examining the integration of risk management, quality management, and sustainability-oriented organizational frameworks [37,39].
At the same time, the factor analysis should be interpreted cautiously. The results do not provide definitive validation of a strict measurement model, particularly because the constructs are based on perception-based proxy indicators rather than direct organizational-level measures. Nevertheless, the factor structure provides exploratory evidence that the selected indicators form broadly interpretable dimensions within the proposed systems-oriented framework.
Taken together, the findings suggest that risk-related organizational outcomes should not be interpreted as isolated phenomena. Rather, they may be understood as multidimensional and perception-based outcomes associated with the interaction between human resource system performance, perceived process quality, institutional reliability, cooperation, and broader stability-related conditions. The integrated model developed in this study therefore provides a useful framework for understanding how human-resource-related conditions and process-level mechanisms may be associated with perceived system stability, reliability, and risk-oriented organizational management.
5.2. Theoretical Implications
This study contributes to the existing literature by offering an integrated systems-oriented perspective on the relationship between human resource system performance, perceived process quality, and risk-related organizational outcomes. By bringing these dimensions into a unified analytical framework, the study responds to the need for a more comprehensive understanding of how human, process-related, and risk-related factors interact within contemporary organizational systems.
The proposed framework extends previous organizational research by suggesting that risk-related outcomes may be understood as systemic and multidimensional phenomena. Rather than being interpreted only as isolated operational or financial issues, risk-related perceptions are approached as outcomes associated with the interaction between human resource systems, process quality, institutional reliability, perceived governance quality, and broader system stability. This perspective is consistent with systems-oriented approaches to organizational management, which emphasize interdependence among organizational subsystems and the importance of integrated management mechanisms.
An additional theoretical contribution lies in the role assigned to perceived process quality and reliability. The findings suggest that these dimensions may function as mediating mechanisms through which HRSP is associated with ORQP outcomes. In this sense, the relationship between human resource system performance and risk-related perceptions may be partly explained through process-level mechanisms connected with operational stability, coordination, reliability, and adaptability. This interpretation is consistent with research emphasizing the importance of quality management, risk-based thinking, and integrated management systems in contemporary organizations [24,25,26].
The study also contributes methodologically by combining correlation analysis, regression analysis, mediation analysis, and exploratory factor analysis within a single empirical framework. This combination of methods provides a broader analytical basis for examining the proposed relationships and offers preliminary empirical support for the integrated systems model. However, the methodological contribution should be interpreted within the limitations of the study, particularly the use of cross-sectional data and perception-based proxy indicators derived from the European Social Survey.
5.3. Practical and Managerial Implications
The findings of this study offer practical implications for organizational managers, policymakers, and decision-makers concerned with organizational stability, process reliability, and risk-oriented management. The results suggest that human-resource-related conditions, particularly general satisfaction, work engagement, autonomy, and participation in decision-making, may be associated with more favorable perceptions of process quality, cooperation, institutional reliability, and system stability.
From a managerial perspective, these findings indicate that organizations should not treat human resource systems as isolated administrative functions. Instead, HR systems should be understood as strategic subsystems that interact with process quality mechanisms and broader risk-related organizational outcomes. Strengthening employee satisfaction, engagement, autonomy, and participation may contribute to better coordination, improved process reliability, and more favorable perceptions of organizational stability.
The findings also indicate that perceived process quality should be treated as a strategic systemic mechanism rather than solely as an operational performance indicator. Organizations with more reliable, consistent, and coordinated processes may be better positioned to reduce uncertainty, limit operational variability, and strengthen resilience under conditions of environmental complexity and change. This supports the importance of integrating human resource management, quality management, and risk-oriented management practices within a unified organizational framework.
Finally, the proposed model may be useful for organizations seeking to develop more adaptive and resilient management systems. By aligning human-resource-related conditions with process quality and risk-oriented management mechanisms, organizations may improve their capacity to maintain stable and reliable functioning in dynamic environments. However, the practical implications should be interpreted cautiously, since the study is based on perception-based indicators rather than direct organizational performance or corporate risk measures.
6. Conclusions
This study provides evidence that Human Resource System Performance (HRSP) is significantly associated with Organizational Risk-Related and Quality Perceptions (ORQP), particularly through perceived process quality and reliability. The empirical findings suggest that more favorable human-resource-related indicators, especially general satisfaction and work engagement, are linked to more favorable perceptions of system stability, process reliability, cooperation, institutional reliability, and broader stability-related outcomes.
The results further indicate that risk-related organizational outcomes should not be interpreted exclusively as the consequence of external uncertainty, but also as perception-based outcomes associated with internal system conditions and process-level mechanisms. Within this context, perceived process quality and reliability emerge as important mediating mechanisms through which human-resource-related conditions may be associated with broader risk-related and quality-related perceptions.
The integrated systems model proposed in this study provides a useful analytical framework for understanding the relationships between human, process-related, and institutional dimensions within organizational systems. By identifying both direct and indirect association patterns, the study emphasizes the importance of adopting systems-oriented approaches to organizational management, particularly in contexts characterized by complexity, uncertainty, and interdependence among organizational subsystems.
From a practical perspective, the findings suggest that organizations seeking to strengthen system stability and risk-oriented management should consider the role of human resource systems alongside continuous improvements in process quality and reliability. Particular emphasis should be placed on general satisfaction, work engagement, autonomy, and participation in decision-making, given their association with perceived process stability and risk-related outcomes.
This study contributes to systems-oriented organizational research by showing how human resource system performance, perceived process quality, and risk-related perceptions may be interconnected within an integrated analytical framework. However, the findings should be interpreted as perception-based evidence derived from secondary survey data, rather than as direct measurement of formal HR systems, objective process quality, or corporate risk.
7. Research Limitations and Future Research Directions
Despite its theoretical and empirical contributions, this study has several limitations that should be acknowledged. First, the use of cross-sectional data limits the possibility of establishing definitive causal relationships between the examined variables. Although the applied analyses provide evidence of statistical association and partial mediation patterns, longitudinal research would be necessary to examine causal dynamics and temporal relationships among HRSP, perceived process quality, and risk-related organizational outcomes.
Second, the study is based on self-reported and perception-based indicators. Such indicators are useful for examining perceptions of satisfaction, trust, cooperation, institutional reliability, and stability-related conditions; however, they may also introduce subjective bias. In addition, selected ESS indicators were used as proxy measures of human resource system performance, perceived process quality, and risk-related outcomes. Since the ESS dataset does not contain direct organizational-level measures of formal HR systems, objective process quality, or corporate risk, the findings should be interpreted as perception-based evidence rather than as direct measurement of organizational systems.
Third, although the analyzed data provide insight into work-related and socio-institutional perceptions, the study does not explicitly model sectoral, organizational, or country-level differences. Institutional and contextual differences between economic, regulatory, and organizational environments may influence the examined relationships. Therefore, caution should be exercised when generalizing the findings across different institutional, cultural, and organizational contexts.
Future research should focus on longitudinal and comparative studies that can more precisely capture the development of relationships between human resource systems, perceived process quality, and risk-related outcomes over time. Further studies should also include primary organizational data, sector-specific samples, and objective performance indicators in order to strengthen the empirical validation of the proposed systems-oriented framework. In addition, future research may examine high-risk industries, where the interaction between human resource systems, process reliability, and risk-oriented management mechanisms may be more visible. The integration of financial, operational, and non-financial performance indicators could contribute to the development of more comprehensive organizational systems models.
Author Contributions
Conceptualization, M.Lj.C.; Methodology, M.Lj.C.; Data curation, M.Lj.C.; Software, M.Lj.C. and M.N.C.; Investigation, M.Lj.C and B.M.; Resources, M.N.C, M.Lj.C. and Ž.P.; Writing - original draft preparation, M.Lj.C.; Validation, Ž.P.; Writing - review and editing, M.Lj.C. and Ž.P.; Visualization, B.M. and M.N.C; Supervision, Ž.P. and M.N.C; Project administration, M.Lj.C. and M.N.C. All authors have read and agreed to the published version of the manuscript.
Funding
This research received no external funding.
Institutional Review Board Statement
Not applicable. This study is based on secondary analysis of anonymized data obtained from the European Social Survey, Round 9, and did not involve new data collection conducted by the authors.
Informed Consent Statement
Not applicable for this secondary analysis. Informed consent was obtained within the original European Social Survey data collection procedures.
Data Availability Statement
The data used in this study are publicly available from the European Social Survey, Round 9 database.
Conflicts of Interest
The authors declare no conflict of interest.
References
- Teece, D. J. Business models and dynamic capabilities. Long. Range Plan. 2018, Volume 51(1), 40–49. [Google Scholar] [CrossRef]
- International Organization for Standardization. ISO 9001:2015 Quality management systems - Requirements. ISO, 2015.
- International Organization for Standardization. ISO 31000:2018 Risk management - Guidelines. ISO, 2018.
- Albrecht, S. L.; Bakker, A. B.; Gruman, J. A.; Macey, W. H.; Saks, A. M. Employee engagement, human resource management practices and competitive advantage: An integrated approach. J. Organ. Eff. People Perform. 2015, Volume 2(1), 7–35. [Google Scholar] [CrossRef]
- Cooke, F. L.; Schuler, R.; Varma, A. Human resource management research and practice in Asia: Past, present and future. Hum. Resour. Manag. Rev. 2020, Volume 30(4), 100778. [Google Scholar] [CrossRef]
- Wright, P. M.; Ulrich, M. D. A road well traveled: The past, present, and future journey of strategic human resource management. Annu. Rev. Organ. Psychol. Organ. Behav. 2017, Volume 4, 45–65. [Google Scholar] [CrossRef]
- Jiang, K.; Hu, J. I. A.; Liu, S.; Lepak, D. P. Understanding employees’ perceptions of human resource practices: Effects of demographic dissimilarity to managers and coworkers. Hum. Resour. Manag. 2017, Volume 56(1), 69–91. [Google Scholar] [CrossRef]
- Dyllick, T.; Muff, K. Clarifying the meaning of sustainable business: Introducing a typology from business-as-usual to true business sustainability. Organ. Environ. 2016, Volume 29(2), 156–174. [Google Scholar] [CrossRef]
- European Social Survey European Research Infrastructure (ESS ERIC). European Social Survey (ESS), Round 9 - 2018. Data file edition 3.1. [CrossRef]
- Sony, M.; Naik, S. S. Ten lessons for managers while implementing Industry 4.0. IEEE Eng. Manag. Rev. 2019, 47(2), 45–52. [Google Scholar] [CrossRef]
- Senge, P. M. The fifth discipline: The art and practice of the learning organization . Broadway Business 2006. [Google Scholar]
- Jiang, K.; Lepak, D. P.; Hu, J.; Baer, J. C. How does human resource management influence organizational outcomes? A meta-analytic investigation of mediating mechanisms. Acad. Manag. J. 2012, Volume 55(6), 1264–1294. [Google Scholar] [CrossRef]
- Delery, J. E.; Roumpi, D. Strategic human resource management, human capital and competitive advantage: is the field going in circles? Hum. Resour. Manag. J. 2017, 27(1), 1–21. [Google Scholar] [CrossRef]
- Bakker, A. B.; Demerouti, E. Job demands–resources theory: Taking stock and looking forward. J. Occup. Health Psychol. 2017, Volume 22(3), 273. [Google Scholar] [CrossRef]
- Lesener, T.; Gusy, B.; Wolter, C. The job demands-resources model: A meta-analytic review of longitudinal studies. Work Stress 2019, Volume 33(1), 76–103. [Google Scholar] [CrossRef]
- Diener, E.; Oishi, S.; Tay, L. Advances in subjective well-being research. Nat. Hum. Behav. 2018, Volume 2(4), 253–260. [Google Scholar] [CrossRef] [PubMed]
- Schaufeli, W. B. Applying the Job Demands-Resources model: A ‘how to’guide to measuring and tackling work engagement and burnout. Organ. Dyn. 2017, Volume 46(2), 120–132. [Google Scholar] [CrossRef]
- Farooq, F.; Mohammad, S. S.; Nazir, N. A.; Shah, P. A. Happiness at work: a systematic literature review. Int. J. Organ. Anal. 2024, Volume 32(10), 2236–2255. [Google Scholar] [CrossRef]
- Rugulies, R.; Aust, B.; Greiner, B. A.; Arensman, E.; Kawakami, N.; LaMontagne, A. D.; Madsen, I. EWork-related causes of mental health conditions and interventions for their improvement in workplaces. The Lancet 2023, Volume 402(10410), 1368–1381. Available online: https://www.thelancet.com/journals/lancet/article/PIIS0140-6736(23)00869-3/fulltext.
- Parker, S. K.; Van den Broeck, A.; Holman, D. Work design influences: A synthesis of multilevel factors that affect the design of jobs. Acad. Manag. Ann. 2017, Volume 11(1), 267–308. [Google Scholar] [CrossRef]
- Ohly, S.; Venz, L. Work design and performance. In Transformative Work Design: Synthesis and New Directions; Oxford University Press, 2025; pp. 147–174. [Google Scholar]
- Fonseca, L.; Domingues, J. P. ISO 9001: 2015 edition-management, quality and value. Int. J. Qual. Res. 2017, Volume 11(1), 149–158. [Google Scholar] [CrossRef]
- Aven, T. Risk assessment and risk management: Review of recent advances on their foundation. Eur. J. Oper. Res. 2016, Volume 253(1), 1–13. [Google Scholar] [CrossRef]
- Zeng, H. B.; He, Y.; Wu, M.; She, J. New results on stability analysis for systems with discrete distributed delay. Automatica 2015, Volume 60, 189–192. [Google Scholar] [CrossRef]
- Antony, J.; Sunder M, V.; Sreedharan, R.; Chakraborty, A.; Gunasekaran, A. A systematic review of Lean in healthcare: a global prospective. Int. J. Qual. Reliab. Manag. 2019, Volume 36(8), 1370–1391. [Google Scholar] [CrossRef]
- Ispas, L.; Mironeasa, C.; Silvestri, A. Risk-based approach in the implementation of integrated management systems: a systematic literature review. Sustainability 2023, Volume 15(13), 10251. [Google Scholar] [CrossRef]
- Dahlgaard-Park, S. M.; Reyes, L.; Chen, C. K. The evolution and convergence of total quality management and management theories. Total Qual. Manag. Bus. Excell. 2018, Volume 29(9-10), 1108–1128. [Google Scholar] [CrossRef]
- Oakland, J. S. Total quality management and operational excellence: text with cases; Routledge, 2014. [Google Scholar] [CrossRef]
- Psomas, E.; Antony, J. Total quality management elements and results in higher education institutions: The Greek case. Qual. Assur. Educ. 2017, Volume 25(2), 206–223. [Google Scholar] [CrossRef]
- Sunder M, V.; Mahalingam, S.; Krishna M, S. N. Improving patients’ satisfaction in a mobile hospital using Lean Six Sigma–a design-thinking intervention. Prod. Plan. Control 2020, Volume 31(6), 512–526. [Google Scholar] [CrossRef]
- Kaynak, H. Measuring organisational effectiveness and business performance in firms implementing total quality management. Int. J. Manuf. Technol. Manag. 2006, Volume 8(4), 355–381. [Google Scholar] [CrossRef]
- Issah, O.; Bluwey, E.; Ackah, D. Total quality management practices, organisational culture and firm performance; service or product innovation. Afr. J. Procure. Logist. Supply Chain Manag. 2024, Volume 7(9), 135–175. [Google Scholar] [CrossRef]
- Navarro, G.; Naranjo, G. Quality culture, quality management, and organizational performance: A structural model for the manufacturing sector. Sustainability 2025, Volume 17(9), 3934. [Google Scholar] [CrossRef]
- Pawanr, S.; Sarmah, P.; Gupta, K. TQM implementation for enhancement of product and service quality: a review on developments and latest trends. J. Appl. Res. Technol. Eng. 2025, Volume 6(1), 63–72. [Google Scholar] [CrossRef]
- Udofia, E. E.; Ekpudu, J. E. Effect of total quality management on organisational productivity and market. Mod. Manag. Rev. 2025, Volume 30(3), 101–116. [Google Scholar] [CrossRef]
- Andiantoro, T. N.; Igirisa, I.; Tui, F. P. D. Organizational Performance Assessment of Search and Rescue Teams: A Collaboration Between Technical Aspects and Service Quality. J. Public Represent. Soc. Provis. 2026, Volume 6(1), 88–101. [Google Scholar] [CrossRef]
- Yazo-Cabuya, E. J.; Ibeas, A.; Herrera-Cuartas, J. A. Integration of sustainability in risk management and operational excellence through the VIKOR method considering comparisons between multi-criteria decision-making methods. Sustainability 2024, Volume 16(11), 4585. [Google Scholar] [CrossRef]
- Moreira, A.; Rodrigues, A. C.; Ferreira, M. R. Where is human resource management in sustainability reporting? ESG and GRI perspectives. Sustainability 2025, Volume 17(7), 3033. [Google Scholar] [CrossRef]
- Abdellattif, D. H. E.; Nomer, A. R. M.; Eldawayaty, D. M. A. Sustainability Risk Management and Financial Distress: The Moderating Role of Financial Performance in Saudi Firms. Sustainability 2025, Volume 17(21), 9401. [Google Scholar] [CrossRef]
- Tarí, J. J.; Molina-Azorín, J. F.; Heras, I. Benefits of the ISO 9001 and ISO 14001 standards: A literature review. J. Ind. Eng. Manag. (JIEM) 2012, Volume 5(2), 297–322. [Google Scholar] [CrossRef]
- Colquitt, J. A.; Rodell, J. B. Justice, trust, and trustworthiness: A longitudinal analysis integrating three theoretical perspectives. Acad. Manag. J. 2011, Volume 54(6), 1183–1206. [Google Scholar] [CrossRef]
- Fulmer, C. A.; Gillespie, N.; Ferrin, D. L.; Denison, E. 13 Culture and Trust in Organizational Contexts. Oxf. Handb. Cross-Cult. Organ. Behav. 2024, 321. [Google Scholar] [CrossRef]
- Bachmann, R.; Gillespie, N.; Priem, R. Repairing trust in organizations and institutions: Toward a conceptual framework. Organ. Stud. 2015, Volume 36(9), 1123–1142. [Google Scholar] [CrossRef]
- Balliet, D.; Van Lange, P. A. Trust, conflict, and cooperation: a meta-analysis. Psychol. Bull. 2013, Volume 139(5), 1090. Available online: https://psycnet.apa.org/buy/2012-32964-001. [CrossRef]
- Acemoglu, D.; Robinson, J. A. Response to Sheri Berman’s Review of The Narrow Corridor: States, Societies, and the Fate of Liberty. Perspect. Politics 2020, Volume 18(3), 905–906. [Google Scholar] [CrossRef]
- Siems, M. A law-and-finance perspective on capital markets. In Research Handbook on Global Capital Markets Law; Edward Elgar Publishing, 2023; pp. 12–25. [Google Scholar] [CrossRef]
Figure 1.
Integrated Systems Model of Human Resource System Performance, Perceived Process Quality and Reliability, and Risk-Related Organizational Outcomes.
Figure 1.
Integrated Systems Model of Human Resource System Performance, Perceived Process Quality and Reliability, and Risk-Related Organizational Outcomes.
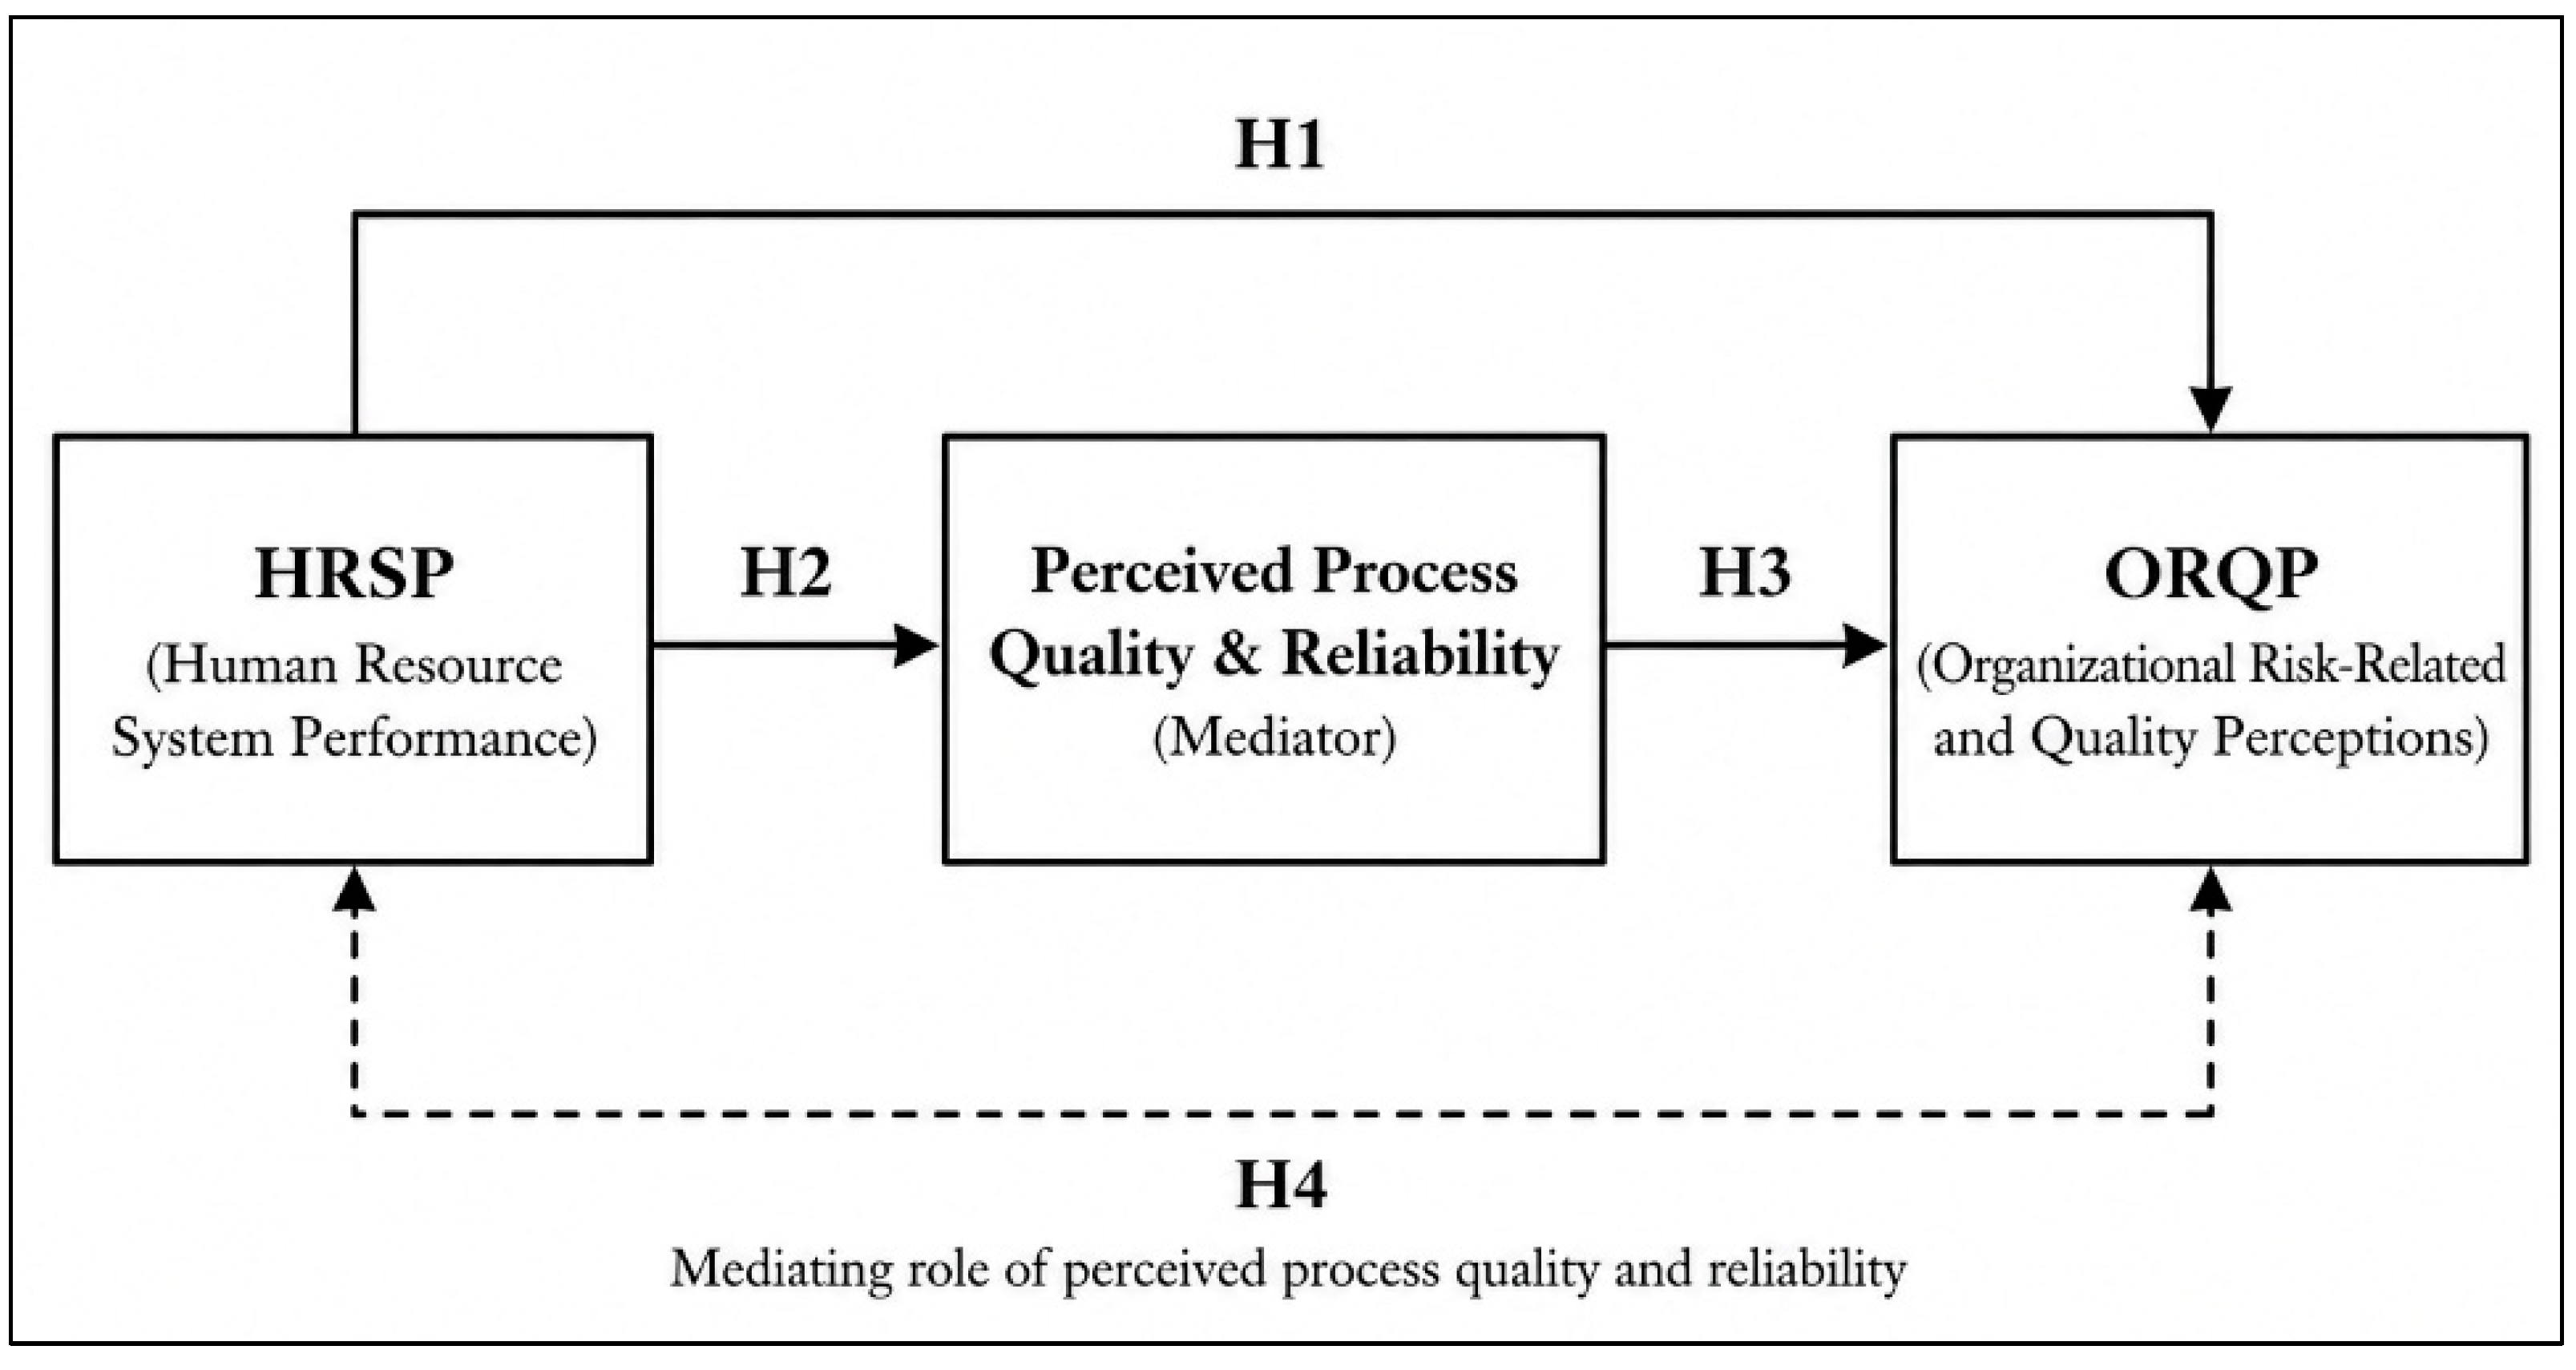
Figure 2.
Mediation Model of the Relationship between Human Resource System Performance, Perceived Process Quality and Reliability, and Organizational Risk-Related and Quality Perceptions.
Figure 2.
Mediation Model of the Relationship between Human Resource System Performance, Perceived Process Quality and Reliability, and Organizational Risk-Related and Quality Perceptions.
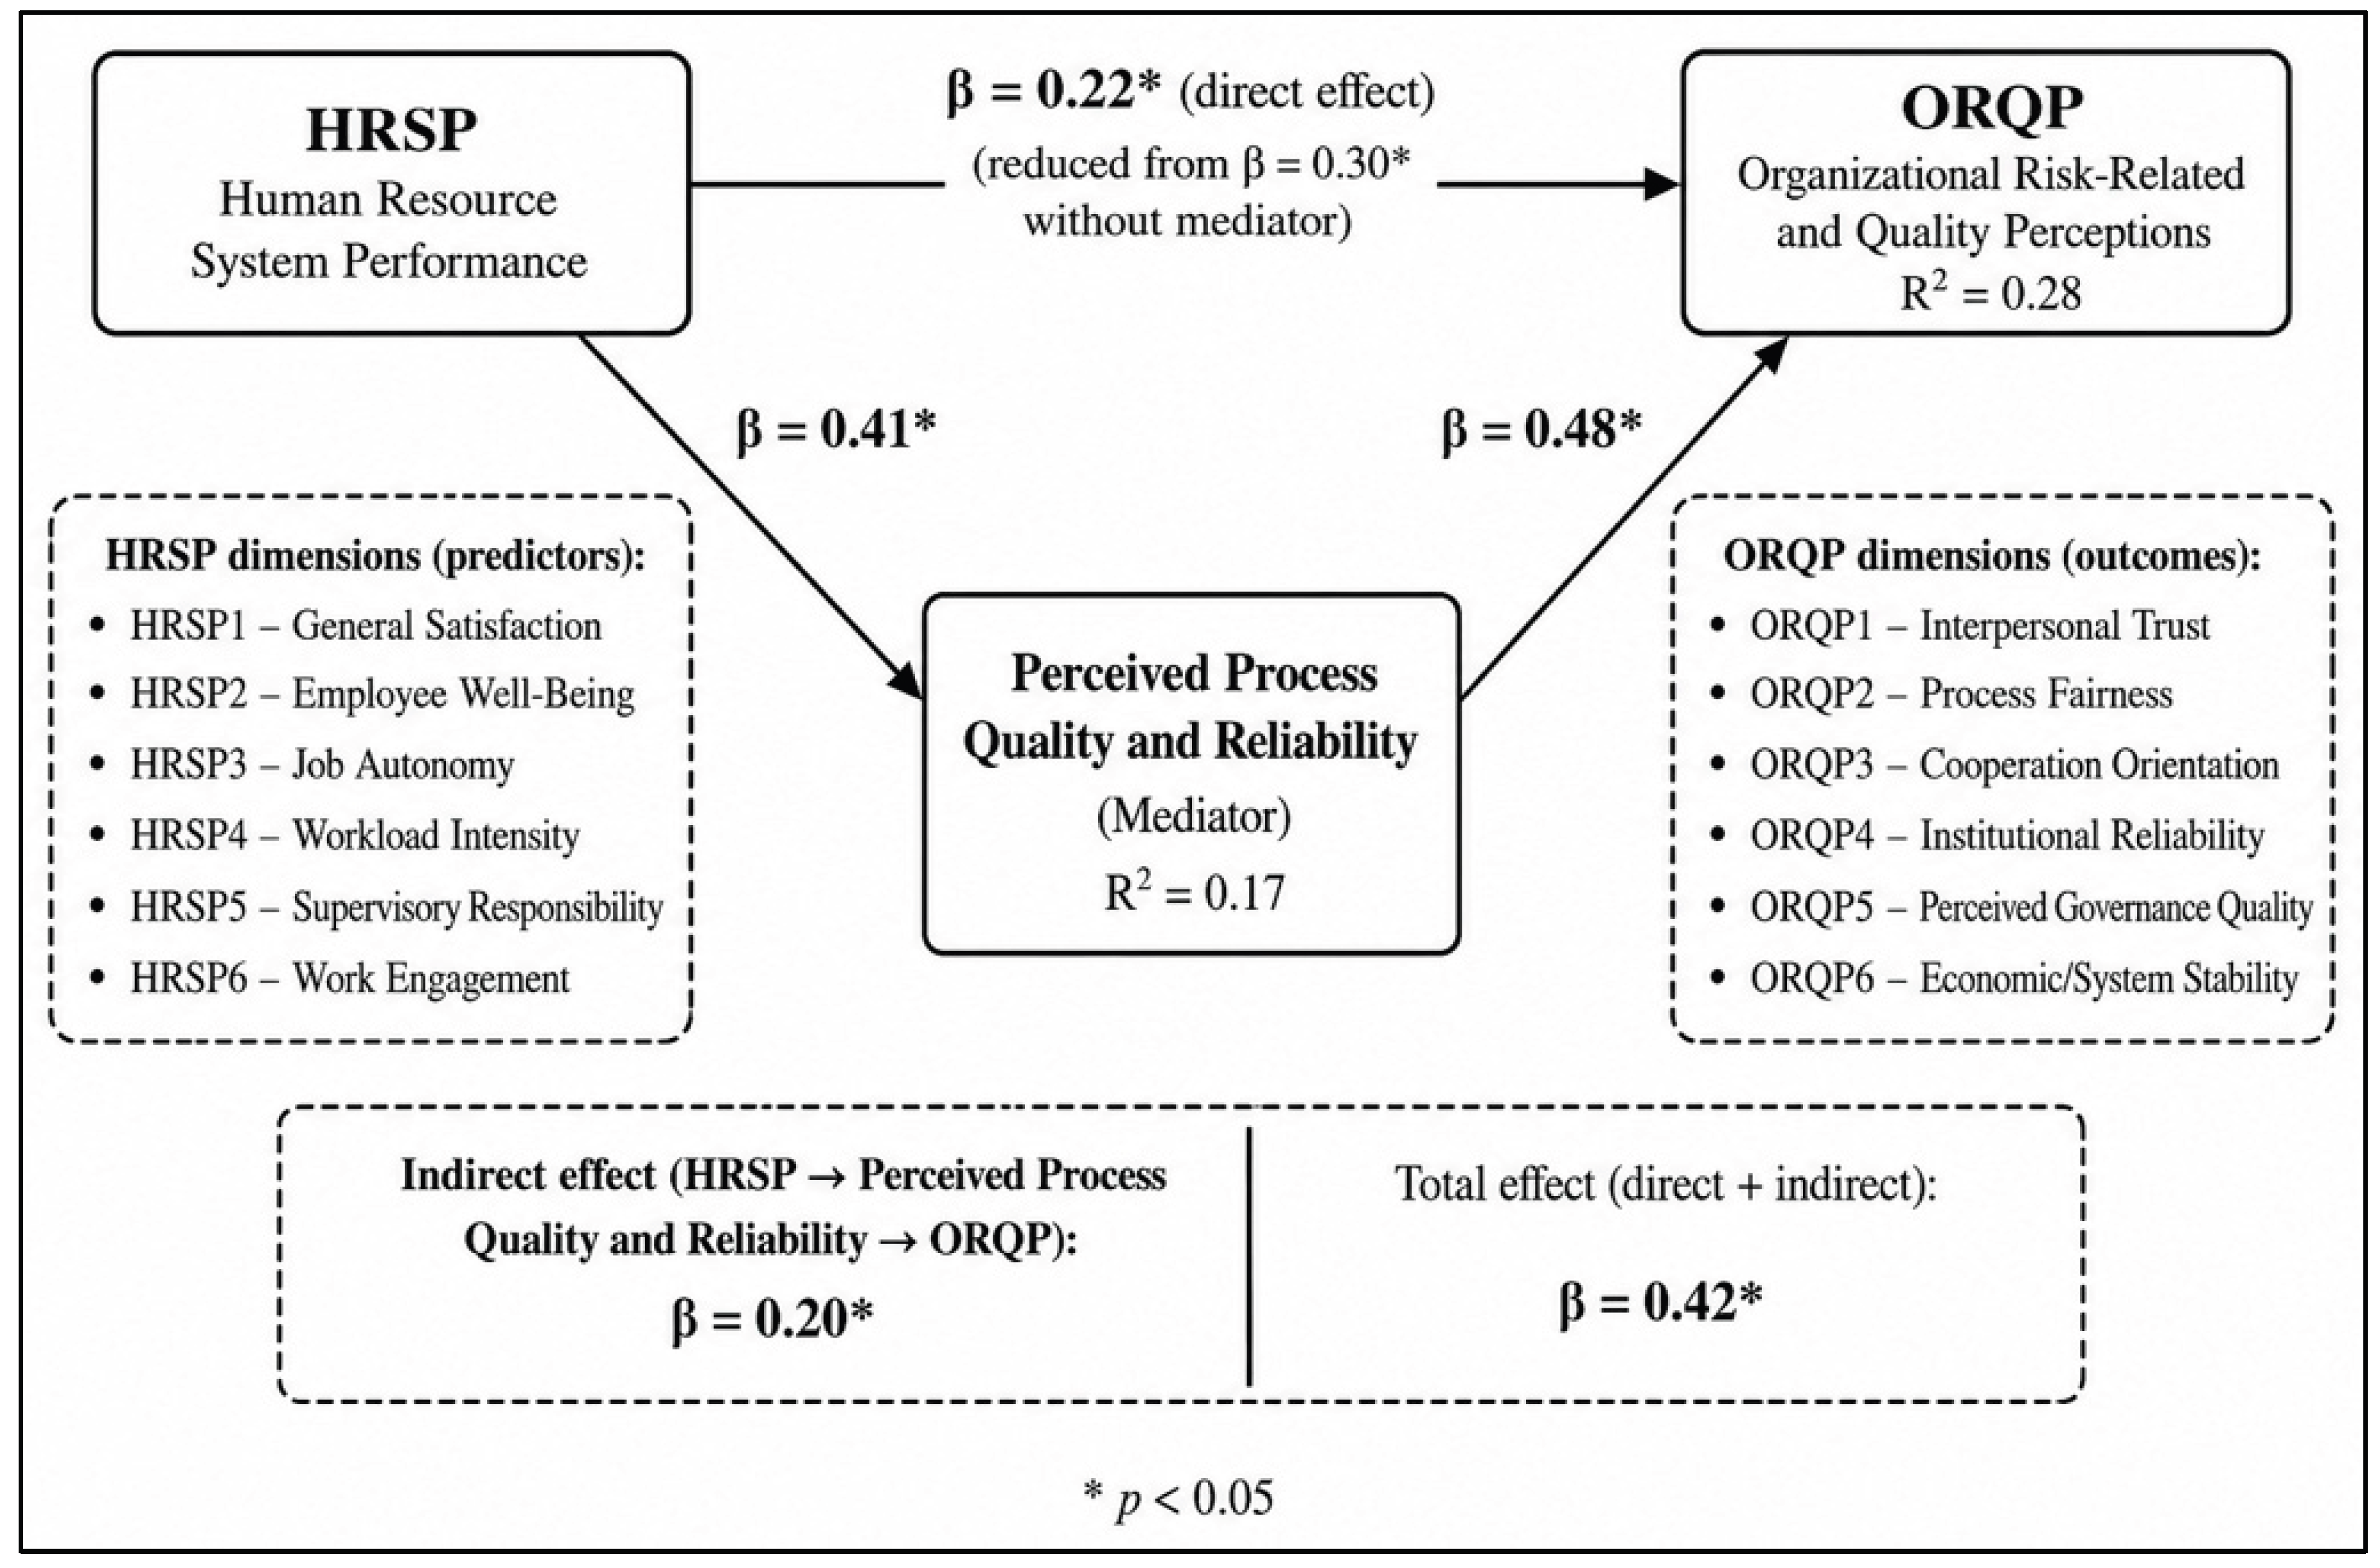
Table 1.
Socio-demographic characteristics of the sample.
| Variable | Category | N | % |
| Age | 18-34 | 152 | 20.3 |
| 35-54 | 285 | 38.0 | |
| 55+ | 313 | 41.7 | |
| Gender | Male | 335 | 44.7 |
| Female | 415 | 55.3 | |
| Education | Secondary | 293 | 39.1 |
| Higher education | 389 | 51.9 | |
| MSc/PhD | 68 | 9.1 | |
| Income | Low | 202 | 26.9 |
| Medium | 320 | 42.7 | |
| High | 228 | 30.4 | |
| Residence | Urban | 402 | 53.6 |
| Rural | 348 | 46.4 | |
| Organizational Governance Interest | Low | 472 | 62.9 |
| High | 278 | 37.1 | |
| Perceived System Security | Low perceived security | 395 | 52.7 |
| High perceived security | 355 | 47.3 |
Table 2.
Descriptive statistics and operationalization of variables.
| Variable | Code | Definition | N | Min | Max | Mean | Std. Dev. |
| General Satisfaction | HRSP1 | Perceived stability and general satisfaction within the work-related context | 750 | 1 | 9 | 7.02 | 2.204 |
| Employee Well-Being | HRSP2 | Subjective well-being as an indicator of individual system condition | 750 | 1 | 9 | 2.72 | 1.335 |
| Job Autonomy | HRSP3 | Perceived flexibility and autonomy in work organization | 750 | 1 | 9 | 5.20 | 2.382 |
| Workload Intensity | HRSP4 | System pressure and workload-related demands | 750 | 1 | 9 | 2.41 | 1.472 |
| Supervisory Responsibility | HRSP5 | Responsibility for supervising or coordinating others | 750 | 1 | 9 | 2.20 | 1.242 |
| Work Engagement | HRSP6 | Participation and influence in organizational decision-making | 750 | 1 | 9 | 4.63 | 2.528 |
| Interpersonal Trust | ORQP1 | Trust-based system cohesion and reduction of uncertainty | 750 | 1 | 9 | 5.42 | 2.151 |
| Process Fairness | ORQP2 | Perceived fairness as a proxy for process-related reliability | 750 | 1 | 9 | 5.92 | 1.972 |
| Cooperation Orientation | ORQP3 | Willingness to cooperate and support coordinated functioning | 750 | 1 | 9 | 5.43 | 2.147 |
| Institutional Reliability | ORQP4 | Perceived reliability of institutional structures | 750 | 1 | 9 | 6.19 | 2.319 |
| Perceived Governance Quality | ORQP5 | Perceived quality of governance and decision-making environment | 750 | 1 | 9 | 5.32 | 2.199 |
| Economic/System Stability | ORQP6 | Perceived economic stability as a broader stability-related indicator | 750 | 1 | 9 | 6.33 | 1.999 |
Table 6.
Total variance explained.
| Component | Initial Eigenvalues | Extraction Sums of Squared Loadings | ||||
| Total | % of Variance | Cumulative % | Total | % of Variance | Cumulative % | |
| 1 | 3.741 | 31.178 | 31.178 | 3.741 | 31.178 | 31.178 |
| 2 | 1.947 | 16.222 | 47.400 | 1.947 | 16.222 | 47.400 |
| 3 | 1.042 | 8.684 | 56.084 | |||
| 4 | 0.980 | 8.170 | 64.254 | |||
| 5 | 0.833 | 6.939 | 71.193 | |||
| 6 | 0.753 | 6.277 | 77.470 | |||
| 7 | 0.596 | 4.964 | 82.434 | |||
| 8 | 0.524 | 4.363 | 86.798 | |||
| 9 | 0.465 | 3.878 | 90.676 | |||
| 10 | 0.414 | 3.449 | 94.125 | |||
| 11 | 0.369 | 3.079 | 97.204 | |||
| 12 | 0.336 | 2.796 | 100.000 | |||
| Extraction Method: Principal Component Analysis. | ||||||
Disclaimer/Publisher’s Note: The statements, opinions and data contained in all publications are solely those of the individual author(s) and contributor(s) and not of MDPI and/or the editor(s). MDPI and/or the editor(s) disclaim responsibility for any injury to people or property resulting from any ideas, methods, instructions or products referred to in the content. |
© 2026 by the authors. Licensee MDPI, Basel, Switzerland. This article is an open access article distributed under the terms and conditions of the Creative Commons Attribution (CC BY) license (http://creativecommons.org/licenses/by/4.0/).
Copyright: This open access article is published under a Creative Commons CC BY 4.0 license, which permit the free download, distribution, and reuse, provided that the author and preprint are cited in any reuse.


