

Submitted:
01 July 2026
Posted:
02 July 2026
You are already at the latest version
Abstract
Steel production contributes significantly to global emissions, making its decarbonization essential. Electrified steelmaking based on electric arc furnaces (EAF) using hydrogen-based direct reduced iron (H₂-DRI) and scrap is a promising pathway. This study analyzes how the H₂-DRI:scrap ratio affects electricity demand, CO₂ emissions, slag formation, and oxygen management. To address limitations of approaches based on aggregated data and linear scaling assumptions, a detailed bottom-up mass and energy balance model is developed, explicitly resolving process interactions between electrolysis, direct reduction, and EAF steelmaking. Eight H₂-DRI:scrap ratios ranging from 0:100 to 100:0 are evaluated. Electricity demand increases from 1.1 GJ/tSteel (0.31 MWh/tSteel) for scrap-based operation to 13.9 GJ/tSteel (3.86 MWh/tSteel) for fully H₂-based production, largely driven by hydrogen generation. Consequently, emissions strongly depend on electricity carbon intensity, with reductions of up to 95% under renewable supply. Electrolytic oxygen can fully cover process demand at ~10–13% H₂-DRI, enabling system integration benefits.
Keywords:
green steel
; electric arc furnace (EAF)
; hydrogen-based direct reduced iron (H₂-DRI)
; electricity demand
; scrap utilization
; oxygen valorization
1. Introduction
The decarbonization of energy-intensive industries is a central challenge in meeting global climate targets, with steelmaking receiving particular attention due to its large contribution to industrial greenhouse gas emissions. Approximately 11% of global CO₂ emissions originate from steel production, motivating both industry and research institutions to explore alternative, low-carbon production routes [1]. At present, global steel production is dominated by three main pathways: the blast furnace–basic oxygen furnace (BF–BOF) route, electric arc furnace steelmaking based on recycled scrap, and electric arc furnaces supplied with direct reduced iron, accounting for roughly 71%, 24%, and 5% of production, respectively [2]. While scrap recycling is a key pillar of sustainable steelmaking, its availability and quality are insufficient to fully meet future demand, making the continued use of primary iron unavoidable. Although carbon capture and storage (CCS) has been proposed as a mitigation option for reducing emissions from conventional BF-BOF steel production, alternative primary iron production routes are required to achieve deep decarbonization [3,4]. In this context, direct reduction of iron ore represents a promising alternative to the blast furnace. Although most direct reduced iron (DRI) is currently produced using natural gas, hydrogen-based direct reduction enables a fully electrified steelmaking route when combined with an electric arc furnace and water electrolysis (H₂-DRI-EAF). When powered by renewable electricity, this configuration offers a pathway toward almost carbon-neutral steel production. The technical feasibility of the H₂-DRI-EAF route has already been demonstrated at pilot scale by projects such as HYBRIT in Sweden, producing the first fossil-free steel for industrial customers in 2021 [5]. Stegra (formerly H2 Green Steel) is moving one step further with the construction of a large-scale plant to produce multi-million tons of green steel per year starting 2026 [6].
Although scrap-based EAF steelmaking is a well-established route for steel recycling, the integration of hydrogen-based direct reduction for carbon-neutral primary steel production remains economically challenging [7,8,9]. A major share of the production cost and environmental impact of the H₂-DRI-EAF route is related to electricity consumption, which becomes a key driver of competitiveness and the configuration of hydrogen-based steel supply chains [8,10,11,12]. For this reason, several studies have investigated the energy demand and emission performance of this route. Bhaskar et al. report a specific electricity consumption (SEC) of 3.72 MWh/tSteel (13.9 GJ/tSteel) for a fully hydrogen-based configuration, with hydrogen production accounting for around 70% of the total demand [13]. Krüger et al. report a SEC of 3.95 MWh/tSteel (14.2 GJ/tSteel) for hydrogen-based steel production using low-temperature electrolysis, which can be reduced to 3.12 MWh/tSteel (11.2 GJ/tSteel) when high-temperature electrolysis is applied [14]. Similar values are reported by Vogl et al., who estimate a SEC of about 3.5 MWh/tSteel (12.6 GJ/tSteel) for a 100% H₂-DRI feed [15]. The authors also show that the electricity demand decreases significantly to 0.667 MWh/tSteel (2.40 GJ/tSteel) in the case of a fully scrap-based EAF [15]. Compared with the blast furnace–basic oxygen furnace route, the authors state the H2-DRI-EAF pathway offers the opportunity to reduce CO₂ emissions by ~95%, but it requires a drastic increase in renewable electricity supply [15]. Alikulov et al. report slightly lower electricity requirements of approximately 2.68 MWh/tSteel (9.65 GJ/tSteel) for the hydrogen-based route, while highlighting the remaining cost gap compared to the BF–BOF process [16]. Mixed charging of scrap and H₂-DRI in EAFs is relevant not only during the transition to low-carbon steelmaking, but also as a potential long-term production route, since the addition of DRI enables control of residual elements, maintains steel quality, and provides operational flexibility under constrained scrap availability, as discussed in system-level steel decarbonization studies [17]. However, only limited work has investigated mixed charging of scrap and H₂-DRI in the EAF. Khan et al. analyze different scrap and H₂-DRI ratios and report corresponding changes in both electricity demand and CO₂ emissions [18]. For example, they show that the specific electricity consumption decreases from about 5.7 GJ/tSteel at 25% scrap to 3.7 GJ/tSteel at 75% scrap, highlighting the strong influence of the metallic feed composition on overall system performance. However, their top-down analysis relies on performance values reported in the literature and applies linear scaling to assess variations in scrap and H₂-DRI ratios, without resolving the underlying process interactions.
In this study, an energy and environmental analysis of the H2-DRI–EAF steelmaking route is presented, explicitly including the electrolyzer, DRI shaft furnace, and electric arc furnace. A detailed bottom-up model is developed based on mass and energy balances of the individual process units, explicitly accounting for internal material and reaction pathways. As a reference case, a charge composition of 13% primary iron and 87% scrap is used, reflecting current industrial practice at an exemplary EAF in Seixal, Portugal [19]. Varying the ratio between internally produced H₂-DRI and steel scrap is expected to have a strong influence on electricity demand and CO₂ emissions. In addition, changes in the feedstock composition affect the balance between internally generated oxygen from electrolysis and the oxygen demand of the steelmaking process. To capture these interactions, this work evaluates eight different H₂-DRI:scrap ratios and quantifies their impact on energy demand, emissions, and internal oxygen balance.
2. Methodology
An Excel-based model was developed to analyse the energy flows and associated carbon emissions of an integrated steel mill comprising an electrolyzer, a DRI plant, and an electric arc furnace (shown in Figure 1).
2.1. Mass Balance and Chemical Reactions
To model the material flows of each component, a mass balance (see Eq. 1) was applied, accounting for all incoming material streams and all outgoing material streams , based on the relevant chemical reactions and their stoichiometric relationships:
The material flow follows the process sequence from the electrolyzer to the DRI furnace and subsequently to the EAF, with additional material streams entering and leaving each unit. In the electrolyzer, the incoming water stream H₂O is split into hydrogen H₂ and oxygen O₂ by applying electrical energy, as described in Eq. 2.
An electrolyte (usually NaOH or KOH) supports the chemical reactions, however, ideally, it is not consumed and therefore not part of the mass balance. The produced hydrogen is supplied to the DRI shaft furnace, where it is mixed with high-grade iron ore pellets, assumed to consist of hematite. Hydrogen reduces the iron oxide component Fe₂O₃ of the ore to metallic iron through a sequence of three reduction reactions, producing water as a by-product. (Eq. 3-5)[20].
The reduction of FeO is generally incomplete, leaving an FeO fraction in the DRI product. Following the numbers of Gyllenram et al., we set the reaction percentage to obtain a typical FeO content of 7.12 wt% in the DRI composition [21]. As these reactions are strongly endothermic, substantial heat input is required to raise the temperature of the feed material. An energy-efficient approach to preheating the large volume of reducing gas before entering the furnace is direct electrical heating [22]. However, to limit the need for additional heating equipment, it is common practice to combust a small fraction of the hydrogen with oxygen to provide required heat (see Eq. 6) [23,24].
Iron ore typically contains various gangue components such as silica SiO₂, alumina Al₂O₃, lime CaO, and other minor oxides [25]. The iron ore composition was adjusted to reproduce the DRI composition reported by Gyllenram et al., considering only the three most prevalent impurities SiO2, Al2O3 and CaO with respective DRI weight fractions of 2.18 wt%, 0.61 wt% and 0.73 wt% [21]. Impurities are carried into the sponge iron along with metallic iron and a remaining fraction of unreacted wüstite FeO. All input and output material (feed/product) of the DRI plant are presented in Table A1 in the Appendix.
The sponge iron is transferred to the EAF for the steelmaking stage, where a fraction of steel scrap is typically blended with the DRI charge. Following operational data from the Seixal steel mill in Portugal, we designed our reference case to employ a scrap/DRI ratio of 87 wt%/13 wt% [19]. In the EAF, molten steel is produced by refining iron through the removal of impurities and addition of alloying elements under controlled high-temperature conditions to achieve the desired chemical and mechanical properties. Since steel is essentially an alloy of iron and carbon, a small amount of carbon powder must be added to obtain the target carbon content [26,27]. Although in practice carbon is sometimes already introduced during DRI production via methane reforming, in the present model the DRI stream is assumed to be carbon-free. Carbon powder is injected directly into the EAF, where it dissolves into the melt. Due to the utilization of carbon-free DRI we assumed a carbon injection of 18 kgC/tSteel, producing medium carbon steel of 0.25 wt% carbon content [28,29]. This carbon not only provides the final carbon content of the steel but also promotes essential oxidation and reduction reactions that increase process efficiency [30]. By releasing additional iron, the carbon improves the efficiency of the process:
Carbon reacts with oxygen to form carbon monoxide, releasing heat and generating a furnace gas that helps distribute energy more uniformly, even though it adds to emissions.
Carbon may also be fully oxidized to carbon dioxide, which releases more heat to keep the furnace temperature, but likewise increases carbon emissions.
At steelmaking temperatures, the Boudouard equilibrium strongly favours the formation of carbon monoxide, resulting in CO-dominated off gases. Reported flue gas compositions typically range from 70–95% CO and 5–25% CO₂ [31]. For modelling purposes, a representative composition of 90 mol% CO and 10 mol% CO₂ was adopted. By adding oxygen downstream of the furnace, these CO-rich gases can undergo post-combustion, where carbon monoxide is oxidised to carbon dioxide according to:
This post-combustion reaction releases additional heat, which can be recovered to improve the overall thermal efficiency of the process [32]. Furthermore, it is lowering negative environmental impacts by reducing the CO content in the off gas. We applied the post-combustion ratio of 0.58 CO to CO₂ given by Arzpeyma et al. [32].
Beyond its role in combustion and post-combustion, oxygen serves as an essential process gas in the EAF. It is intentionally introduced to oxidize unwanted elements present in the metal bath. The goal is to refine the molten iron by reducing its impurity content and adjusting composition. In the process FeO formation from Fe (see Eq. 11) is unavoidable and beneficial as it serves as an oxygen carrier, transferring oxygen from the gas phase to oxidize other elements such as silicon Si and manganese Mn (see Eq. 12 and Eq. 13). Subsequently, FeO is reduced back to metallic iron by carbon (see Eq. 7), acting as a transient species in the refining cycle.
By adding quicklime or dolime to the steel bath, the formed and content of the DRI and scrap react to and , which can be removed with the slag (Eq. 14 and Eq. 15).
Steel slag, a liquid layer on top of the molten steel, is crucial for the steel production [33]. The slag supports arc stability, protects the furnace refractories from direct arc radiation, shields the molten metal from atmospheric exposure, and improves energy efficiency by reducing both power-on time and refractory maintenance requirements. However, it is important to keep the right chemical composition and weight of the slag to provide the desired benefits (foamy slag practice) [33]. The total amount of slag produced in an EAF depends primarily on the amount of fluxes added (CaO, MgO, etc.), the oxidation degree of the bath, and the FeO content of the slag. The slag generation typically represents 10–15 wt% of the produced steel, corresponding to 100–150 kg slag per ton of steel [34]. The basicity of the slag, calculated by CaO in the slag divided by the weight of SiO2, provides an essential metric and is usually maintained in the range between 1.9 and 2.4 [21,35]. The , , , , and contents of the slag typically fall into the ranges of 10–40 wt%, 22–60 wt%, 6–34 wt%, 3–14 wt%, and 3–13 wt% ranges, respectively [36]. In this study, inputs were adjusted to obtain values close to the average values reported by Barchowsky et al. [34]. In Table A2 in the Appendix, the modelled feed and product compositions of the EAF are presented.
2.2. Energy Flows
To analyse the energy flows throughout the steelmaking route, the general steady-state energy balance can be expressed as the sum of the enthalpy of the incoming and outgoing material streams and , together with the heat and work transfers, as given in Eq. 16:
The electrolyzer, DRI plant, and EAF are modelled as three separate processes, each represented by a heating block and a reaction block. Although heating and reaction may physically occur in the same unit, the separation enables a clearer representation of thermal and chemical transformations. The energy flows of all processes are illustrated in Figure 2. The system boundaries are defined around both the heating and reactor blocks, with the external environment assumed at standard conditions of 25 °C and 1 bar. The reactor blocks of the electrolyzer, DRI furnace, and EAF are operated at 70 °C, 900 °C, and 1650 °C, respectively. Following the approach of Vogl et al., all processes are assumed to take place at atmospheric pressure [15]. The indices in and out denote the material streams entering (before reaction) and leaving (after reaction) the system.
Although it requires specialized transport, an integrated steel mill is expected to benefit greatly from maintaining the temperature of the DRI at elevated temperatures by reducing tap-to-tap time, increasing productivity by up to 20% and significantly saving energy [37]. Therefore, we assumed hot DRI transfer at 600°C from DRI furnace to the EAF. In general, the reference state for the final steel product is liquid, since subsequent forming and shaping steps require molten material. The low-grade heat of the electrolyzer product stream is considered to be recycled internally.
The feed material enters the system with enthalpy at standard conditions and in case of the EAF with additional enthalpy of the DRI feed stream at 600°C . Electricity is supplied to power the entire system. The waste material is leaving with the enthalpy at standard conditions , while the product exits with the enthalpy at 25°C, 600°C and 1650°C, in case of electrolyzer, DRI furnace and EAF, respectively. Together with heat resulting from the internal processes, the equation can be written as
Electric heating and Balance of Plants (BOP) are fed with the electricity input . In case of the electrolyzer an additional electricity input to the reactor to drive the electrochemical reaction is required. All the remaining electricity requirements occurring in the system are aggregated in the BOP, with 4.2 kWh/kgH2, 100 kWh/tDRI and 25 kWh/tSteel for electrolyzer, DRI furnace and EAF, respectively [38,39,40]. The material streams carry energy in the form of standard enthalpies of formation at standard conditions, at reference conditions, which are taken from the “NIST Chemistry WebBook” [41]. The enthalpy of materials at elevated temperatures is calculated using a simplified temperature correction based on Kirchhoff’s law. An arithmetic mean value of the specific heat capacity over the relevant temperature range is multiplied by the temperature difference to account for sensible heat, while additional enthalpy changes associated with phase transitions are included to represent latent heat effects [31].
Specific heat capacities at elevated temperatures are calculated using the Shomate equation, with coefficients taken from the NIST Chemistry WebBook [41] (see Eq. 19). In the equation, is defined as the absolute temperature divided by 1000 ( ). If a phase transition occurs, an arithmetic mean for each phase was calculated.
The reaction enthalpy in the reactor can be calculated as shown in Eq. 20:
A portion of the sensible heat contained in the off-gas streams can be recovered , however, most of the sensible heat carried by material streams leaving the furnace is lost. Additional thermal losses through insulation and structural components are grouped in the term . For the electrolyzer system, an additional heat loss of 16% is assumed, corresponding to a typical electrolyzer system efficiency of 65% (LHV), while a value of 15% is applied for the DRI process [42,43]. For the EAF, heat losses of 25% are considered, accounting for losses due to furnace opening, surface radiation, and cooling requirements [44]. To maintain the required operating temperature of each unit, an additional heat input is supplied. Sensible heat recovery efficiencies of 50% are assumed for electrolyzer product gases, which are characterized by relatively low temperatures and high purity. For the DRI furnace off-gas, a recovery rate of 70% is applied, reflecting its high temperature and comparatively clean composition. In contrast, a recovery efficiency of 12.5% is assumed for EAF off-gases through scrap preheating [45]. These assumptions are consistent with typical ranges reported for industrial heat recovery systems, although detailed published data for the specific processes considered remain limited.
2.3. Carbon Emissions
In the present analysis, the calculation of CO₂ emissions is limited to the operational energy flows. It does not represent a full life cycle assessment (LCA), as emissions related to plant construction, raw material extraction, and manufacturing are outside of the system boundaries. Emissions are categorized as direct emissions, originating from sources owned or controlled by the steel company, and indirect emissions, which arise as a consequence of the activities. Ideally, in a green steel configuration, both the electrolyzer and the DRI furnace operate without direct carbon emissions, whereas the EAF releases some amount of CO and CO₂ due to carbon oxidation reactions. Indirect emissions are associated with electricity generation. Two electricity supply scenarios are considered. In the grid-based scenario, the steel plant is assumed to be connected to the national electricity grid. The Portuguese average grid mix for the period from 1st January to 31st July 2025 is applied, as shown in Table 1 [46]. It should be noted that Portugal exhibits a relatively high share of renewable electricity in the grid, resulting in low indirect emissions compared to countries with more carbon-intensive grids. In the green scenario, the steel plant is supplied exclusively with renewable electricity, assumed to consist of equal shares of solar and wind power. The variability of renewable electricity supply may require oversizing of the electrolysis system or a hydrogen buffer tank to ensure stable operation; however, this aspect is beyond the scope of this work [47,48]. The emission factors applied for the individual electricity generation technologies are listed in Table 1. We applied the conservative assumption of the same emission factor for combined heat and power (CHP) plants as for combined cycle power plants (CCPP). As a result, the average total emission factor of the grid-based scenario was calculated as 91.42 kgCO2e/MWh and of the green steel scenario as 29.5 kgCO2e/MWh.
3. Results and Discussion
Summarized below are the model results for mass and energy flows, along with the associated carbon emissions, for the base operating case with a DRI-to-scrap ratio of 13:87. In addition, the effects of varying the DRI-to-scrap ratio on hydrogen and oxygen demand, energy, and emission balances are evaluated. To provide a more detailed understanding of the interactions between key parameters, a sensitivity analysis is performed. All flows are reported per ton of steel produced. The model is based on steady-state operation and does not capture dynamic behavior or renewable intermittency. In addition, upstream emissions and infrastructure are not included. These aspects may influence absolute values but are not expected to affect the relative trends identified.
3.1. Mass Flow
In Figure 3 the mass flow through the entire steel mill is presented in the form of a Sankey diagram. Most of the mass input 911.0 kg/tSteel in the EAF and the entire steel mill is scrap. In the base operating case, the DRI plant provides only a minor part of 135.3 kg/tSteel through the reduction of iron ore. We scaled the electrolyzer to satisfy hydrogen demand of the DRI process and therefore all the produced hydrogen (7.3 kg/tSteel) is used in the process. The electrolyzer in this operating case produces 58.3 kg/tSteel of oxygen, of which 5.3 kg/tSteel and 50.2 kg/tSteel of oxygen are utilized in the DRI plant and EAF process, respectively, while the remaining 2.8 kg/tSteel are leaving the system. Electrolysis itself operates without generating waste streams, whereas the DRI plant theoretically produces only water as off-gas (65.7 kg/tSteel), which could be condensed and recycled in an optimized system. In practice, incomplete conversion of hydrogen and oxygen results in residual gases, necessitating additional purification and recycling steps. Waste reduction of the EAF is more challenging due to slag (124.1 kg/tSteel) and flue gas (60.0 kg/tSteel) production. The reported flue gas consists only of reaction products generated within the model. Air infiltration into the EAF, and the associated nitrogen contained in industrial off-gas streams, is not explicitly considered. Therefore, the calculated flue gas mass is lower than would be expected in industrial operation. A foamy slag production of approximately 100-150 kg/tSteel is essential to the efficiency of the process. To achieve the required slag composition and weight, fluxes consisting of 16 kg/tSteel of quicklime, 20 kg/tSteel of dolime and 10 kg/tSteel of bauxite are added. As reducing slag production is not recommended due to efficiency losses, the slag can instead be utilized in the cement industry to enhance carbon neutrality and support a circular economy. In this study the DRI is carbon-free and therefore direct injection of carbon is inevitable; however, it should be kept at a minimum.
3.2. Energy Flow
The energy flows of the steel mill were calculated according to the methodology described previously. Figure 4 illustrates the modelled energy flows within the three main process units of the integrated steel mill: the electrolyzer (top), the direct reduction furnace (middle), and the electric arc furnace (bottom). At 25 °C, the chemical reaction in the electrolyzer has a positive enthalpy change, whereas the reactions in the DRI furnace and EAF have negative enthalpy changes. Accordingly, the former is treated as an output, while the latter two are treated as inputs. The electrolyzer (top) is the most energy-intensive subsystem, with a total electricity demand of approximately 1,356.2 MJ/tSteel. The main portion of the supplied electrical energy (1,036.5 MJ/tSteel) is consumed by the endothermic reaction of the process itself, while heating (including material heating, internal electrical resistance heat etc.) and BOP consume 208.6 MJ/tSteel and 111.1 MJ/tSteel, respectively. The heat losses, consisting of material heat loss, insulation loss and the losses from BOP, amount to about 314.5 MJ/tSteel, corresponding to a thermal loss share of about 23.2 % of total input energy. The useful chemical enthalpy output, represented by the enthalpy product of 1,041.7 MJ/tSteel, corresponds to the stored chemical energy in the produced hydrogen. The remaining energy appears as thermal losses that could potentially be recovered to preheat feedwater or utilized in adjacent processes. The DRI process (middle diagram) consumes approximately 230.7 MJ/tSteel of electricity and receives an additional 131.0 MJ/tSteel as the accumulated enthalpies of the feed material, with hydrogen providing the major positive share. An integrated steel mill was modeled, where the DRI product is kept at an elevated temperature of 600 °C, carrying the sensible heat of 49.3 MJ/tSteel to the EAF and saving around 5% of the heat input. While 89.7 MJ/tSteel of the remaining enthalpy of the hot output material are recovered, 223.3 MJ/tSteel are lost through cooling of DRI and heat in the off gas (water vapor). The DRI process is endothermic and requires heat input to sustain reduction. A large share of the heat exits as sensible heat in the hot gas and solid product, underlining the importance of heat recovery to improve efficiency. The EAF (bottom diagram) exhibits the highest total energy throughput among the three units, with an electrical demand (1,134.9 MJ/tSteel), the enthalpy of the heated DRI (49.3 MJ/tSteel) and the enthalpy of the remaining cold feed (691.5 MJ/tSteel). Whereas the net reaction enthalpy of the DRI and electrolysis processes is endothermic, the overall reaction balance of the EAF is exothermic, primarily due to oxidation reactions that release heat and support the melting process. By considering a steel product in liquid form, a large share of the energy exits as enthalpy with the hot steel product 1,258.6 MJ/tSteel. Heat losses amount to 617.1 MJ/tSteel, representing roughly 28% of total energy input. Losses occur mainly through radiation, hot off-gases, and slag heat. Improved heat recovery or preheating of scrap could significantly improve furnace efficiency [50,51].
The vision of a green steel mill is to operate a fully electrified production route, allowing the transition from fossil-based energy sources to electricity derived from renewables. Figure 5 illustrates the electrical energy demand of the three main process units. Each column represents the electricity consumption required for heating and BOP, whereas for the electrolyzer, the value also includes the electricity necessary to drive the electrochemical reaction. The reaction-related value of 1.04 GJ/tSteel corresponds solely to the theoretical stoichiometric enthalpy of the reaction, the losses through internal resistance of the electrolysis, which ultimately leads to additional heat, are accounted for in the heat value (0.21 GJ/tSteel). For the DRI furnace and EAF, the primary share of electrical energy consumption, amounting to 0.18 GJ/tSteel and 1.04 GJ/tSteel respectively, is associated with the electrical heating of the charge materials. Considering the furnace operating temperatures of roughly 900 °C for the DRI plant and 1650 °C for the EAF, the higher energy requirement of the latter is expected. Nevertheless, the significantly greater total electricity demand of the EAF (1.13 GJ/tSteel) compared to the DRI furnace (0.23 GJ/tSteel) results mainly from the additional processing of approximately 87 % scrap. Although the electrolyzer only produces the hydrogen required to supply 13 % of the EAF feed, its electricity consumption of 1.36 GJ/tSteel still exceeds that of the EAF.
3.3. Emissions
The specific CO₂-equivalent emissions per ton of steel were determined for two scenarios: a grid-based scenario (reflecting the Portuguese electricity mix from January to July 2025) and a green scenario supplied by a 50% wind and 50% solar mix (Table 2). Both the electrolyzer and the DRI process operate without direct CO₂ emissions, whereas the EAF generates 76.20 kgCO2e/tSteel from flue gases containing CO and CO₂. The indirect emissions, stemming from electricity consumption, scale with the SEC of each process. However, these emissions are substantially lower under the green scenario. Overall, the total specific emissions of the grid-based configuration (145.19 kgCO2e/tSteel) are roughly 1.5 times higher than those of the green system (98.51 kgCO2e/tSteel), demonstrating the considerable sustainability benefits achieved through full electrification with renewable power. It should be emphasized that the Portuguese grid already features a relatively high share of renewable generation compared to the global average; consequently, operating the same system with grid electricity in regions with higher fossil intensity would result in significantly greater emissions. When compared to the conventional BF–BOF steelmaking route (around 2200 kgCO2e/tSteel), the modeled H₂-DRI-EAF pathway achieves emission reductions of approximately 93% in the grid-based case and 95% in the green case. These results are consistent with the findings of Vogl et al., who reported a comparable reduction potential of around 95% [15].
3.4. Variation of the DRI-to-Scrap Ratio
In sustainable steelmaking H₂-DRI and scrap provide the iron feed for the melting process in the EAF. We modelled eight cases with different DRI-to-scrap ratios of 0:100, 10:90, 13:87, 20:80, 40:60, 60:40, 80:20 and 100:0. With the different composition of the two feed materials, the slag composition is strongly influenced by the variation of the ratio. The right composition of a foamy slag is crucial for the EAF efficiency and therefore fluxes need to be adapted accordingly. To provide a solid foundation for the comparison between the DRI-to-scrap ratios, the slag composition values for all cases are aimed to be as similar as possible. By adjusting the fluxes as shown in Table 3 the basicity is set to the value of 2.0 for all cases. As the share of carbon-free H₂-DRI increases, the amount of carbon available to the EAF decreases accordingly. To achieve a stable FeO content in the slag we increased the carbon injection from 17 kg/tSteel to 25 kg/tSteel.
The resulting slag composition values for the eight cases are shown in Table 4.
3.4.1. Impact on Electricity Consumption and Emissions
In an integrated steel mill, the overall electricity demand is greatly influenced by how much of the input material of the EAF is recycled scrap or internally reduced iron. While the EAF is a major electricity consumer in steelmaking with high scrap shares, the electrolyzer consumes roughly nine times more electricity in a steel production route based entirely on hydrogen-fed DRI (see Figure 6). With higher H2-DRI shares even the electricity demand of DRI becomes more significant. In this work, the total specific electricity consumption to power the whole steel mill (SEC) ranges from 1.13 GJ/tSteel (0.31 MWh/tSteel) to 13.88 GJ/tSteel (3.86 MWh/tSteel), While the total SEC increases strongly with increasing H2-DRI shares, the electricity demand of the EAF itself remains comparatively constant, increasing only from 1.13 GJ/tSteel for 100% scrap operation to 1.24 GJ/tSteel for 100% H2-DRI. The additional energy required to heat and melt DRI is largely compensated by the sensible heat of the hot DRI entering the furnace. The results are in line with the findings of other studies. E.g., the SEC of 3.7 GJ/tSteel reported by Khan et al. for a configuration using 25% H2-DRI and 75% scrap is comparable with the SEC of the 20:80 ratio of our model with 3.6 GJ/tSteel [18]. The results of Bhaskar et al. (13.9 GJ/tSteel), Krueger et al. (14.2 GJ/tSteel ), Vogl et. al (12.6 GJ/tSteel) and Alikulov et al. (9.56 GJ/tSteel) for a 100% H2-DRI mill are similar or slightly lower [13,14,15,16].
Additionally, Figure 6 presents the results of the environmental assessment of the eight H2-DRI:scrap cases for the grid-based and green scenario. By increasing the H₂-DRI share in the EAF feed the indirect emissions from electrolyzer and DRI furnace become more dominant. This results in a greater sensitivity to the carbon intensity of the electricity supply. While the green scenario (83.4 kgCO2e/tSteel) produces only 17.5% less emissions than the grid-based scenario (102.8 kgCO2e/tSteel) with a fully scrap-based production, with a fully H2-DRI-based steel mill the green scenario (203.6 kgCO2e/tSteel) is 53.9% lower than the grid-based scenario (441.7 kgCO2e/tSteel). This demonstrates that the fully H2-DRI-based concept powered by the grid still emits a substantial amount of carbon and a complete shift to a renewable power system is essential. However, even this concept is able to cut the emissions by 80% compared to the BF-BOF route.
3.4.2. Impact on Oxygen Balance
Oxygen is a valuable gas with many applications in the steel manufacturing process [52]. In hydrogen based direct reduction it is common practice to use a share of the two electrolytic gases to preheat the hydrogen. In our model we assumed a share of 10% of the produced hydrogen, which leads to an increase of the oxygen demand in the DRI process with higher H2-DRI usage (0 kgO2/tSteel to 42.2 kgO2/tSteel, shown in Figure 7). The applications of oxygen in the EAF are diverse. In this work we modelled the following major oxygen sinks (here given with its oxygen demand in the base 13:87 ratio case): Decarburization (11.5 kgO2/tSteel), oxidation of iron (19.3 kgO2/tSteel), oxidation of various impurities (7.3 kgO2/tSteel), post-combustion (14.2 kgO2/tSteel). As H2-DRI contains a significantly larger share of iron oxide FeO, with greater shares of H2-DRI in the EAF a larger portion of the required oxygen is already supplied by the feed material. Therefore, the oxygen demand of the EAF slightly shrinks from 51.8 kgO2/tSteel at a ratio of 0:100 to 38.0 kgO2/tSteel for a fully H2-DRI fed EAF. While conventional EAFs need to invest in a suitable oxygen supply, with on-site hydrogen production via electrolysis in the H2-DRI-EAF route, a large amount of oxygen is produced and with almost zero incremental costs and emissions available for internal processes. In Figure 7 the internally produced oxygen is presented in comparison to the oxygen demand of the steel mill. In case of a fully scrap-based feed, no electrolyzer installation is required, so all oxygen must be supplied from external sources, such as liquid oxygen deliveries or on-site air separation units (cryogenic ASU or PSA systems). Smaller increments were used for the ratio variation between 0% and 20% H2-DRI, as this range covers the point where internal demand is satisfied without oxygen surplus. In the 10:90 ratio case, the produced oxygen of (44.8 kgO2/tSteel) does not fully cover the internal oxygen demand of 55.1 kgO2/tSteel. However, in the 13:87 ratio case, the produced oxygen (58.3 kgO2/tSteel) is sufficient to satisfy all internal demands and even additional 2.8 kgO2/tSteel is produced. Increasing the share of H2-DRI in the ratio rapidly leads to a large oxygen surplus production to a maximum of 384.4 kgO2/tSteel in the 100:0 ratio case.
To valorize the potential of the co-product oxygen, either only satisfying the internal demand, or additionally selling the surplus to external consumers should be considered. Our results suggest that the point where internal demand is satisfied without oxygen surplus, lies in between 10% and 13% H2-DRI usage. Nevertheless, the amount of oxygen used offers some flexibility, leading to a range of suitable H2-DRI:scrap ratios to fully cover the own consumption without producing waste. In case of higher H2-DRI shares, the implementation of a distribution system to consumers in the surrounding might offer great economic and environmental benefits. Further investigation is needed to fully realize the potential, through process optimization or transport to off-site consumers [53,54].
3.5. Sensitivity Analysis
The results presented above are based on a single set of operating and technology assumptions. However, several parameters are uncertain and may vary significantly across plants and over time, affecting the main results of electricity demand, the internal oxygen balance, and the carbon intensity. To test the robustness of the key findings we performed a structured sensitivity analysis across all eight H₂-DRI:scrap ratios.
Four sensitivity dimensions were evaluated:
-
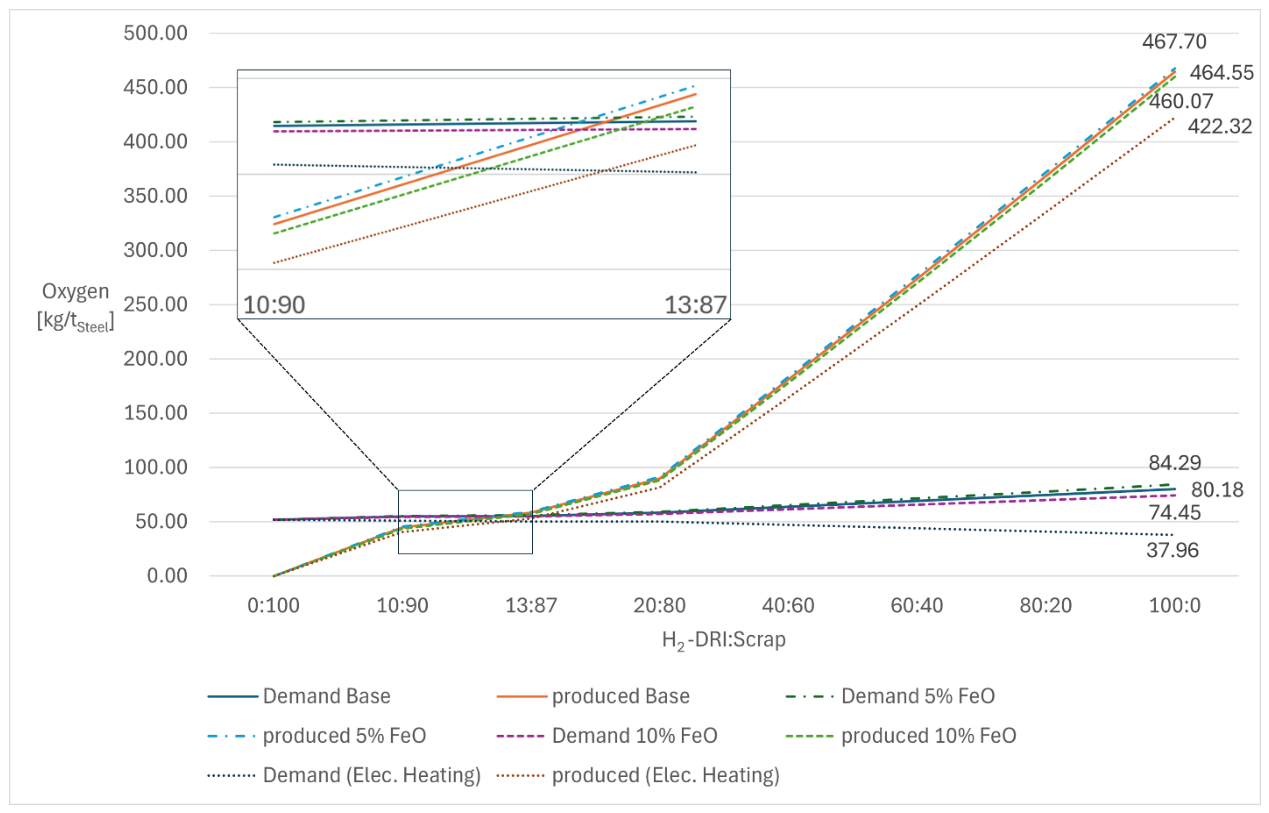
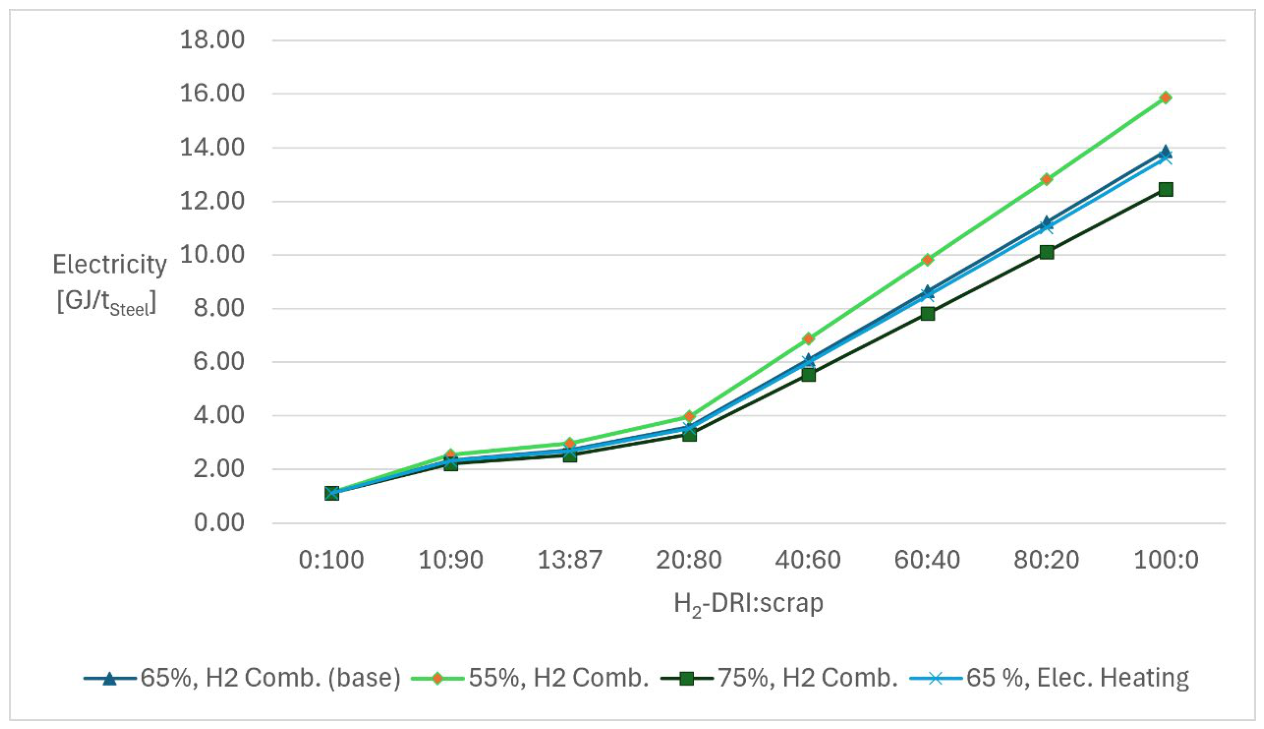
Reducing gas heating strategies (electric heating versus hydrogen combustion).In the base model, heat for preheating the reducing gas can be partially provided by combusting hydrogen with oxygen. We compare this case where 10% of the input hydrogen is combusted to a case with no hydrogen combustion, representing the use of electrical heating as alternative heat supply. This parameter affects both the total electricity demand (via additional H₂ production vs direct electrical heating) and the oxygen balance (via oxygen consumption in the DRI unit). The resulting SEC in case of direct electrical heating is shown for all ratios in Figure 9, demonstrating a reduction of up to 0.28 GJ/tSteel (2% of total demand) compared to the method of hydrogen combustion. The difference arises from additional conversion losses associated with hydrogen production and combustion. Overall, the relatively small impact on SEC indicates that the choice of heating strategy is of secondary importance for total energy demand, although it still influences the internal oxygen balance and may become relevant from an economic perspective. Figure 8 pictures the resulting oxygen demand curve vs the oxygen production curve of the 8 ratios. Even though the heating strategy shifts demand and production slightly downwards, the curves intersect again between 10:90 and 13:87 of H2-DRI:scrap ratio, supporting the robustness of this threshold.
Figure 8.
Oxygen demand and internal production of 5wt%, 7.12wt% (base) and 10wt% residual FeO content in H2-DRI and in case of electrical heating of reducing gas.
Figure 8.
Oxygen demand and internal production of 5wt%, 7.12wt% (base) and 10wt% residual FeO content in H2-DRI and in case of electrical heating of reducing gas.
- 2.
-
Electrolyzer performance (system efficiency).As water electrolysis is the dominant electricity consumer at high H₂-DRI shares, electrolyzer efficiency strongly influences the total SEC and indirect emissions. Three LHV system-level efficiencies were assessed: 55%, 65%, and 75% (see Figure 9). In a fully H2-DRI-fed system the SEC goes up by 2.0 GJ/tSteel (14.5%) and down by 1.4 GJ/tSteel (10.5%) for the reduced efficiency of 55% and for the increased efficiency of 75%, respectively. The results show that electrolyzer efficiency has a strong influence on the overall system performance at high H₂-DRI shares, as hydrogen production accounts for a large share of the total electricity demand. Therefore, improvements in electrolysis technology are expected to play an important role in reducing the overall energy requirement.
Figure 9.
Sensitivity of specific electricity consumption (SEC) of the entire steel mill for the three electrolyzer system efficiencies, 55%, 65%(base), 75% system efficiency, and the two reducing gas heating strategies, electrical heating and hydrogen combustion.
Figure 9.
Sensitivity of specific electricity consumption (SEC) of the entire steel mill for the three electrolyzer system efficiencies, 55%, 65%(base), 75% system efficiency, and the two reducing gas heating strategies, electrical heating and hydrogen combustion.
- 3.
-
DRI metallization (FeO content in H₂-DRI).The residual FeO content of the H2-DRI depends on operating conditions (temperature, residence time, gas composition and utilization) and directly impacts downstream EAF oxygen practice because oxygen is already introduced with the metallic charge. To capture this effect, we varied the FeO content of H₂-DRI between 5 wt%, 7.12 wt% (base), and 10 wt%. This sensitivity primarily affects the EAF oxygen demand and therefore the oxygen self-sufficiency threshold. While changes in metallization influence the local oxygen demand within the EAF at high H₂-DRI share, Figure 8 demonstrates that the intersection of oxygen production and demand remains between the 10:90 and 13:87 H₂-DRI:scrap ratios. This indicates that the system-level oxygen self-sufficiency threshold is robust against variations in DRI metallization.
- 4.
-
Carbon intensity (electricity supply options).Since indirect emissions scale with electricity consumption, we additionally evaluated the emission performance under alternative grid mixes: Great Britain, Germany and China with average emission factors in 2025 of 175 kgCO2e /MWh, 339 kgCO2e/MWh and 485 kgCO2e/MWh, respectively [55]. The resulting specific carbon emission for all ratios are presented in Figure 10. Compared to the typical emissions of a BF-BOF steel mill of 2200 kgCO2e/tSteel the emissions can be reduced by 90.7% (green), 79.9% (Portugal), 65.3% (Great Britain), 36.5% (Germany), and 10.9% (China) even in a fully H2-DRI-based process. While underlining the importance of low-carbon electricity supply, it shows that even with a carbon-intensive grid, such as the grid in China, the concept is still capable of producing steel with less carbon emissions than with the conventional route.
Overall, the sensitivity analysis confirms the robustness of the main system-level findings, while highlighting electrolyzer efficiency and electricity carbon intensity as the dominant drivers of energy demand and emissions in hydrogen-based steelmaking.
4. Conclusions
This study demonstrates how integrating hydrogen-based direct reduction with electric arc furnace steelmaking reshapes the energy, material, and oxygen flows of an electrified steel mill. By modelling eight different H₂-DRI:scrap ratios, the impact of the metallic feed composition on electricity demand, CO₂ emissions, slag formation, and internal oxygen balance was quantified.
The results show that increasing the share of carbon-free H₂-DRI substantially raises the overall electricity demand of the system, primarily due to the high specific energy consumption of water electrolysis and the endothermic nature of iron ore reduction. At the same time, the electricity demand of the EAF changes only marginally with increasing primary iron input, while the electrolyzer becomes the dominant consumer of electrical energy. The total specific electricity consumption of the steel mill ranges from 1.1 GJ/tSteel (0.31 MWh/tSteel) for a fully scrap-based route to 13.9 GJ/tSteel (3.86 MWh/tSteel), for 100% H₂-DRI operation, in line with values reported in the literature. The emission analysis further shows that the environmental performance of the H₂-DRI–EAF route is highly sensitive to the carbon intensity of the electricity supply. While a fully scrap-based route exhibits only modest differences between grid-based and renewable electricity, total emissions of a 100% H₂-DRI steel mill decrease by more than 50% when renewable electricity is used. This effect is driven by the dominance of indirect emissions from the electricity consumption in the 100% H₂-DRI case.
Oxygen management becomes increasingly important with rising H₂-DRI shares. As oxygen is produced as a co-product of electrolysis at nearly zero marginal cost, the internal oxygen demand of the steel mill can be fully covered once the H₂-DRI share reaches approximately 10-13%, depending on the applied oxygen practice. Beyond this threshold, substantial quantities of surplus oxygen are generated, reaching up to 384 kgO2/tSteel in the 100% H₂-DRI case. This creates opportunities for improved process integration and potential industrial symbiosis, such as supplying oxygen to neighboring facilities. In contrast, a fully scrap-based EAF requires external oxygen supply, either via liquid oxygen deliveries or on-site air separation systems.
To assess the robustness of these results, a sensitivity analysis was performed considering variations in heating strategy, electrolyzer efficiency, DRI metallization, and electricity carbon intensity. The analysis shows that the identified oxygen self-sufficiency threshold remains largely unaffected by changes in key process parameters. While heating strategy and FeO content mainly influence the internal oxygen balance, electrolyzer efficiency has a stronger impact on the total electricity demand, particularly at high H₂-DRI shares. In addition, the emission analysis shows that, even by using a carbon-intensive grid (China), the H₂-DRI–EAF route remains less carbon-intensive than the conventional BF–BOF process.
The results underline that hydrogen-based steelmaking is technically feasible but strongly dependent on optimized energy management, slag design, and oxygen utilization strategies. The tight coupling between electrolyzer, DRI furnace, and EAF highlights the need for system-level optimization when designing electrified steel production routes. In particular, the strong dependence of electricity demand on the H₂-DRI:scrap ratio points to important trade-offs between deep decarbonization and electricity system requirements: higher H₂-DRI shares reduce emissions but substantially increase electricity demand, while scrap use lowers energy needs but is constrained by availability. The identification of internal oxygen balance at relatively low H₂-DRI shares further suggests opportunities for improved process integration. Future work should therefore address dynamic operation, economic performance, heat-recovery integration, and options for valorizing surplus oxygen to fully realize the potential of green steel production, while extending the framework to assess resource efficiency [56].
Acknowledgments
We gratefully acknowledge financial support provided by IST-ID in the context of the PRR AGENDA M-ECO2 Industrial cluster for advanced biofuel production. Authors are grateful to Fundação para a Ciência e a Tecnologia (FCT) for partially financing the work through projects UIPD/50009/2020-FCT and UIDB/50009-FCT. FCT partially financed A.S.Moita’s contract through CEECINST/00043/2021/CP2797/CT0005, doi:10.54499/CEECINST/00043/2021/CP2797/CT0005.
Nomenclature
| Abbreviations | ||
| Symbol | Definition | |
| BF-BOF | Blast furnace-basic oxygen furnace | |
| CHP | Combined heat and power plant | |
| CCPP | Combined cycle power plant | |
| EAF | Electric arc furnace | |
| DRI | Direct reduced iron/sponge iron | |
| H₂-DRI | Hydrogen-based direct reduced iron | |
| H₂-DRI-EAF | Electric arc furnace supplied with hydrogen-based direct reduced iron pathway | |
| SEC | Specific Electricity Consumption | |
| Parameter | ||
| Symbol | Definition | Unit |
| Average heat capacity | J/kgK | |
| Specific enthalpy of heated material | J/kg | |
| Specific enthalpy of incoming material | J/kg | |
| Specific enthalpy of outgoing material | J/kg | |
| Specific enthalpy of product | J/kg | |
| Specific enthalpy at reaction temperature | J/kg | |
| Reaction enthalpy | J | |
| Specific enthalpy at standard conditions (25°C) | J/kg | |
| Specific enthalpy at 600 °C | J/kg | |
| Mass of DRI | kg | |
| Mass of incoming material | kg | |
| Mass of all incoming material but DRI | kg | |
| Mass of outgoing material | kg | |
| Mass of product material | kg | |
| Mass of waste material | kg | |
| Balancing heat stream | J | |
| Total heat input | J | |
| Heat loss insulation | J | |
| Heat loss from cooling of output material | J | |
| Total heat output | J | |
| Recovered heat | J | |
| Temperature | K | |
| Electricity input | J | |
| Electricity BOP | J | |
| Electricity Heating | J | |
| Electricity Reaction (Electrolysis) | J | |
| Work input | J | |
| Work output | J |
Appendix

Table A1.
Feed/Product of DRI.
| Feed/Product | Component | Composition [wt%] | |
|---|---|---|---|
| Input | Iron Ore | Fe2O3 | 97.47 |
| SiO2 | 1.57 | ||
| Al2O3 | 0.44 | ||
| CaO | 0.52 | ||
| Hydrogen | H2 | 100 | |
| Oxygen (optional) | O₂ | 100 | |
| Output | H2-DRI | Fe | 89.4 |
| FeO | 7.12 | ||
| SiO2 | 2.18 | ||
| Al2O3 | 0.61 | ||
| CaO | 0.73 | ||
| Off Gas | H2O | 100 |
Table A2.
Feed/Product of EAF.
| Feed/Product | Component | Composition [wt%] | |
|---|---|---|---|
| Input | H2-DRI | Fe | 89.36 |
| FeO | 7.12 | ||
| SiO₂ | 2.18 | ||
| Al2O3 | 0.61 | ||
| CaO | 0.73 | ||
| Scrap | Fe | 98.50 | |
| C | 0.40 | ||
| Si | 0.30 | ||
| Mn | 0.80 | ||
| SiO₂ | 0.64 | ||
| Carbon Powder | C | 100 | |
| Quicklime | CaO | 96.75 | |
| CO₂ | 1.50 | ||
| MgO | 1.66 | ||
| SiO₂ | 0.09 | ||
| Dolime | CaO | 66.70 | |
| MgO | 32.17 | ||
| Al2O3 | 0.34 | ||
| SiO₂ | 0.77 | ||
| Bauxite | Al2O3 | 100 | |
| Oxygen | O₂ | 100 | |
| Output | Steel | Fe | 99.75 |
| C | 0.25 | ||
| Slag | CaSiO3 | 28.36 | |
| CaO | 10.05 | ||
| CaAl2O4 | 16.83 | ||
| FeO | 28.76 | ||
| MnO | 9.32 | ||
| MgO | 6.68 | ||
| Fluegas | CO₂ | 70.20 | |
| CO | 29.80 |
References
- Hasanbeigi. Steel Climate Impact 2022- An International Benchmarking of Energy and CO2 Intensities. 2022. Available online: https://www.globalefficiencyintel.com.
- Fan, Z.; Friedmann, S. J. Low-carbon production of iron and steel: Technology options, economic assessment, and policy. Joule 2021, vol. 5(no. 4), 829–862. [Google Scholar] [CrossRef]
- Gielen, D. CO2 removal in the iron and steel industry. Energy Convers. Manag. 2003, vol. 44. [Google Scholar] [CrossRef]
- Johnson, S.; Deng, L.; Gençer, E. Environmental and economic evaluation of decarbonization strategies for the Indian steel industry. Energy Convers. Manag. 2023, vol. 293. [Google Scholar] [CrossRef]
- Vattenfall. HYBRIT: SSAB, LKAB and Vattenfall to start up the world’s first pilot plant for fossil-free steel. Available online: https://group.vattenfall.com/press-and-media/pressreleases/2020/hybrit-ssab-lkab-and-vattenfall-to-start-up-the-worlds-first-pilot-plant-for-fossil-free-steel (accessed on Oct. 21 2025).
- Stegra, “Our Boden plant,” Stegra. Available online: https://stegra.com/the-boden-plant (accessed on Oct. 21 2025).
- Björkman; Samuelsson, C. Recycling of Steel. In Handbook of Recycling: State-of-the-art for Practitioners, Analysts, and Scientists; Elsevier Inc., 2014; pp. 65–83. [Google Scholar] [CrossRef]
- Wang, R. R.; Zhao, Y. Q.; Babich, A.; Senk, D.; Fan, X. Y. Hydrogen direct reduction (H-DR) in steel industry—An overview of challenges and opportunities. J. Clean. Prod. 2021, vol. 329. [Google Scholar] [CrossRef]
- Rodríguez Diez, J.; Tomé-Torquemada, S.; Vicente, A.; Reyes, J.; Orcajo, G. A. Decarbonization Pathways, Strategies, and Use Cases to Achieve Net-Zero CO2 Emissions in the Steelmaking Industry. Energies . 2023, vol. 16(no. 21). [Google Scholar] [CrossRef]
- Haikarainen; Shao, L.; Pettersson, F.; Saxén, H. Mathematical optimization modeling for scenario analysis of integrated steelworks transitioning towards hydrogen-based reduction. Energy 2024, vol. 305. [Google Scholar] [CrossRef]
- Ellersdorfer, P.; Wang, C.; Saydam, S.; Canbulat, I.; MacGill, I.; Daiyan, R. Unlocking new export opportunities: An open-source framework for assessing green iron and steel supply chains. Int. J. Hydrogen Energy 2024, vol. 92, 1366–1374. [Google Scholar] [CrossRef]
- Cachola, da Silveira; Peyerl, D. Mapping green hydrogen clusters in Brazil: A data-driven approach for industrial decarbonization. Int. J. Hydrogen Energy 2026, vol. 206. [Google Scholar] [CrossRef]
- Bhaskar, A.; Assadi, M.; Somehsaraei, H. N. Decarbonization of the iron and steel industry with direct reduction of iron ore with green hydrogen. Energies . 2020, vol. 13(no. 3). [Google Scholar] [CrossRef]
- Krüger; Andersson, J.; Grönkvist, S.; Cornell, A. Integration of water electrolysis for fossil-free steel production. Int. J. Hydrogen Energy 2020, vol. 45(no. 55), 29966–29977. [Google Scholar] [CrossRef]
- Vogl, V.; Åhman, M.; Nilsson, L. J. Assessment of hydrogen direct reduction for fossil-free steelmaking. J. Clean. Prod. 2018, vol. 203, 736–745. [Google Scholar] [CrossRef]
- Alikulov, K.; Aminov, Z.; Anh, L. H.; Xuan, T. D.; Kim, W. Comparative Technical and Economic Analyses of Hydrogen-Based Steel and Power Sectors. Energies . 2024, vol. 17(no. 5). [Google Scholar] [CrossRef]
- Material Economics, Industrial Transformation 2050 Pathways to Net-Zero Emissions from EU Heavy Industry; 2019.
- Khan, M. A.; Powell, M.; Tampier, M.; Thorn, E.; Layzell, D. “Hydrogen and the Decarbonization of Steel Production in Canada: Reaching Economies of Scale,” 2023. Available online: https://transitionaccelerator.ca/reports/hydrogen-and-the-decarbonization-of-steel-.
- Megasa. “Megasa: Liderando o aço sustentável, Relatório de Sustentabilidade 2023,” 2023. Available online: https://www.megasa.com/webfiles/data/WebData/Media/SOSTENIBILIDAD/Documentos/MEMORIA%20DE%20SOSTENIBILIDAD/2023%20MEMORIA%20DE%20SOSTENIBILIDAD_11266509_PT.pdf (accessed on Jan. 21 2025).
- Ji, Y.; et al. , Development and Application of Hydrogen-Based Direct Reduction Iron Process. Processes 2024, vol. 12(no. 9). [Google Scholar] [CrossRef]
- Gyllenram, R.; Arzpeyma, N.; Wei, W.; Jönsson, P. G. Driving investments in ore beneficiation and scrap upgrading to meet an increased demand from the direct reduction-EAF route. Mineral. Econ. 2022, vol. 35, 203–220. [Google Scholar] [CrossRef]
- J. Teeters, “Finding the Recipe for Hydrogen Heating.”. Available online: https://www.midrex.com/commentary/finding-the-recipe-for-hydrogen-heating/ (accessed on Oct. 15 2025).
- Duarte, P.; Becerra, J.; Carlos, Lizcano; Martinis, A. “ENERGIRON Direct Reduction Technology - Economical, Flexible, Environmentally Friendly,” Sep. 2021. Available online: https://tenova.com/sites/default/files/2021-09/2007-ENERGIRON-Direct-Reduction-Technology-Economical-Flexible-Environmentally-Friendly.pdf (accessed on Oct. 09 2025).
- Rosner, et al. Green steel: design and cost analysis of hydrogen-based direct iron reduction. Energy Environ. Sci. 2023, vol. 16(no. 10), 4121–4134. [Google Scholar] [CrossRef]
- Zakeri, A.; Coley, K. S.; Tafaghodi, L. Hydrogen-Based Direct Reduction of Iron Oxides: A Review on the Influence of Impurities. Sustainability 2023, vol. 15(no. 17). [Google Scholar] [CrossRef]
- Hornby, S.; Brooks, G. Impact of Hydrogen DRI on EAF Steelmaking. Available online: https://www.midrex.com/tech-article/impact-of-hydrogen-dri-on-eaf-steelmaking/ (accessed on Aug. 29 2025).
- Echterhof, T. Review on the use of alternative carbon sources in EAF steelmaking. Metals . 2021, vol. 11(no. 2), 1–16. [Google Scholar] [CrossRef]
- Sotoodeh, K. “Material selection and corrosion,” in Subsea Valves and Actuators for the Oil and Gas Industry; Elsevier, 2021; pp. 421–457. [Google Scholar] [CrossRef]
- Agnihotri, A.; Singh, P. K.; Singh, D.; Gupta, M. Foamy slag practice to enhance the energy efficiency of electric arc furnace: An industrial scale validation. In in Materials Today: Proceedings; Elsevier Ltd, 2021; pp. 1537–1542. [Google Scholar] [CrossRef]
- Bararzadeh Ledari, M.; Khajehpour, H.; Akbarnavasi, H.; Edalati, S. Greening steel industry by hydrogen: Lessons learned for the developing world. Int. J. Hydrogen Energy 2023, vol. 48(no. 94), 36623–36649. [Google Scholar] [CrossRef]
- Barker, K. J.; Blumenschein, C. D.; Bowmen, B.; Chan, A. H. The making, shaping, and treating of steel, 11th ed.; Association for Iron & Steel Technology (AIST), 2012. [Google Scholar]
- Arzpeyma, N.; Ersson, M.; Jönsson, P. G. Mathematical modeling of postcombustion in an Electric Arc Furnace (EAF). Metals . 2019, vol. 9(no. 5). [Google Scholar] [CrossRef]
- Manocha, S.; Ponchon, F. Management of lime in steel. Metals . 2018, vol. 8(no. 9). [Google Scholar] [CrossRef]
- Barchowsky, A.; et al. “Electric Arc Furnace Steelmaking and Slag Formation, Composition, and Distribution,” in Health Risk Considerations for the Use of Unencapsulated Steel Slag; National Academies Press, 2023; Volume ch. 2, pp. 1–148. [Google Scholar] [CrossRef] [PubMed]
- Kirschen, M. Visualization of slag data for efficient monitoring and improvement of steelmaking slag operation in electric arc furnaces, with a focus on MgO saturation. Metals . 2021, vol. 11(no. 1), 1–10. [Google Scholar] [CrossRef]
- Yildirim, Z.; Prezzi, M. Chemical, mineralogical, and morphological properties of steel slag. Adv. Civ. Eng. 2011, vol. 2011. [Google Scholar] [CrossRef]
- Wallwork; Voelker, B. “MIDREX® Combination Plant-Designed for Changing Market Conditions,” Midrex. Available online: https://www.midrex.com/tech-article/midrex-combination-plant-designed-for-changing-market-conditions/ (accessed on Sep. 12 2025).
- Nduagu, E. I.; et al. Comparative life cycle assessment of natural gas and coal-based directly reduced iron (DRI) production: A case study for India. J. Clean. Prod. 2022, vol. 347. [Google Scholar] [CrossRef]
- Badgett, A.; et al. “Updated Manufactured Cost Analysis for Proton Exchange Membrane Water Electrolyzers,” 2023. Available online: www.nrel.gov/publications.
- US Department of Energy. “Bandwidth Study on Energy Use and Potential Energy Saving Opportunities in U.S. Iron and Steel Manufacturing,” Jun. 2015. Available online: https://www.energy.gov/sites/prod/files/2015/08/f26/iron_and_steel_bandwidth_report_0.pdf (accessed on Sep. 02 2025).
- National Institute of Standards and Technology. NIST Chemistry WebBook - NIST Standard Reference Database Number 69. [CrossRef]
- Liu, N.; Li, Q.; Zou, Z. S.; Yu, A. B. Discussion on chemical energy utilisation of reducing gas in reduction shaft furnace. Ironmak. Steelmak. 2014, vol. 41(no. 8), 568–574. [Google Scholar] [CrossRef]
- International Renewable Energy Agency. IRENA, Green Hydrogen Cost Reduction Scaling Up Electrolysers. 2020. Available online: www.irena.org/publications.
- The Energy and Resources Institute (TERI). “Energy Efficient Technology Packages for Electric Arc Furnace,” 2017. Available online: www.in.undp.org.
- Peters; Malfa, E.; Matino, I.; Colla, V. “Improve the EAF scrap route for a sustainable value chain in the EU Circular Economy scenario - Roadmap,” Jun. 2021. Available online: www.estep.eu.
- Associação de Energias Renováveis (APREN). “Production Electricity Generation by Energy Sources in Mainland Portugal in 2025.”. Available online: https://www.apren.pt/en/renewable-energies/production (accessed on Aug. 23 2025).
- Elsheikh; Eveloy, V. Renewable hydrogen based direct iron ore reduction and steel making with grid assistance. Energy Convers. Manag. 2023, vol. 297. [Google Scholar] [CrossRef]
- Wang, S. D. C.; Walsh; Weng, Z.; Haynes, M. W.; Summerfield, D.; Feitz, A. Green steel: Synergies between the Australian iron ore industry and the production of green hydrogen. Int. J. Hydrogen Energy 2023, vol. 48(no. 83), 32277–32293. [Google Scholar] [CrossRef]
- Schlömer, S.; et al. Annex III: Technology-specific Cost and Performance Parameters; Cambridge University Press: Cambridge, 2014. [Google Scholar]
- Eshkaftaki, Taji; Baniasadi, E.; Parvanian, A. M.; Amiri, A. In-house green hydrogen production for steelmaking decarbonization using steel slag as thermal energy storage material: A life cycle assessment. Energy 2024, vol. 313. [Google Scholar] [CrossRef]
- Xu, S.; Chen, H.; Ding, Y.; Li, J.; Zhong, Z. Industrial Waste Heat Utilization Potential in China: Measurement and Impacts on Carbon Peaking and Carbon Neutrality Pathways. Energies . 2026, vol. 19(no. 2), 292. [Google Scholar] [CrossRef]
- Eckl, F.; Moita, A.; Castro, R.; Neto, R. C. Valorization of the by-product oxygen from green hydrogen production: A review. Appl. Energy 2025, vol. 378. [Google Scholar] [CrossRef]
- Eckl, F.; Moita, A.; Costa Neto, R. Cost optimization of electrolytic oxygen distribution: A mathematical framework with a green steel and hospital case study in Portugal. Renew. Energy Focus 2025, vol. 55, 100736. [Google Scholar] [CrossRef]
- Nasseriyan, P.; Jafari, S.; Khajehpour, H.; Edalati, S. Toward a green steel production powered by a hybrid renewable energy system: Techno-economic and environmental assessment. Energy Convers. Manag. 2025, vol. 332, 119716. [Google Scholar] [CrossRef]
- Electricity Maps, “The world’s most comprehensive electricity data platform,” 2026. Available online: https://www.electricitymaps.com/ (accessed on Apr. 17 2026).
- Carmona, G.; Whiting, K.; Carrasco, A.; Sousa, T. The evolution of resource efficiency in the United Kingdom’s steel sector: An exergy approach. Energy Convers. Manag. 2019, vol. 196, 891–905. [Google Scholar] [CrossRef]
Figure 1.
Process Flow of an integrated green steel mill following the H2-DRI-EAF route.
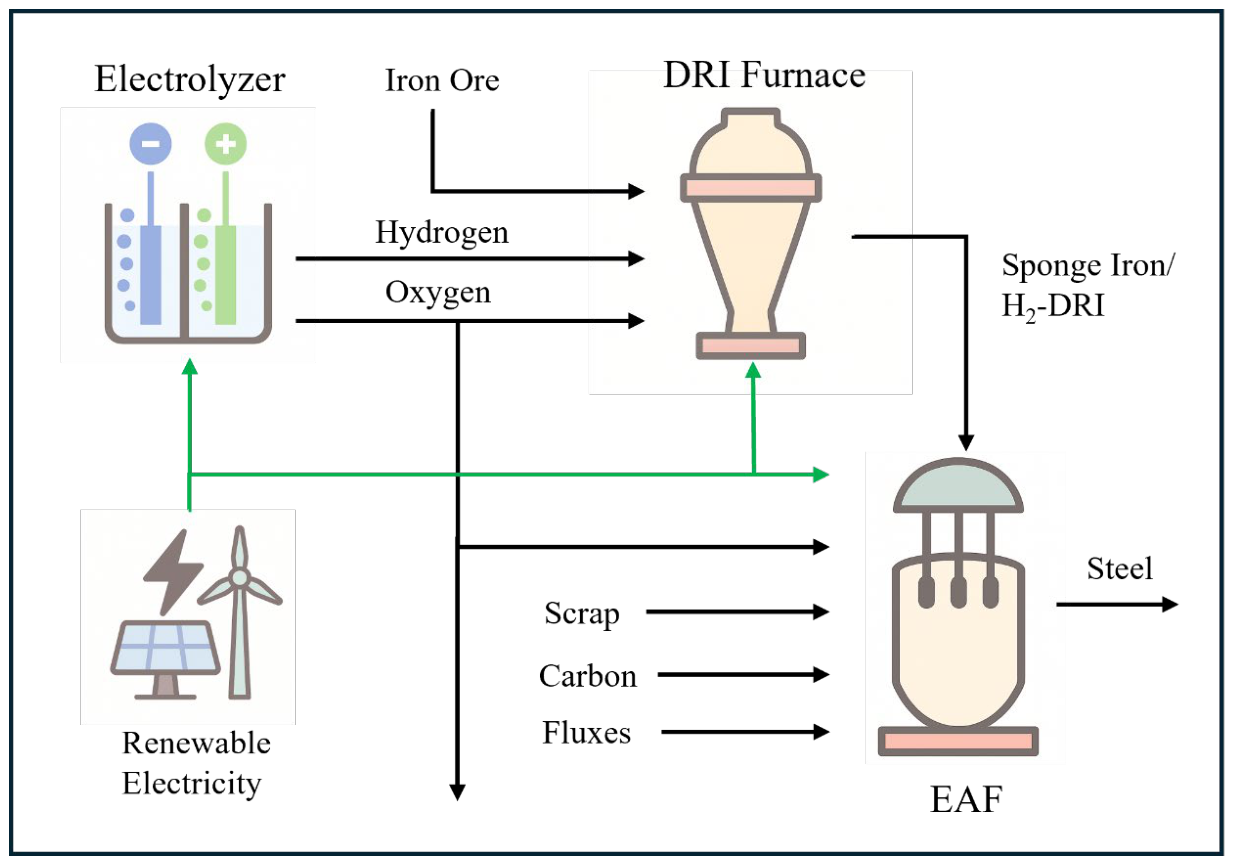
Figure 2.
General Framework for Energy Flows of electrolyzer, DRI furnace and EAF.
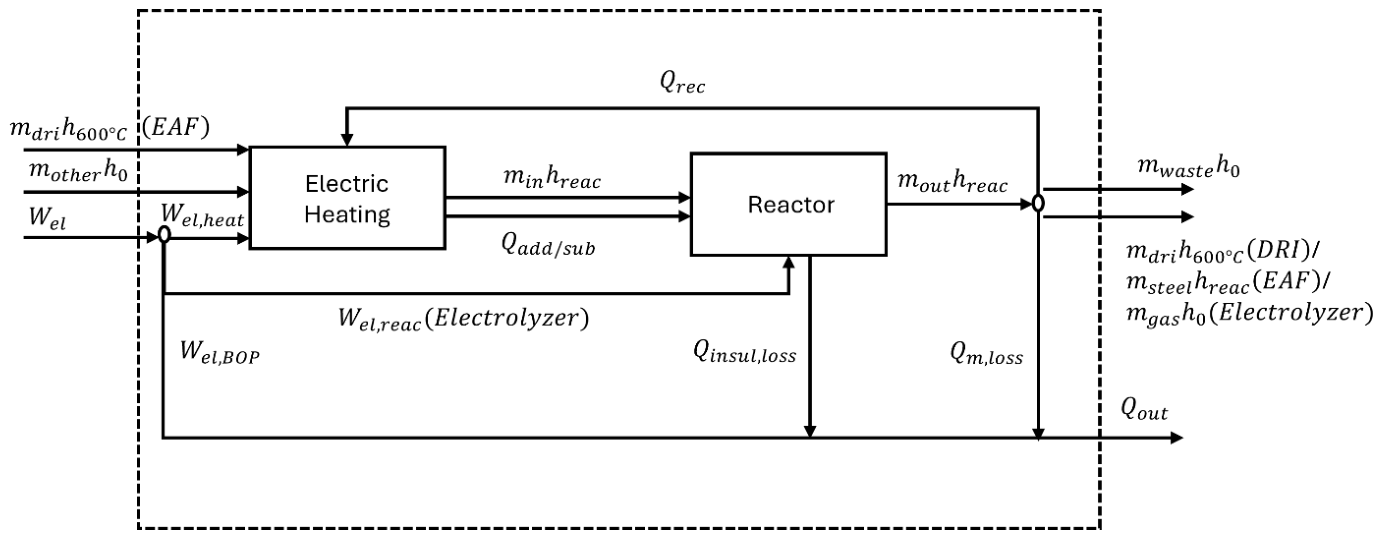
Figure 3.
Mass Flow of the Entire Steel Mill in kg for the Production of One Ton of Steel.
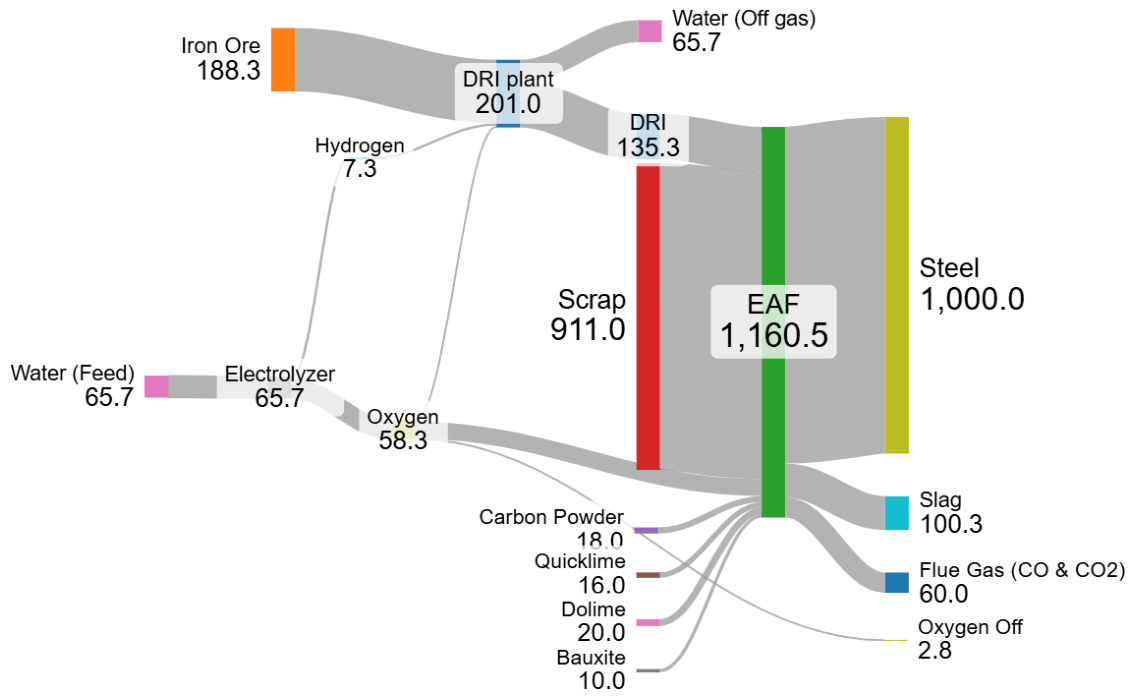
Figure 4.
Energy Flow in MJ/tSteel through each process: Electrolyzer (top), DRI furnace (middle), EAF (bottom).
Figure 4.
Energy Flow in MJ/tSteel through each process: Electrolyzer (top), DRI furnace (middle), EAF (bottom).
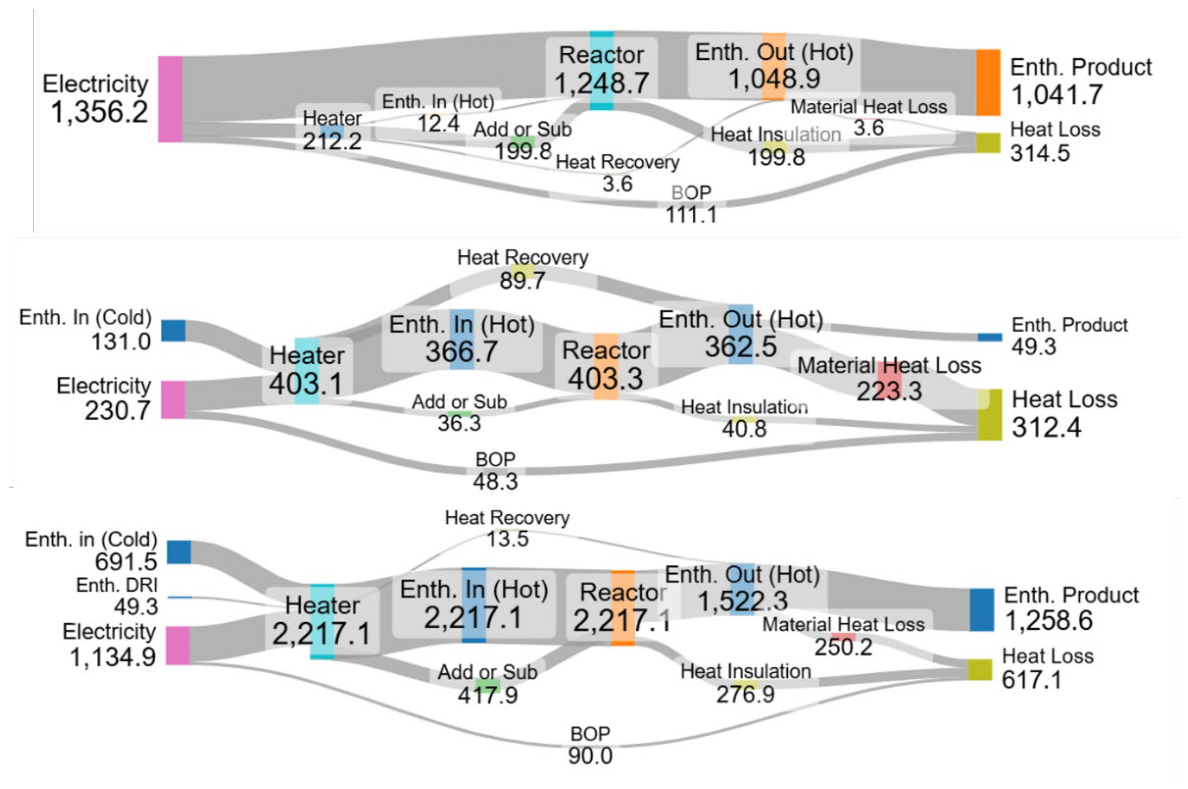
Figure 5.
Electricity Consumption per ton of steel of the three processes of the H2-DRI-EAF path with an 87% scrap/13% H2-DRI mix.
Figure 5.
Electricity Consumption per ton of steel of the three processes of the H2-DRI-EAF path with an 87% scrap/13% H2-DRI mix.
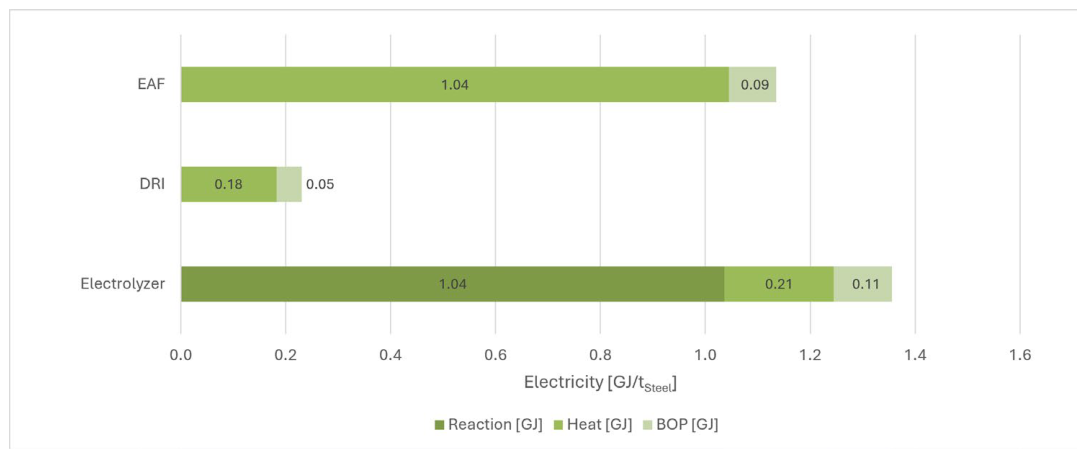
Figure 6.
Electricity Consumption of EAF, DRI and Electrolyzer (left axis) and emissions of grid-based and green scenario (right axis).
Figure 6.
Electricity Consumption of EAF, DRI and Electrolyzer (left axis) and emissions of grid-based and green scenario (right axis).
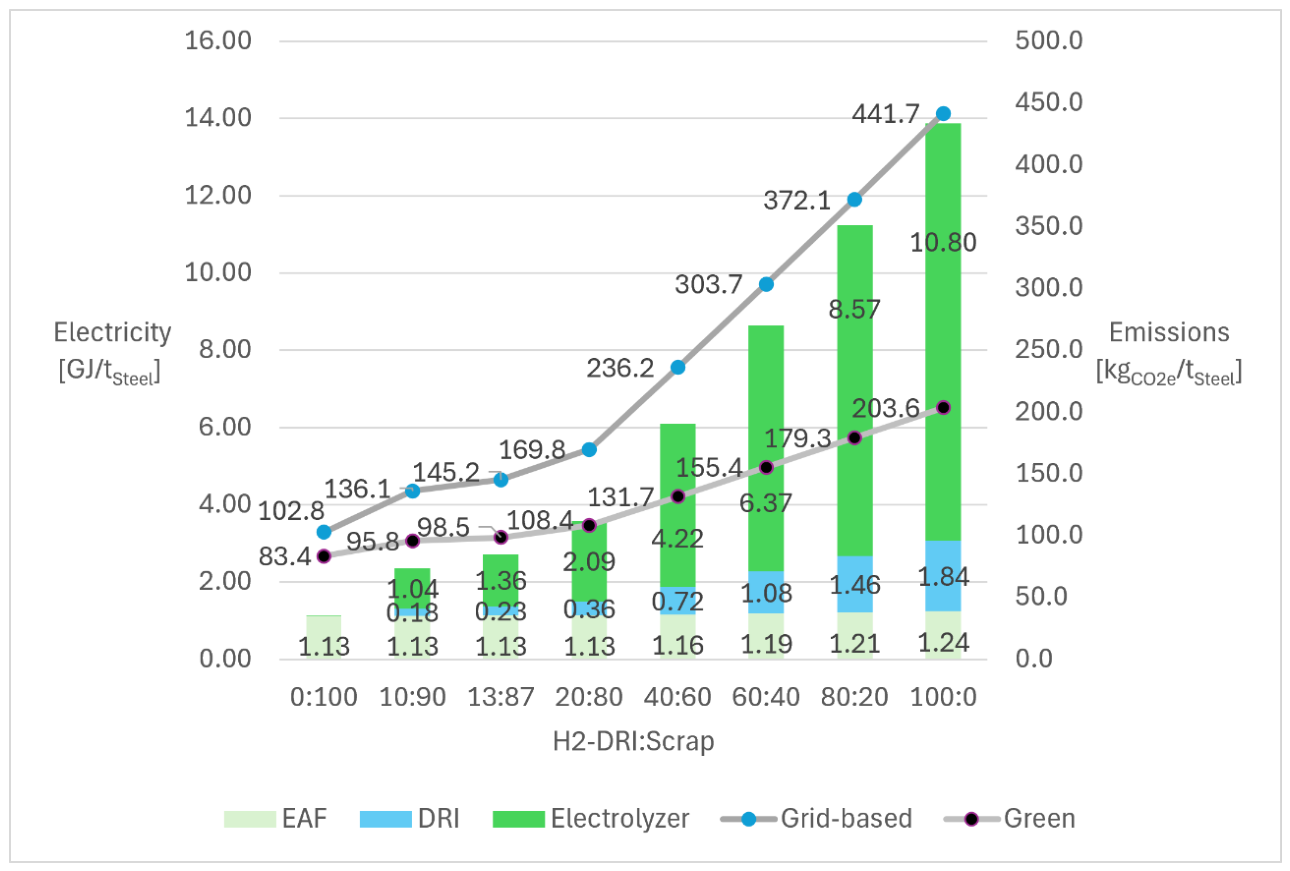
Figure 7.
Internal Oxygen Consumption of DRI and EAF vs. internal oxygen production of the electrolyzer in eight H2-DRI:scrap ratios.
Figure 7.
Internal Oxygen Consumption of DRI and EAF vs. internal oxygen production of the electrolyzer in eight H2-DRI:scrap ratios.
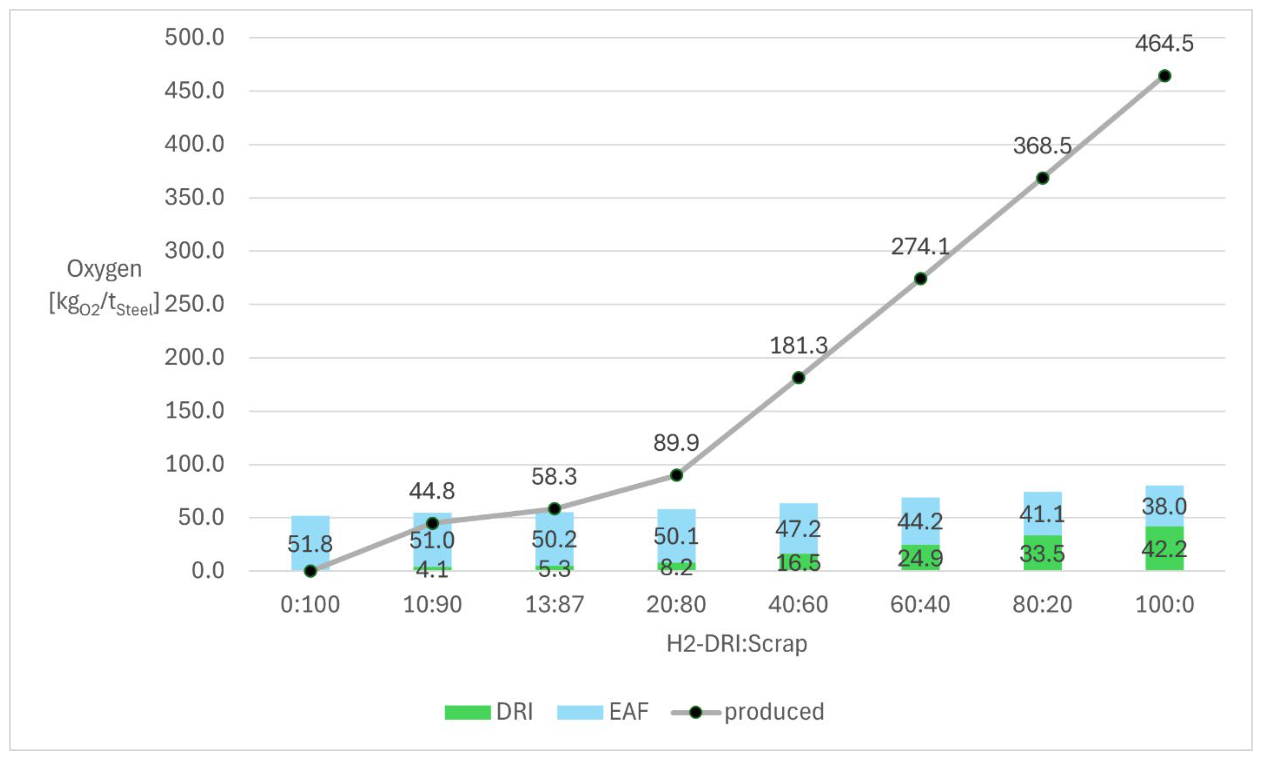
Figure 10.
Impact of variation of electricity supply on carbon emissions of the steel mill: green scenario (50% wind and 50% solar) vs electricity supply from various electricity grids.
Figure 10.
Impact of variation of electricity supply on carbon emissions of the steel mill: green scenario (50% wind and 50% solar) vs electricity supply from various electricity grids.
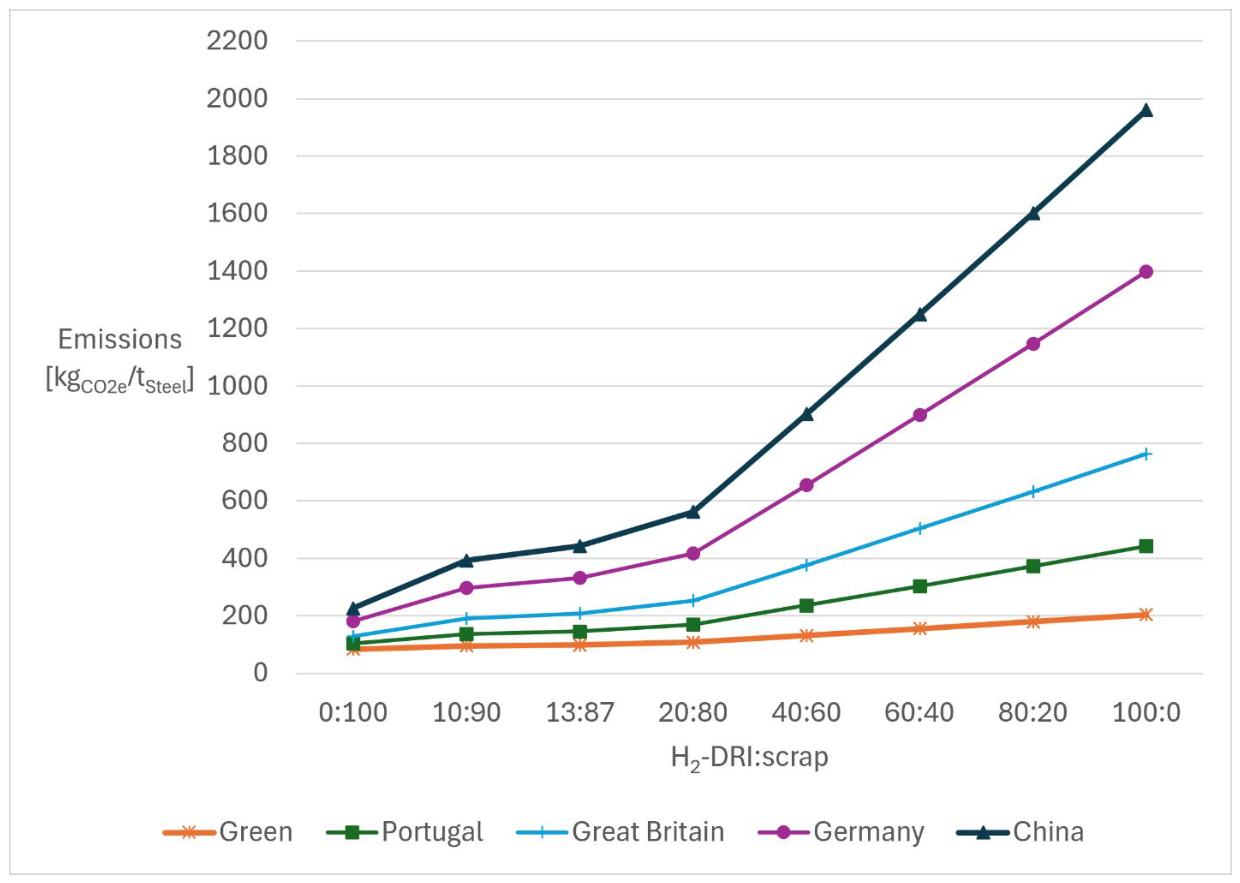
Table 1.
Portuguese Electricity Grid Mix (1st of January until 31st of July 2025) [46] and Life Cycle Carbon Emission Factors of Electricity Generation Technologies [49].
| Technology | Share in Portuguese Grid [%] | Emission Factor [kgCO2e/MWh] |
|---|---|---|
| Natural Gas (CHP) | 2.6 | 490 |
| Natural Gas (CCPP) | 10.7 | 490 |
| Biomass | 5.3 | 230 |
| Wind | 26.2 | 11 |
| Hydro (direct) | 36.9 | 4 |
| Hydro (pumped storage) | 7.4 | 58 |
| Solar | 10.9 | 48 |
Table 2.
Direct and indirect emissions in the grid-based (Portuguese grid mix) and green scenario.
| Grid-based | Green | |||
|---|---|---|---|---|
| Direct [kgCO2e/tSteel] | Indirect [kgCO2e/tSteel] |
Direct [kgCO2e/tSteel] | Indirect [kgCO2e/tSteel] | |
| Electrolyzer | 0 | 34.37 | 0 | 11.11 |
| DRI | 0 | 5.85 | 0 | 1.89 |
| EAF | 76.20 | 28.76 | 76.20 | 9.30 |
| Total | 145.19 | 98.51 | ||
Table 3.
Flux adjustment and carbon injection for each case to reach a similar slag composition in kg/tSteel.
Table 3.
Flux adjustment and carbon injection for each case to reach a similar slag composition in kg/tSteel.
| 0:100 | 10:90 | 13:87 | 20:80 | 40:60 | 60:40 | 80:20 | 100:0 | |
|---|---|---|---|---|---|---|---|---|
| Quicklime | 11 | 12 | 16 | 17 | 19 | 22 | 26 | 31 |
| Dolime | 25 | 24 | 20 | 20 | 20 | 20 | 18 | 15 |
| Bauxite | 12 | 10 | 10 | 9 | 8 | 8 | 7 | 6 |
| Carbon | 17 | 18 | 18 | 19 | 20.5 | 22.0 | 23.5 | 25.0 |
Table 4.
Minimal, maximal and average values for the slag composition taken from [34] and values for the eight cases.
Table 4.
Minimal, maximal and average values for the slag composition taken from [34] and values for the eight cases.
| Slag Comp. | Min-Max | Mean | 0:100 | 10:90 | 13:87 | 20:80 | 40:60 | 60:40 | 80:20 | 100:0 |
|---|---|---|---|---|---|---|---|---|---|---|
| CaO [wt%] | 2.3-60 | 31 | 27.4 | 28.6 | 29.7 | 31.0 | 33.0 | 35.1 | 37.2 | 39.4 |
| Al2O3 [wt%] | 2-22.6 | 6.8 | 12.1 | 10.8 | 10.9 | 10.2 | 10.1 | 10.7 | 10.5 | 10.4 |
| MgO [wt%] | 3.0-15 | 7.6 | 8.2 | 8.0 | 6.7 | 6.7 | 6.4 | 6.1 | 5.3 | 4.4 |
| SiO2 [wt%] | 5.0-32 | 15.9 | 13.5 | 14.5 | 14.7 | 15.3 | 16.5 | 17.4 | 18.5 | 19.5 |
| FeO [wt%] | 1-50.9 | 27.8 | 28.0 | 28.4 | 28.8 | 28.3 | 27.7 | 26.8 | 26.5 | 26.3 |
| MnO [wt%] | 0.4-15.6 | 4.4 | 10.7 | 9.7 | 9.3 | 8.5 | 6.2 | 3.9 | 1.9 | 0.0 |
| Basicity [-] | 1.9-2.4 | - | 2.0 | 2.0 | 2.0 | 2.0 | 2.0 | 2.0 | 2.0 | 2.0 |
| Weight [kg/tSteel] | 100-150 | - | 99.8 | 99.3 | 100.3 | 100.9 | 105.3 | 111.8 | 116.5 | 121.4 |
Disclaimer/Publisher’s Note: The statements, opinions and data contained in all publications are solely those of the individual author(s) and contributor(s) and not of MDPI and/or the editor(s). MDPI and/or the editor(s) disclaim responsibility for any injury to people or property resulting from any ideas, methods, instructions or products referred to in the content. |
© 2026 by the authors. Licensee MDPI, Basel, Switzerland. This article is an open access article distributed under the terms and conditions of the Creative Commons Attribution (CC BY) license (http://creativecommons.org/licenses/by/4.0/).
Copyright: This open access article is published under a Creative Commons CC BY 4.0 license, which permit the free download, distribution, and reuse, provided that the author and preprint are cited in any reuse.


