
Submitted:
02 July 2026
Posted:
02 July 2026
You are already at the latest version
Abstract
A series of novel complexes with the general formula [RuNO(L)Cl3], where L is a bidentate ligand (bpym, bpy, phen), was synthesized and characterized. The photochemical activity of fac-[RuNO(bpym)Cl3] (1), fac-[RuNO(phen)Cl3] (2), mer-[RuNO(phen)Cl3] (3), fac-[RuNO(bpy)Cl3] (4), mer-[RuNO(bpy)Cl3] (5) in DMSO was quantified under 450 nm irradiation using a flow-through system, allowing simultaneous IR and UV-Vis spectral monitoring. Quantum yields for photoinduced release of NO were determined as follows: 5.4 ± 0.5 % for fac-[RuNO(bpym)Cl3] (1); 0.8±0.1 % for fac-[RuNO(phen)Cl3] (2); 0.6±0.1 % for mer-[RuNO(phen)Cl3] (3); 3.7±0.1 % for fac-[RuNO(bpy)Cl3] (4); 2.1±0.1 % for mer-[RuNO(bpy)Cl3] (5). The product of photolysis of compound 5 in acetonitrile solution was isolated and structurally characterized as mer-[Ru(CH3CN)(bpy)Cl3] (6). Taking into account the presence of typical DNA intercalating ligands the complexes can be potentially exploited as photoNORMs.
Keywords:
ruthenium nitrosyl
; nitric oxide release
; photochemistry
; ruthenium complex
1. Introduction
Cancer remains one of the leading causes of mortality worldwide, with an estimated 19.3 million new cases and almost 10 million deaths reported globally in 2020 [1]. Despite the clinical success of platinum based chemotherapeutics, inaugurated by cisplatin [2], their use is hampered by severe systemic toxicity, intrinsic and acquired resistance, as well as a narrow spectrum of activity. This has stimulated an intensive search for alternative metal based anticancer agents [3].
Among non platinum candidates, ruthenium complexes have attracted considerable interest. Their octahedral geometry, accessible Ru(II)/Ru(III)/Ru(IV) redox couples, ligand exchange kinetics comparable to those of Pt(II), and propensity for transferrin and albumin mediated tumour delivery make them suitable scaffolds for drug design [4,5]. Several Ru(III) complexes have advanced into human clinical trials, including NAMI-A {(ImH)[trans-RuCl₄(DMSO)(Im)]} [5], KP1019 {(IndH)[trans-RuCl₄(Ind)₂]}, and its more soluble sodium analogue NKP 1339/BOLD 100 [6]. Moreover, the Ru(II) polypyridyl photosensitiser TLD 1433 has reached phase II clinical evaluation as a photodynamic agent against non muscle invasive bladder cancer [7]. These advances illustrate both the therapeutic versatility of the ruthenium platform and the growing relevance of light activated metal complexes for delivering spatiotemporally controlled cytotoxicity.
A complementary strategy for combating malignant tissue exploits the multifaceted biology of nitric oxide (NO), a small free-radical messenger whose role in vasodilation, neurotransmission and host defence was recognised by the 1998 Nobel Prize in Physiology or Medicine [8]. The action of NO is strongly concentration dependent [9,10,11] and, also, NO has the very short half-life in tissues (seconds) and the indiscriminate reactivity, which together call for prodrugs that liberate NO only at the desired site and time.
Photoactivated nitric oxide-releasing molecules (photoNORMs) address this requirement by coupling NO delivery to an optical trigger, allowing the dose to be tuned in real time and confined to the irradiated volume [12]. Within this family, ruthenium nitrosyl complexes are particularly attractive. Most {RuNO}⁶ species are diamagnetic and kinetically inert in the dark, yet undergo clean photodissociation of NO• with the concomitant formation of a solvento-Ru(III) fragment [13,14]. The wavelength, quantum yield and chemoselectivity of the Ru–NO photolysis are exquisitely sensitive to the ancillary ligand sphere.
Halide co-ligands, and chloride in particular, play a dual role in this design: they stabilise the {RuNO}⁶ core through strong σ- and π-donation, modulate the energy of the NO-dissociative MLCT/LMCT manifold, and give rise after photolysis to chlorido-/aqua-Ru(III) species that may themselves act as DNA-binding cytotoxins, in close analogy to the activation pathway of NAMI-A and KP1019 [5,15].
Ruthenium nitrosyl complexes bearing chloride and various N-donor ligands, including bipyridine and phenanthroline, were first synthesized and characterized as early as 1966 by Fairy and co-workers starting from RuNOCl₃ [16]. Subsequently, the structures of two geometric isomers of [RuNO(bpy)Cl₃] were determined and described by Haukka et al. in 1995 [17]. Nevertheless, the photoinduced release of NO from these complexes has not been investigated.
Building on these considerations, we report herein the synthesis and comprehensive characterization of a new family of charge neutral ruthenium nitrosyl complexes in which the inner coordination sphere contains chloride ligands together with phenanthroline (phen), bipyridine (bpy) or bipyrimidine (bpym). The photochemical behavior under monochromatic 450 nm LED irradiation was studied using a flow through cuvette system that permits the simultaneous acquisition of IR and UV spectral series. ESI mass spectrometry was employed to identify the resulting ruthenium containing photoproducts. Altogether, the collected data provide a coherent picture of how the chloride ligand environment governs the photochemistry and physicochemical profile of {RuNO}⁶ photoNORMs and, in our view, offer useful design guidelines for the next generation of light activated anticancer agents that deliver nitric oxide.
2. Results and Discussion
2.1. Synthesis and Crystal Structures
The new complexes 1-3 and earlier reported 4-5 were prepared with the same similar technique. A common precursor for obtaining new ruthenium nitrosyl complexes is K₂[RuNOCl₅], which is synthesized from ruthenium trichlorides [18]. The synthesis of trans-[RuNO(tpy)Cl₂]PF₆ reported by Hirano and colleagues [19] served as the starting point for the preparation of compounds with polydentate ligands. However, in contrast to the reported synthetic procedure for terpyridine, the addition of potassium chloride had no effect on the reaction yield in the case of the polydentate ligands presented in this work (Figure 1).
Upon addition of 1 equivalent of bidentate ligand (bpym/phen/bpy) to K₂[Ru(NO)Cl₅], the complexes [RuNO(L)Cl3] are formed. It should be noted that in the case of bipyrimidine and bipyridine, the fac- isomer is obtained (fac-[RuNO(bpym)Cl3] (1) and fac-[RuNO(bpy)Cl3] (4)) first, whereas phenanthroline affords the mer- isomer (mer-[RuNO(phen)Cl3] (3)). The formation of different geometrical isomers in the solid state has been reported previously by our research group. Specifically, bipyrimidine and bipyridine yield one complex isomer, while phenanthroline yields the other in the reaction with [RuNO(NH3)2(NO3)3] [20].
Interestingly, other geometrical isomers for phenanthroline and bipyridine were also isolated. For instance, fac-[RuNO(phen)Cl₃] (2) was obtained from the mother liquor after filtration of compound 3, while the mer- isomer of the bipyridine analogue, mer-[RuNO(bpy)Cl₃] (5), was formed upon addition of 2 equivalents of bpy to K₂[Ru(NO)Cl₅].
2.2. The Structural Information about Complexes 1-3
The structures of fac-[RuNO(bpym)Cl3] (1), fac-[RuNO(phen)Cl₃] (2), mer-[RuNO(phen)Cl3] (3) were determined by single-crystal XRD. The crystal structures of bipyridine compounds 4 and 5, were earlier reported by Haukka et al. [17].
The main bond distances of 1-3 are listed in Table 1 and are in good agreement with this class of compounds. Particularly, the Ru-N-O fragment has almost linear conformation, where Ru-NO and N-O distances are close to 1.74-1.75 and 1.13-1.14 Å, respectively. The Ru–N(L) bond lengths are about 2.1 Å, which is typical for ruthenium complexes with N-donor ligands.
All compounds whose crystal structures are reported herein display similar packing arrangements. The presence of the nitrosyl group, the organic aromatic H-donor ligand, and the chloro ligands coordinated to ruthenium results in Cl···H and O···H interactions being the dominant forces in the crystal packing. Hirshfeld surface and fingerprint plots were calculated (Figure S1-S3). The prevalence of hydrogen-involving intermolecular contacts is evidenced by the characteristic spikes in the fingerprint plots: 23.9 % Cl-H, 11.0 % O-H and 11.0 % N-H interactions in 1; 27.1 % Cl-H, 16.6 % C-H and 9.4 % O-H interactions in 2; 42.0 % Cl-H, 10.4 % C-H and 9.2 % O-H interactions in 3.
In the crystal structure of compound 1, molecules are paired through C–H···N interactions between two adjacent bipyrimidine ligands, with N···H distances of 2.758 Å and 2.835 Å (Fig.2, b). The bipyrimidine moieties of each pair are coplanar. These pairs are arranged into layers with an interlayer spacing of 3.080 Å and a lateral offset, characteristic of slipped π–π stacking (the centroid-to-centroid distance is 3.713 Å). Adjacent molecules, as depicted in Figure 2 (b), are oriented at an angle of 70.77°, forming identical pairs with the same N···H distances and interlayer separations. This arrangement gives rise to a bilayer packing motif of inverted layers in the crystal structure (Figure 2, c).
In the unit cell of compound 2, the phenanthroline ligand planes of all four molecules are non-parallel, with angles of 23.01°, 66.80°, and 71.68°. This arrangement gives rise to a herringbone-like packing motif parallel to the ab plane (Figure 3(c)).
In the unit cell of compound 3, pairs of molecules with parallel phenanthroline ligands form parallel planes with π–π stacking at 3.454 Å. The adjacent phenanthroline plane is rotated by an angle of 31.55° relative to the previous phenanthroline plane. As a result, a bilayer packing motif of the crystal structure is formed, parallel to the ab plane.
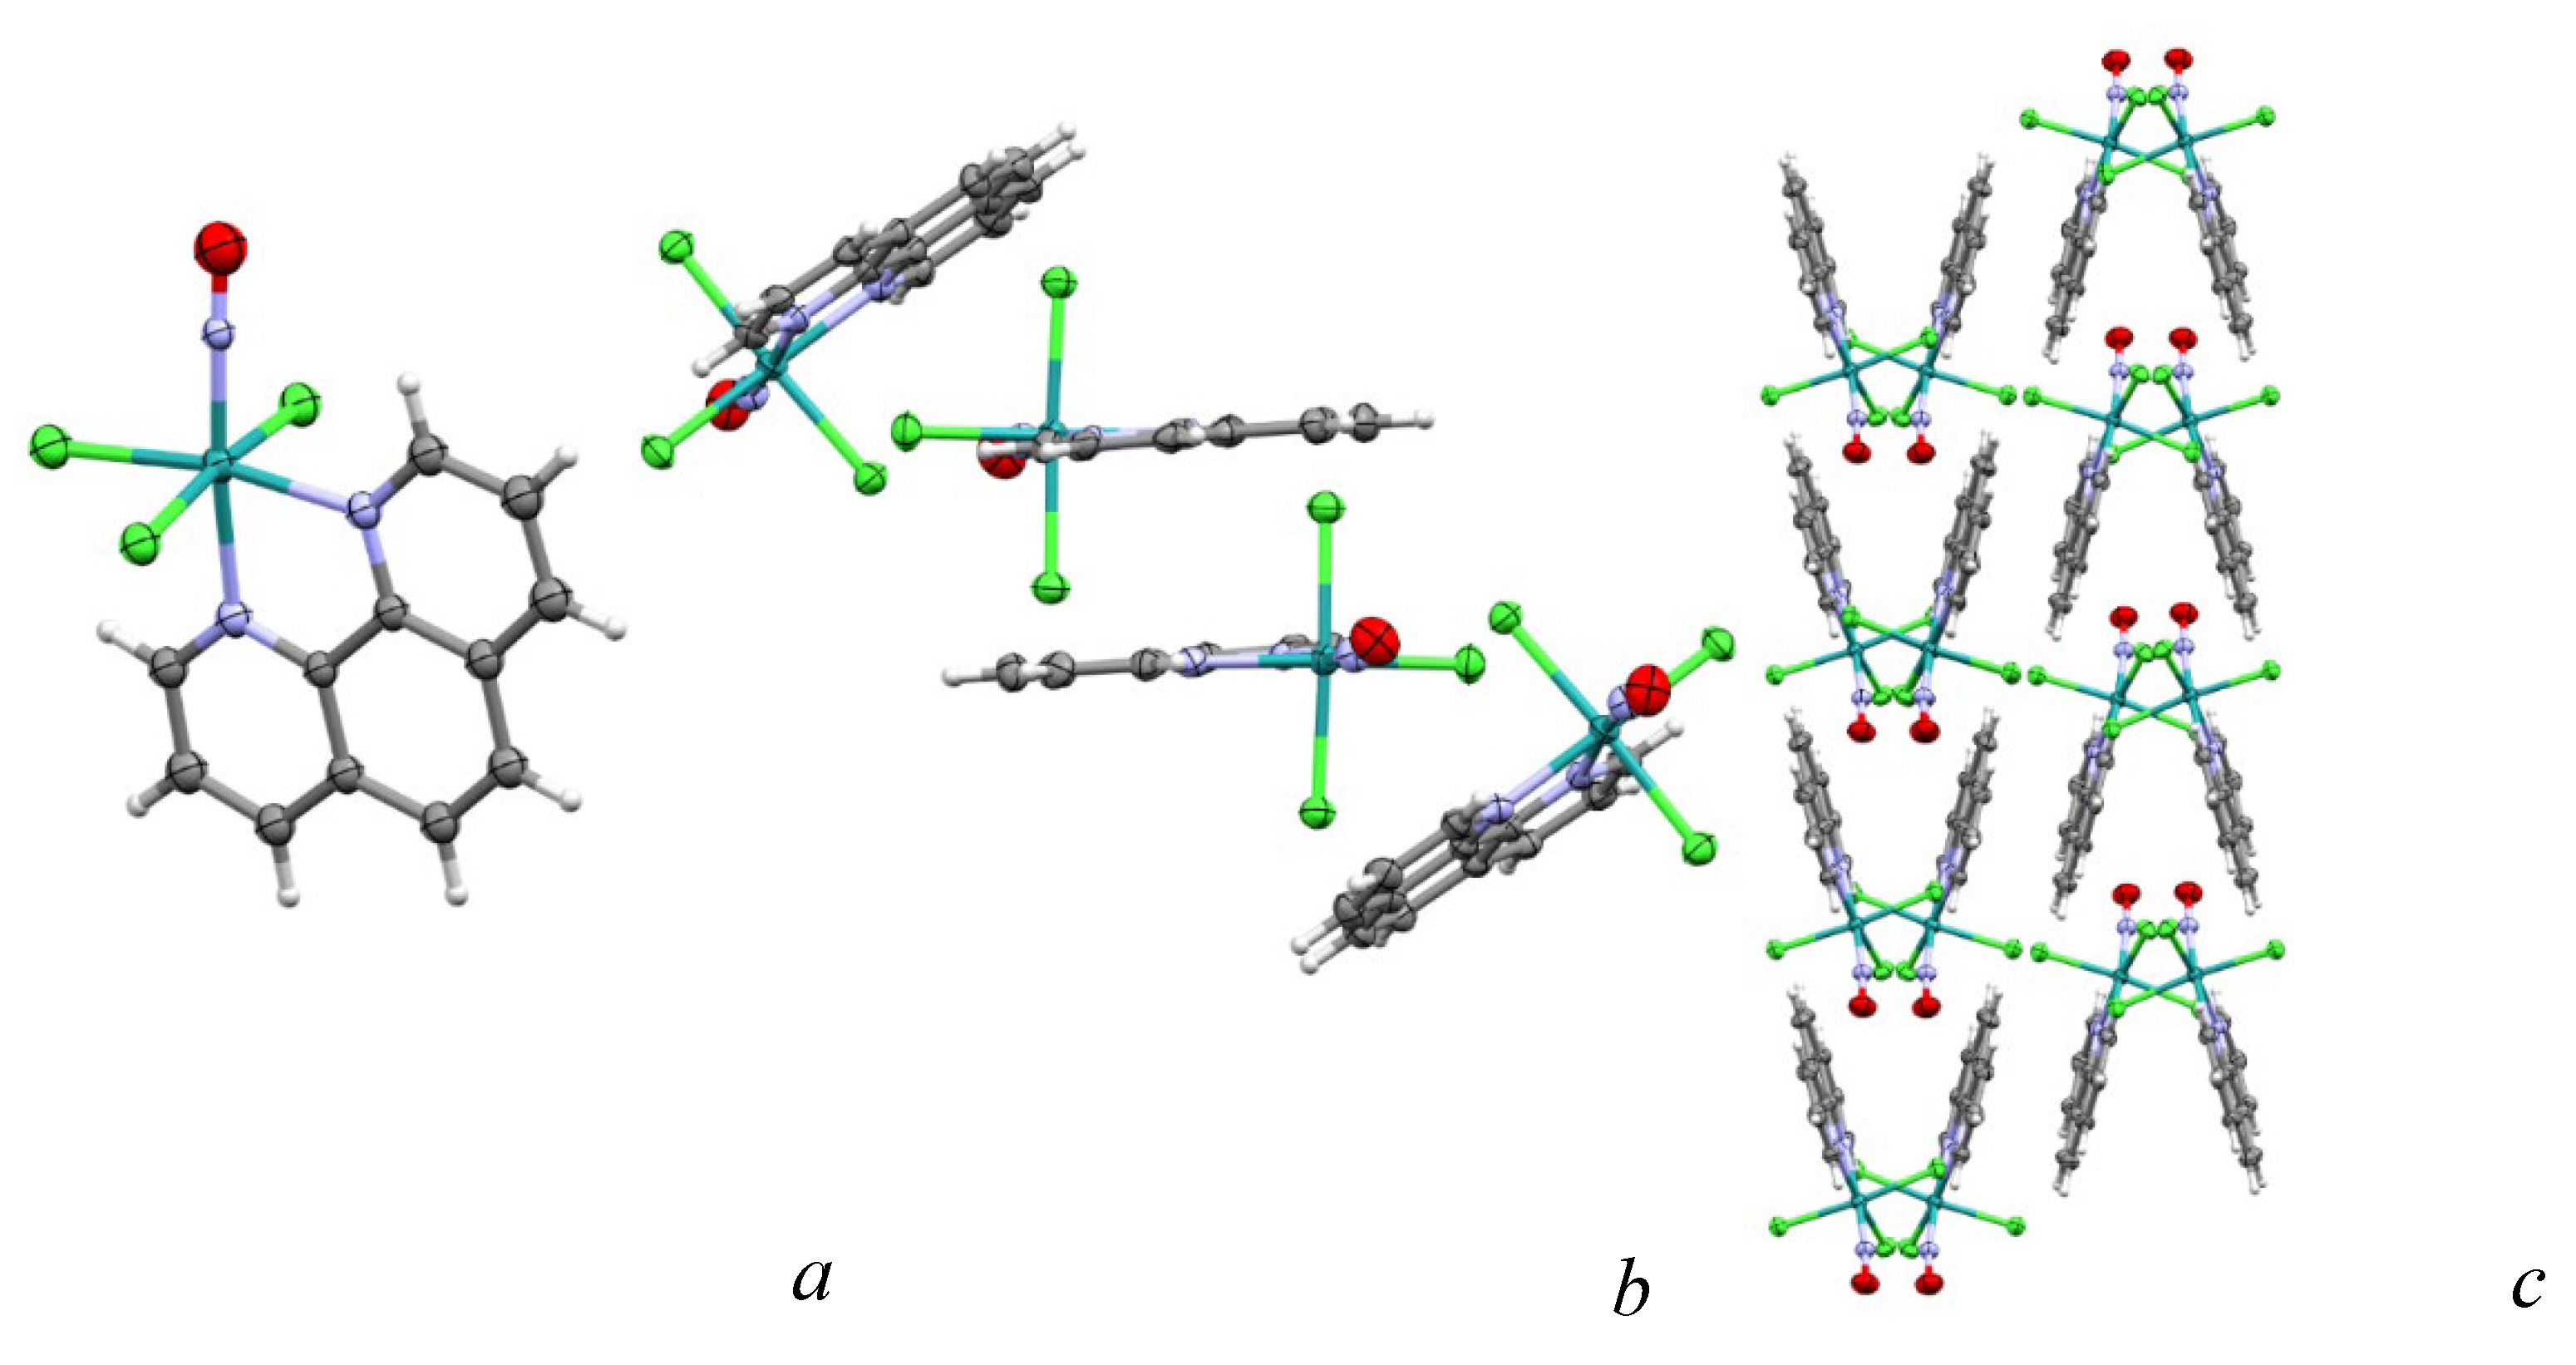
Figure 4.
Structural fragment of mer-[RuNO(phen)Cl3] (3) (panel a), crystallographic unit cell of 3 (panel b) and crystal packing of 3 (panel c). ADPs are given at the 50% probability level.
Figure 4.
Structural fragment of mer-[RuNO(phen)Cl3] (3) (panel a), crystallographic unit cell of 3 (panel b) and crystal packing of 3 (panel c). ADPs are given at the 50% probability level.
2.3. Stability in DMSO Solutions
Since further photochemical studies were carried out in DMSO solutions, it should be noted that the geometry of all crystalline products is preserved upon dissolution. For NMR spectroscopic investigations, samples were prepared by dissolving crystalline products 1–5 in DMSO d₆. The corresponding ¹H NMR spectra are provided in the Supplementary Information (Figure S4–S8). The ¹H NMR spectra of all investigated complexes exhibit characteristic signals in the range of 8–10 ppm, corresponding to the aromatic protons of the ligands.
In all fac- isomers (1, 2, 4), a mirror plane can be identified, which passes perpendicular to the plane of the aromatic organic ligand. Consequently, as in the case of the free ligand, signals corresponding to pairwise equivalent proton groups are observed with the downfield shift upon coordination to the metal center (Figure S4, S5, S7). In contrast, for the mer- isomers, i.e., compounds 3 and 5, the number of signals in the ¹H NMR spectrum corresponds to the number of protons in the organic ligand, since all protons are inequivalent (Figure S6, S8). In other words, in the mer- isomers, one coordination site of the bidentate ligand is in cis-position to the nitrosyl group, while the other is in trans-position, which results in the inequivalence of the protons. In the fac- isomers, however, both coordination sites of the bidentate ligand are in cis-position to the nitrosyl group.
2.4. Photoinduced NO Release
The experiments were carried out on the solutions with a concentration of 10-3 M in DMSO to track the UV-Vis and IR spectral changes accompanying NO release. For all five complexes, irradiation leads to a decrease in the intensity of the ν(NO) band in the IR spectra and an increase in absorption in the 300–500 nm region of the UV-Vis range—features characteristic of photo-processes involving nitric oxide release.
Since the reduction in band intensity results from the cleavage of the Ru–NO bond and a consequent decrease in the amount of the starting compound, the ratio of the band areas can be taken as the ratio of the nitrosyl complex concentrations at different time points. This approach enables direct determination of the reagent concentration from the IR spectra and allows the contributions of both the reactant and the photolysis products to the UV-Vis absorption to be accounted for. The experimental data set for compound 1 is presented in Figure 5, while the experimental data sets for compounds 2–5 are provided in the Supplementary Information (Figure S9–S12).
The quantum yields of photodissociation for compounds 1–5 were determined from the first 20 data points (recorded at 30 second intervals) and are listed in Table 2.
The quantum yield values upon irradiation with 450 nm light lie within the standard range for ruthenium nitrosyl complexes with N-heterocyclic ligands [21,22]. For complex 5, photolysis was also performed in acetonitrile instead of DMSO. Upon solvent replacement, no significant changes are observed in either the IR or optical spectra, but the quantum yield changes slightly, which is attributed to the higher acceptor number of acetonitrile [23,24].
2.5. TD-DFT Calculations
A trend is observed toward higher quantum yield values for the facial isomers of compounds 2–5 compared to the meridional ones—slight for the phenanthroline complex and nearly twofold for the bipyridine compound. TD-DFT calculations were performed to analyze the electronic transitions and molecular orbitals of these compounds. The general view of UV-VIS spectra was analyzed and the transitions with the calculated wavelengths in the neighborhood of 450±50 nm were selected. Since the main contribution to the NO release is related to the transitions to Ru-NO antibonding orbitals these transitions were further taken into consideration among selected. In all considered complexes LUMO+1, +2 are located on the Ru-NO coordinate and have antibonding Ru-NO character, while LUMO is mostly located on chloride ligands and LUMO+3 is predominantly located on the organic ligands.
Among the investigated complexes, compound 1 exhibited the highest quantum yield. The orbital contributions are summarized in Table S1 (SI). The calculated transitions closest to the irradiation wavelength occur at 441.0, 436.9, 430.2, 427.3, and 426.2 nm. The enhanced quantum yield of complex 1 may be partly attributed to the better energetic match between the excitation wavelength and the excited states that possess Ru–NO antibonding character, thereby facilitating more efficient population of NO-dissociative states.
Molecular orbital analysis indicates that the relevant excitations involve electron density transfer primarily from chloride-centered orbitals (HOMO–1 to HOMO–4) or from bipyrimidine ligand (HOMO–5). The HOMO–1 orbital is delocalized over the chloride ligands, the ruthenium center, and the nitrosyl ligand. For complex 1, the LUMO orbital is located on the ruthenium atom and two chloride ligands, while the LUMO+1 and LUMO+2 possess substantial electron density along the Ru–NO bond coordinate and are likely the most relevant acceptor orbitals for the NO photo release pathway owing to their pronounced Ru–NO antibonding character. The transitions to all the described orbitals exhibit a mixed LMCT/MLCT character. Accordingly, the transitions at 436.9, 430.2, and 426.2 nm are expected to contribute most significantly to NO photo release, as they populate LUMO orbitals possessing substantial Ru–NO antibonding character. Owing to the significant broadening of the absorption bands, transitions located close to the irradiation wavelength may influence the photolysis efficiency not only by increasing the fraction of absorbed photons, but also by increasing the probability of populating excited states with Ru–NO antibonding character. In contrast, more intense transitions located at shorter wavelengths contribute less under 450 nm irradiation because of the less efficiency of the excitation. The transition at 423.7 nm to the LUMO+3 orbital transfers electron density predominantly to π* orbitals localized on the bipyrimidine ligand and is therefore expected to contribute less efficiently to NO photo release.
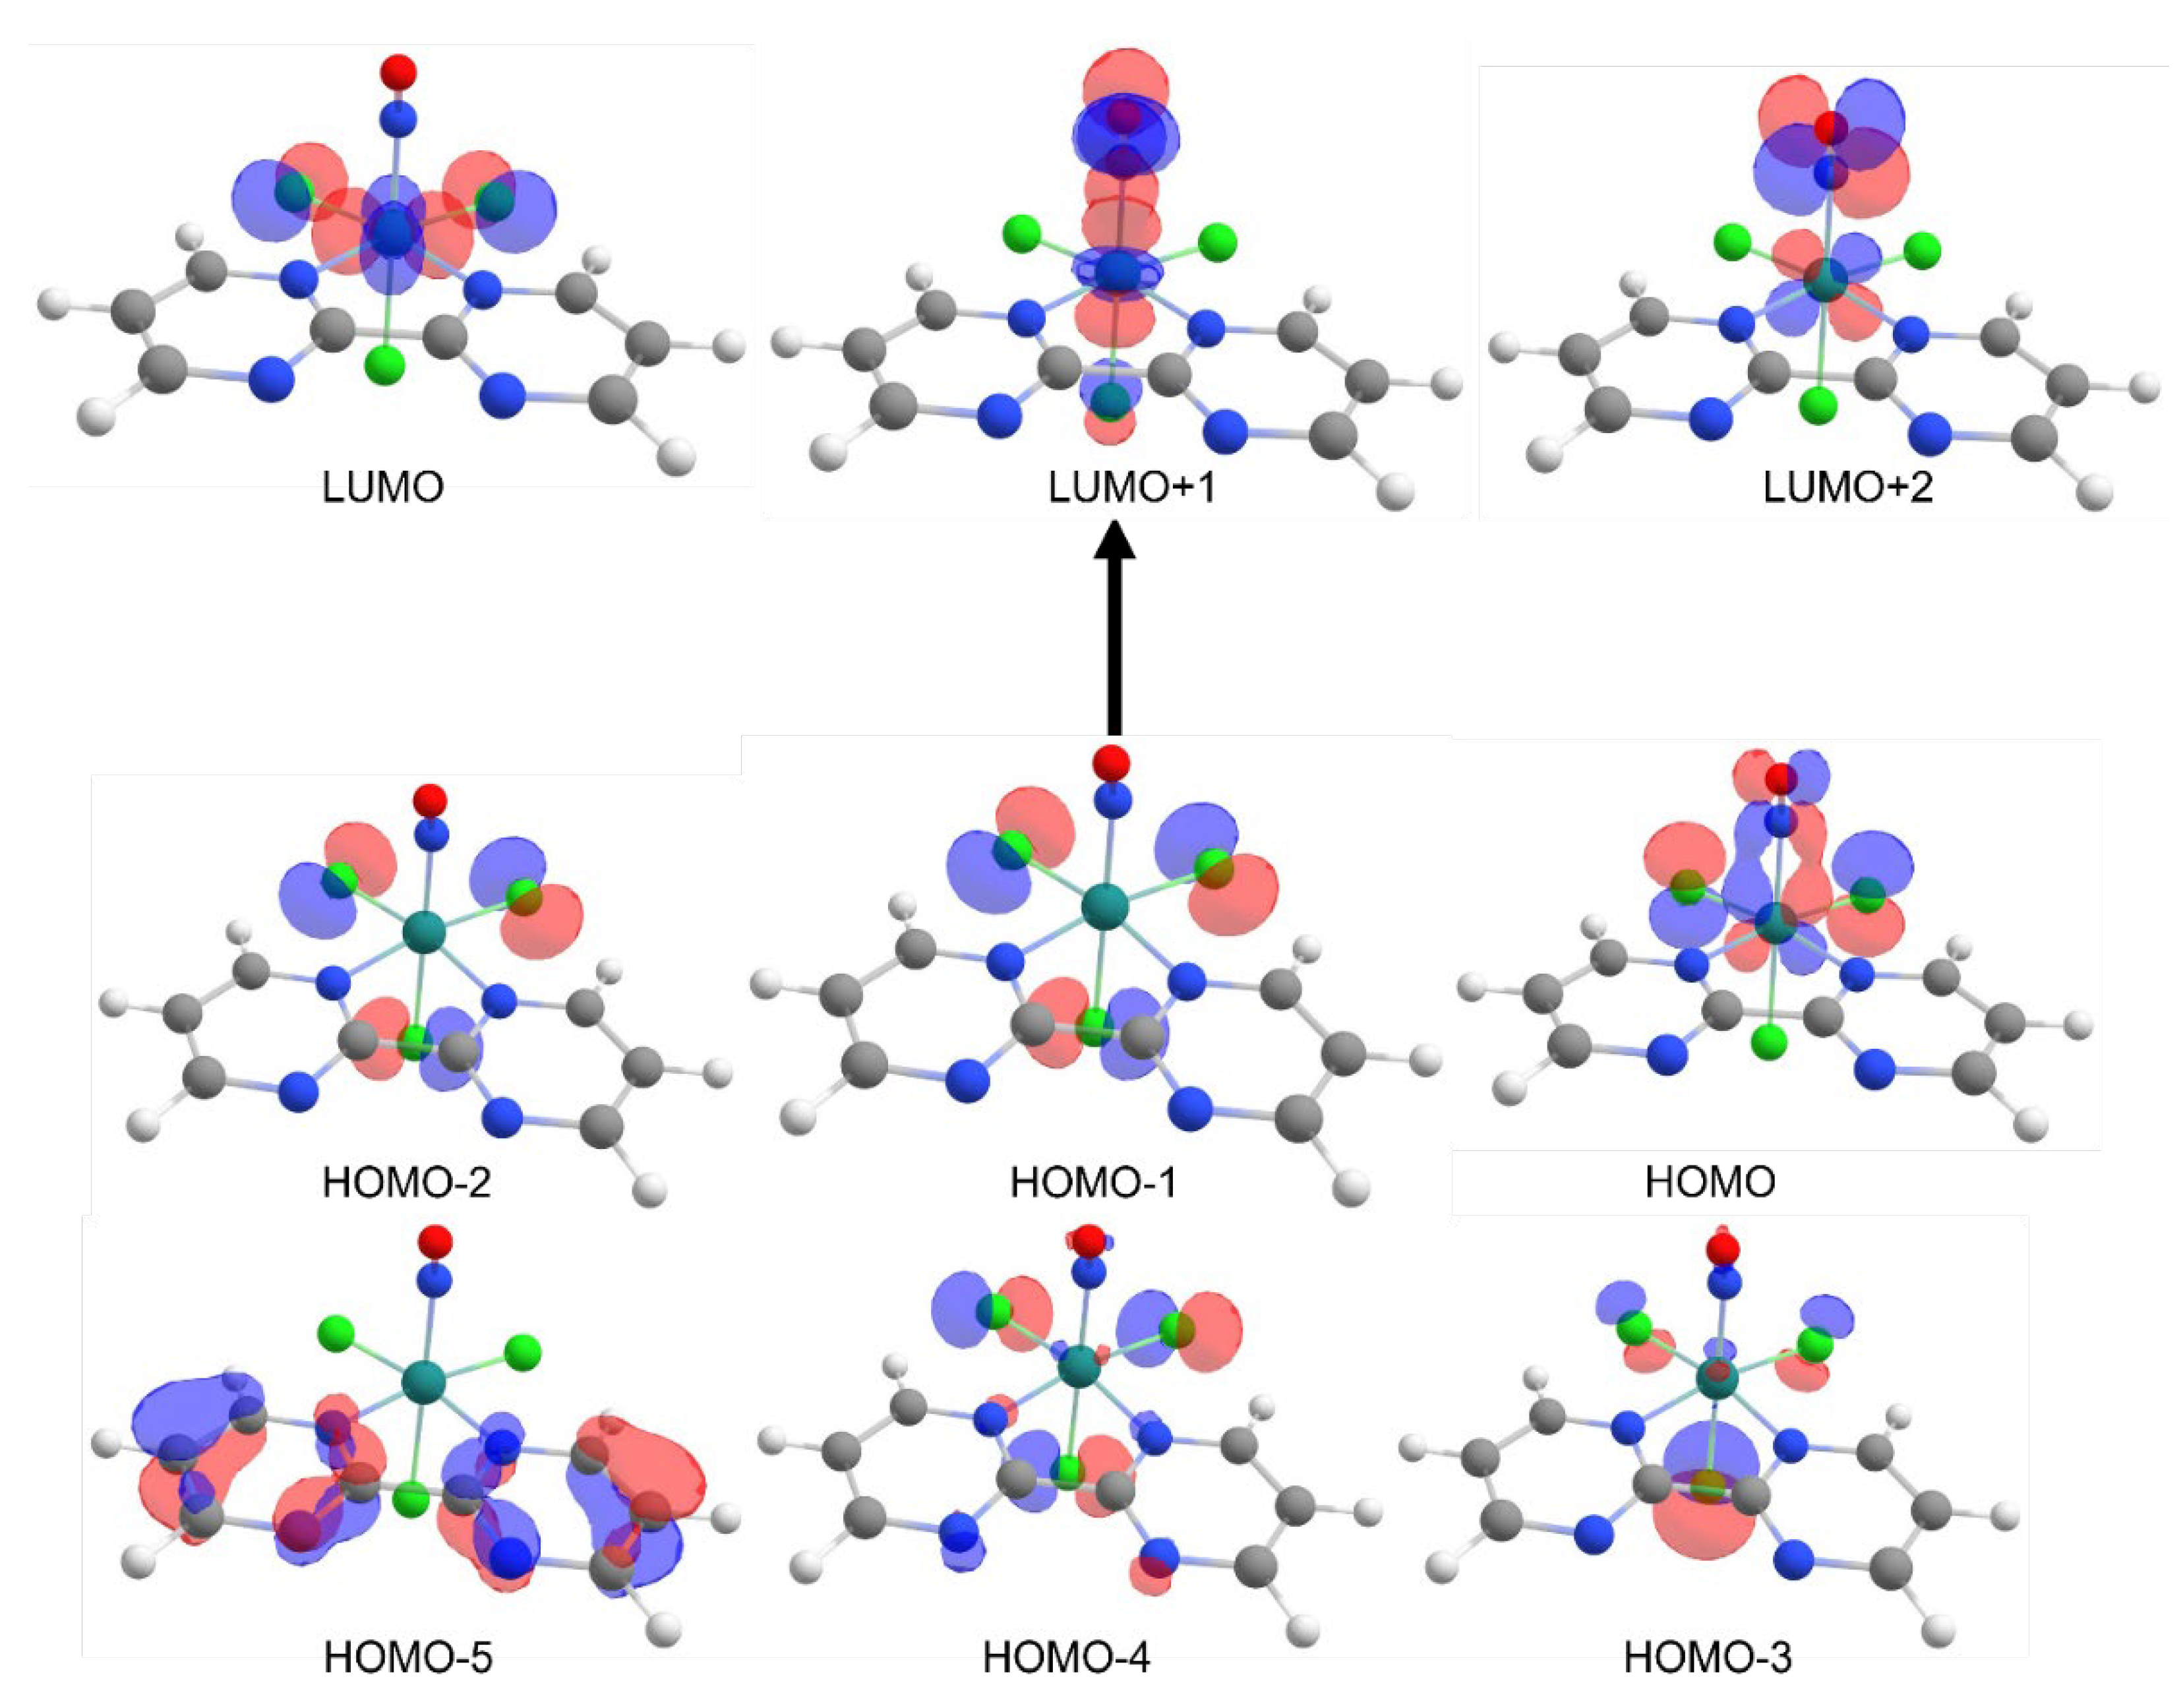
Figure 6.
Main orbitals contributing to the transitions for fac-[RuNO(bpym)Cl3] (1).
Comparison of the two isomers 2 and 3, which contain the phenanthroline ligand reveals that both compounds exhibited relatively low quantum yields, with a slight advantage for the facial isomer.
The HOMO–x orbitals are involved in the transitions for both isomers (Figure 7 and Figure 8). For the fac- complex, these are predominantly orbitals located on the chloride ligands, except for the HOMO–1 (Cl⁻, Ru, and nitrosyl group) and HOMO–5 (phenanthroline) orbitals. For the mer- isomer, contributions come from orbitals situated on phenanthroline (HOMO–2, HOMO–5) and on the Ru–NO unit (HOMO–1, HOMO–4). The transitions for the fac- isomer occur to an antibonding LUMO orbital, which is located on the Ru atom and two chloride ligands, and to an antibonding LUMO+1 orbital that exhibits the classic localization along the Ru–NO coordinate. Consequently, transitions involving this orbital are expected to be the most relevant for the photodissociation pathway. For the mer- isomer, transitions in this region are possible to a LUMO orbital structurally similar to that of the fac- isomer, and to LUMO+1 and LUMO+3 orbitals. Notably, transition to LUMO+1 populates an excited state possessing significant Ru–NO antibonding character and is therefore expected to facilitate NO photorelease, since LUMO+3 is localized on the phenanthroline orbitals.
Analysis of the transitions shows that for the mer- isomer only the transitions at 457, 408, and 407.5 nm may play an important role in photolysis, and for the fac- isomer those at 520, 424.9, and 408.6 nm — i.e., transitions to the LUMO+1 orbital. It is also essential to take into account the relative oscillator strength of the transitions that contain the orbitals required for photodissociation. As a qualitative descriptor, we estimated the relative contribution of transitions populating Ru–NO antibonding orbitals by weighting their orbital contribution with the corresponding oscillator strength RC=Σaifi/Σfi, where fi – oscillator strength, ai – share of transitions resulting in antibonding NO population in the range 500-400 nm. Although this descriptor has no rigorous mechanistic basis, it qualitatively follows the observed trend in quantum yields for fac-mer isomers in compounds 2-5 (see. Table 3).
The overall low quantum yield for phenanthroline complexes may be associated with the presence of numerous ligand-centered excited states involving phenanthroline orbitals, which can provide additional non-dissociative relaxation pathways competing with NO release [25].
A similar analysis was performed for compounds 4 and 5, the fac- and mer-isomers containing bipyridine (Figure 9 and Figure 10).
For the fac- isomer, the transition pattern is similar to that previously discussed for bpym. The transitions are fairly distant from the irradiation wavelength; however, there is a large contribution from transitions to the required antibonding LUMO+1 orbital, located along the Ru–NO bond coordinate. For the mer- isomer, the picture is somewhat different: the transitions are much closer to 450 nm, but a very large contribution comes from LLCT transitions to chloride ligands and pyridine rings, which do not lead to photodissociation. If one calculates the relative contribution of the required transitions to the total absorption in this region, a correlation can also be noted between this contribution and the quantum yield (see Table 3).
Overall, all compounds exhibit a fairly similar pattern of transitions in this region, differing in transition intensity and position, and are very similar in terms of molecular orbital structure. The occupied orbitals involved in the visible-light excitations are primarily chloride-, ligand-, and Ru-centered, whereas the relevant acceptor orbitals possess significant Ru–NO antibonding character in LUMO+1, LUMO+2. Consequently, NO photorelease is expected to proceed through population of excited states that weaken the Ru–NO bond. Variations in quantum yield therefore appear to originate mainly from differences in the energetic position and relative intensity of these excited states rather than from fundamentally different photochemical mechanisms. It should be emphasized that TD-DFT calculations describe only the initial vertical excitation process. The experimentally observed quantum yields are determined by the entire excited-state relaxation landscape, including internal conversion, intersystem crossing, vibrational relaxation and solvent-assisted processes. Therefore, the present analysis should be regarded as a qualitative description of the electronic factors governing NO photorelease.
2.6. Electrospray Mass-Spectroscopy of the Solutions After Photolysis
The solutions after photolysis were additionally characterized by ESI-MS to identify the complex species that may arise from both the primary photolysis stage and secondary reactions. For all compounds mass spectra with a single predominant species were obtained after 24 hours of irradiation (Figured 11, 12, and S13–S15). These predominant species are marked with an asterisk (*), and their tentative compositions are listed in Table 4. All masses presented in the table correspond to the most abundant ruthenium isotope, ¹⁰²Ru. The peak profile (isotope pattern) confirms the presence of ruthenium and the number of chloro-ligands in the species (Figure 11 right, Fig.12 right). The primary photolysis products for complexes 2-5 in DMSO solution after NO release followed by coordination of a solvent molecule should be the neutral [Ru(L)(DMSO)Cl3] species. Since mass spectrometry detects charged species, it can be assumed that upon in source fragmentation, one chloride ligand is replaced by a DMSO molecule, yielding the observed charged species rather than the neutral photolysis product. In case of the complex 1 the additional nitrogen atoms outer to the coordination sphere can influence to the formation of solvent pairs with DMSO. That could be the reason that the most abundant ion detected after photolysis of 1 is [Ru(bpym)(DMSO)3Cl]+. Thus, all compounds reported herein are consistent with the literature, according to which the NO release from ruthenium nitrosyl complexes is accompanied by coordination of a solvent molecule at the vacated coordination site [26,27].
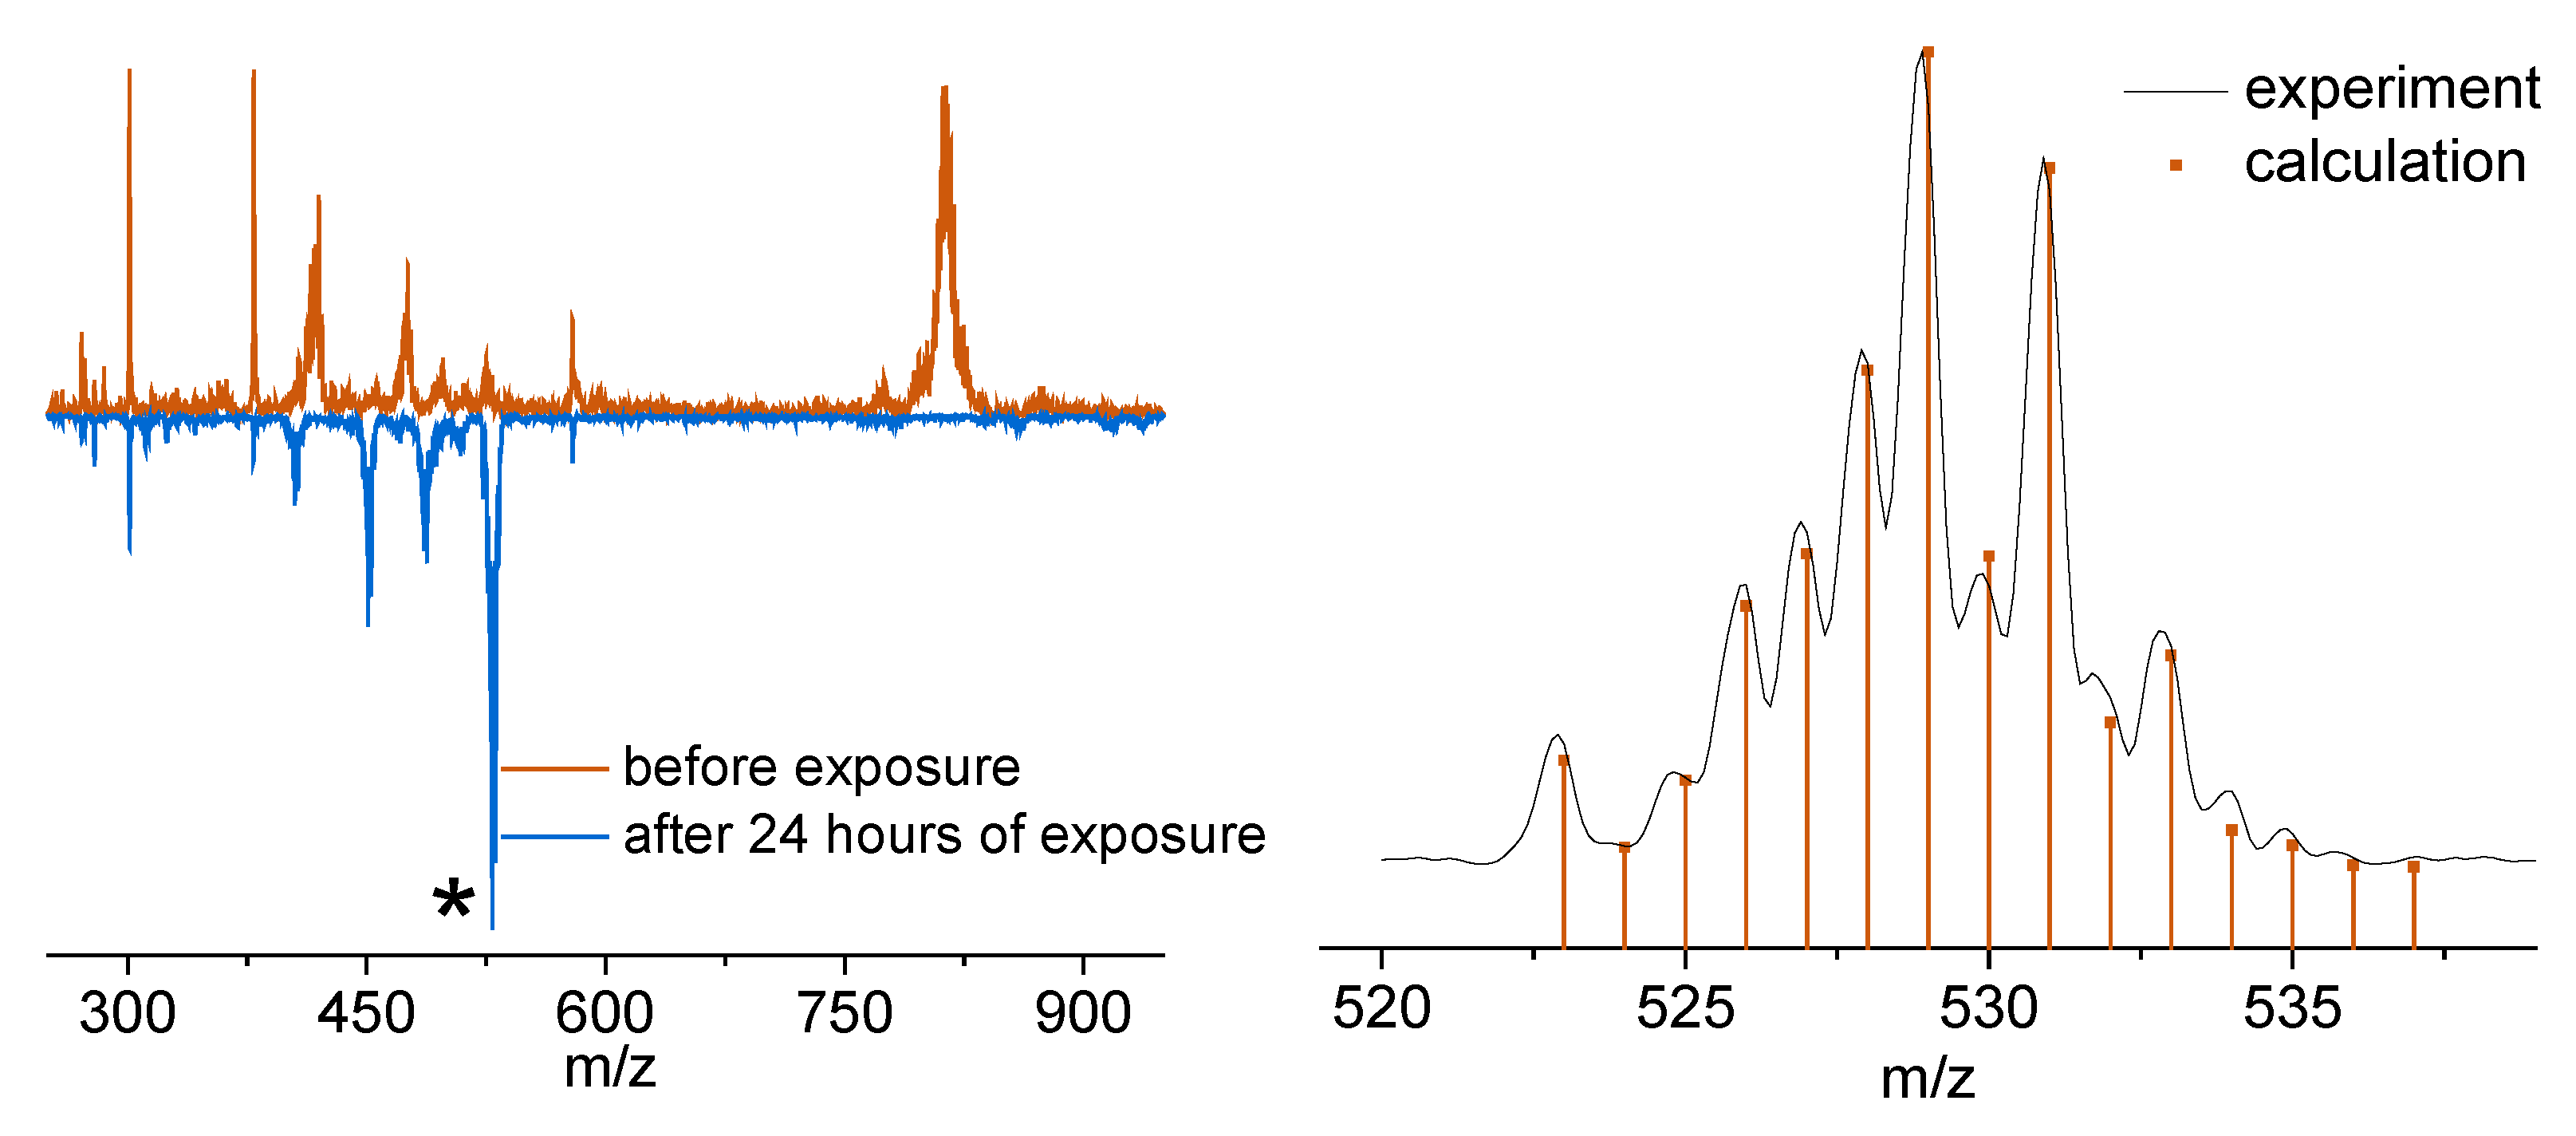
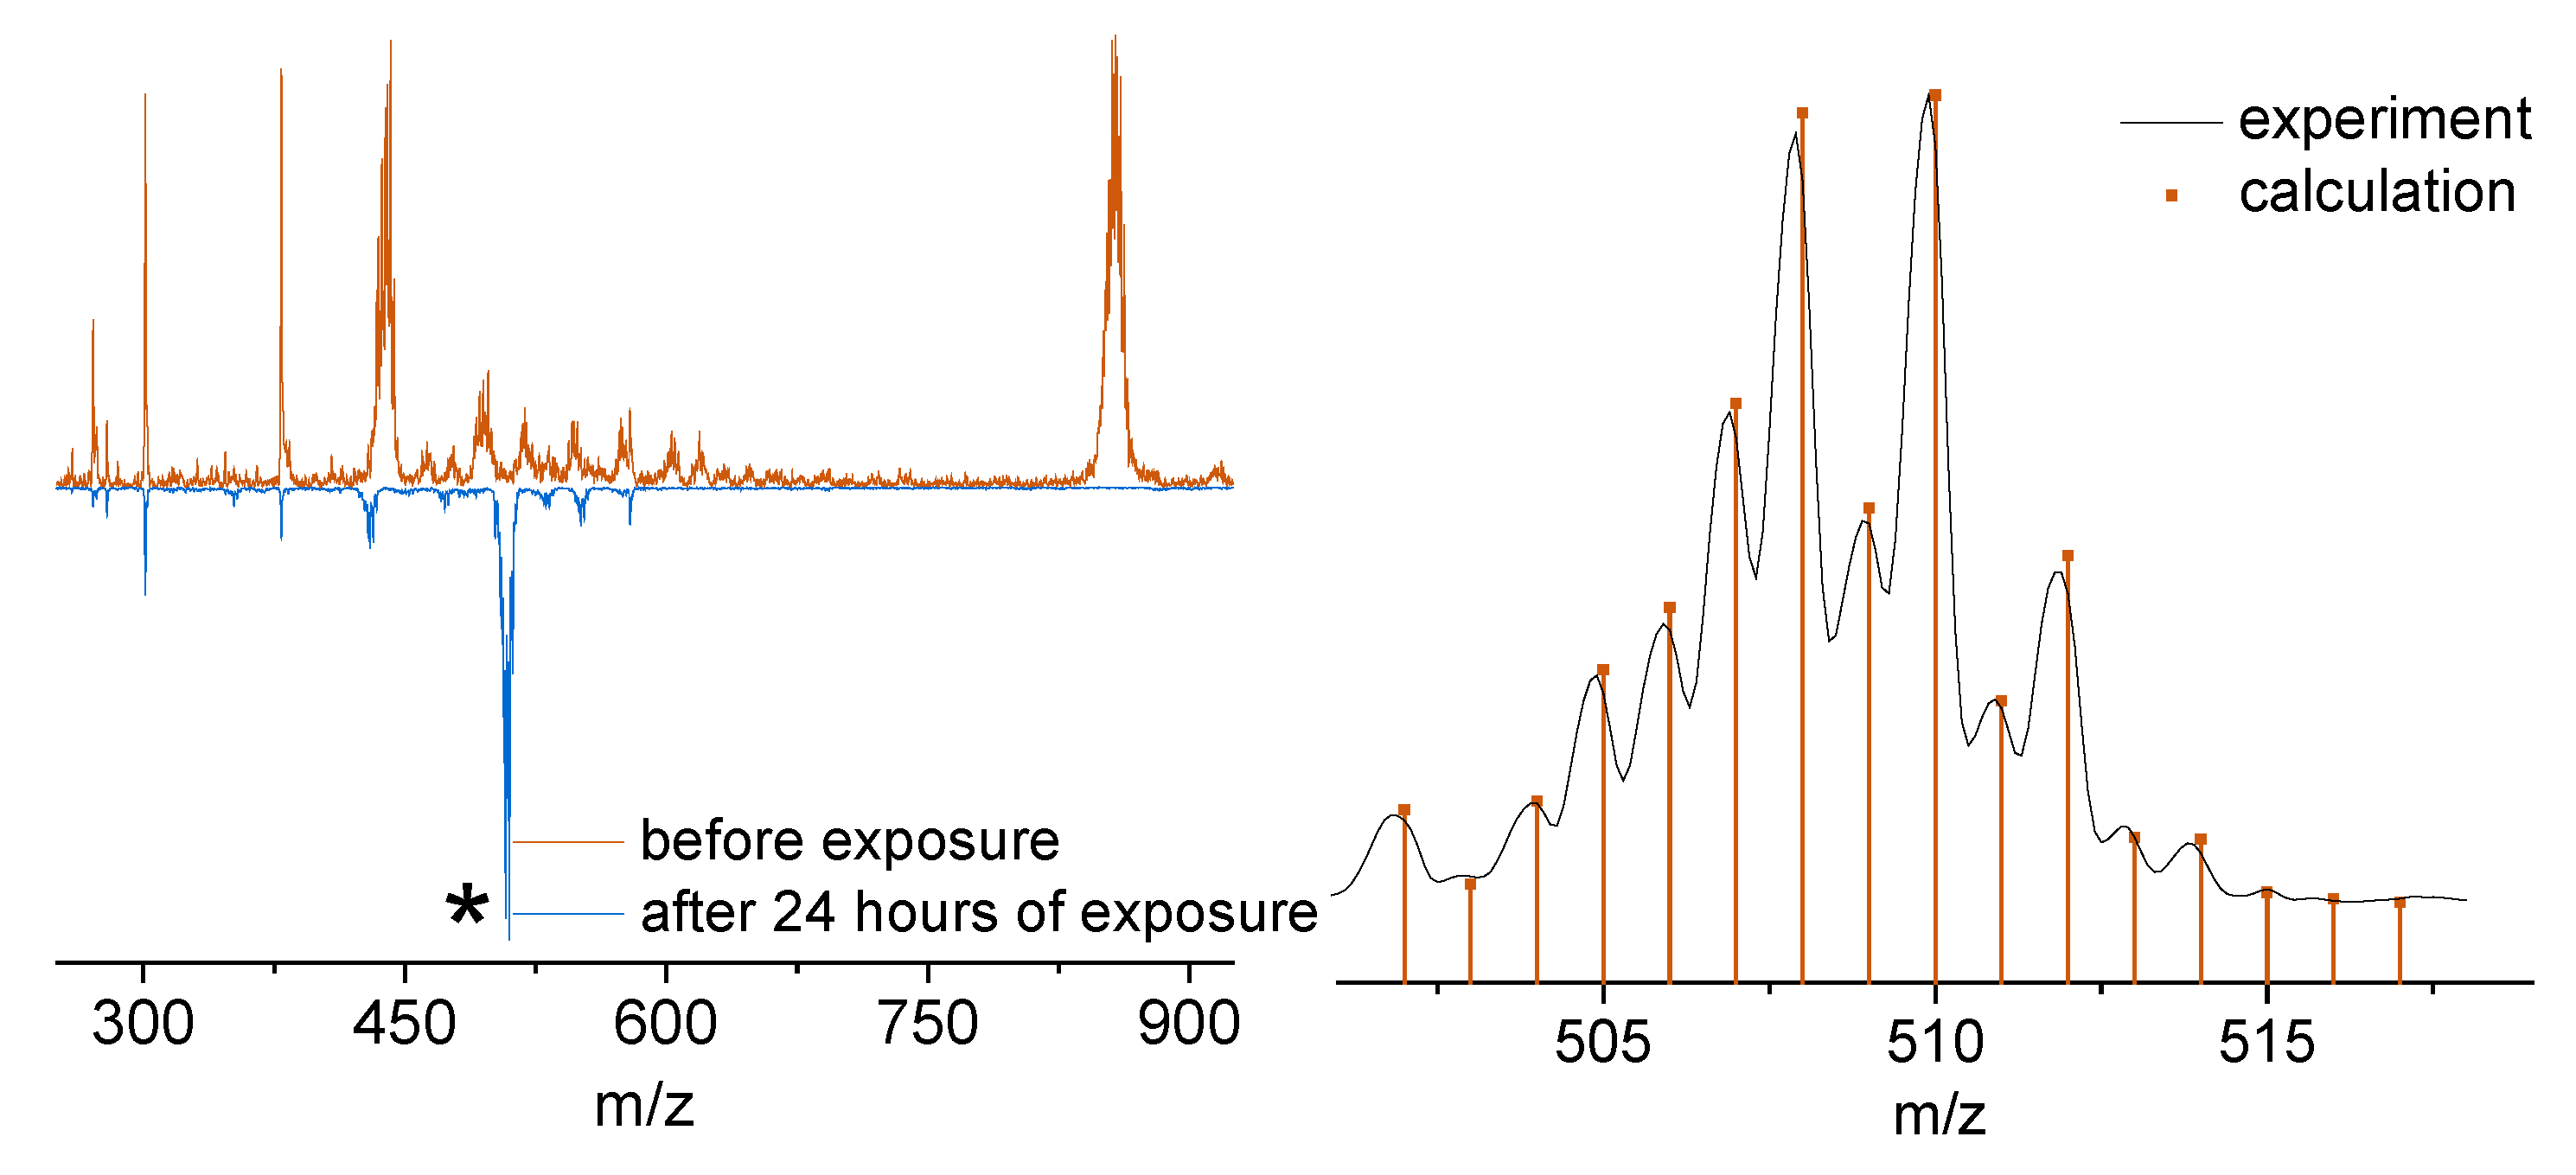
Figure 11.
ESI-MS spectra before and after light irradiation by 450 nm of fac-[RuNO(bpym)Cl3] (1) (left) and the peak 529 m/z from mass spectra of 1 with calculated isotope pattern (right).
Figure 11.
ESI-MS spectra before and after light irradiation by 450 nm of fac-[RuNO(bpym)Cl3] (1) (left) and the peak 529 m/z from mass spectra of 1 with calculated isotope pattern (right).
Figure 12.
ESI-MS spectra before and after light irradiation by 450 nm of fac-[RuNO(phen)Cl₃] (2) (left) and the peak 510 m/z from mass spectra of 2 with calculated isotope pattern (right).
Figure 12.
ESI-MS spectra before and after light irradiation by 450 nm of fac-[RuNO(phen)Cl₃] (2) (left) and the peak 510 m/z from mass spectra of 2 with calculated isotope pattern (right).
2.7. The Crustal Structure of NO Release Product for Bipyridine Complex 5
As mentioned above, the photochemical release of NO from compound 5 was examined in both DMSO and acetonitrile solutions. Upon irradiation of the acetonitrile solution for 24 hours, single crystals of the photolysis product mer-[Ru(CH3CN)(bpy)Cl3] were obtained by slow evaporation of the solvent. The product yield is quantitative, aside from minor mechanical losses due to the small scale of the reaction.
Compound 6 is in agreement with the literature, according to which the photoinduced liberation of nitric oxide is accompanied by coordination of a solvent molecule at the vacant coordination site previously occupied by the nitrosyl ligand. The authors consider it most important to note that the geometry of the photolysis product corresponds to that of the nitrosyl-containing compound, namely compound 5. The authors consider it noteworthy that the photolysis product retains the geometry of the parent nitrosyl complex (compound 5). These data can serve as a basis for further considerations of intrinsic mechanism of photolysis and following substitution.
The most important changes in ruthenium coordination sphere after NO-acetonitrile substitution (Table 5) is related to Ru-N(bpy) distances, which is enlarging for 0.2 Å, while bond lengths Ru-Cl are less influenced, and average Ru-Cl distance remains the same in the limits of discrepancies. In the crystal packing of compound 6, the bipyridine ligands are arranged parallel to each other with an interplanar separation of 4.103 Å and adopt a head-to-tail packing motif, wherein the acetonitrile ligand resides above one of the bipyridine rings (centroid–methyl carbon distance: 4.326 Å). These dimeric pairs form layers with a lateral shift of 0.789 Å, parallel to the (112) plane (Figure 13, c).
The most important changes in ruthenium coordination sphere after NO-acetonitrile substitution (Table 5) is related to Ru-N(bpy) distances, which is enlarging for 0.2 Å, while bond lengths Ru-Cl are less influenced, and average Ru-Cl distance remains the same in the limits of discrepancies. In the crystal packing of compound 6, the bipyridine ligands are arranged parallel to each other with an interplanar separation of 4.103 Å and adopt a head-to-tail packing motif, wherein the acetonitrile ligand resides above one of the bipyridine rings (centroid–methyl carbon distance: 4.326 Å). These dimeric pairs form layers with a lateral shift of 0.789 Å, parallel to the (112) plane (Figure 13, c).
3. Materials and Methods
Synthesis of compounds 1-5
All reagents used were of standard-grade purity (Merck) and used without additional purification. The starting ruthenium compound K2[RuNOCl5] was prepared from commercial ruthenium chloride as was describe previously [18].
Synthesis of fac-[RuNO(bpym)Cl3] (1)
The sample of K2[RuNOCl5] 386 mg (1 mmol) and the sample of ligand (1 mmol of bpym, 158 mg) was dissolved in mixture of 45 ml EtOH and 15 ml H2O. The mixture was heated under a watch glass for 1 hour. Further evaporation to 5 ml results in the peach precipitate of fac-[RuNO(bpym)Cl3] (1) which was filtered and dried in air. Yield is 81%
Elemental analysis data (%) calc: C -24.3, H – 1.5, N – 17.7; found: C – 24.4, H – 1.5, N – 17.4
1H NMR (500 MHz, DMSO d₆): δ 9.59 (dd, J=5.70, 2.05 Hz, 2H, bpym), 9.50 (dd, J=4.80, 2.05 Hz, 2H, bpym), 8.17 (dd, J=5.70, 4.80 Hz, 2H, bpym).
IR spectroscopy: ν(NO): 1904, 1884 (KBr)
Synthesis of mer-[RuNO(phen)Cl3] (3)
The sample of K2[RuNOCl5] 386 mg (1 mmol) and the sample of ligand (1 mmol of phen, 180 mg) was dissolved in mixture of 45 ml EtOH and 15 ml H2O. The mixture was heated under a watch glass for 1 hour. Further evaporation to 5 ml results in the green precipitate of mer-[RuNO(phen)Cl3] (3) which was filtered and dried in air. Yield is 63%
Elemental analysis data (%) calc: C -34.5, H – 1.9, N – 10.1; found: C – 35.0, H – 2.1, N – 10.0
1H NMR (500 MHz, DMSO d₆): δ 9.82 (dd, J=5.30, 0.88 Hz, 1H, phen), 9.53 (d, J=5.30 Hz, 1H, phen), 9.16 (dd, J=8.20, 1.00 Hz, 1H, phen), 9.06 (dd, J=8.20, 0.88 Hz, 1H, phen), 8.47 (t, J=8.87 Hz, 1H, phen), 8.45 (t, J=8.87 Hz, 1H, phen), 8.35 (dd, J=8.20, 5.30 Hz, 1H, phen), 8.22 (dd, J=8.20, 5.30 Hz, 1H, phen).
IR spectroscopy: ν(NO): 1877 (KBr)
Synthesis of fac-[RuNO(phen)Cl3] (2)
After filtration of mer-[RuNO(phen)Cl₃] (3), the mother liquor was allowed to evaporate at room temperature, affording pink crystals and an orange powder, which were both identified as the same compound, fac-[RuNO(phen)Cl₃] (2). Yield is 11%
Elemental analysis data (%) calc: C -34.5, H – 1.9, N – 10.1; found: C – 34.1, H – 1.7, N – 10.2
1H NMR (500 MHz, DMSO d₆): δ 9.66 (dd, J=5.30, 1.30 Hz, 2H, phen), 9.15 (dd, J=8.20, 1.30 Hz, 2H, phen), 8.45 (s, 2H, phen), 8.33 (dd, J=8.20, 5.30 Hz, 2H, phen).
IR spectroscopy: ν(NO): 1895, 1882 (KBr)
Synthesis of fac-[RuNO(bpy)Cl3] (4)
The sample of K2[RuNOCl5] 386 mg (1 mmol) and the sample of ligand (1 mmol of bpy, 156 mg) was dissolved in mixture of 45 ml EtOH and 15 ml H2O. The mixture was heated under a watch glass for 1 hour. Further evaporation to 5 ml results in the orange precipitate of fac-[RuNO(bpy)Cl3] (4) which was filtered and dried in air. Yield is 69%
Elemental analysis data (%) calc: C -30.5, H – 2.1, N – 10.7; found: C – 30.0, H – 2.0, N – 10.3
1H NMR (500 MHz, DMSO d₆): δ 9.39 (d, J=5.57 Hz, 2H, bpy), 8.88 (d, J=8.04 Hz, 2H, bpym), 8.51 (td, J=7.81, 1.24 Hz, 2H, bpy), 7.99 (ddd, J=7.08, 5.82, 1.00 Hz, 2H, bpy)
IR spectroscopy: ν(NO): 1890, 1877 (KBr)
Synthesis of mer-[RuNO(bpy)Cl3] (5)
The sample of K2[RuNOCl5] 386 mg (1 mmol) and the sample of ligand (2 mmol of bpy, 312 mg) was dissolved in 40 ml H2O. The mixture was heated under a watch glass for 1 hour. Further evaporation to 5 ml results in the green precipitate of mer-[RuNO(bpy)Cl3] (5) which was filtered and dried in air. Yield is 78%
Elemental analysis data (%) calc: C -30.5, H – 2.1, N – 10.7; found: C – 30.6, H – 2.0, N – 10.7
1H NMR (500 MHz, DMSO d₆): δ 9.52 (dd, J=5.75, 1.25 Hz, 1H, bpy), 9.04 (dd, J=5.75, 1.25 Hz, 1H, bpy), 8.86 (t, J=7.25 Hz, 2H, bpy), 8.51 (td, J=7.80, 1.50 Hz, 1H, bpy), 8.41 (td, J=7.80, 1.50 Hz, 1H, bpy), 8.00 (ddd, J=7.25, 5.75, 1.25 Hz, 1H, bpy), 7.86 (ddd, J=7.25, 5.75, 1.25 Hz, 1H, bpy).
IR spectroscopy: ν(NO): 1866 (KBr)
Physical Methods
Elemental analysis (C, H and N) was performed on a CE-440 analyzer. IR spectra of the samples were measured in KBr pellets on a FSM 2201 IR Fourier spectrometer within the wavenumber range 400-4000 cm−1.
Single crystal X-ray diffraction
Single crystal X-ray diffraction data of 1-3, 6 were collected on a Bruker Nonius X8Apex CCD area-detector, Bruker Kappa Apex II CCD area-detector and Bruker D8 Venture diffractometer with a CMOS PHOTON III detector using graphite-monochromated MoKα radiation (λ = 0.71073 Å) via 0.5° ω- and ϕ-scan techniques. Experimental data reduction was performed using the APEX2 suite. The structures were solved by SHELXT and refined by the full-matrix least-squares technique SHELXL assisted with the Olex2 GUI. Atomic displacement parameters of the non-H atoms were refined in anisotropic approximation. Hydrogen atoms of organic ligands were located geometrically and refined using the riding model. All structures have been deposited with the CCDC with deposition numbers 2562801, 2562117, 2562118, 2566168.
Nuclear magnetic resonance spectroscopy
NMR spectra were recorded on a Bruker Avance III 500 spectrometer operating at 500.03 MHz for ¹H. Spectra were recorded in DMSO-d6 solution. The residual protons of the DMSO methyl group (δ = 2.5 ppm) were used as the internal standard. Spectra of 1–5 were recorded for samples containing 0.6 mL of a 10⁻² M solution of the complexes in DMSO d₆.
Density functional theory calculations
Density functional theory calculations of the 1-5 complex cations were performed using the ORCA 6.0.0 package. For geometry optimization of complexes (closed-shell electron configuration), the B3LYP functional with ZORA-def2-TZVP basis set was used. SARC-ZORA-TZVP basis set was used for the ruthenium atom. Quantum chemical calculations of the isomeric forms for all complexes were performed with CPCM solvation model (DMSO).
UV-vis and IR-spectroscopy
UV-vis spectra were recorded on a SF2000 UV-vis single-beam spectrophotometer. UV-vis spectra of the complex were measured in a 1 cm quartz flow cell in dimethyl sulfoxide (DMSO). The absorbance of the pure solvents was considered. The concentration of the complex used for the photolysis measurements was 5·10-3 M. Evolution of the UV-vis spectra was monitored during an exposure of the cuvette by flow-through system (5 ml volume) by LED 450 nm, 100 mW. Optical power meter THORLABS PM16-401 was used for the measurement of the light intensity.
The flow-through system consists of cuvette with irradiated solution, peristaltic pump, flow-through IR-cuvette (CaF2 windows) and flow-through UV-vis cuvette. IR-spectra were obtained at room temperature on an FSM 2201 spectrometer. All components of the system are connected with chemical-resistant hoses and adapters (Figure S10). Based on combined IR-UV-vis data, we calculated QY (φ) of the NO release using formula:
φ = ΔC·V/N,
where ΔC – change of concentration (mol·L-1), N – number of photons (Einstein), V – volume of system (L).
Evolution of the area under v(NO) band in IR-spectra during photolysis gave us the information about conversion of the photolysis reaction with respect to UV-vis changes:
Ci = C0·Si/S0,
Where C0 – initial concentration, S0 – initial area under v(NO) band. Si and Ci – area and concentration, respectively, under v(NO) band at definite time. We determined the absorption of the reagent over time based on known absorption coefficient and concentration obtained from IR data and use it to calculate the amount of light absorbed by the reagents during the reaction:
Ai = ε·l·Ci
I = I0·Ai/Aall·(1-10-Aall)
Where Ai – absorption of reagent, I0 – light intensity (E), Aall - mutual absorption of the reagent and products at a wavelength of 450 nm. To calculate the number of Einsteins absorbed over a certain period of time (N), we plotted the dependence of absorbed light on time, approximated it with an exponent and integrated the resulting function.
Electrospray ionization-mass spectrometry
Mass spectrometric data were obtained on an Agilent liquid chromatograph-mass spectrometer system (LC-MS) 6130 Quadrupole MS, 1260 infinity LC. The analyses were performed in an m/z range from 100 to 1500 mass units, in SCAN mode for positive and negative ions. Electrospray ionization (ESI) was used as an ion source. The following parameters were used: nitrogen as a drying gas, a temperature of 350 °C, a flow rate of 7 L min-1, a spraying gas (nitrogen) pressure of 60 psig, and a voltage on the capillary of 4000 V. The voltage on the fragmentator was established to be 100 V in all experiments. A 5 µL DMSO:EtOH 1:1 solutions of the studied compound with a concentration of 2.5·10⁻³ M was injected into the mobile phase with a rate of 0.4 mL min-1, sprayed, and ionized. The mass spectra (MS) were interpreted by matching signals to proposed ions including a comparison of calculated and experimental isotopic peak distributions.
4. Conclusions
Thus, finally we exploited the simple technique for the preparation fac/mer-isomers of [RuNO(L)Cl3] (L = bpym, bpy, phen) starting from the K2[RuNOCl5] as suitable precursor. Depending on the ligand and preparation details different isomers can be separated (NMR pure). In case of bipyrimidine only fac-isomer can be prepared with the yields higher 80 %. For the phenanthroline the isomers can be separated on their solubility – dominating mer-isomer precipitates first, and further evaporation of mother liquor can result in minor amounts of fac-isomer. And for the bipyridine the ratio Ru:L and solvent nature can drive the direction of substitution. All complexes are stable in DMSO solutions and do not undergo isomer conversion in contrast to [RuNO(NH3)2L(NO3)]2+. Photochemical NO release induced by 450 nm irradiation results in the substitution of NO to solvent ligands. The highest quantum yield (5.5 %) was determined for the fac-[RuNO(bpym)Cl3] and the general trend shows that fac-isomers of all compounds are more sensitive to irradiation. The crystal structure of photolysis product mer-[Ru(CH3CN)(bpy)Cl3] was determined by SC-XRD and the comparison with initial mer-[RuNO(bpy)Cl3] shows that the photoinduced NO -release also does not change the conformation of ruthenium coordination sphere.
Supplementary Materials
The following supporting information can be downloaded at Preprints.org, Figure S1-S3: Hirshfield surface and fingerprints for complexes 1-3; Figure S4-S8: 1H-NMR spectra of investigated complexes; Figure S9-S12: Evolution of IR and UV-Vis spectra during the photolysis in DMSO solution; Tables S1-S3: The transitions closest to the irradiation wavelength and their orbital contributions; Figures S13-S15: ESI-MS spectra before and after light irradiation by 450 nm.
Author Contributions
A.O.B. writing – original draft, writing – review & editing, investigation, formal analysis, conceptualization; I.A.Y. investigation, writing – review & editing; N.V.K. – investigation, writing – review & editing; D.G.S. – investigation; G.A.K. - writing – review & editing, supervision.
Funding
The work was funded by the Russian Science Foundation (project 25-23-00843).
Institutional Review Board Statement
Not applicable.
Informed Consent Statement
Not applicable.
Data Availability Statement
Data is contained within the article or supplementary material.
Acknowledgments
The authors thank XRD Facility of NIIC SB RAS and Chemical research center of NIOCH SB RAS for the X-ray structural analysis.
Conflicts of Interest
The authors declare no conflicts of interest.
References
- Sung, H.; Ferlay, J.; Siegel, R. L.; Laversanne, M.; Soerjomataram, I.; Jemal, A.; Bray, F. Global Cancer Statistics 2020: GLOBOCAN Estimates of Incidence and Mortality Worldwide for 36 Cancers in 185 Countries. [CrossRef]
- Rosenberg, B.; Vancamp, L.; Trosko, J. E.; Mansour, V. H. Platinum Compounds: A New Class of Potent Antitumour Agents. Nature 1969, 222 (5191), 385–386. [CrossRef]
- Johnstone, T. C.; Suntharalingam, K.; Lippard, S. J. The Next Generation of Platinum Drugs: Targeted Pt(II) Agents, Nanoparticle Delivery, and Pt(IV) Prodrugs. Chem. Rev. 2016, 116 (5), 3436–3486. [CrossRef]
- Bergamo, A.; Gaiddon, C.; Schellens, J. H. M.; Beijnen, J. H.; Sava, G. Approaching Tumour Therapy beyond Platinum Drugs: Status of the Art and Perspectives of Ruthenium Drug Candidates. Journal of Inorganic Biochemistry 2012, 106 (1), 90–99. [CrossRef]
- Alessio, E. Thirty Years of the Drug Candidate NAMI-A and the Myths in the Field of Ruthenium Anticancer Compounds: A Personal Perspective. European Journal of Inorganic Chemistry 2017, 2017 (12), 1549–1560. [CrossRef]
- Hartinger, C. G.; Jakupec, M. A.; Zorbas-Seifried, S.; Groessl, M.; Egger, A.; Berger, W.; Zorbas, H.; Dyson, P. J.; Keppler, B. K. KP1019, A New Redox-Active Anticancer Agent – Preclinical Development and Results of a Clinical Phase I Study in Tumor Patients. Chemistry & Biodiversity 2008, 5 (10), 2140–2155. [CrossRef]
- Monro, S.;Colón, K. L.; Yin, H.; Roque, J. I.; Konda, P.; Gujar, S.; Thummel, R. P.; Lilge, L.; Cameron, C. G.; McFarland, S. A. Transition Metal Complexes and Photodynamic Therapy from a Tumor-Centered Approach: Challenges, Opportunities, and Highlights from the Development of TLD1433. Chem. Rev. 2019, 119 (2), 797–828. [CrossRef]
- Ignarro, L. J. Nitric Oxide as a Unique Signaling Molecule in the Vascular System: A Historical Overview. J Physiol Pharmacol 2002, 53 (4 Pt 1), 503–514.
- Wink, D. A.; Mitchell, J. B. Chemical Biology of Nitric Oxide: Insights into Regulatory, Cytotoxic, and Cytoprotective Mechanisms of Nitric Oxide. Free Radical Biology and Medicine 1998, 25 (4), 434–456. [CrossRef]
- Bonavida, B.; Khineche, S.; Huerta-Yepez, S.; Garbán, H. Therapeutic Potential of Nitric Oxide in Cancer. Drug Resistance Updates 2006, 9 (3), 157–173. [CrossRef]
- Fukumura, D.; Kashiwagi, S.; Jain, R. K. The Role of Nitric Oxide in Tumour Progression. Nat Rev Cancer 2006, 6 (7), 521–534. [CrossRef]
- Ford, P. C. Photochemical Delivery of Nitric Oxide. Nitric Oxide 2013, 34, 56–64. [CrossRef]
- Rose, M. J.; Mascharak, P. K. Photoactive Ruthenium Nitrosyls: Effects of Light and Potential Application as NO Donors. Coordination Chemistry Reviews 2008, 252 (18), 2093–2114. [CrossRef]
- Roncaroli, F.; Videla, M.; Slep, L. D.; Olabe, J. A. New Features in the Redox Coordination Chemistry of Metal Nitrosyls {M–NO+; M–NO; M–NO−(HNO)}. Coordination Chemistry Reviews 2007, 251 (13), 1903–1930. [CrossRef]
- Levina, A.; Mitra, A.; Lay, P. A. Recent Developments in Ruthenium Anticancer Drugs. Metallomics 2009, 1 (6), 458–470. [CrossRef]
- Fairy, M. B.; Irving, R. J. Complexes of Ruthenium Nitrosyl Trihalides. Journal of the Chemical Society A: Inorganic, Physical, Theoretical 1966, 0 (0), 475–479. [CrossRef]
- Haukka, M.; Venäläinen, T.; Ahlgrén, M.; Pakkanen, T. A. Reactions of [Ru(Bpy)(CO)2Cl2] in Acidic Media: Formation and Structural Characterization of [Ru(Bpy)Cl3(NO)], [Ru2N(Bpy)2Cl5(H2O)], and (H5O2)[Ru2N(Bpy)2Cl6]. Inorganic Chemistry 2002, 34 (11), 2931–2936. [CrossRef]
- Emel’yanov, V. A.; Fedotov, M. A.; Belyaev, A. V.; Tkachev, S. V. A Multinuclear Magnetic Resonance Study of Transformations of Ruthenium(II) Nitrosyl Chloride Complexes in Aqueous Solutions. Physical methods of investigation. Russian Journal of Inorganic Chemistry 2013, 58 (8), 1073–1081. [CrossRef]
- Hirano, T.; Ueda, K.; Mukaida, M.; Nagao, H.; Oi, T. Reactions of [RuCl2(NO)(Terpy)]+ ( Terpy = 2,2′ : 6′,2″-Terpyridine) with Mono Anions Such as NO 2 − , Br − and N 3 − , and Structural Studies on Terpyridineruthenium Having a Nitrosyl Ligand. Journal of the Chemical Society, Dalton Transactions 2001, 0 (16), 2341–2345. [CrossRef]
- Brovko, A. O.; Yakovlev, I. A.; Kuratieva, N. V.; Sheven, D. G.; Kostin, G. A. Ruthenium Nitrosyl Complexes with Bidentate Heterocycles: Synthesis and Their Transformations in Solution. Dalton Trans. 2026. [CrossRef]
- Mikhailov, A. A.; Stolyarova, E. D.; Kostin, G. A. Photochemistry of ruthenium nitrosyl complexes in solids and solutions and its potential applications. Journal of Structural Chemistry 2021 62:4 2021, 62 (4), 497–516. [CrossRef]
- Yakovlev, I. A.; Mikhailov, A. A.; Eremina, J. A.; Klyushova, L. S.; Nadolinny, V. A.; Kostin, G. A. Nitric Oxide Release and Related Light-Induced Cytotoxicity of Ruthenium Nitrosyls with Coordinated Nicotinate Derivatives. Dalton Trans. 2021, 50 (38), 13516–13527. [CrossRef]
- Mikhailov, A. A.; Vorobyev, V. A.; Nadolinny, V. A.; Patrushev, Y. V.; Yudina, Y. S.; Kostin, G. A. Primary and Secondary Photochemical Transformations of Biologically Active Precursor - Nitro-Nitrosyl Ruthenium Complex. Journal of Photochemistry and Photobiology A: Chemistry 2019, 373, 37–44. [CrossRef]
- Fawcett, W. R. Acidity and Basicity Scales for Polar Solvents. J. Phys. Chem. 1993, 97 (37), 9540–9546. [CrossRef]
- Balzani, V.; Bergamini, G.; Campagna, S.; Puntoriero, F. Photochemistry and Photophysics of Coordination Compounds: Overview and GeneralConcepts. In Photochemistry and Photophysics of Coordination Compounds I; Balzani, V., Campagna, S., Eds.; Springer: Berlin, Heidelberg, 2007; pp 1–36. [CrossRef]
- Stepanenko, I.; Zalibera, M.; Schaniel, D.; Telser, J.; Arion, V. B. Ruthenium-Nitrosyl Complexes as NO-Releasing Molecules, Potential Anticancer Drugs, and Photoswitches Based on Linkage Isomerism. Dalton Transactions 2022, 51 (14), 5367–5393. [CrossRef]
- Bukhanko, V.; Lacroix, P. G.; Sasaki, I.; Tassé, M.; Mallet-Ladeira, S.; Voitenko, Z.; Malfant, I. Mechanism and Oxidation State Involved in the Nitric Oxide (NO) Photorelease in a Terpyridine-Bipyridine-Based Ruthenium Nitrosyl Complex. Inorganica Chimica Acta 2018, 482, 195–205. [CrossRef]
Figure 1.
Polidentate ligands in the present study.
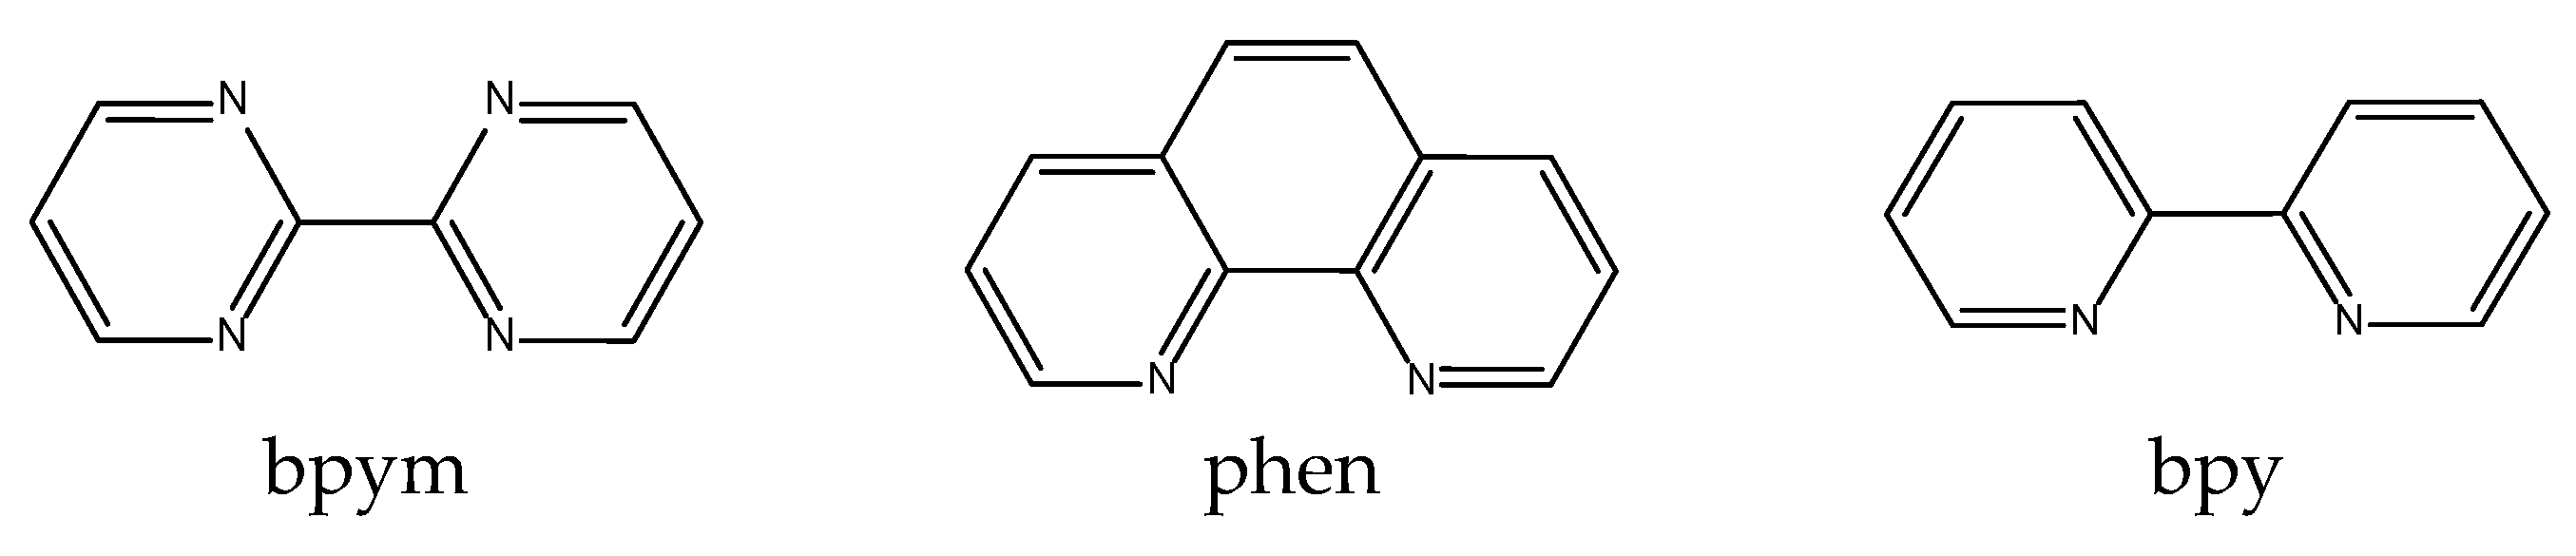
Figure 2.
Structural fragment of fac-[RuNO(bpym)Cl3] (1) (panel a), crystallographic unit cell of 1 (panel b) and crystal packing of 1 (panel c). ADPs are given at the 50% probability level.
Figure 2.
Structural fragment of fac-[RuNO(bpym)Cl3] (1) (panel a), crystallographic unit cell of 1 (panel b) and crystal packing of 1 (panel c). ADPs are given at the 50% probability level.
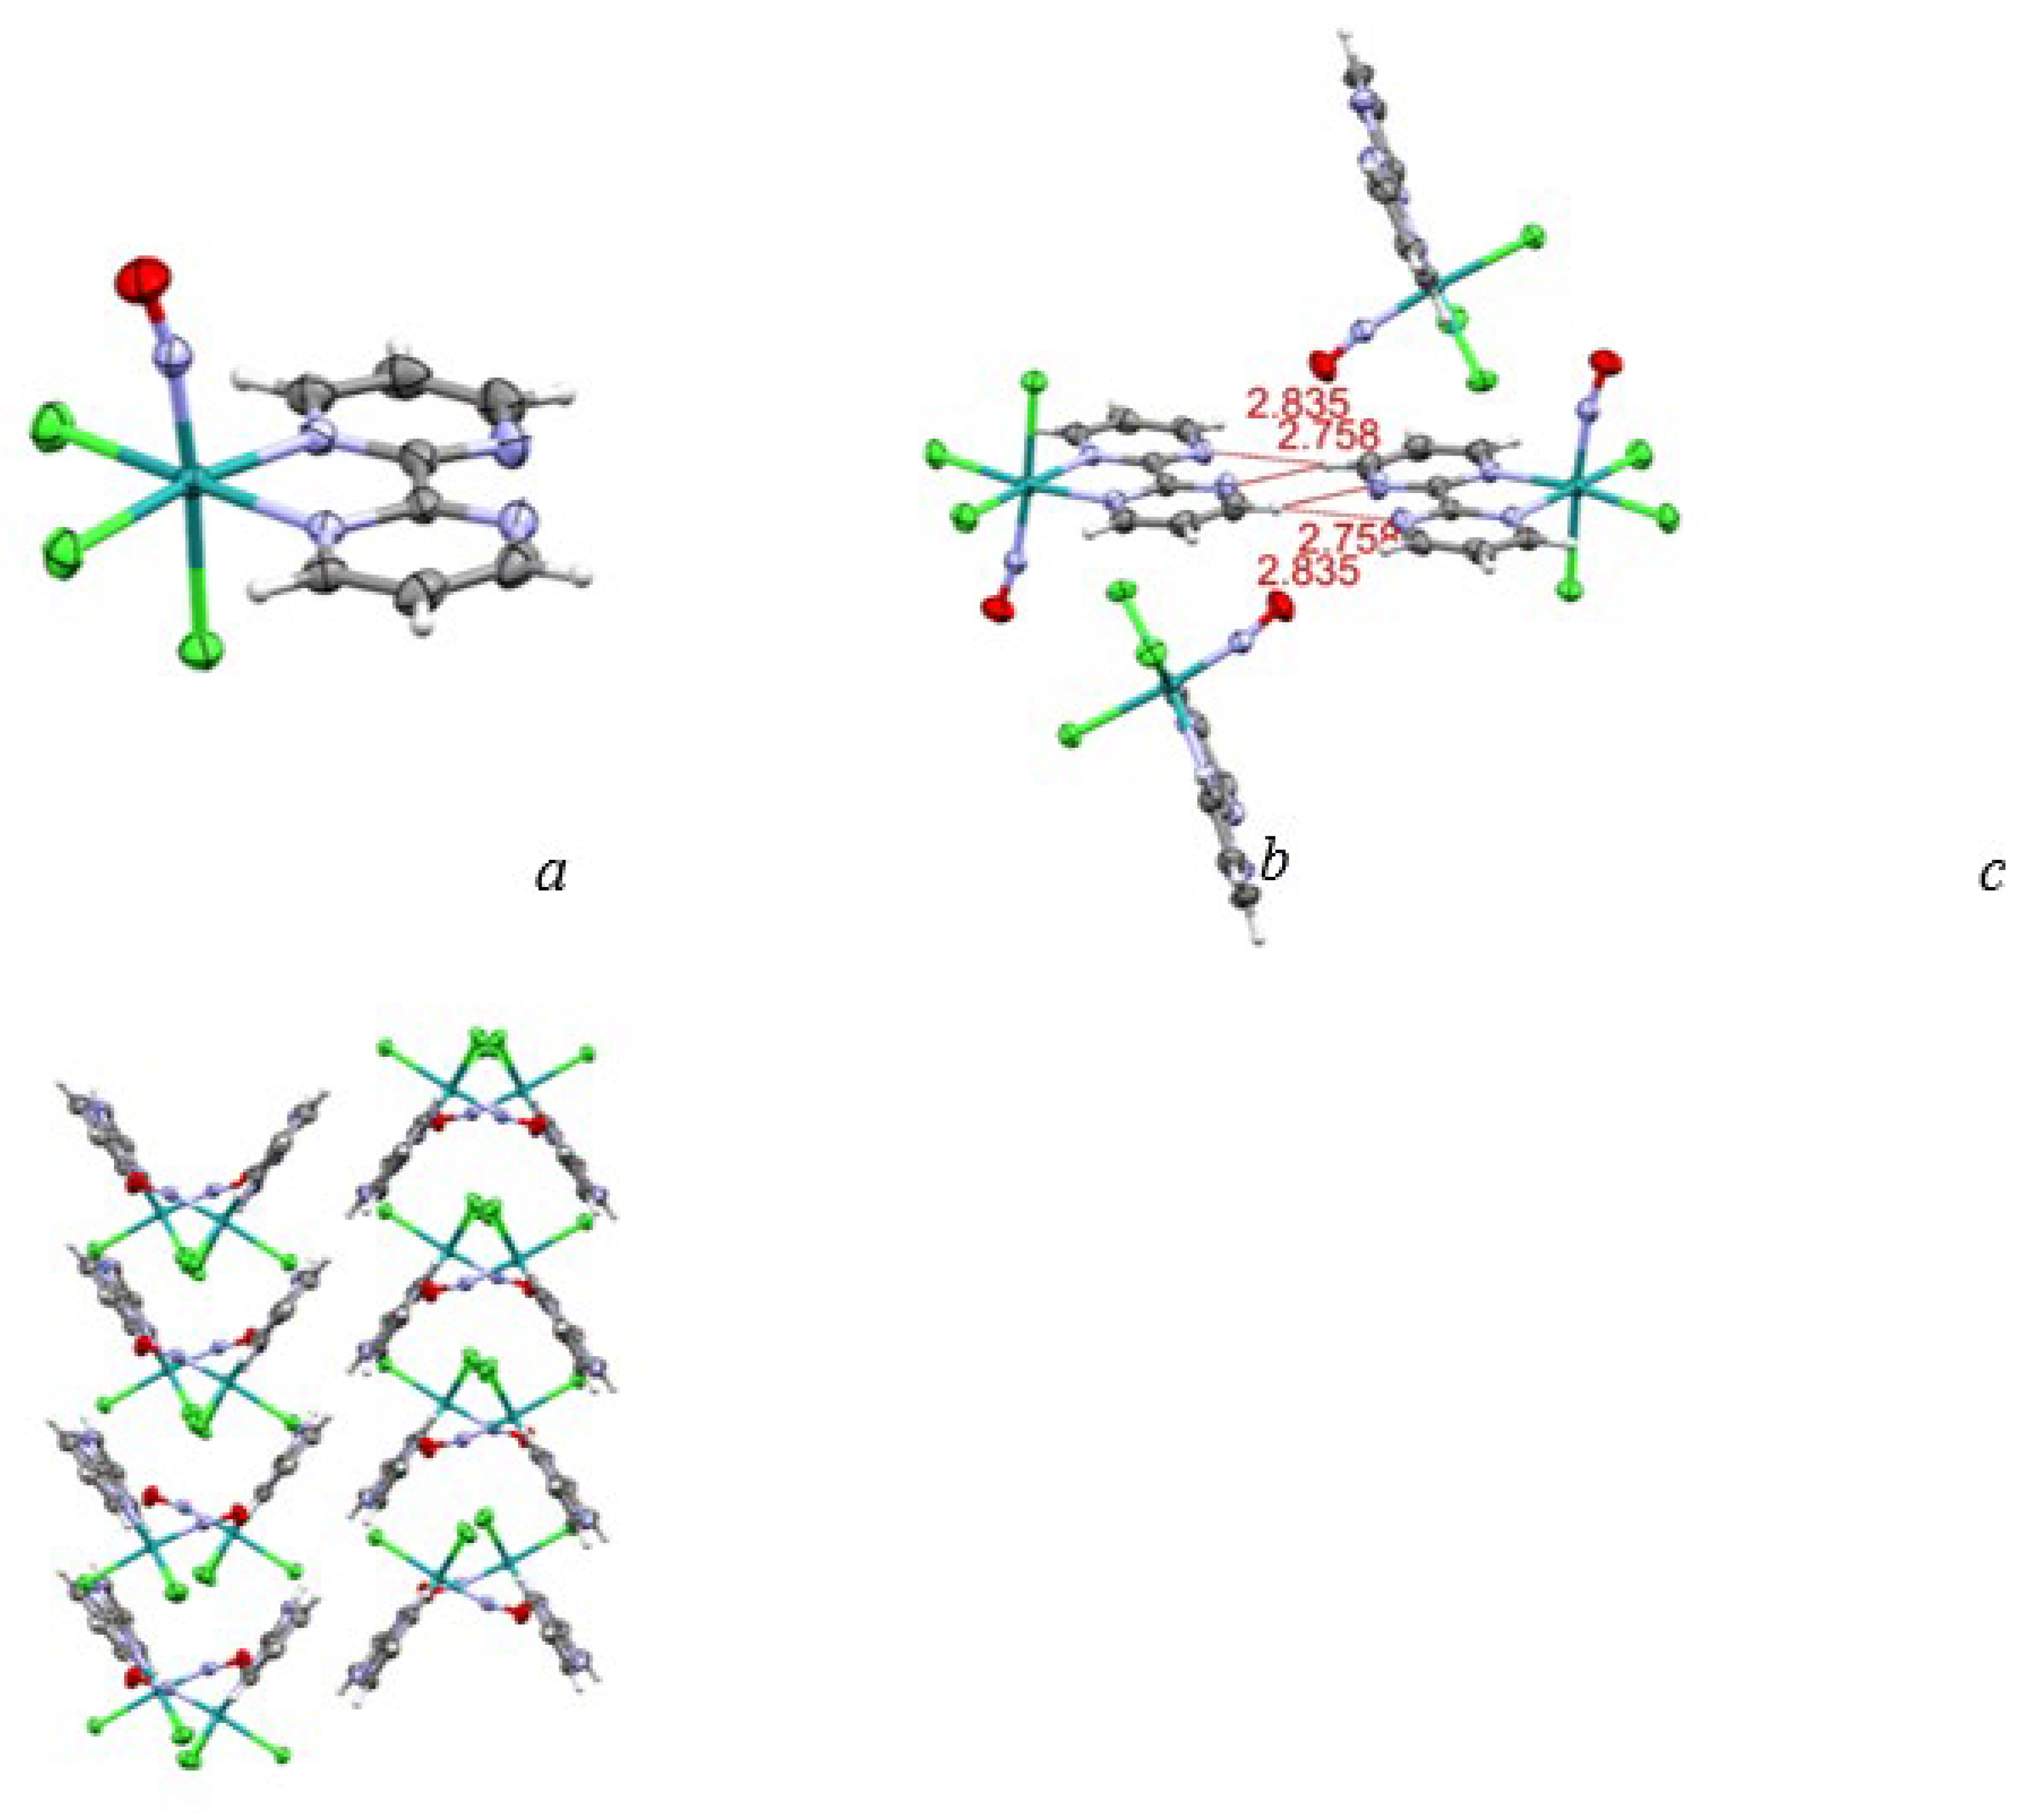
Figure 3.
Structural fragment of fac-[RuNO(phen)Cl3] (2) (panel a), crystallographic unit cell of 2 (panel b) and crystal packing of 2 (panel c). ADPs are given at the 50% probability level.
Figure 3.
Structural fragment of fac-[RuNO(phen)Cl3] (2) (panel a), crystallographic unit cell of 2 (panel b) and crystal packing of 2 (panel c). ADPs are given at the 50% probability level.
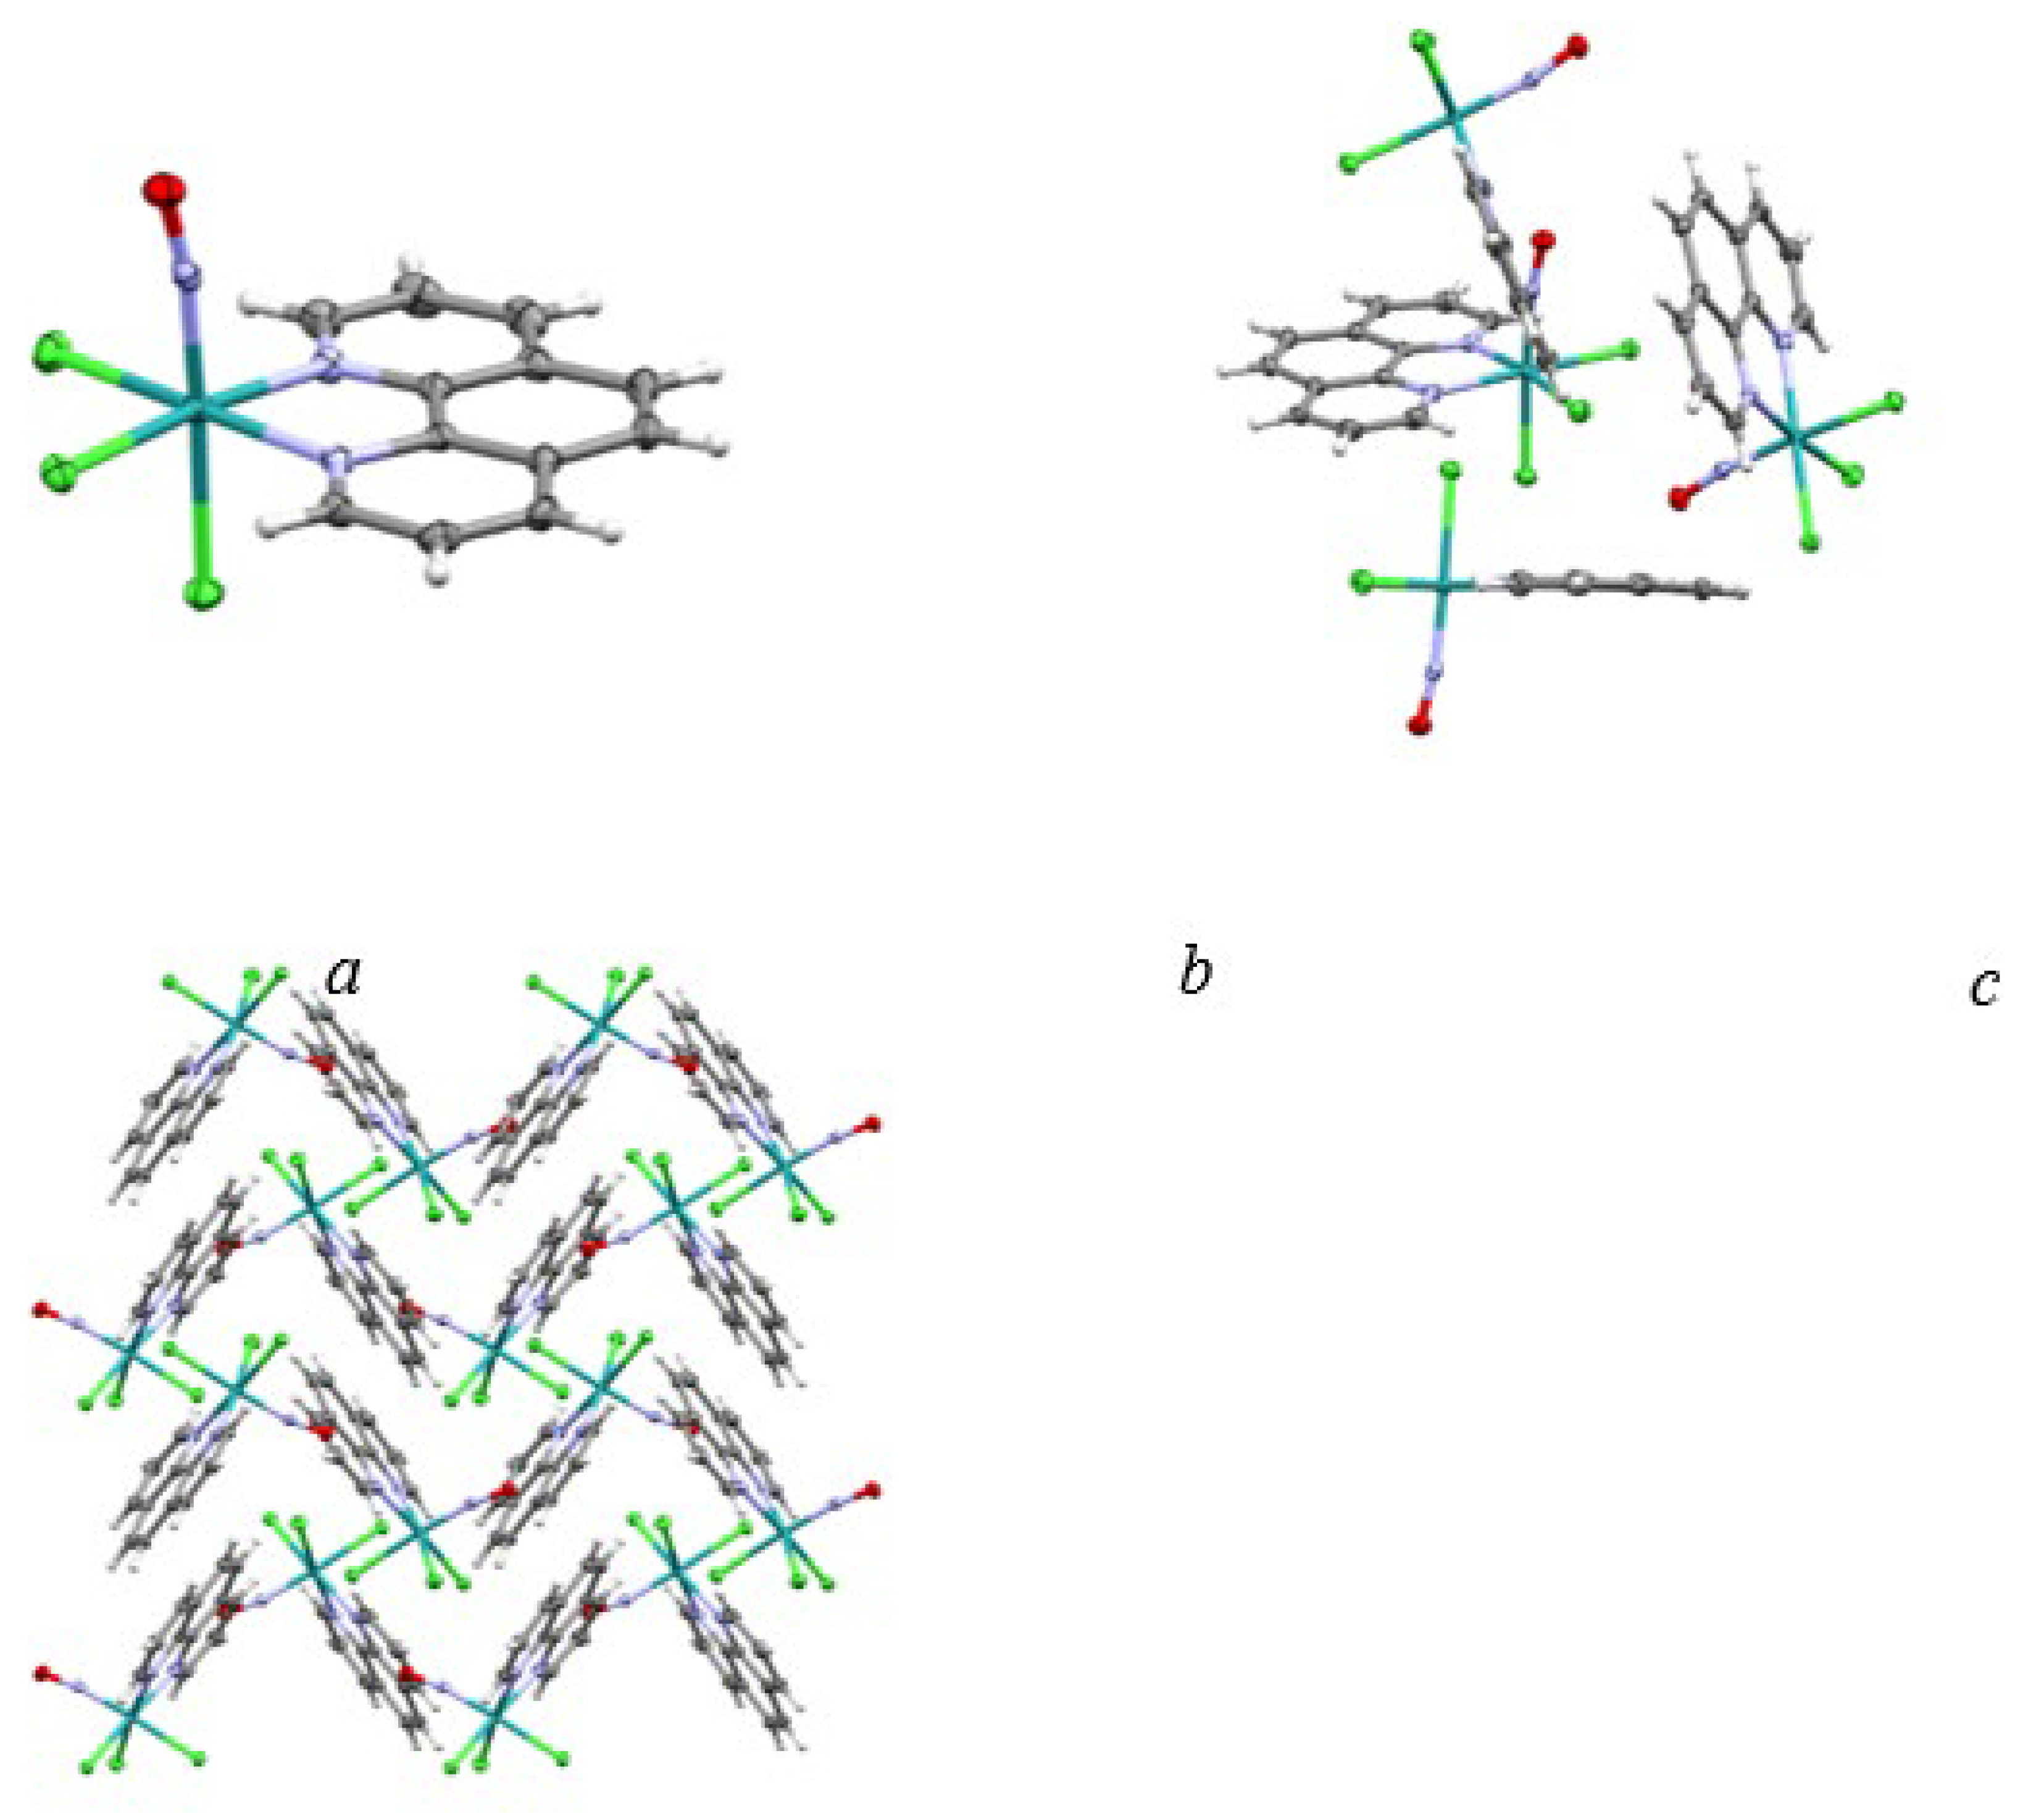
Figure 5.
Evolution of IR (left) and UV-Vis (right) spectra for DMSO solution of compound fac-[RuNO(bpym)Cl3] (1) under continuous 450 nm irradiation for 10 minutes.
Figure 5.
Evolution of IR (left) and UV-Vis (right) spectra for DMSO solution of compound fac-[RuNO(bpym)Cl3] (1) under continuous 450 nm irradiation for 10 minutes.
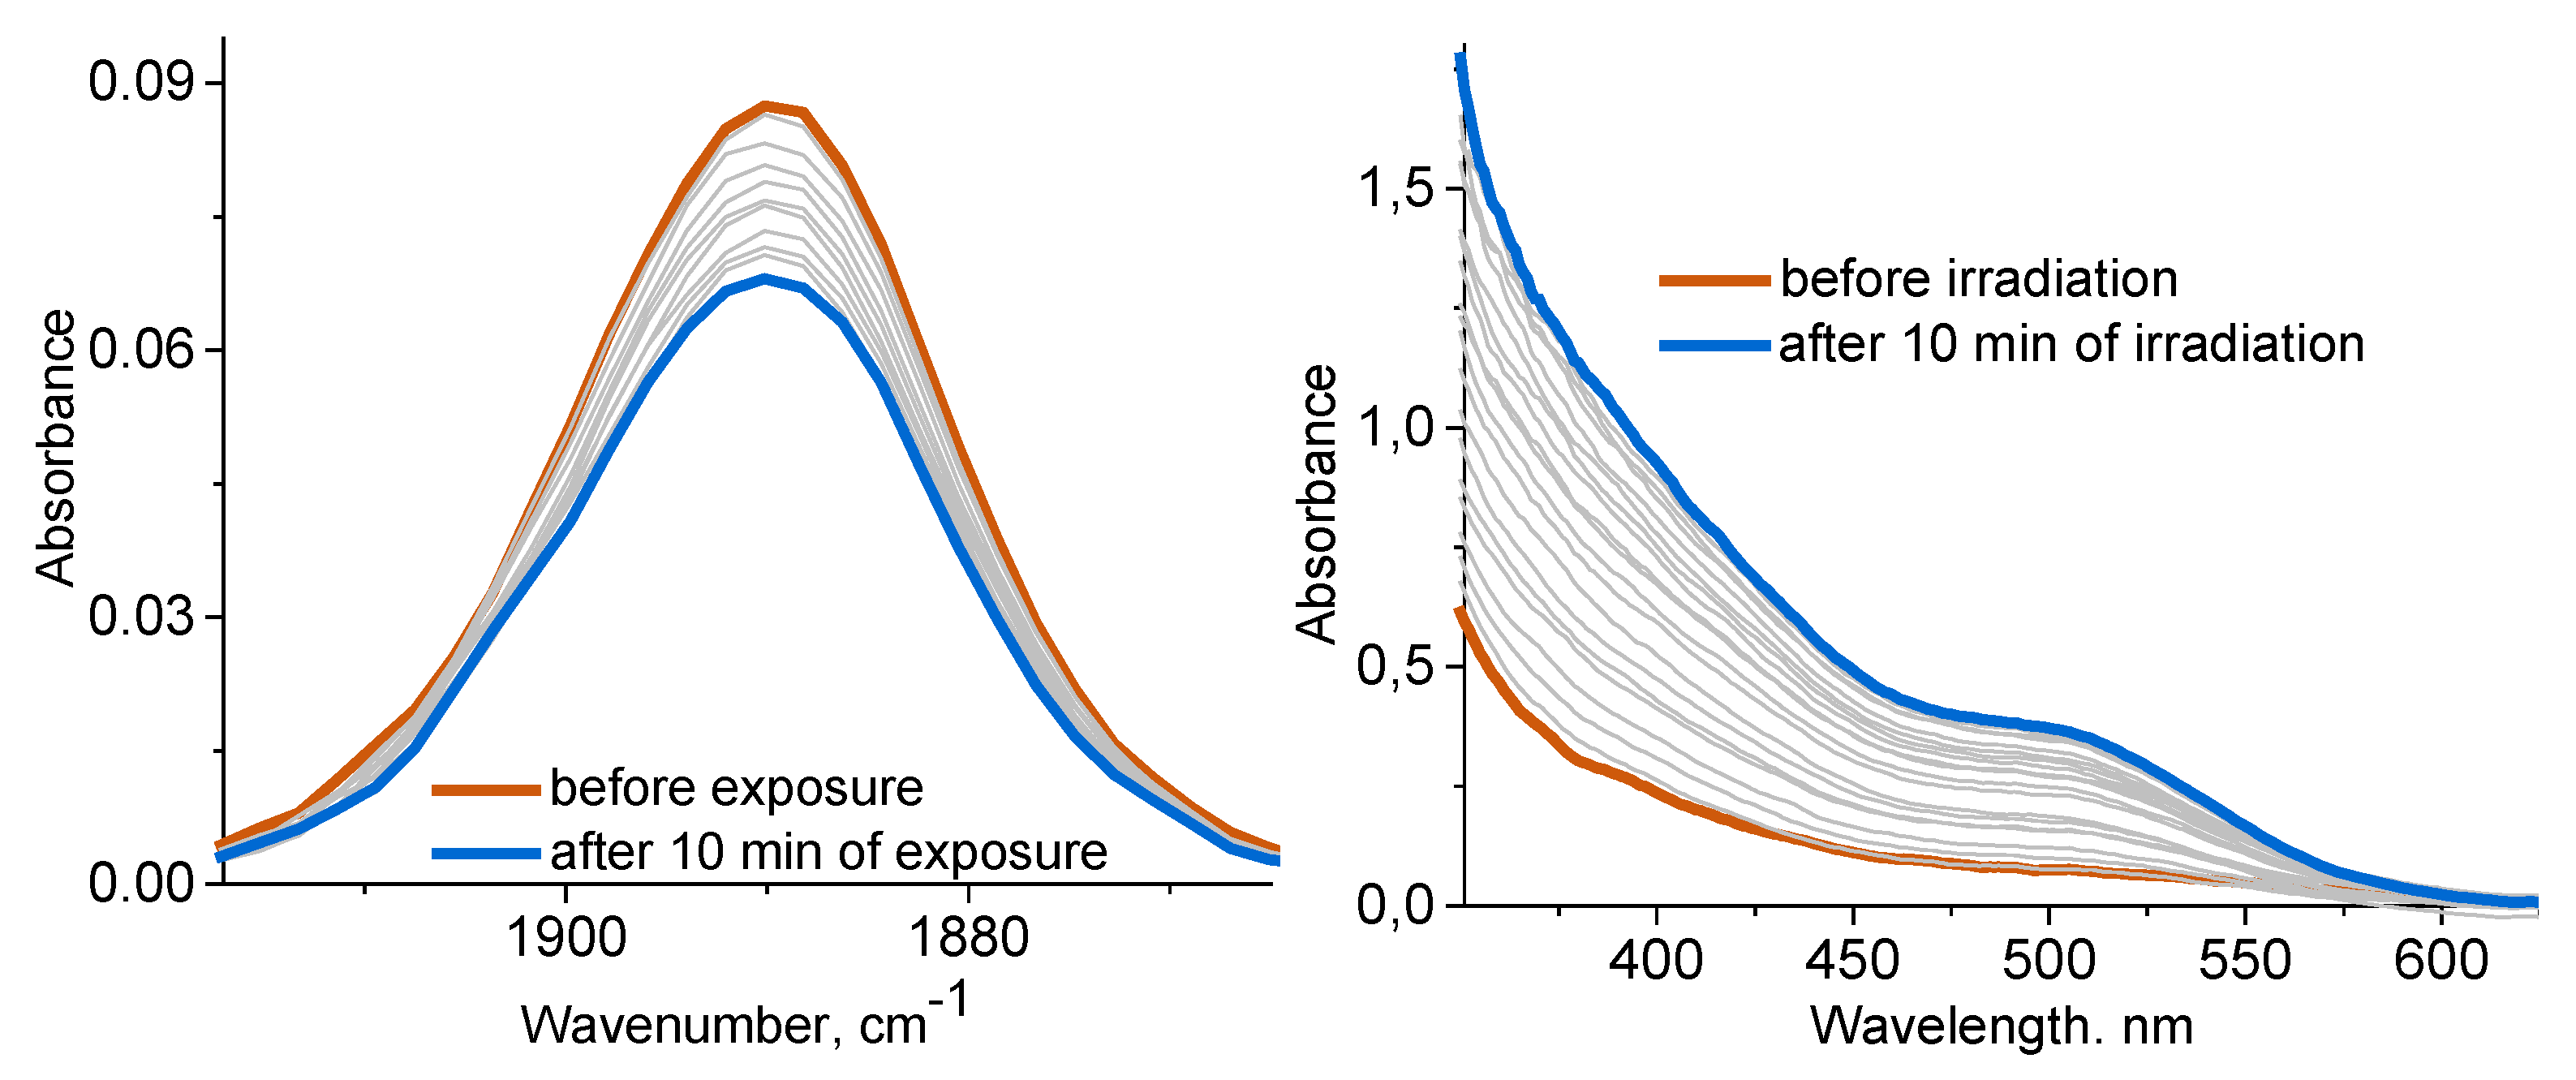
Figure 7.
Main orbitals contributing to the transitions for fac-[RuNO(phen)Cl3] (2).
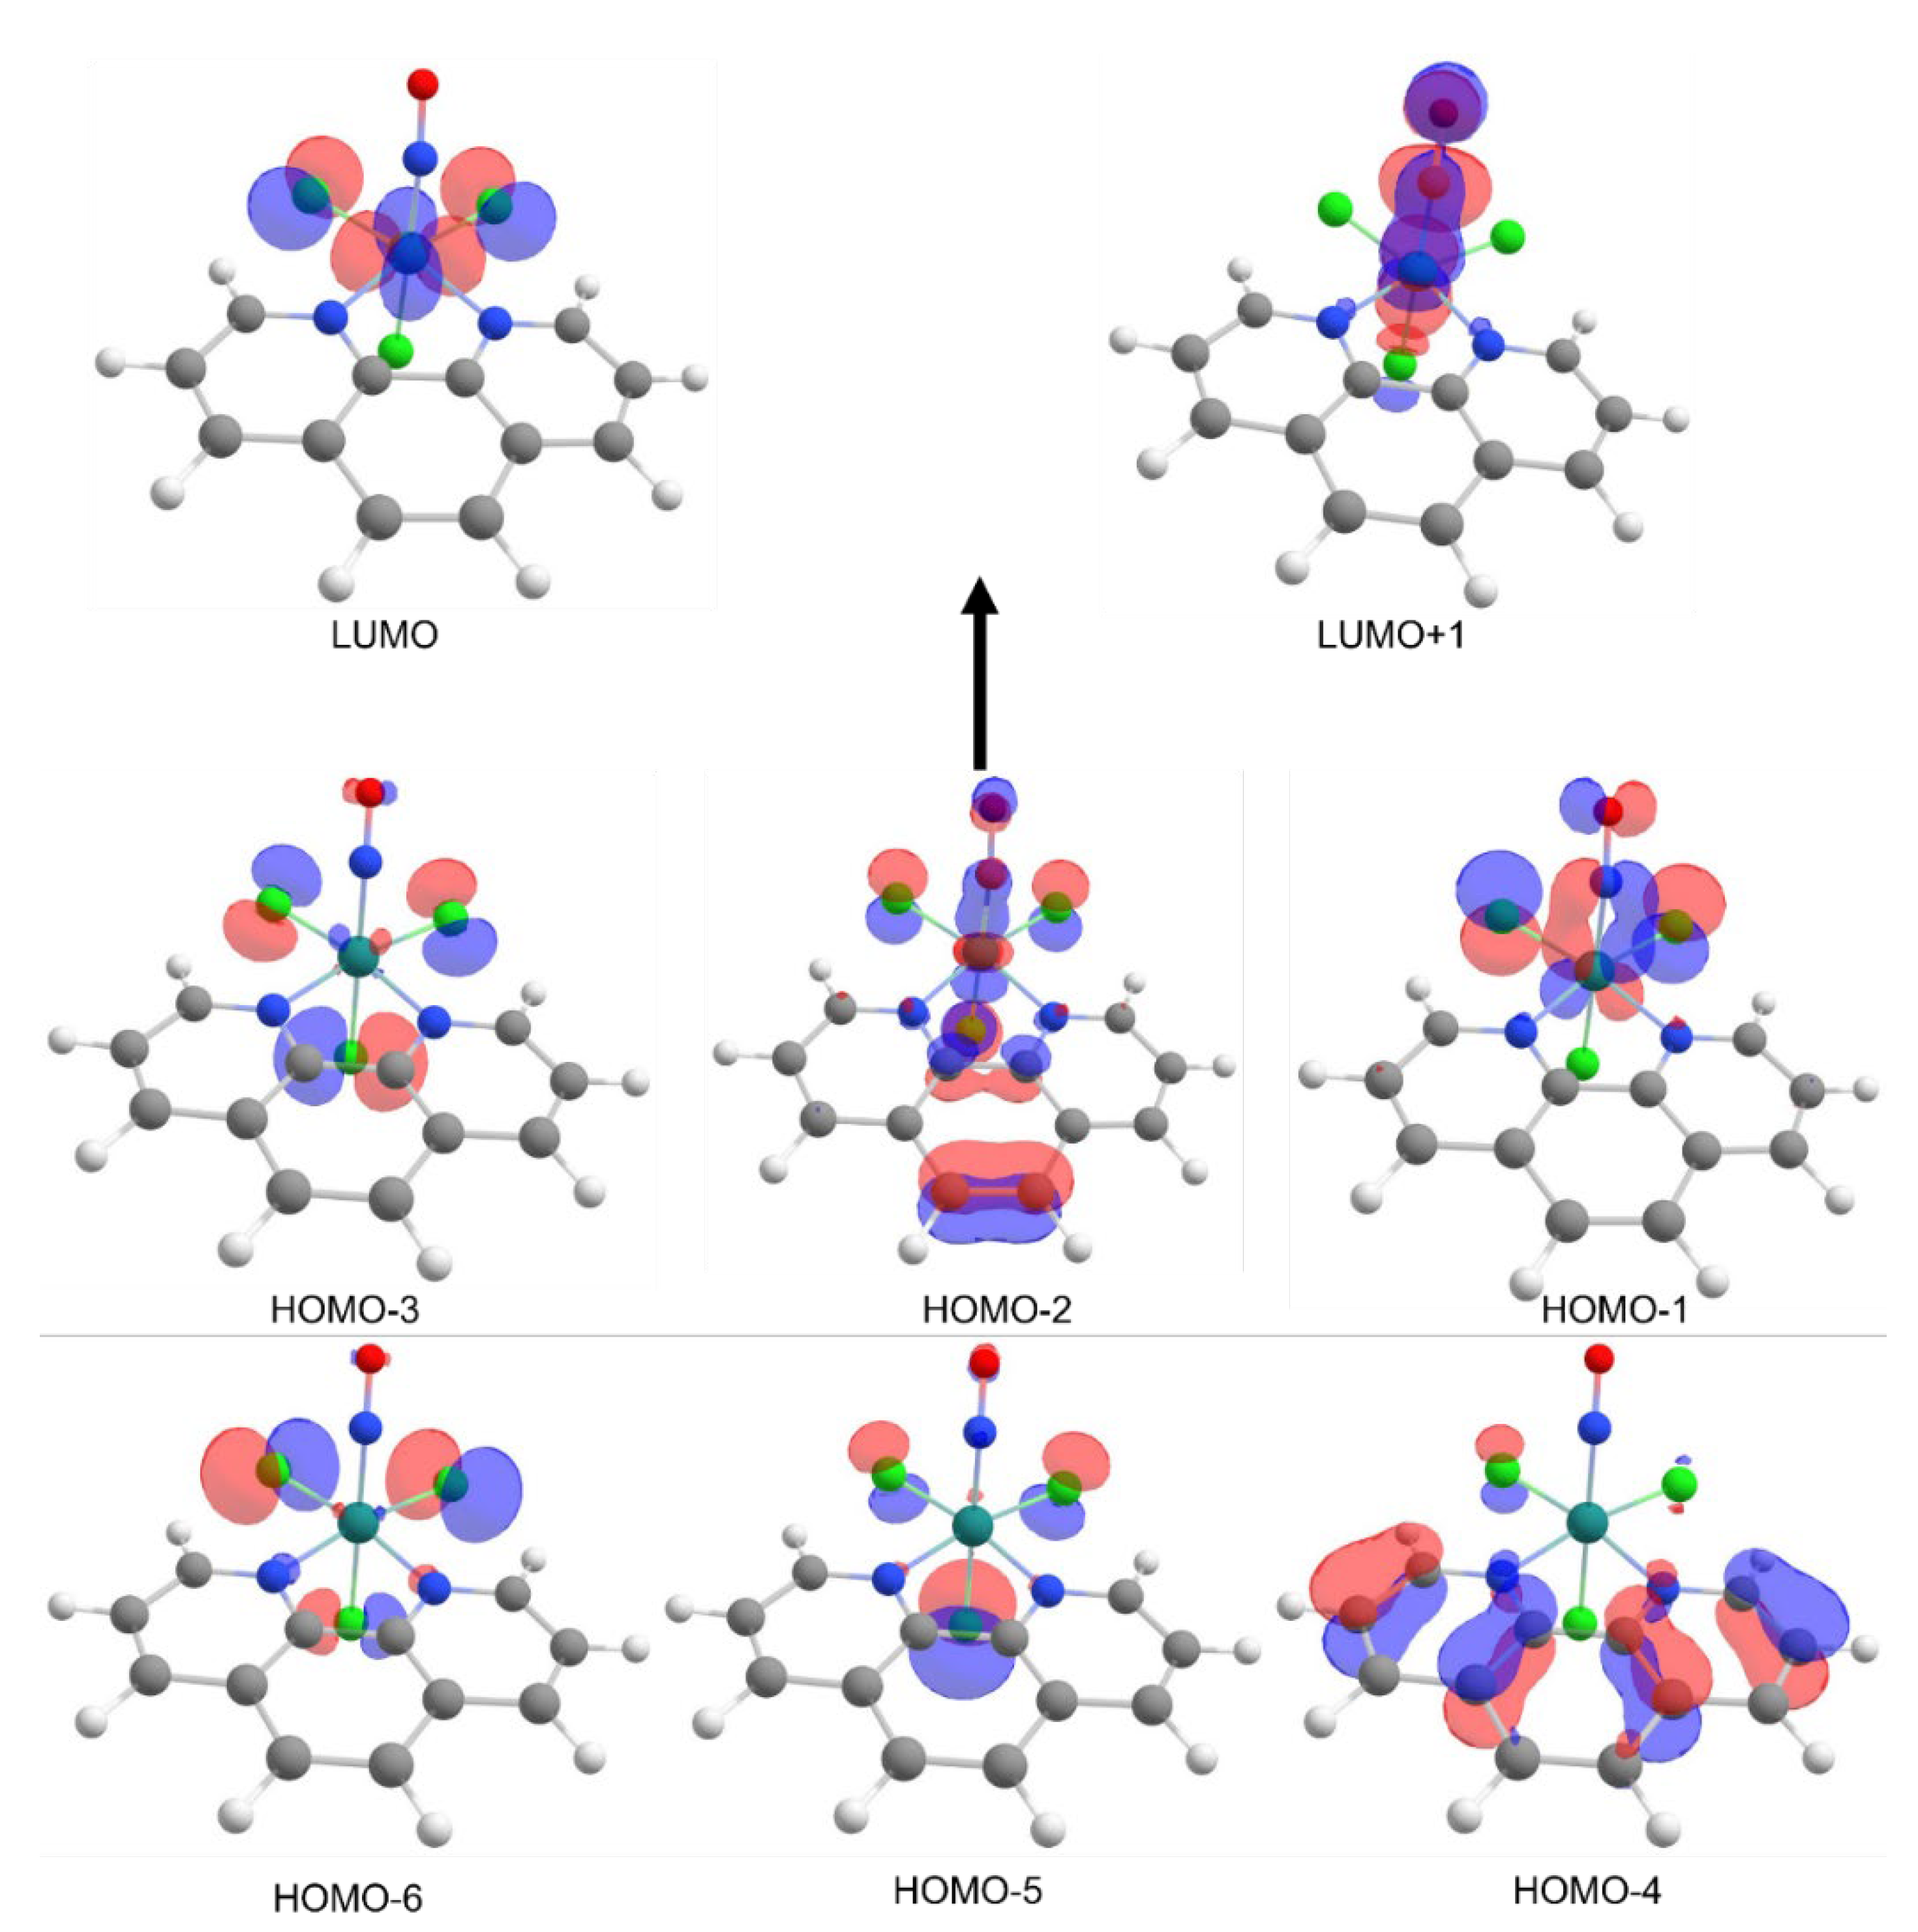
Figure 8.
Main orbitals contributing to the transitions for mer-[RuNO(phen)Cl3] (3).
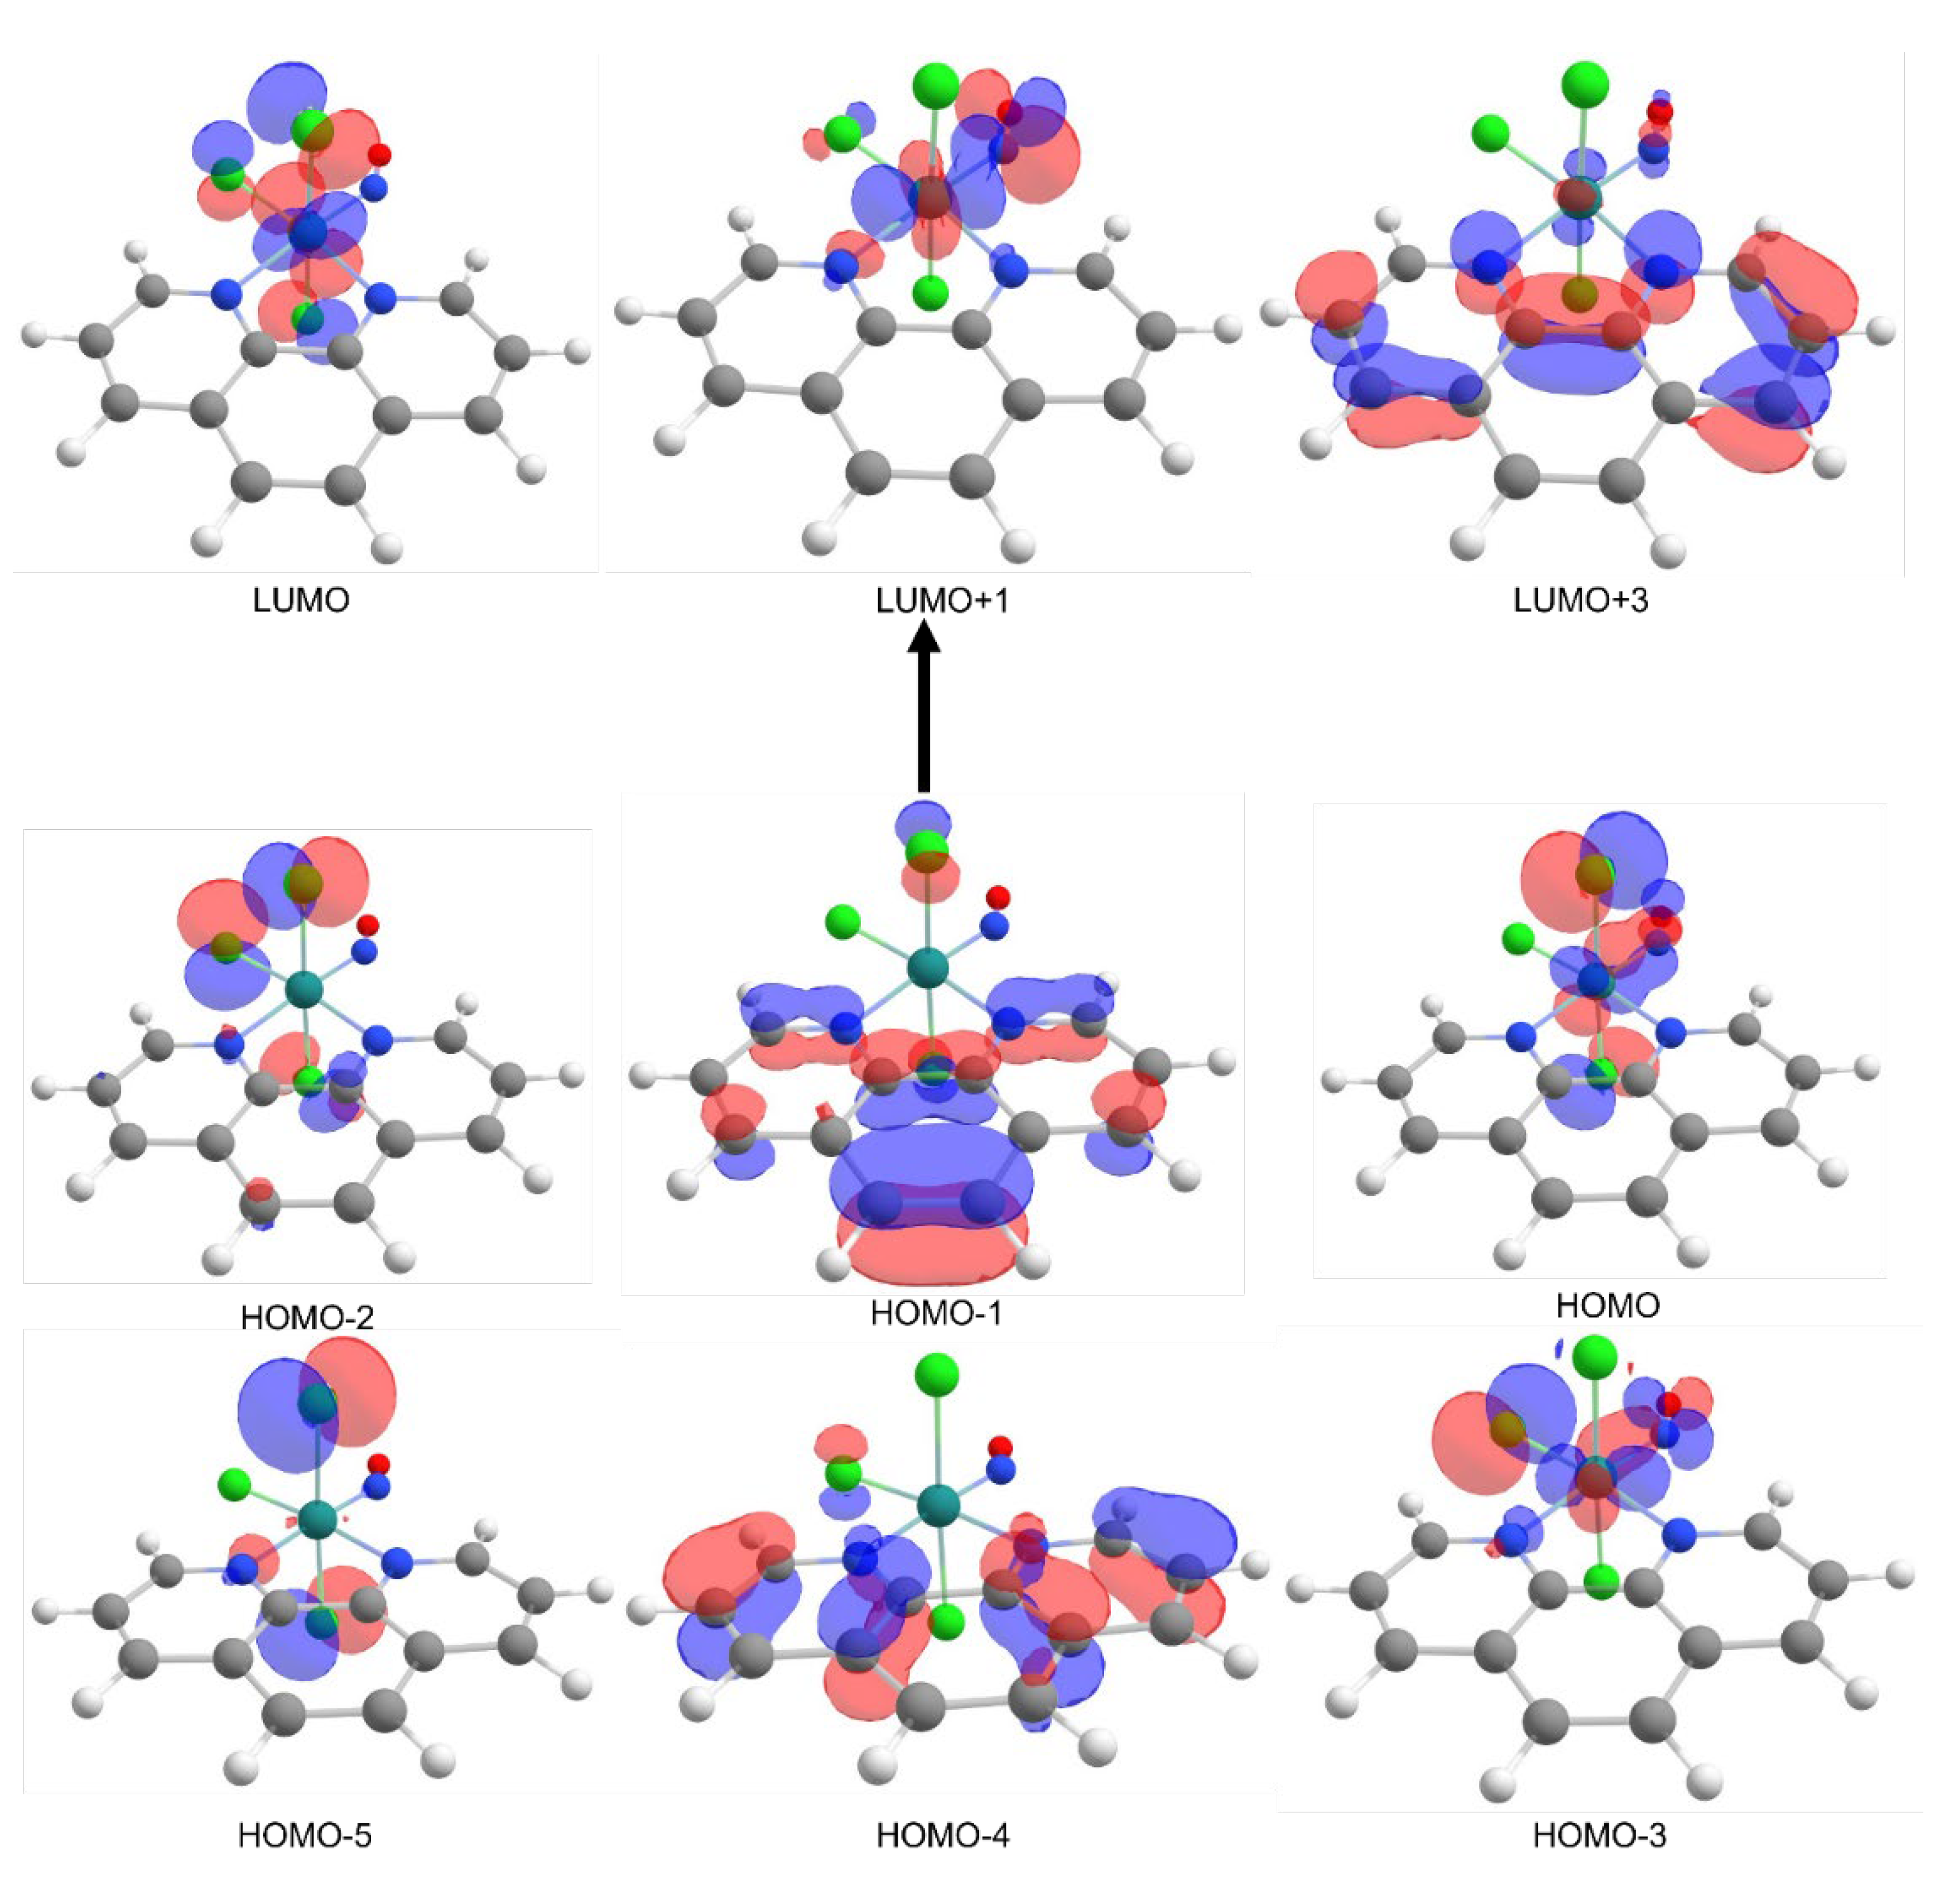
Figure 9.
Main orbitals contributing to the transitions for fac-[RuNO(bpy)Cl3] (4).
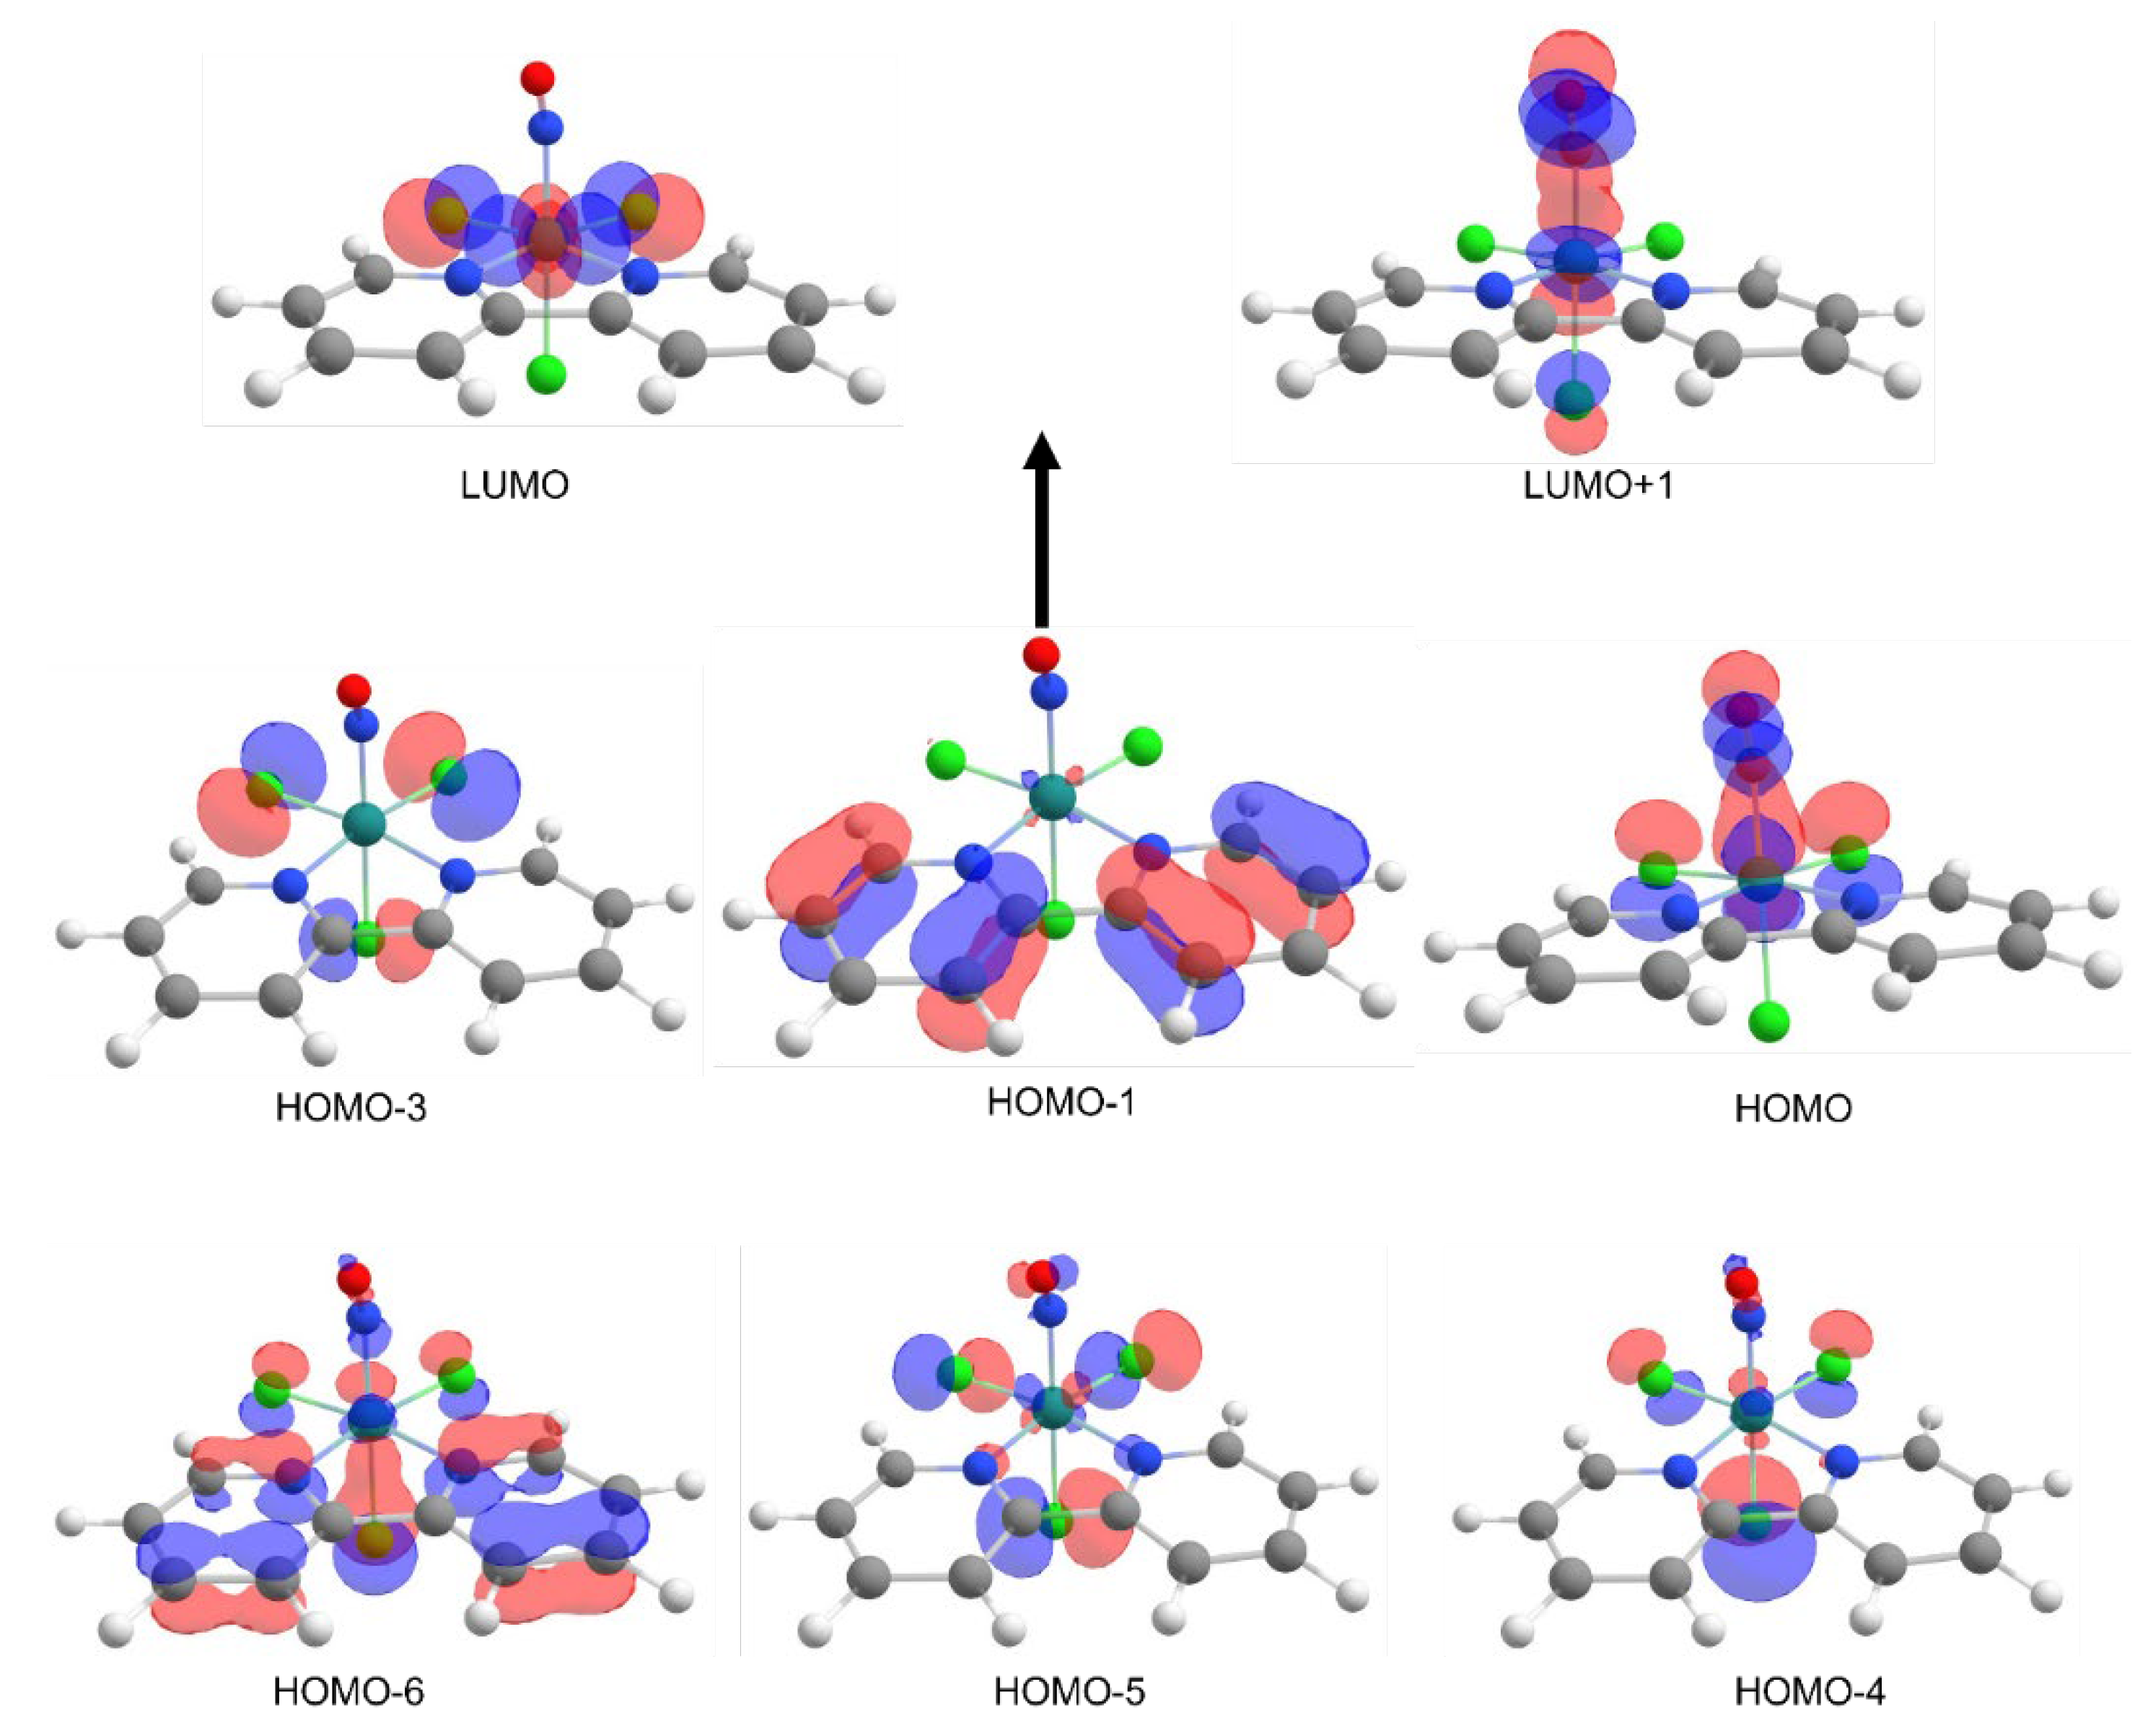
Figure 10.
Main orbitals contributing to the transitions for mer-[RuNO(bpy)Cl₃] (5).
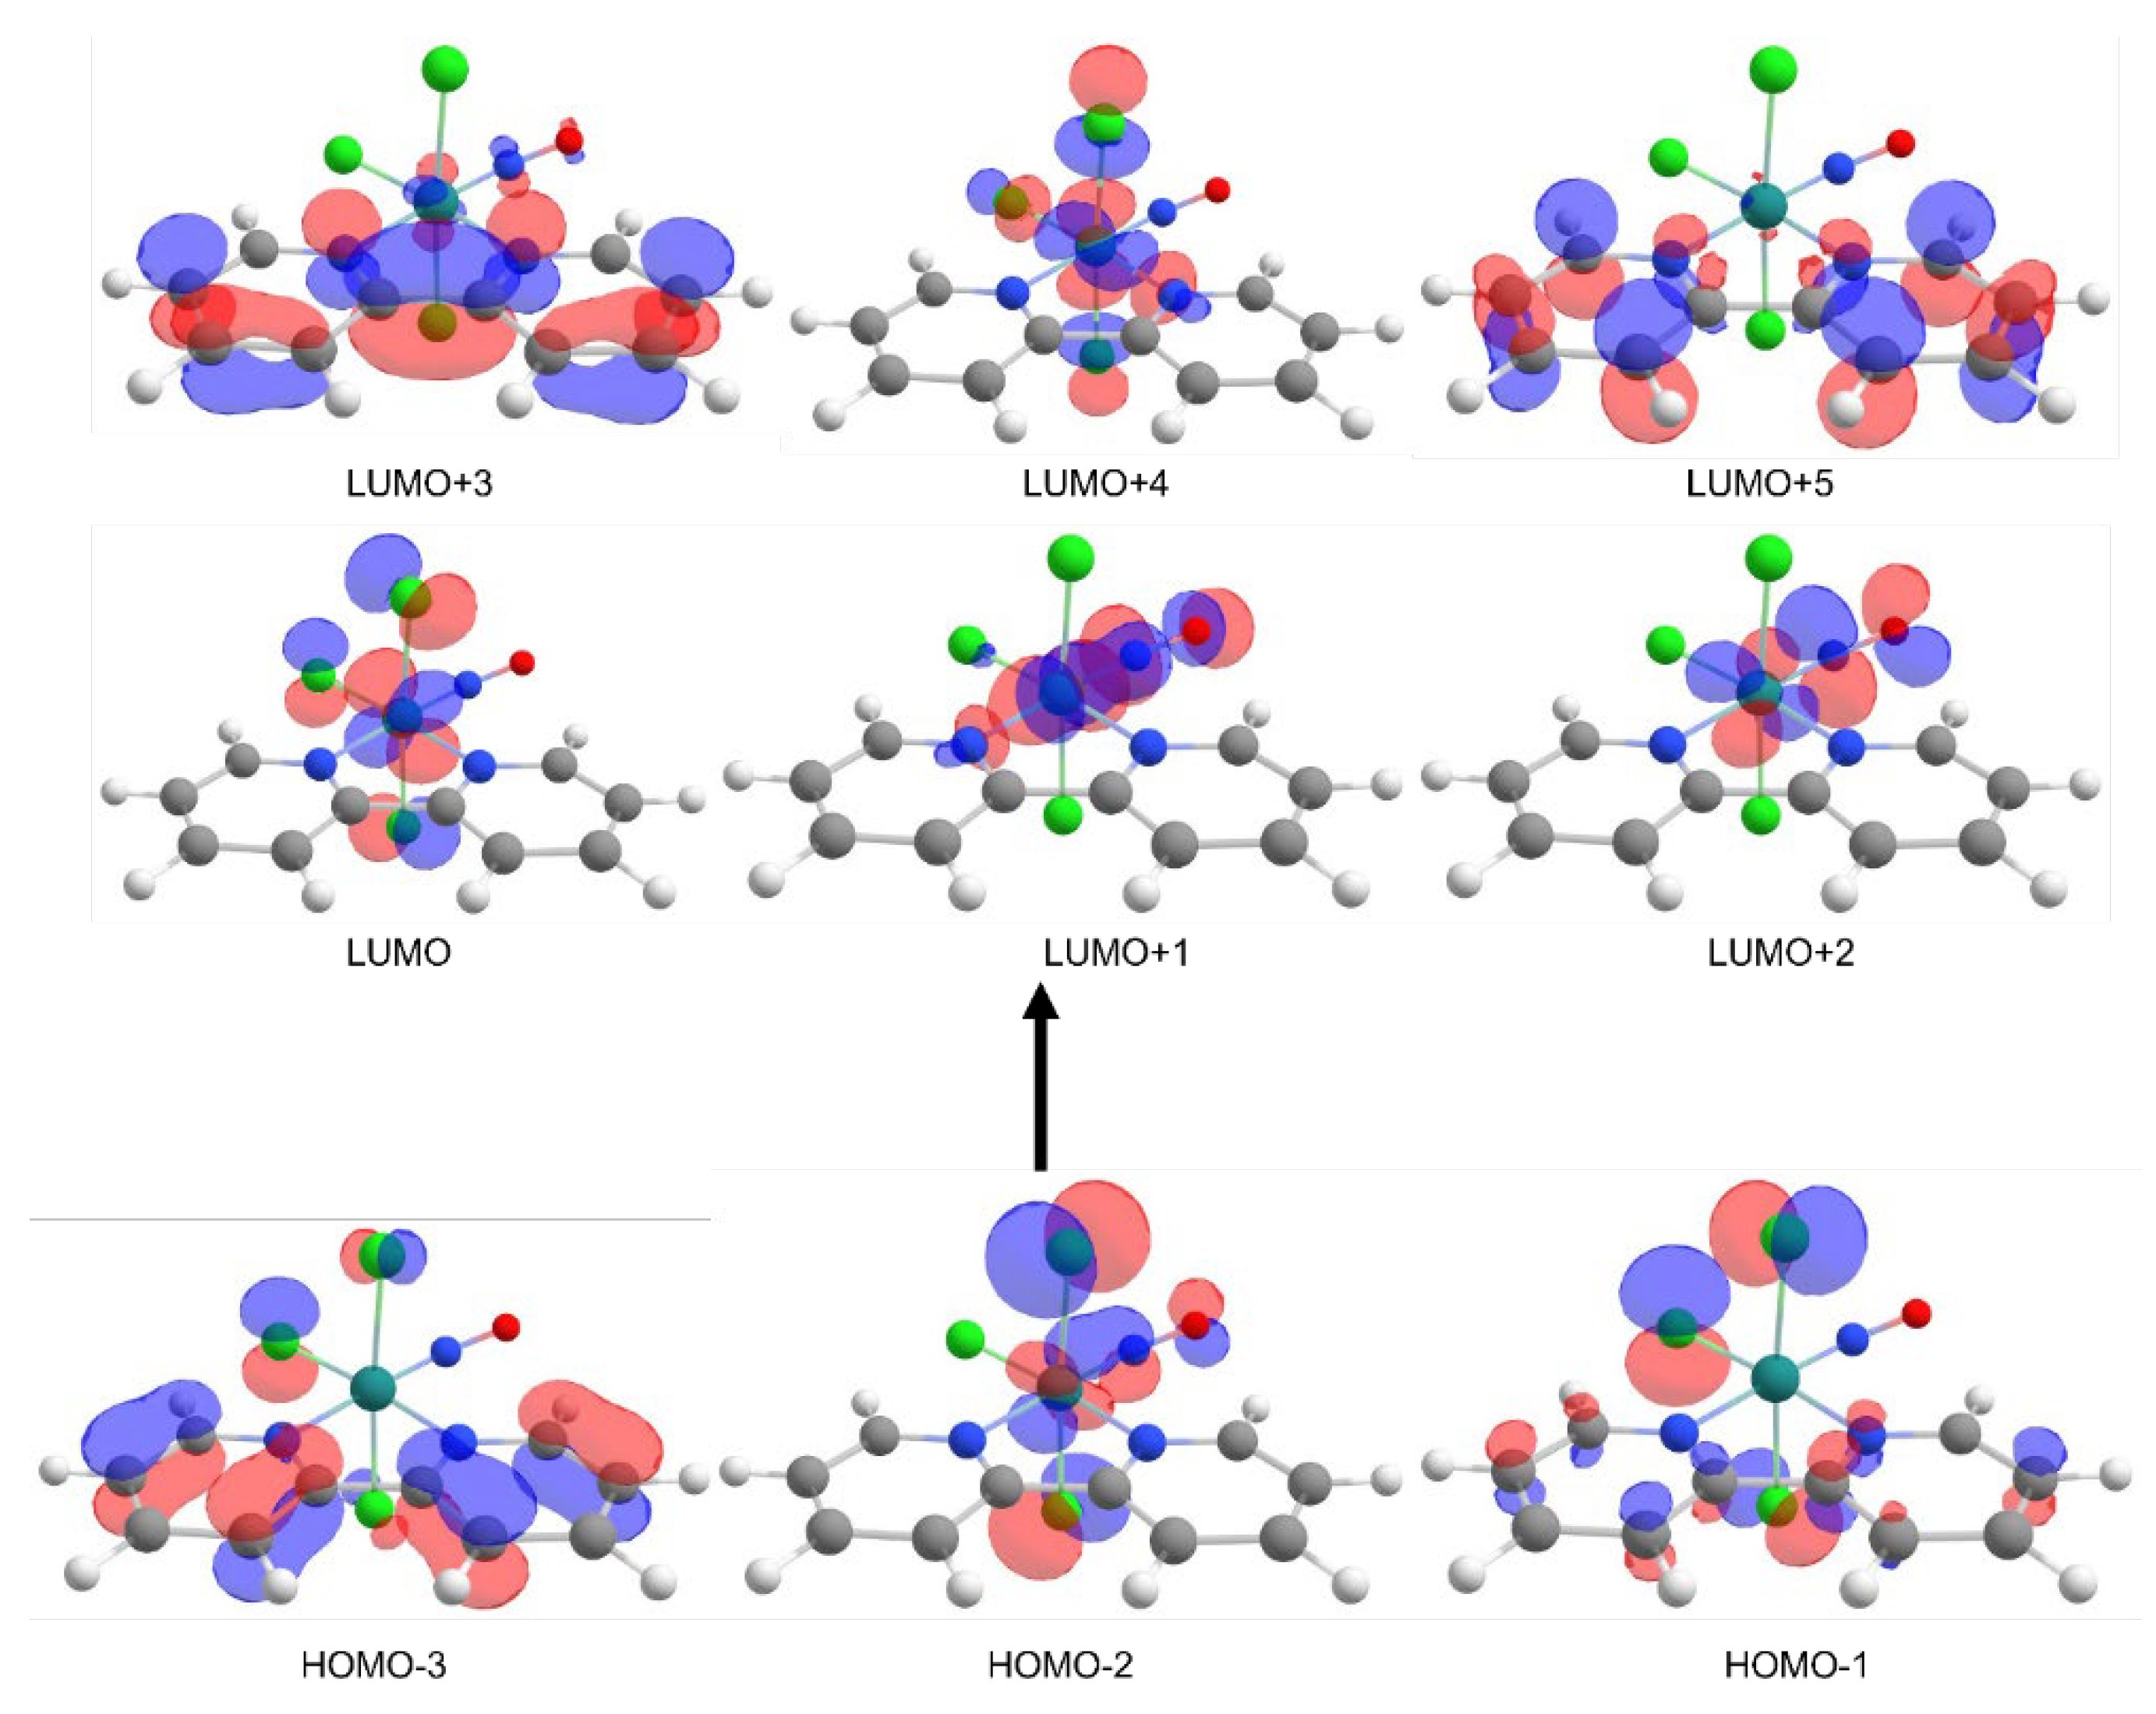
Figure 13.
Structural fragment of mer-[RuNO(bpy)Cl3] (6) (panel a), crystallographic unit cell of 6 (panel b) and crystal packing of 6 (panel c). ADPs are given at the 50% probability level.
Figure 13.
Structural fragment of mer-[RuNO(bpy)Cl3] (6) (panel a), crystallographic unit cell of 6 (panel b) and crystal packing of 6 (panel c). ADPs are given at the 50% probability level.
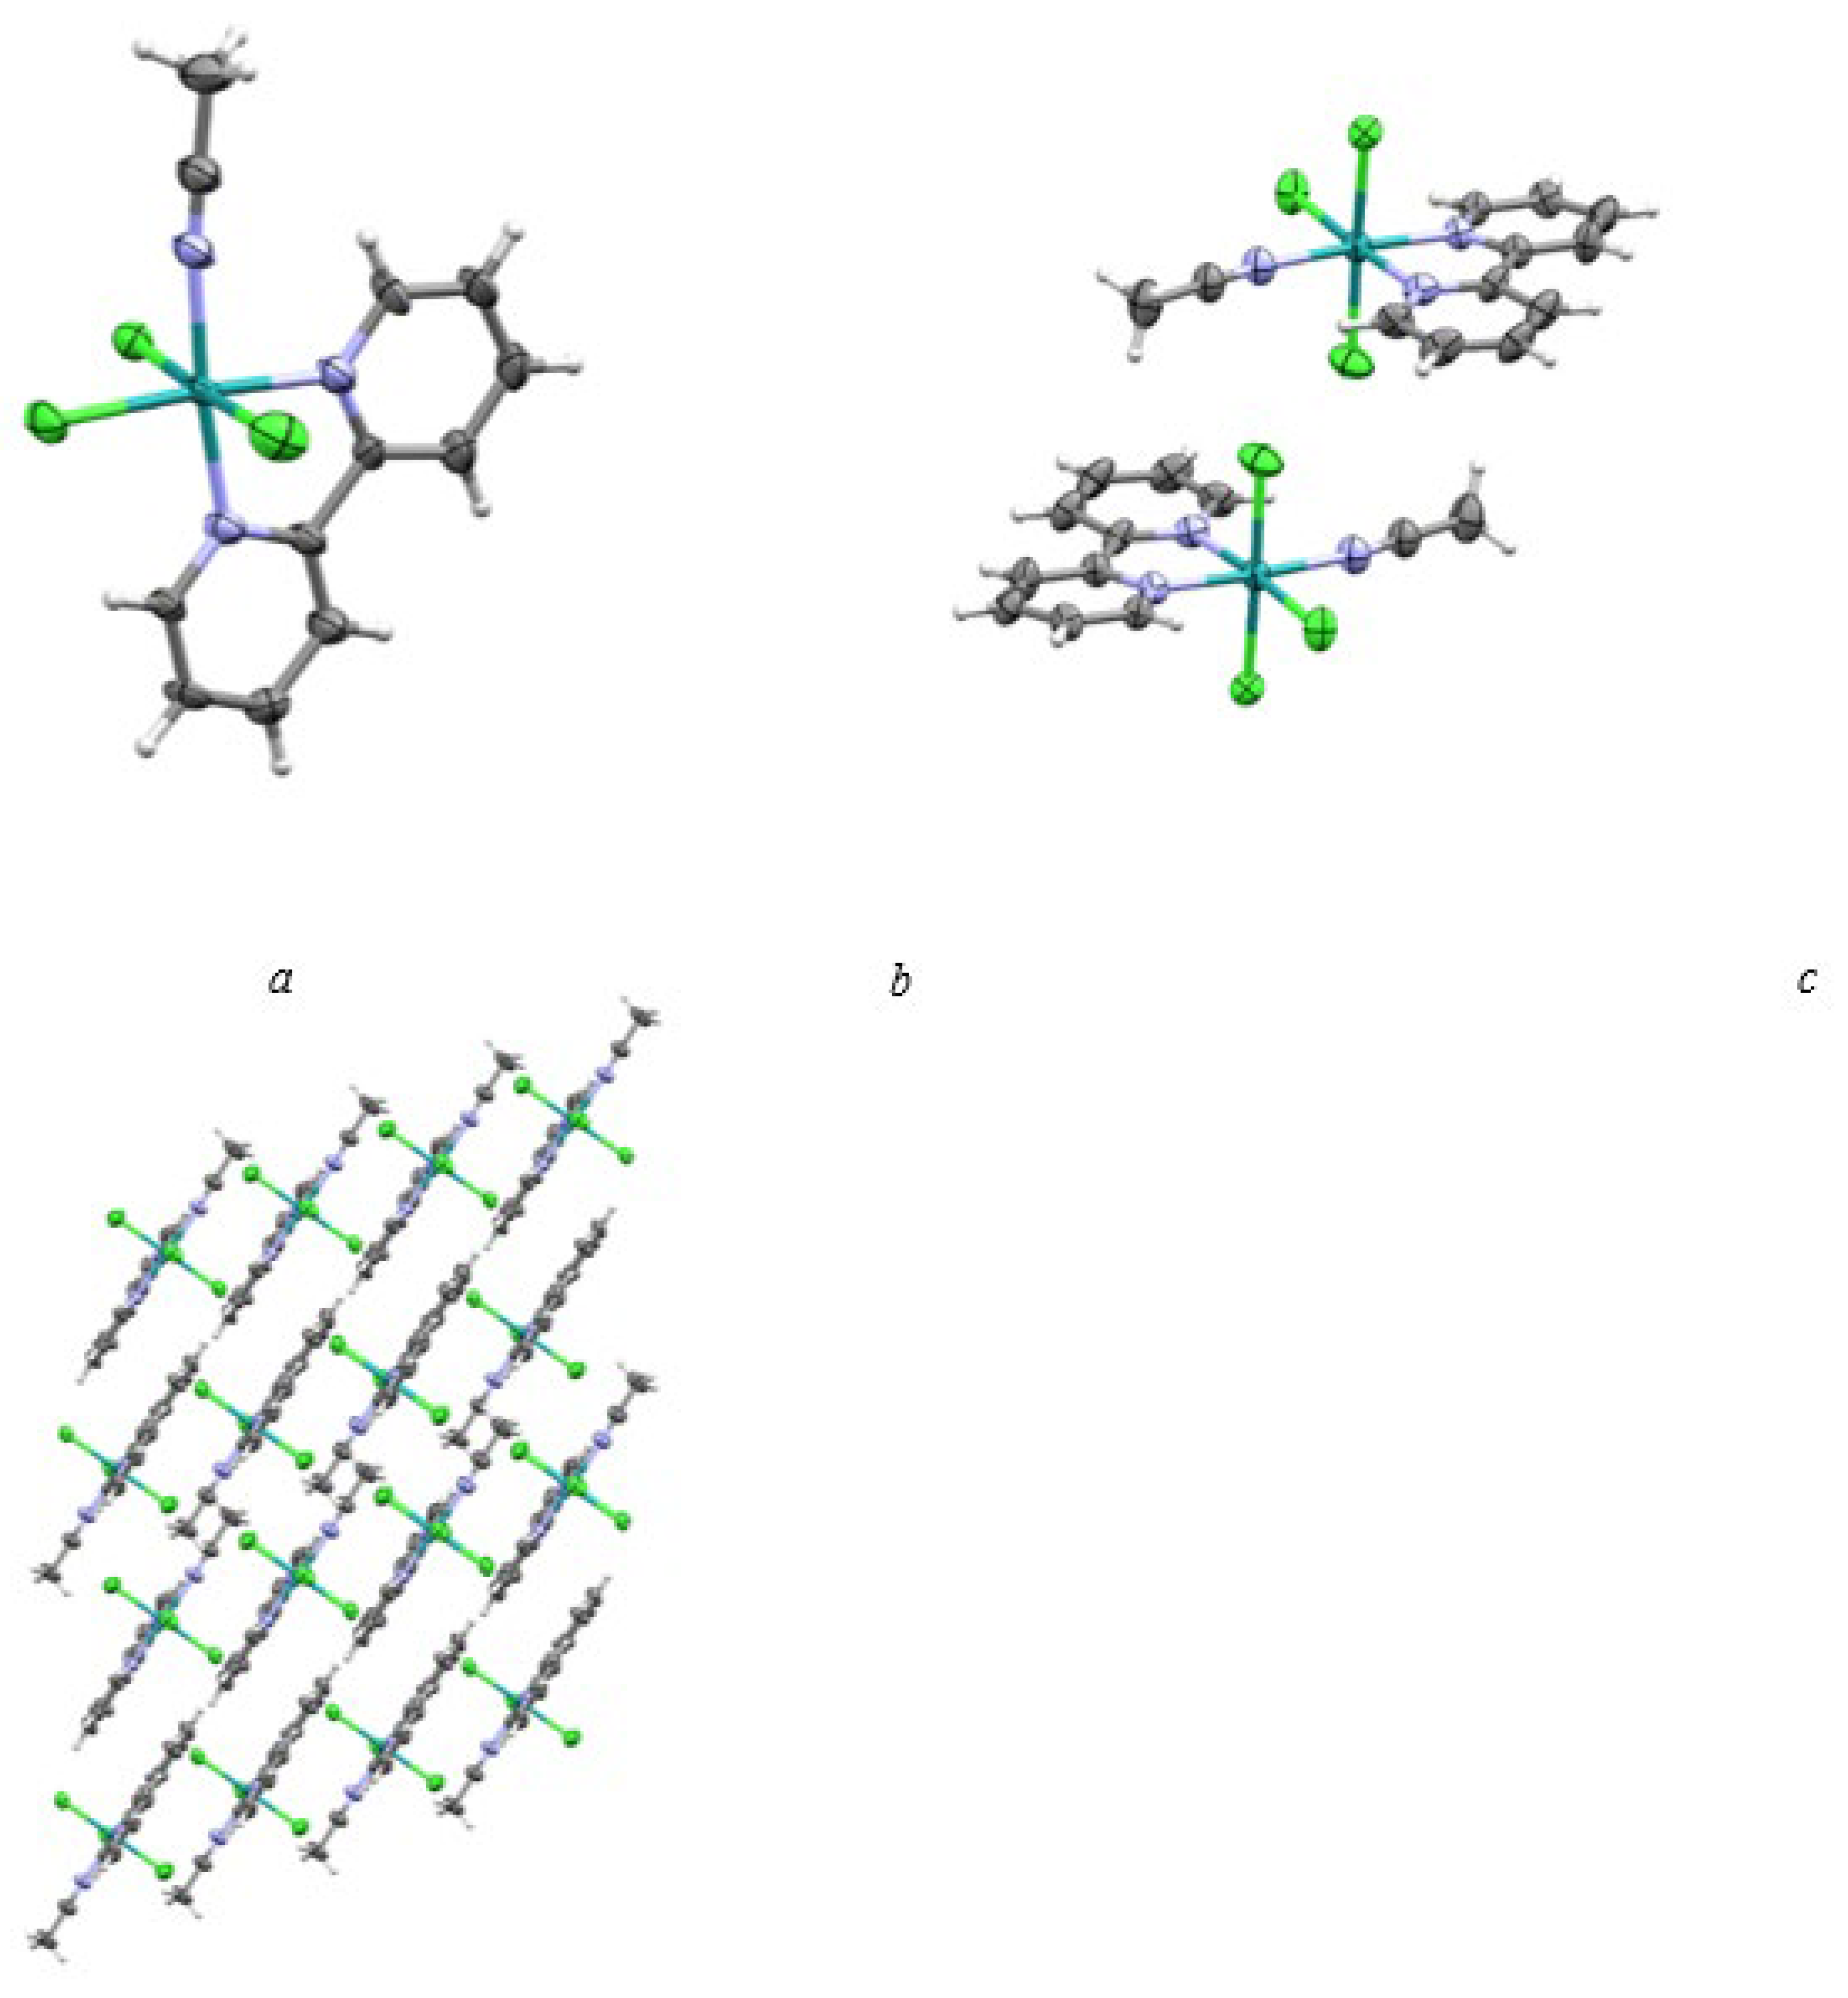

Table 1.
Selected structural parameters: interatomic distances (Å) and angles (°) for the structures 1-3 measured at 100 K.
Table 1.
Selected structural parameters: interatomic distances (Å) and angles (°) for the structures 1-3 measured at 100 K.
| 1(fac-bpym) | 2(fac-phen) | 3(mer-phen) | |
| Space group | P21/n | P212121 | P21/n |
| d(N-O), Å | 1.132(2) | 1.139(4) | 1.132(5) |
| Ð(Ru-N-O), ° | 168.90(16) | 170.8(3) | 172.4(4) |
| d(Ru-NO), Å | 1.7435(17) | 1.746(3) | 1.742(4) |
| d(Ru-Cl), Å | 2.3572(5) 2.3628(5) 2.3462(5) (trans) |
2.3759(10) 2.3813(9) 2.3460(10) (trans) | 2.3624(14) 2.3502(15) 2.3586(14) |
| d(Ru-N(L)), Å | 2.0815(16) 2.0816(16) |
2.076(3) 2.082(3) |
2.084(4) 2.097(5) (trans) |
Table 2.
Photodissociation quantum yields for compounds 1–5 measured in DMSO (solvent variations are noted where applicable).
Table 2.
Photodissociation quantum yields for compounds 1–5 measured in DMSO (solvent variations are noted where applicable).
| Compound | QY, % |
| fac-[RuNO(bpym)Cl3] (1) | 5.4 ± 0.5 |
| fac-[RuNO(phen)Cl₃] (2) | 0.8±0.1 |
| mer-[RuNO(phen)Cl3] (3) | 0.6±0.1 |
| fac-[RuNO(bpy)Cl3] (4) | 3.7±0.1 |
| mer-[RuNO(bpy)Cl3] (5) | 2.1±0.1/2.4±0.1 (DMSO/CH3CN) |
Table 3.
Correlation between the relative transition contribution and the quantum yield for compounds 2–5.
Table 3.
Correlation between the relative transition contribution and the quantum yield for compounds 2–5.
| Complex | RC, % | QY, % |
| 2 (fac-) | 32 | 0.8±0.1 |
| 3 (mer-) | 23 | 0.6±0.1 |
| 4 (fac-) | 63 | 3.7±0.1 |
| 5 (mer-) | 44 | 2.1±0.1 |
Table 4.
Proposed assignment of fragment ions in the ESI mass spectra of compounds 1–5 in 1:1 DMSO:EtOH solutions.
Table 4.
Proposed assignment of fragment ions in the ESI mass spectra of compounds 1–5 in 1:1 DMSO:EtOH solutions.
| Compound | m/z of (*) | Proposed Fragment Composition of (*) |
| fac-[RuNO(bpym)Cl3] (1) | 529 | [Ru(bpym)(DMSO)3Cl]+ |
| fac-[RuNO(phen)Cl₃] (2) | 510 | [Ru(phen)(DMSO)2Cl2]+ |
| mer-[RuNO(phen)Cl3] (3) | ||
| fac-[RuNO(bpy)Cl3] (4) | 486 | [Ru(bpy)(DMSO)2Cl2]+ |
| mer-[RuNO(bpy)Cl3] (5) |
Table 5.
Selected structural parameters: interatomic distances (Å) and angles (°) for the structure 6 measured at 100 K.
Table 5.
Selected structural parameters: interatomic distances (Å) and angles (°) for the structure 6 measured at 100 K.
| 6 | 5* | |
| Space group | P-1 | Pn |
| Ð(Ru-N-CCH3), ° | 173.3(7) | 174.01 |
| d(Ru-N), Å | 2.056(7) | 1.938 |
| d(Ru-Cl), Å | 2.353(2) 2.363(2) 2.314(2) |
2.356 2.349 2.336 |
| d(Ru-N(L)), Å | 2.054(7) 2.037(6) (trans) |
2.079 2.100 (trans) |
*The data were taken from CCDC code ZACLUK.
Disclaimer/Publisher’s Note: The statements, opinions and data contained in all publications are solely those of the individual author(s) and contributor(s) and not of MDPI and/or the editor(s). MDPI and/or the editor(s) disclaim responsibility for any injury to people or property resulting from any ideas, methods, instructions or products referred to in the content. |
© 2026 by the authors. Licensee MDPI, Basel, Switzerland. This article is an open access article distributed under the terms and conditions of the Creative Commons Attribution (CC BY) license (http://creativecommons.org/licenses/by/4.0/).
Copyright: This open access article is published under a Creative Commons CC BY 4.0 license, which permit the free download, distribution, and reuse, provided that the author and preprint are cited in any reuse.


