
Submitted:
01 July 2026
Posted:
03 July 2026
You are already at the latest version
Abstract
Accurate characterization of surface ultraviolet (UV) irradiance is important for public health, environmental monitoring, and atmospheric chemistry. However, this remains challenging in regions of complex terrain where atmospheric and surface heterogeneity introduce significant uncertainty. Radiative transfer (RT) models provide physically rigorous simulations but can be limited by simplified or climatological input parameters, while satellite-derived UV products offer broad spatial coverage but can exhibit some systematic biases in heterogeneous environments. This study develops and validates a multi-sensor satellite-integrated framework that combines MODIS-derived aerosol optical depth with TROPOMI-derived ozone and nitrogen dioxide within the Tropospheric Ultraviolet and Visible (TUV) radiative transfer model. The methodology is applied to three mountainous sites in the southwestern United States and evaluated under clear-sky conditions using high-resolution UV-MFRSR measurements at 332 nm and 368 nm. Results demonstrate strong agreement between modeled and observed irradiance across all sites, with coefficients of determination exceeding 0.97 and normalized RMSE generally below 6%. Model performance was consistently higher at 332 nm, while a small systematic underestimation was observed at 368 nm. The framework improves the representation of atmospheric variability and enhances irradiance prediction accuracy in complex terrain, demonstrating a scalable and accessible approach for data-sparse regions.
Keywords:
surface ultraviolet irradiance
; radiative transfer modeling
; TUV model
; MODIS aerosol optical depth
; TROPOMI ozone and nitrogen dioxide
; multi-sensor satellite integration
; mountainous terrain
1. Introduction
The ability to precisely measure surface irradiance, especially in the ultraviolet (UV) spectrum, is essential across many scientific fields and societal uses. This is partly because UV radiation drives all tropospheric photochemical processes [1,2]. It is also known that UV radiation can harm living organisms, including humans [3]. For instance, UV radiation is a major factor in the development of skin cancer and cataracts. UV radiation can weaken the human immune system and impact crop yields and phytoplankton activity. Therefore, accurate measurements and reliable modeling of surface UV irradiance are vital for public health evaluations, agricultural planning, and environmental monitoring.
The region where the UV radiation under consideration is incident also affects how measurements are made and how models are used. A complex region like the mountainous American Southwest is characterized by arid and semi-arid climates, high altitudes, and unique meteorological dynamics driven by its high elevation. This region is also distinguished by fluctuating aerosol loads, which are often influenced by wildfires and dust transport events [4,5]. These features lead to localized atmospheric dynamics that introduce strong spatial and temporal heterogeneity, such as microclimates, which are not well captured by climatological inputs or sparsely distributed ground-based measurements. Thus, generalized models can be less effective in this region. Furthermore, the implementation and use of more sophisticated instruments in such landscapes is not always feasible. There is, then, a need for a capable framework to address these complexities and increase the capacity to accurately model irradiances, which is paramount to providing trustworthy data for regional studies and applications. This research addresses this need by developing and evaluating a methodology specifically tailored for the described challenging topographical domain.
The Tropospheric Ultraviolet and Visible (TUV) radiation model, developed by Sasha Madronich, is widely well recognized and used to calculate spectral irradiance across the UV and Visible ranges [1,6]. This model can account for the effects of clouds and aerosols by integrating satellite-based observations. The TUV model’s capability to incorporate these variables makes it a foundational component for many atmospheric radiation studies.
The advent of advanced remote sensing technologies has revolutionized atmospheric studies by providing comprehensive, spatially resolved data. MODIS (Moderate Resolution Imaging Spectroradiometer) Products, derived from both Terra and Aqua platforms, offer a suite of critical atmospheric parameters. These include detailed information on aerosol type, optical thickness, and particle size distribution (Aerosol Products: MOD04_L2, MOD04_3K), providing a robust dataset for atmospheric characterization. These products provide crucial inputs for characterizing the atmospheric column in radiative transfer (RT) calculations, most notably the aerosol optical depth (AOD) [7,8]. Complementing MODIS, the TROPOMI (Tropospheric Monitoring Instrument) on the Sentinel-5P satellite provides high-resolution data products relevant to atmospheric composition and properties. These include the total column ozone (TCO) and the total column nitrogen dioxide (NO₂), among others. TROPOMI’s Level 2 products, often derived using techniques like Differential Optical Absorption Spectroscopy (DOAS) and optimal estimation, offer enhanced spatial and temporal resolution for characterizing the atmospheric state, particularly for trace gases and aerosols that significantly influence UV radiation [9,10,11].
The input parameters for the TUV model included values for AOD, NO₂, and TCO. As described by Corr (2008), AOD quantifies the extinction of solar radiation from aerosols. High AOD reduces UV irradiance reaching the surface, especially at shorter UV-B wavelengths, through both scattering and absorption. The degree of impact depends on particle size and composition; scattering aerosols may enhance or reduce surface UV depending on solar zenith angle, while absorbing aerosols consistently lower surface UV radiation by removing energy from the system [12]. NO₂ is critical in photochemistry and UV absorption. It efficiently absorbs UV-A radiation, particularly around 400 nm, and undergoes photolysis to produce ozone (O₃) at the surface. Changes in NO₂ concentrations directly influence the photolysis rates of other atmospheric species and, hence, UV-driven chemical reactions [12]. O₃ is a strong UV absorber, especially in the UV-C and UV-B regions. It attenuates UV radiation before it reaches the surface, shielding living organisms from harmful effects. O₃ photolysis is also a major source of hydroxyl radicals (OH), which drive many of the atmosphere’s oxidative processes. Variations in O₃ levels critically influence the vertical distribution of UV radiation and photolysis rates [12,13].
For ground-truth validation, established networks like the USDA UV-B Monitoring and Research Program (UVMRP) provide valuable long-term data. Based at Colorado State University in Fort Collins, UVMRP manages a nationwide network of solar irradiance monitoring stations, offering high-quality UV-B data freely available online. This network provides primary measurements, including UV spectral irradiance (300-368 nm) and UV erythemal irradiance (280-320 nm), along with derived metrics such as AOD (at 332 nm and 368 nm) and TCO [5,9]. The presence of such dedicated, long-term ground-based monitoring within the study area provides reliable baseline data for rigorous validation, significantly enhancing the credibility of any claims regarding methodological effectiveness. This facilitates direct comparison between modeled values and local measurements, improving the overall reliability of the assessment [14].
Despite the demonstrated capabilities of satellite-derived products and RT models, achieving high accuracy in complex and heterogeneous terrains remains a challenge for UV irradiance characterization. Validation studies of satellite-derived UV products, such as those from the Tropospheric Monitoring Instrument (TROPOMI), done by Lakkal et al. (2020), show that while agreement with ground-based measurements is typically within ±10–20% under uniform conditions, discrepancies can exceed 30% in mountainous or heterogeneous environments due to limitations in representing surface albedo, elevation variability, and sub-pixel spatial heterogeneity. Part of the reason for these errors is that these satellite UV retrieval algorithms rely on spatial averaging and simplified RT assumptions, which become less valid in regions with strong local gradients in atmospheric and surface properties [9,15].
Along with surface complexity, mountainous terrain, such as that in the Southwestern United States, exhibits much higher atmospheric variability because elevation gradients, turbulence, dust transport, and localized emissions introduce strong spatial and temporal heterogeneity that further complicates UV irradiance modeling. Surface UV radiation is highly sensitive to aerosol loading, ozone concentration, and trace gas absorption, with studies showing that variations in aerosol properties alone can modify surface UV irradiance by 30–40% [16].
Existing approaches to surface ultraviolet (UV) irradiance estimation generally fall into two categories, each with notable limitations. RT models such as TUV are often driven using climatological or generalized input parameters, which can limit accuracy in regions with rapidly changing atmospheric conditions [17]. TUV also has the capability to use your own input values obtained using instrument data. Conversely, satellite-derived UV products provide global coverage but may exhibit systematic biases due to assumptions embedded in retrieval algorithms and limited representation of local-scale variability [9,10,11,12,13,14,15]. While there have been studies that have shown utility in incorporating satellite-derived atmospheric products into modeling frameworks, these approaches tend to limit the satellite instruments and parameters selected [16]. Likewise, multi-sensor approaches demonstrate improved representation of atmospheric variability, yet they rely on ground-based instrument networks for atmospheric products and are largely applied to retrieval rather than directly to irradiance modeling frameworks [8,18].
The novelty of this work lies in three key aspects: Multi-sensor atmospheric data integration within the TUV model, application and validation in complex mountainous terrain, and development of a reproducible accurate technique within a low-cost modeling framework. Unlike many previous studies that rely on single-sensor inputs or climatological assumptions, this framework simultaneously assimilates satellite-derived AOD, total column ozone, and NO₂ into a unified RT modeling workflow utilizing the TUV model, enabling a more complete representation of atmospheric attenuation processes. The methodology is also specifically evaluated in the heterogeneous environments of the southwestern United States, where strong variability in elevation, aerosols, and atmospheric composition presents a rigorous test for UV irradiance modeling. Furthermore, direct validation against high-resolution UV-MFRSR observations demonstrates the framework’s ability to maintain high accuracy under these challenging conditions. Lastly, the approach is designed to be computationally efficient and operationally accessible, relying entirely on publicly available satellite data and open-source modeling tools. This makes it scalable and transferable to other regions lacking dense ground-based observational networks. Together, these contributions establish and prove to be a practical pathway for improving site-specific UV irradiance modeling by leveraging modern satellite observations within a physically consistent RT framework.
Following from this framework, the primary goal of this study is to verify a proposed methodology that uses satellite-derived atmospheric data to drive irradiance simulations made by the TUV model to simulate UV irradiance in mountainous regions of the Southwest United States. By integrating multi-sensor satellite-derived atmospheric inputs, including AOD, total NO₂ column, and total column O₃, from MODIS and TROPOMI instruments, the model’s location and time parameters were tailored to local conditions for several test sites and evaluated against UV-MFRSR ground-based irradiance measurements made in those same locations and corresponding times. This work aims to quantify the agreement between modeled and observed spectral irradiance at three distinct mountainous locations to inform the utility and limitations of multi-sensor satellite data in the TUV modeling framework for complex mountainous environments. In contrast to approaches relying on simplified satellite UV products or incomplete atmospheric inputs, this framework provides a fully integrated, validated, and operationally accessible solution for generating high-accuracy UV irradiance results in complex terrain.
Based on this objective, the following hypotheses are proposed:
- The integration of multiple satellite sensor data from MODIS and TROPOMI will provide a comprehensive and accurate characterization of atmospheric parameters, as shown in the precision of the UV irradiances these products generate when compared to ground-based measurements.
- The proposed methodology, by assimilating these diverse atmospheric inputs into the TUV radiative transfer model, will significantly improve the ability to generate more accurate UV irradiance data in challenging mountainous regions.
2. Materials and Methods
The framework employed in this study is outlined in Figure 1 and follows a basic procedure for extracting and processing satellite instrument data for the TUV radiative transfer model to simulate specific atmospheric conditions at each location and to retrieve the MFRSR-measured irradiances for a proper validation test. The approach includes five primary components: input parameters, satellite and ground instrument data products, source codes for data extraction and irradiance modeling, irradiance output values, and direct model-measurement comparisons. This structured workflow enabled a systematic investigation of how key geographic and atmospheric constituents influence surface irradiances.
2.1. Input Parameters: Ground Sites and Case Study Periods
Three distinct locations were selected to best represent the diverse types of complex environments found in the mountains of the Southwest Region. The choice of locations for the study needed to include ground-based irradiance instruments for proper validation and be sufficiently representative to support a reliable study for many locations that lack such instrumentation, which would benefit from this methodology. For these reasons, the locations were chosen among the UVMRP station network to include El Paso, TX; Flagstaff, AZ; and Logan, UT. These three locations are all high mountain terrains. El Paso is in the Chihuahuan Desert, which makes it subject to frequent dust transport events and to the highest temperatures among the three locations. Flagstaff is at the highest elevation on the Colorado Plateau. While considered a high-elevation desert, it has large forests and experiences all four seasons. Similarly, Logan is closer to an alpine environment and is uniquely furthest north in latitude.
Time windows for the study were chosen during periods with clear, consistent skies to maximize focus on specific absorbing and scattering variables rather than the interference of cloud cover. This was done by using meteorological history to select irradiance graphs from the UVMRP site that showed smooth bell curves with minimal irregularities, indicating consistently clear skies. While a single three-day period did not meet these criteria for all three locations, proximity of the chosen dates was prioritized. The final dates chosen were all in 2024. Specifically: March 18-20 for Logan, UT; May 26-28 for El Paso, TX; and May 28-30, 2024, for Flagstaff, AZ.
2.2. Satellite Products and Data Processing
The satellite and TUV model integration framework relies on a comprehensive set of atmospheric parameters derived from multiple satellite platforms to characterize the atmospheric column over each location. Table 1 gives a detailed overview of the specifications for the following satellite instrumentation and products.
MODIS Atmosphere Products from both the Terra and Aqua platforms were used extensively for AOD. The specific products selected for their relevance to irradiance calculations include:
- Aerosol Product (MOD04_L2, MOD04_3K): Provides aerosol optical thickness, particle size distribution, and aerosol type. This is critical for accounting for scattering and absorption by atmospheric particulates.
- TROPOMI Data Products from the Sentinel-5P satellite incorporated NO₂ and O₃ to enhance the spatial and temporal resolution of key atmospheric parameters. These include:
- TCO and O Profile: Retrieved using DOAS-style algorithms and optimal estimation, providing vertical O3 distribution, which is crucial for UV attenuation [11].
- Nitrogen Dioxide Total and Tropospheric Columns: Derived through DOAS-based slant column retrieval and data assimilation, providing critical insights for anthropogenic pollution monitoring and air quality management [11].
Python scripts were developed by NASA to process satellite data files obtained from the MODIS and TROPOMI instruments. These scripts were used to parse the downloaded files, extract the respective atmospheric parameters, and compute spatial averages centered on each region of interest. Each was modified to automate the process for multiple days of data and to format the outputs into a separate text file for compatibility with the TUV model.
2.3. Sensitivity Analysis
To better understand the effect of these products on the TUV radiative transfer model, tests were performed individually on each product, as shown in Section 3.1 of the results. This was done by fixing all the input parameters except the product of interest. The variable’s total span was determined, and the model would iterate over 500 subintervals over that range, starting at zero and increasing incrementally until it reached the maximum value. Outputs generate expected irradiance values at each wavelength (332 nm and 368 nm) over a 15-hour diurnal cycle, highlighting changes in irradiance across contrasting times of day as each variable changes. These values are plotted in a contour plot to show the expected irradiance reaching the surface as the parameter changes over the course of a day.
We would expect that each contour plot at a given wavelength would show attenuation of total irradiance as the amount of product increased at all times of day [6,8]. It would also be expected that total irradiance would attenuate more at higher zenith angles, as more atmosphere lies between the surface and the sun as the sun approaches the horizon. This would be shown by early morning and late afternoon columns crossing more contour lines on the contour plot, and the midday irradiance peak would have the furthest space between lines. While general attenuation should apply to all three data products, the test will help indicate which product (s) are the largest contributors to the change in irradiance in the model.
2.4. Validation Data and Quality Control
The types of UVMRP data utilized for validation include UV spectral irradiance (300-368 nm wavelengths). These UV-MFRSRs record data across seven UV wavelengths (300, 305, 311, 317, 325, 332, and 368 nm) every three minutes. This high-resolution spectral irradiance data serves as the observational benchmark for comparing TUV model outputs.
Since the validation approach consisted of a direct, point-to-point comparison of the generated irradiance values with the ground-truth data from the UVMRP stations, the geographical coordinates, elevation, and timestamps of the UVMRP measurement data files were the same input parameters used to select satellite data files and as inputs to the TUV model.
2.5. TUV Model Configuration and Modification
The Tropospheric Ultraviolet and Visible (TUV) radiation model is a one dimensional, plane-parallel RT model that is used to calculate spectral actinic fluxes, spectral irradiances, and photolysis rate coefficients in the troposphere. Through proper output options in the TUV, we have selected to retrieve downwelling spectral irradiance on a horizontal surface (like the quantity that is measured by the UV-MFRSRs in this study) in order to be concise in our orthogonal technology validation. Solving the monochromatic one dimensional, plane-parallel radiative transfer equation (RTE) is the basis of the TUV model [1the change in spectral radiance I(τ,μ) along a vertical path as a function of optical depth τ and the direction cosine μ=cosθ (where θ is the zenith angle) is expressed as:
where J(τ, μ) is the source function that combines the contribution of scattered diffuse radiation from all directions with the attenuated direct solar beam. The primary solver options for this equation are the two-stream approximation and the Discrete-ordinate method (DISORT). The two-stream approximation is an efficient and swift method that reduces the angular integrals to an upward and a downward representative stream, making it less accurate for cases of strong asymmetry and large solar zenith angles (SZA > 70°). The DISORT method is both recommend and the default TUV solver in spectral irradiance applications. It provides stable multiple-scattering solutions for layered atmospheres and allows direct insertion of satellite-retrieved AOD, TCO and NO₂ as column or layer inputs and preserves the physical coupling between scattering and absorption that controls UV attenuation and photolysis rates.
A critical aspect of data selection was the wavelengths at which irradiance was measured. The specific wavelengths used for AOD measurements include 332 nm and 368 nm. These are the two longest wavelengths used by the UV-MFRSRs in the UVMRP network and were strategically chosen for their behavior within the Earth’s atmosphere. Above 330 nm, the spectral structure of solar intensity compares favorably with the extraterrestrial spectrum, making measurements more reliable and less susceptible to the extreme precision requirements (e.g., within 0.1 nm wavelength calibration) necessary for wavelengths below 330 nm, where solar intensity can vary by orders of magnitude over short spectral ranges. This selection leverages the concept of atmospheric windows, regions of the electromagnetic spectrum where light passes through the atmosphere with minimal hindrance. The choice of 332 nm and 368 nm for aerosol property retrievals is thus a deliberate methodological decision to optimize data quality by operating in spectral regions where measurements are more robust and less prone to significant absorption by other atmospheric constituents, especially O₃. This choice directly impacts the accuracy of the input data for irradiance modeling.
Inputs beyond the geographic position, time windows, atmospheric parameters, and wavelengths of interest were left at default values. Then, to streamline the simulation of irradiance over extended periods, the original Fortran 77 source code of the TUV model was modified. A custom wrapper routine was developed to read file lists containing date-specific input parameters (e.g., AOD, O₃, NO₂) and to execute the model iteratively over 72 hours at three-minute intervals to align with the UV-MFRSR recording intervals. Since the model can properly process up to 101 steps, the routine was modified to iterate over 4-hour segments, which have only 80 three-minute steps. This iterative loop progressed through each of the 24 hours of each date until the entire period was completed. The grid subroutine was also modified to create a custom wavelength grid in the output containing only 332 nm and 368 nm wavelengths. This batch-processing approach allowed the model to automatically process and simulate irradiance for the entire time span, reducing manual intervention and ensuring consistent integration of satellite-derived data.
To justify the use of the TUV model, specifically, for the framework developed on this work, it will be instructive to compare systematically the two widely used RT models referenced in the UV irradiance and atmospheric modeling literature: TUV itself in a conventional climatological-input configuration, and the Santa Barbara DISORT Atmospheric Radiative Transfer (SBDART) model. Both TUV and SBDART share important architectural features and are built on the DISORT algorithm of Stamnes et al. (1988) [19]. They also each accept user-specified aerosol optical depth and require surface albedo as a lower boundary condition, and both have been extensively validated against ground-based irradiance and radiometric measurements across a wide range of environmental conditions [20,21]. However, there are notable differences in spectral focus and gas absorption aspects of the two models. The SBDART mainly supports broadband VIS–IR band models, which are less applicable to this study and the UV–visible high spectral resolution calculations offered with the TUV model [1,20] is ideal for this study. Also, the SBDART uses LOWTRAN band models and internal cloud/aerosol parameterizations, which make it convenient for broadband energy-budget and remote-sensing sensitivity studies, but with lower native spectral resolution in some gas bands [22]. Since the sensitivity and custom input of gasses O₃ and NO₂ are key to the methodology, this is another reason for the use of the TUV model.
The most common deployment of the TUV model for trace gas concentrations is driven by standard atmosphere profiles such as the US Standard Atmosphere (1976) or pre-defined mid-latitude summer/winter profiles, which is computationally straightforward and widely used for photolysis rate calculations and climatological UV assessments [1,17]. Whereas the deployment in this methodology uses dynamic injection of satellite-observed values for AOD, TCO, and NO₂ in order to better capture the day-to-day variability in aerosol loading, ozone column, or trace-gas concentrations that is especially pronounced in complex terrain like the southwestern United States. Studies such as Lamy et al. (2019) demonstrated that clear-sky UV radiation modeled with chemistry-climate model outputs can systematically deviate from observations when the atmospheric inputs are not constrained by coincident measurements, with uncertainties in aerosol and ozone inputs being the dominant error sources in the UV-A [17].
2.6. Evaluation Metrics
To quantitatively assess the effectiveness of the generated irradiance values against ground-based reference data, a suite of widely accepted statistical metrics was employed. The metrics utilized are Root Mean Square Error (RMSE), Mean Absolute Error (MAE), Mean Bias Error (MBE), and Coefficient of Determination (R²). Using a combination of these metrics provides a more comprehensive and nuanced assessment of model performance.
A custom Python script, created with the aid of generative artificial intelligence, was used to compute error metrics and generate the figures used in this study. This script synchronizes modeled and measured data from each location and compares the values at each time step to compute error metrics for each location and wavelength. This multi-metric approach allows for a holistic understanding of the methodology’s strengths and weaknesses, offering deeper insights than any single metric alone. For instance, a high R² with a high RMSE might indicate good tracking but poor absolute accuracy, and a nonzero Mean Bias Error (MBE) would indicate systematic over- or underprediction.
To contextualize the performance of the proposed multi-sensor integration framework, it is important to consider how the TUV model would perform under simplified or conventional input configurations. RT simulations are highly sensitive to atmospheric inputs, and previous studies have shown that using climatological or single-source inputs can introduce systematic biases in irradiance estimates [8,15,17,21]. While the primary focus of this study is on validating the integrated satellite-driven framework against ground-based observations, the methodology is implicitly benchmarked against these conventional approaches by using dynamically varying, observation-constrained inputs. The high agreement observed between modeled and measured irradiance values, therefore, reflects the added value of incorporating multi-sensor satellite data, which improves representation of atmospheric variability relative to static or incomplete input parameterizations. Future work should include explicit intercomparisons with baseline configurations—such as climatological inputs or single-sensor forcing—to quantify the incremental performance gains attributable to multi-sensor integration.
3. Results
3.1. Results of Sensitivity Analysis
These are the findings from a comprehensive sensitivity analysis investigating the impact of varying atmospheric constituents—AOD, Total O3 column, and Total NO₂ column—on the Total Spectral Irradiance at the surface. The analysis considers two distinct ultraviolet wavelengths, 332 nm and 368 nm, over a typical diurnal cycle from 6:00 to 21:00 hours local time (UTC-6) for a representative location in the Southwest. The results highlight the wavelength-dependent attenuation properties of each constituent and their diurnal variability.
3.1.1. Sensitivity to Aerosol Optical Depth
The first analysis examines how changes in AOD, ranging from 0 to 1, affect irradiance at both wavelengths across the diurnal cycle. Figure 2 illustrates a clear diurnal pattern at both wavelengths, characterized by peak irradiance occurring around local solar noon, typically between 13:00 and 14:00 hours, irrespective of AOD. Irradiance values are symmetrically lower in the early morning (6:00-8:00 hours) and late afternoon (18:00-20:00 hours).
An increase in AOD consistently leads to a discernible decrease in total spectral irradiance at both studied wavelengths. For instance, at 13:00 hours, the irradiance at 332 nm decreases from approximately 0.67W/(m^2∙nm) at zero AOD to below 0.53 W/(m^2∙nm) as AOD approaches one. Similarly, at 368 nm, irradiance decreases from approximately 0.84 W/(m^2∙nm) to about 0.68 W/(m^2∙nm) as AOD increases from 0 to 1. Across the full AOD range, the relative reduction is substantial and is approximately equal at both wavelengths. The contour lines indicate a relatively uniform attenuation effect across the AOD range, suggesting a consistent scattering and absorption mechanism.
3.1.2. Sensitivity to TCO (DU)
The impact of varying TCO (DU) on total spectral irradiance is presented in Figure 3. This analysis examines how changes in O₃ levels, ranging from 0 to 500 Dobson Units (DU), influence irradiance at each wavelength of interest throughout the diurnal cycle.
As in the AOD analysis, both wavelengths exhibit a clear diurnal pattern, with peak irradiance around local solar noon (13:00-14:00 hours) and lower values in the early morning and late afternoon. This is consistent with solar geometry and variations in atmospheric path length.
An increase in TCO results in a significant decrease in total spectral irradiance, particularly at 332 nm. For instance, at 13:00 hours, the irradiance at 332 nm drops from approximately 0.67W/(m^2∙nm) at 0 DU to about 0.61W/(m^2∙nm) at 500 DU. This substantial reduction highlights O₃’s strong absorption in lower UV wavelengths. In contrast, the effect on irradiance at 368 nm is much less pronounced. While a slight decrease is observed, the 368 nm irradiance only drops from approximately 0.81W/(m^2∙nm) to about 0.80W/(m^2∙nm) at 13:00 hours.
3.1.3. Sensitivity to Total NO₂ Column (DU)
The sensitivity of total spectral irradiance at each wavelength to variations in the Total NO₂ column is illustrated in Figure 4, ranging from 0 to 5 Dobson Units (DU), over the diurnal cycle.
As with AOD and TCO, the diurnal pattern of irradiance remains consistent, peaking around local solar noon (13:00-14:00 hours) and decreasing towards the morning and evening.
An increase in the Total NO₂ column leads to a decrease in total spectral irradiance at both 332 nm and 368 nm. However, the attenuation effect is more noticeable at 368 nm than at 332 nm. For instance, at 13:00 hours, the irradiance at 368 nm decreases from almost 0.807W/(m^2∙nm) at zero DU to 0.799W/(m^2∙nm) at 5 DU.
3.2. Performance of Satellite Data Integrated TUV Irradiance Generation
The framework successfully generated 1440 points of surface irradiance data across all locations for their respective defined periods, as can be seen in Figure 5. The peak irradiances for measured and modeled data from all three sites align and occur consistently just after 12:00 local time. Zero is the lowest possible total irradiance and is thus the minimum value of all data ranges. The range of total irradiances for the tests was similar in the first two locations: El Paso, TX, recording up to 0.649 at 332 nm and 0.895 at 368 nm; then Flagstaff, AZ, up to 0.668 and 0.897 for 332 nm and 368 nm, respectively. While for Logan, UT, these values are 0.507 and 0.717 at 332 nm and 368 nm, respectively.
To better analyze dataset correlations, scatter plots comparing modeled irradiance values with UVMRP ground measurements consistently showed points clustering almost entirely within 10% of the 1:1 line, as shown in Figure 6. The largest deviation in correlation occurs at the peak of irradiance in Logan, UT, at 368 nm, as seen in both Figure 5 and Figure 6. There are also small irregularities in the measured UV irradiance in El Paso, TX, at both wavelengths around 16:00 local time on May 28.
3.3. Statistical Evaluation of Effectiveness
The quantitative assessment of the methodology’s effectiveness was performed using Root Mean Square Error (RMSE), Mean Absolute Error (MAE), R-squared (R²), and Mean Bias Error (MBE). A list of values is found in Table 2, and they are compared in Figure 7. These metrics were calculated for the entire dataset to provide a nuanced understanding of performance. To better compare these values across locations and wavelengths, the RMSE, MAE, and MBE are normalized by scaling each to its respective range, as presented previously. As will be shown, this normalization does not significantly change the trends seen in Figure 7, but it is useful in the discussion since the error scales linearly as observed in the Total Irradiance Scatter Plots. The core of the study’s query, “how effectively” the methodology performs, is directly addressed by these quantitative measures.
As shown in Figure 7 RMSE and MAE exhibit similar trends for the average errors. At 332 nm, Logan showed the lowest errors, and El Paso showed the highest. When normalized, both errors were between 3.6% and 0.86% of their relative maximum in all three locations; Flagstaff had as low as an 0.87% normalized MAE.
At 368 nm, all locations show a notable increase in both RMSE and MAE compared to 332 nm. However, at this higher wavelength, El Paso shows a noticeably lower average error than the other locations, even though it received equally high maximum total irradiance as Flagstaff. While El Paso showed normalized errors in RMSE and MAE of 2.63% and 1.48%, respectively, the other two locations still produced less than 4% errors, except for Logan, which exhibited the highest normalized error of 5.7% NRMSE. Collectively, all locations averaged an NRMSE of 4.3% and NMAE of 2.8%, which are notably higher than those at 332 nm.
R² was used to measure the proportion of variance in the modeled irradiance trend that can be predicted from the actual trend represented by the ground-measured irradiance values. Each of the three test locations demonstrates exceptionally high R² values, approaching 1.0, as seen in Table 2.
At 368 nm, the R² values remain high but slightly decrease compared to 332 nm. Flagstaff and El Paso maintain an R² close to 1.0, while Logan shows an R² slightly below 0.99, almost 0.98.
MBE indicated both positive and negative average biases of the predictions. At 332 nm, Flagstaff and El Paso show positive MBE values of 0.68% and 2.2%, respectively. Conversely, Logan exhibits a negative normalized MBE of -0.87%.
At 368 nm, the MBE values are negative for all locations. Flagstaff and Logan show an increase in magnitude of MBE (NMBE values are -1.96% and -3.53%, respectively), while El Paso decreases noticeably in magnitude with an NMBE of -0.87%.
4. Discussion
4.1. Analysis of Findings from Sensitivity Analysis
While each of the three atmospheric constituents studied displayed similar diurnal patterns, the intensity of the pattern (affected by the constituent’s total value) varied for each. This diurnal pattern is primarily attributed to increased solar zenith angles and longer atmospheric path lengths at these times, which enhance scattering and absorption processes.
The changes in AOD intensity show that while the absolute irradiance is consistently highest at midday, AOD effectiveness in reducing irradiance is amplified at greater solar zenith angles, specifically in the early morning and late afternoon. This is shown at each hour by the relative decrease in irradiance as AOD values increase from zero to one, or by the increased packing of contour lines at these hours in Figure 2. This phenomenon likely occurs because the path length of solar radiation through the atmosphere, and consequently through the aerosol layer, increases significantly as the sun approaches the horizon. A longer atmospheric path provides more opportunities for aerosol scattering and absorption, resulting in a greater overall reduction in received irradiance at a given AOD level. This underscores the importance of considering diurnal variations in atmospheric path length when assessing aerosol radiative forcing.
The substantial reduction in spectral irradiance due to increased AOD, particularly during peak solar times, has direct implications for applications reliant on solar radiation. The observed decrease in irradiance at 332 nm and 368 nm with increasing AOD indicates that aerosols exert a significant, relatively broadband attenuating effect in the UV-A region. This observation aligns with the physics of aerosols, which scatter and absorb solar radiation across a wide range of wavelengths, unlike molecular absorbers, which exhibit sharp spectral features.
The TCO’s ability to reduce irradiance varied significantly across 332-368 nm. This substantial reduction ability highlights O₃’s strong absorption of lower UV wavelengths and is attributed to the fact that 368 nm is higher within the UV-A region. The observed wavelength-dependent attenuation by O₃ is consistent with its known absorption spectrum, which features strong absorption bands in the UV-B and weaker absorption extending into the UV-A. Therefore, even a moderate increase in TCO can drastically reduce UV-B radiation reaching the surface, while UV-A radiation is less affected.
Conversely, the sensitivity analysis indicates that NO₂ exhibits stronger absorption at longer wavelengths, which aligns with its absorption spectrum, which extends from the UV into the visible range, with significant absorption features in the blue and UV-A regions. Thus, the differential absorption by NO₂ at the two wavelengths is consistent with its spectral properties. While NO₂ has the least effect on total irradiance at these wavelengths out of the three atmospheric constituents being assessed, there is noticeable attenuation consistent with expected patterns across the diurnal period.
4.2. Key Findings from Testing the Satellite Data Integrated TUV Methodology
Initial setup and execution of the satellite multi-sensor incorporated TUV model proved highly unsophisticated and easily duplicable. The procurement of a laptop with a Linux operating system to run both Python and Fortran77 scripts and an internet connection was the only necessary hardware access, and this was done without issue. From there, downloading satellite data products for each date and location proved just as simple. Each satellite produced a single data file for a limited time range for each day of interest at each location. For this reason, the average value of that satellite’s measurement period was used as an average for that day in the TUV model.
The maximum spectral irradiance occurred for all three locations at around noon local time (UTC-6). The peak values for all three locations were higher under 368 nm UV radiation than under 332 nm. However, the peak irradiance values also differed by location. Flagstaff and El Paso had nearly identical values, with Flagstaff having marginally higher peak UV irradiance, and Logan had lower total values at both wavelengths. It is to be expected that higher elevations and lower latitudes would both contribute to higher UV spectral irradiance, which are the key distinctions for Flagstaff (the highest elevation) and El Paso (the lowest latitude) amongst the 3 studied locations. While Logan is at a higher elevation than El Paso, it is not as high as Flagstaff and is significantly farther north in latitude than both locations, which helps explain why it would have noticeably lower UV spectral irradiance values.
The performance of this methodology was significantly influenced by the prevailing atmospheric conditions, as expected. The high accuracy seen under clear-sky conditions is largely attributable to the precise characterization of aerosol optical depth and TCO from MODIS and TROPOMI data. However, there was a small deviation from the expected smooth bell curve in the UV-MFRSR data in El Paso, TX, at both wavelengths around 16:00 local time on May 28. Here, irregularities in the measured UV irradiance occurred, likely due to a momentary cloud or debris covering the sensor. The strategic selection of 332 nm and 368 nm wavelengths for aerosol optical depth measurements proved particularly beneficial. These wavelengths fall within atmospheric windows where the spectral structure of solar intensity is relatively stable and compares well with the extraterrestrial spectrum, minimizing uncertainties associated with extreme spectral variations and instrumental precision requirements at shorter UV wavelengths. This choice optimized the quality of the aerosol input data, contributing directly to the accurate irradiance calculations during clear periods. The test results align with previous studies showing that satellite-derived atmospheric parameters can significantly influence UV irradiance estimates when incorporated into RT models [9,16]. Additionally demonstrating the high effectiveness of the developed satellite data integration methodology in accurately capturing atmospheric conditions and generating surface irradiance values across the Southwest.
4.3. Summary of Statistical Evaluation
The model demonstrated high accuracy relative to the measured data across all locations, with RMSE and MAE values within 5% of their respective ranges. At 332 nm, these values indicate remarkably high accuracy, with Flagstaff and Logan being marginally more accurate by both metrics. An increase in variability or systematic deviation in the model’s performance at 368 nm is noticeable relative to the shorter wavelength.
This indicated that the model effectively captured the variance in the measured data, with performance consistent across locations and wavelengths, underscoring the model’s ability to explain nearly all variability at these wavelengths. This is especially evident at 332 nm and indicates that the model explains nearly all the variability in the total spectral irradiance across all locations, suggesting a strong linear relationship between predicted and observed values and an excellent model fit at that wavelength. Although still indicative of a strong fit, the minor reduction at 368 nm, particularly for Logan, aligns with the increased RMSE and MAE values, suggesting a slight reduction in the model’s explanatory power at this increased wavelength.
The MBE values at 332 nm are relatively small, suggesting that any systematic bias there is minimal. The negative MBE values at 368 nm indicate that the model consistently underestimates total spectral irradiance at this wavelength across all locations, with the underestimation more pronounced in Logan, UT. While the biases at 368 nm are only marginally greater in average magnitude than those at 332 nm, the general underestimating tendency across both wavelengths is a key finding. The tendency for a negative bias at a longer wavelength is not surprising when considering the results of TCO’s effect on modeled surface irradiance at longer wavelengths in the Sensitivity Analysis. That test showed that at 368 nm, total surface irradiance is much more sensitive to aerosol absorption than to ozone absorption, because ozone attenuation is weak in the upper UV-A. Aerosol absorption is parameterized primarily by AOD, but is also influenced by single-scattering albedo (SSA). Then, at 368 nm, even though TROPOMI ozone retrievals are accurate, their residual uncertainty no longer offsets other conservative assumptions (i.e., SSA inputs remaining at default values), resulting in net underestimation. However, the observed negative bias remains within a minor margin throughout the analysis despite its consistent trend.
Overall, the statistical evaluation shows that the model performs well for each wavelength across all locations. The observed magnitude of model-measurement differences is notably lower than the uncertainties typically reported for satellite-derived UV products [9]. The performance is exceptionally good at 332 nm, characterized by the lowest RMSE and MAE and exceedingly high R² values. At 368 nm, the R² values remain high, while there is a slight, measured increase in RMSE and MAE, along with a consistent negative bias (underestimation), especially noticeable in Logan. This indicates that the model maintains reliable accuracy and effectively captures overall trends at 368 nm, although systematic discrepancies result in small underpredictions relative to 332 nm. The rise in all error metrics at the higher wavelength, where the maximum irradiance is greater, supports the visual trend that error scales linearly with total irradiance, as observed in both Figure 5 and Figure 6. However, Logan’s maximum values were lower than those of the other two locations for both wavelengths, yet Logan still exhibited the largest normalized errors more often than the other sites. This may suggest that errors are more related to wavelength than to the range of total irradiances; future model improvement studies should focus on confirming and addressing these hypotheses and observations.
4.4. Implications for Research and Applications
The findings of this study have significant implications for both atmospheric research and a range of practical applications. The demonstrated ability to accurately generate surface irradiance values in an environmentally complex region like the Southwest, without costly or time-consuming resources, provides a valuable dataset for various scientific investigations. This includes improving regional climate models, enhancing our understanding of atmospheric chemistry and photolysis rates, and supporting studies on the long-term trends of UV radiation in response to climate change and ozone layer recovery. Beyond fundamental research, the accuracy of irradiance data generated by this framework has direct utility for a range of applied fields, including agriculture, public health, and renewable energy.
The methodology’s minimal setup and modular design are key to this study’s utility. These features facilitate broader use and implementation of irradiance data modeling, especially in areas and communities where more elaborate, high-commitment setups are not feasible. They also suggest its potential for adaptation and scaling to other topographically complex regions globally. Future work could explore integrating additional satellite sensors or remotely accessible networks to further refine input parameters, particularly for cloud characterization. Continual study could also focus on incorporating additional wavelengths, including the Visible range of light. The framework also provides a foundation for developing operational irradiance forecasting systems, which could deliver near-real-time data for critical applications.
5. Conclusions
This study presents a satellite-driven framework designed to address known limitations in surface UV irradiance modeling in complex terrain. By integrating MODIS aerosol optical depth and TROPOMI-derived total column ozone and NO₂ into the TUV radiative transfer model, this approach leveraged the satellite spatial coverage with the physical rigor and local accuracy of RT models to obtain more accurate surface ultraviolet irradiance in the complex mountainous terrain of the southwestern United States. The results address the known limitations of both traditional radiative transfer approaches and approaches that rely solely on satellites. Satellite-derived UV products, while spatially comprehensive, are known to exhibit increased uncertainty in heterogeneous terrain due to simplified assumptions and spatial averaging, whereas RT models driven by climatological inputs often fail to capture local atmospheric variability. Strong agreement was observed, demonstrating that direct integration of multi-sensor satellite observations into the TUV radiative transfer model substantially improves the representation of atmospheric and surface conditions.
This approach addresses another key limitation in regional UV modeling, namely the relative inaccessibility of high-quality irradiance simulation in topographically and atmospherically heterogeneous environments. The framework’s ability to maintain high accuracy across multiple mountainous sites demonstrates its robustness under conditions in which both satellite retrievals and simplified models are known to perform poorly. The results, therefore, confirm that improved representation of atmospheric heterogeneity is essential for accurate UV irradiance modeling in such regions.
Model evaluation against UV-MFRSR measurements at three geographically distinct sites demonstrates consistently strong performance under clear-sky conditions. Coefficients of determination exceeded 0.99 in all but one case (>0.976), while normalized RMSE values were generally below ~6%. These indicate both strong agreement and low absolute error. Accuracy was higher at 332 nm than at 368 nm, where a systematic negative bias was observed across all locations. This wavelength-dependent discrepancy is consistent with the differing sensitivities of UV irradiance to ozone and aerosol properties, suggesting increased uncertainty in representing aerosol absorption processes at longer UV-A wavelengths.
The sensitivity analysis supports the framework’s physical robustness by confirming expected radiative behaviors: aerosol optical depth produces broadband attenuation, ozone strongly influences shorter UV wavelengths, and NO₂ contributes comparatively weaker but spectrally dependent absorption. These findings support both study hypotheses, demonstrating that (1) multi-sensor satellite integration provides an adequate representation of key atmospheric constituents and (2) incorporation of these parameters into TUV enables accurate irradiance prediction in complex terrain with limited instrumentation.
The primary contribution of this work lies in its demonstration that simultaneous integration of multiple satellite-derived atmospheric constituents within an RT framework yields measurable improvements in UV irradiance prediction relative to conventional input approaches, and that such a methodology is critical for the accurate modeling of surface and atmospheric conditions in complex and heterogeneous terrains. Additionally, the framework is computationally lightweight, easily reproducible, and scalable, which makes it a practical tool for extending irradiance prediction capabilities to data-sparse regions. This has direct relevance for applications in atmospheric chemistry, public health risk assessment, agricultural modeling, and solar radiation studies.
Despite these strengths, a few limitations remain. The analysis is restricted to clear-sky conditions and does not account for cloud variability, which represents a major source of uncertainty in surface irradiance. Additionally, the use of single daily value satellite inputs and simplified aerosol optical properties (e.g., single-scattering albedo) may reduce sensitivity to short-term atmospheric variability and likely contributed to the observed negative bias at 368 nm. Finally, the evaluation was limited to two wavelengths, constraining broader spectral interpretation.
Future work should include explicit benchmarking against baseline configurations, such as climatological and single-sensor forcing scenarios, to further quantify the performance gains attributable to multi-sensor integration. A focus on incorporating cloud property retrievals and higher-temporal-resolution satellite products would also be useful for quantifying and improving model responsiveness to rapidly changing atmospheric conditions. Studies should test the reduction in systematic bias with the refinement of aerosol parameterization, particularly by including satellite-constrained single-scattering albedo, or by expanding the framework to additional UV and visible wavelengths to enhance its applicability to photochemical and climate studies. Continued validation across a wider range of geographic regions and atmospheric conditions will also be necessary to assess generalizability and to support the development of operational or near-real-time irradiance prediction systems.
Overall, this study demonstrates that multi-sensor satellite integration within an RT modeling framework provides a robust, scalable, and physically consistent solution for improving UV irradiance modeling in complex environments where existing approaches show significant limitations and where access to ground-based technologies is lacking.
Author Contributions
Conceptualization, R.M.; methodology, R.M., R.F.,N.T; software, N.T.; validation, N.T.; formal analysis, N.T.; investigation, N.T.; resources, N.T. and R.M. and R.F.; data curation, N.T.; writing—original draft preparation, N.T.; writing—review and editing, N.T. and R.M. and R.F.; visualization, N.T.; supervision, R.M. and R.F.; project administration, R.M. and R.F.; funding acquisition, N.T. and R.M. and R.F. All authors have read and agreed to the published version of the manuscript.
Funding
This research is supported by the U.S. Department of Commerce, National Oceanic and Atmospheric Administration, Educational Partnership Program under Agreement No. NA22SEC4810015. Also, this research was supported by the Gibson & Skaggs Undergraduate Research Committee under the Walter Maxwell Gibson Endowment. The authors express gratitude to the Gerald R. Sherratt Library for procuring supplies through the CONNECT grant.
Institutional Review Board Statement
Not applicable.
Informed Consent Statement
Not applicable.
Data Availability Statement
All UV-MFRSR data is available for download through the UVMRP via Colorado State University at https://uvb.nrel.colostate.edu/UVB/. The source code for the TUV Radiation Model is publicly available through NCAR at https://www2.acom.ucar.edu/modeling/tuv-download. The MODIS data were downloaded via LAADS DAAC: https://ladsweb.modaps.eosdis.nasa.gov/search/order/3/MOD04_3K--61,MOD04_L2--61, and the TROPOMI data were downloaded via Copernicus Browser: https://browser.dataspace.copernicus.eu/?zoom=4&lat=40.00883&lng=-104.50195&themeId=DEFAULT-THEME&visualizationUrl=U2FsdGVkX1%2FEyJOrWX%2ByXoN2AmuYVYy5rWS%2BD%2F9%2FaWxLM%2BhyGo7s8vSLq5KHV6qCWRH3wAVf2oEwqYyujI5T4asjPxw8QcY%2BBvc2KH%2BcdedO0WruK8d1DULgcUEuKHT&datasetId=S2_L2A_CDAS.
Acknowledgments
We thank the UTEP Physics Department, the Abyss station at Grand Canyon National Park, and the Utah Climate Center for the use of instruments and data as part of the UVMRP network. We also thank the NCAS-M Center for supporting this research. During the preparation of this manuscript/study, the authors used Claude (an AI-assisted language model developed by Anthropic) to support in drafting Python code, and Microsoft Copilot and Google Gemini (AI language models) to assist with drafting, citation research, and refining portions of the manuscript. The authors have reviewed and edited the output and take full responsibility for the content of this publication.
Conflicts of Interest
The authors declare no conflicts of interest.
Abbreviations
The following abbreviations are used in this manuscript:
| AOD | Aerosol Optical Depth |
| DOAS | Differential Optical Absorption Spectroscopy |
| DU | Dobson Unit |
| MAE | Mean Absolute Error |
| MBE | Mean Bias Error |
| MFRSR | Multi-Filter Rotating Shadowband Radiometer |
| MODIS | Moderate Resolution Imaging Spectroradiometer |
| NMAE | Normalized Mean Absolute Error |
| NMBE | Normalized Mean Bias Error |
| NRMSE | Normalized Root Mean Square Error |
| NO₂ | Nitrogen Dioxide |
| O₃ | Ozone |
| R² | Coefficient of Determination |
| RMSE | Root Mean Square Error |
| SSA | Single-Scattering Albedo |
| TCO | Total Column Ozone |
| TROPOMI | Tropospheric Monitoring Instrument |
References
- Madronich, S. The atmosphere and UV-B radiation at ground level. In Environmental UV Photobiology; Young, A.R., Björn, L.O., Moan, J., Nultsch, W., Eds.; Plenum Press: New York, NY, USA, 1993; pp. 1–39. [Google Scholar]
- Karle, N.N.; et al. Investigation of the Successive Ozone Episodes in the El Paso–Juarez Region in the Summer of 2017. Atmosphere 2020. [Google Scholar] [CrossRef]
- Ultraviolet Radiation and Human Health; World Health Organization, 2022.
- Huber, D.E.; et al. Global NO2 Changes Between 2019 and 2024 as Observed by TROPOMI. Atmos. Chem. Phys. 2026. [Google Scholar] [CrossRef]
- Jethva, H.; et al. Ground-Based MFRSR UV–VIS Retrievals of Dust Absorption. EGUsphere 2025. [Google Scholar] [CrossRef]
- Gobron, N.; et al. RAMI Workshop: Radiative Transfer Modelling Support; European Commission JRC, 2023. [Google Scholar]
- Merdji, A.B.; et al. Accuracy Assessment of MODIS Aerosol Optical Properties. Environ. Sci. Pollut. Res. 2023. [Google Scholar] [CrossRef] [PubMed]
- Kayetha, V.; Torres, O.; Jethva, H. Retrieval of UV–visible aerosol absorption using AERONET and OMI–MODIS synergy: spatial and temporal variability across major aerosol environments. Atmos. Meas. Tech. 2022, 15, 845–877. [Google Scholar] [CrossRef]
- Lakkala, K.; et al. Validation of the TROPOMI Surface UV Radiation Product. Atmos. Meas. Tech. 2020, 13, 6999–7024. [Google Scholar] [CrossRef]
- Bak, J.; et al. Extension of Ozone Profile Retrievals from TROPOMI. Remote Sens. 2025, 17, 779. [Google Scholar] [CrossRef]
- Sentinel-5P TROPOMI Surface UV Radiation ATBD; Finnish Meteorological Institute, 2020.
- Corr, C.A. Retrieval of Aerosol Single Scattering Albedo at UV Wavelengths for Two Urban Field Campaigns. Master’s thesis, Colorado State University, 2008. [Google Scholar]
- Serdyuchenko, A.; Gorshelev, V.; Weber, M.; Chehade, W.; Burrows, J.P. High Spectral Resolution Ozone Absorption Cross-Sections – Part 2: Temperature Dependence. Atmos. Meas. Tech. 2014, 7, 625–636. [Google Scholar] [CrossRef]
- Bigelow, D.S.; Slusser, J.R.; Beaubien, A.F.; Gibson, J.H. The USDA Ultraviolet Radiation Monitoring Program. Bull. Am. Meteorol. Soc. 1998, 79, 601–615. [Google Scholar] [CrossRef]
- Lindfors, A. V.; Kujanpää, J.; Kalakoski, N.; Heikkilä, A.; Lakkala, K.; Mielonen, T.; Sneep, M.; Krotkov, N. A.; Arola, A.; Tamminen, J. The TROPOMI surface UV algorithm. Atmos. Meas. Tech. 2018, 11, 997–1008. [Google Scholar] [CrossRef]
- Vasilkov, A.; Krotkov, N.; Bandel, M.; Jethva, H.; Haffner, D.; Fasnacht, Z.; Torres, O.; Ahn, C.; Joiner, J. Absorbing Aerosol Effects on Hyperspectral Surface andUnderwater UV Irradiances from OM IMeasurements and Radiative Transfer Computations. Remote Sens. 2025, 17, 562. [Google Scholar] [CrossRef]
- Lamy, K.; Portafaix, T.; Josse, B.; Brogniez, C.; Godin-Beekmann, S.; Bencherif, H.; Revell, L.; Akiyoshi, H.; Bekki, S.; Hegglin, M. I.; Jöckel, P.; Kirner, O.; Liley, B.; Marecal, V.; Morgenstern, O.; Stenke, A.; Zeng, G.; Abraham, N. L.; Archibald, A. T.; Butchart, N.; Chipperfield, M. P.; Di Genova, G.; Deushi, M.; Dhomse, S. S.; Hu, R.-M.; Kinnison, D.; Kotkamp, M.; McKenzie, R.; Michou, M.; O’Connor, F. M.; Oman, L. D.; Pitari, G.; Plummer, D. A.; Pyle, J. A.; Rozanov, E.; Saint-Martin, D.; Sudo, K.; Tanaka, T. Y.; Visioni, D.; Yoshida, K. Clear-sky ultraviolet radiation modelling using output from the Chemistry Climate Model Initiative. Atmos. Chem. Phys. 2019, 19, 10087–10110. [Google Scholar] [CrossRef]
- Gouda, S. S.; Gogoi, M. M.; Babu, S. S. Synergistic Fusion of Aerosol Optical Depth over India from multi-sensor satellite retrievals with ground-based measurements. Atmos. Meas. Tech. 2019, 3687–3712. [Google Scholar] [CrossRef] [PubMed]
- Stamnes, K.; Tsay, S.-C.; Wiscombe, W.; Jayaweera, K. Numerically stable algorithm for discrete-ordinate-method radiative transfer in multiple scattering and emitting layered media. Appl. Opt. 1988, 27, 2502–2509. [Google Scholar] [CrossRef] [PubMed]
- Ricchiazzi, P.; Yang, S.-K.; Gautier, C.; Sowle, D. SBDART: A Research and Teaching Software Tool for Plane-Parallel Radiative Transfer in the Earth’s Atmosphere. Bull. Am. Meteorol. Soc. 1998, 79, 2101–2114. [Google Scholar] [CrossRef]
- Xia, X.; et al. Estimation of aerosol effects on surface irradiance based on measurements and radiative transfer model simulations in northern China. J. Geophys. Res. Atmos. 2007, 112, D22S10. [Google Scholar] [CrossRef]
- Barnard, J. C.; Long, C. N. A comparison between modeled and measured clear-sky radiative shortwave fluxes in Arctic environments. J. Geophys. Res. Atmos. 2002, 107, AAC 10-1–AAC 10-14. [Google Scholar] [CrossRef]
Figure 1.
Flowchart of the satellite-sensor-integrated TUV methodology and validation study.
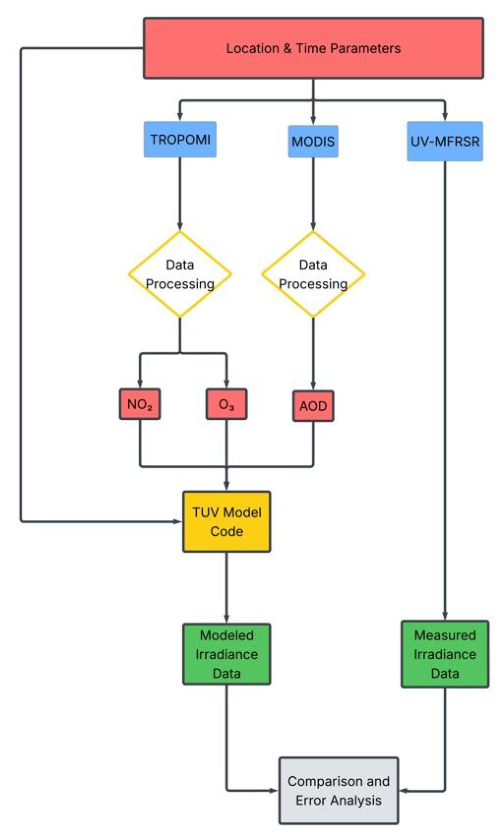
Figure 2.
Contour maps of total surface irradiance for increasing levels of AOD across one diurnal cycle at: (a) 332.0 nm wavelength; (b) 368 nm wavelength.
Figure 2.
Contour maps of total surface irradiance for increasing levels of AOD across one diurnal cycle at: (a) 332.0 nm wavelength; (b) 368 nm wavelength.
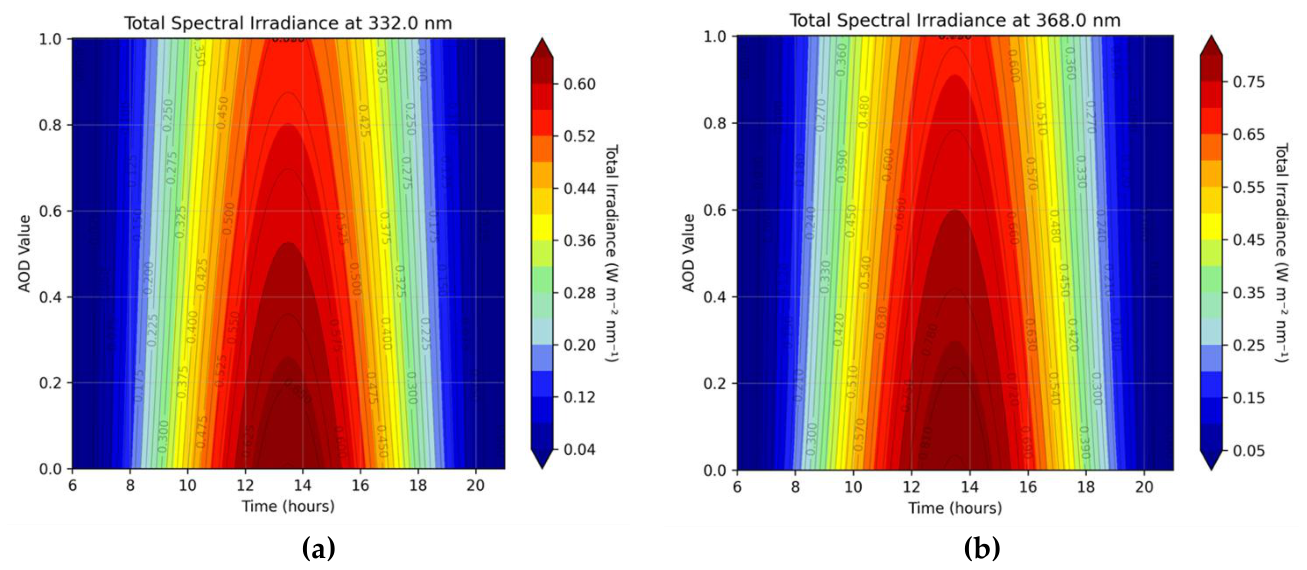
Figure 3.
Contour maps of total surface irradiance for increasing levels of TCO across one diurnal cycle at: (a) 332.0 nm wavelength; (b) 368 nm wavelength.
Figure 3.
Contour maps of total surface irradiance for increasing levels of TCO across one diurnal cycle at: (a) 332.0 nm wavelength; (b) 368 nm wavelength.
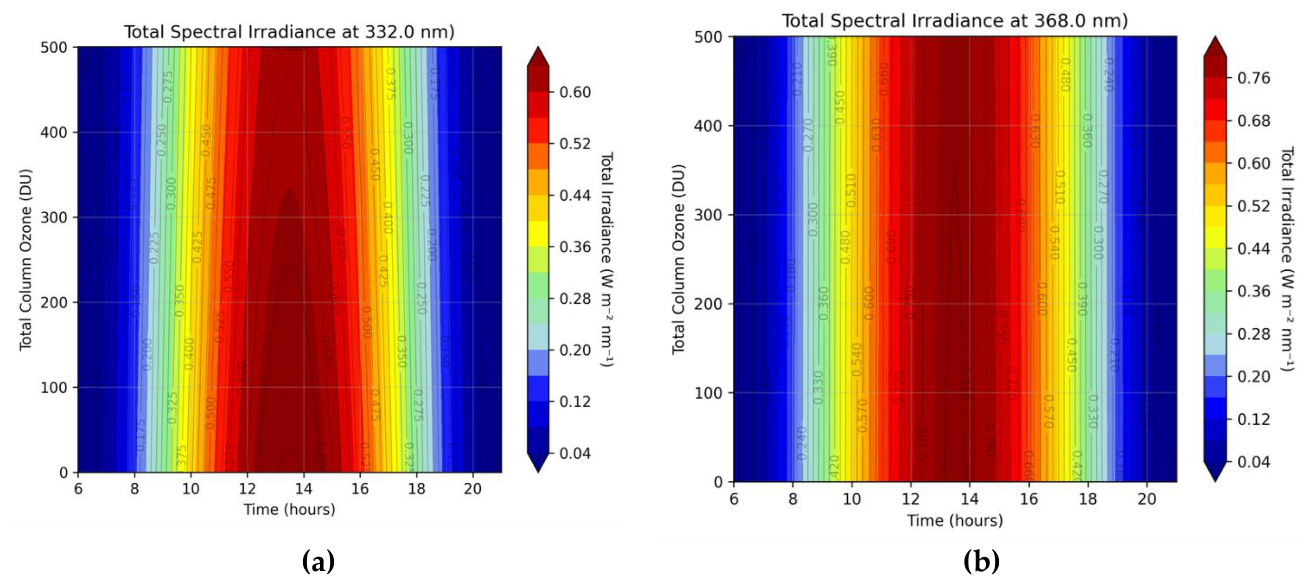
Figure 4.
Contour maps of total surface irradiance for increasing levels of TCO across one diurnal cycle at: (a) 332.0 nm wavelength; (b) 368 nm wavelength.
Figure 4.
Contour maps of total surface irradiance for increasing levels of TCO across one diurnal cycle at: (a) 332.0 nm wavelength; (b) 368 nm wavelength.
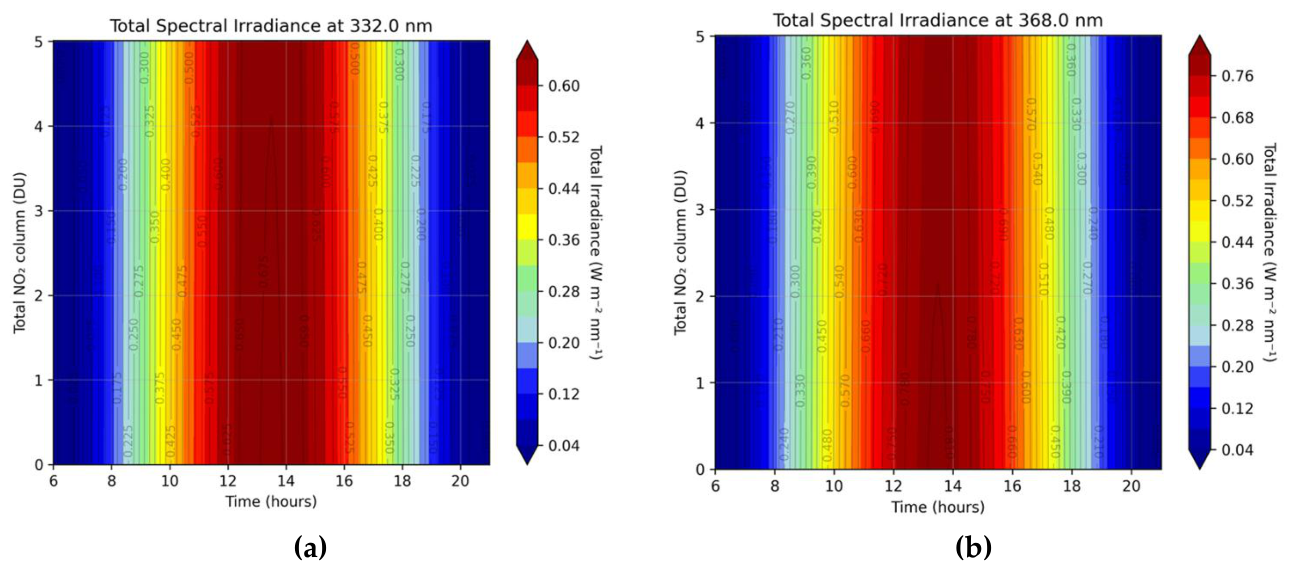
Figure 5.
Surface irradiance plots showing UV-MFRSR measured data with methodology generated data for: (a) El Paso, TX at 332 nm; (b) El Paso, TX at 368 nm; (c) Flagstaff, AZ at 332 nm; (d) Flagstaff, AZ at 368 nm; (e) Logan, UT at 332 nm ; (f) Logan, UT at 368 nm.
Figure 5.
Surface irradiance plots showing UV-MFRSR measured data with methodology generated data for: (a) El Paso, TX at 332 nm; (b) El Paso, TX at 368 nm; (c) Flagstaff, AZ at 332 nm; (d) Flagstaff, AZ at 368 nm; (e) Logan, UT at 332 nm ; (f) Logan, UT at 368 nm.
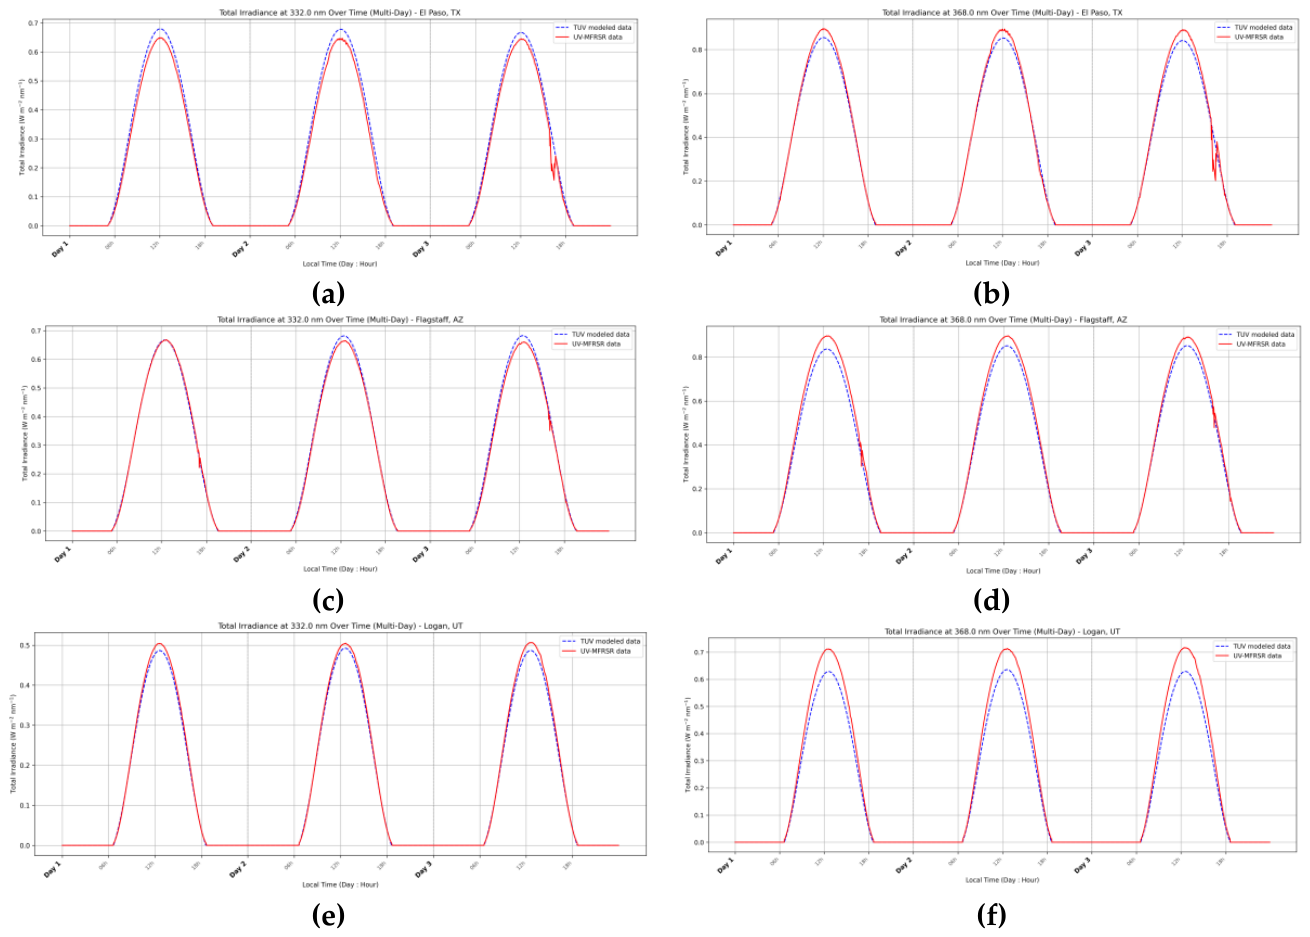
Figure 6.
Scatter plots showing correlation of modeled data against measured data at both wavelengths for: (a) El Paso, TX; (b) Flagstaff, AZ; (c) Logan, UT.
Figure 6.
Scatter plots showing correlation of modeled data against measured data at both wavelengths for: (a) El Paso, TX; (b) Flagstaff, AZ; (c) Logan, UT.
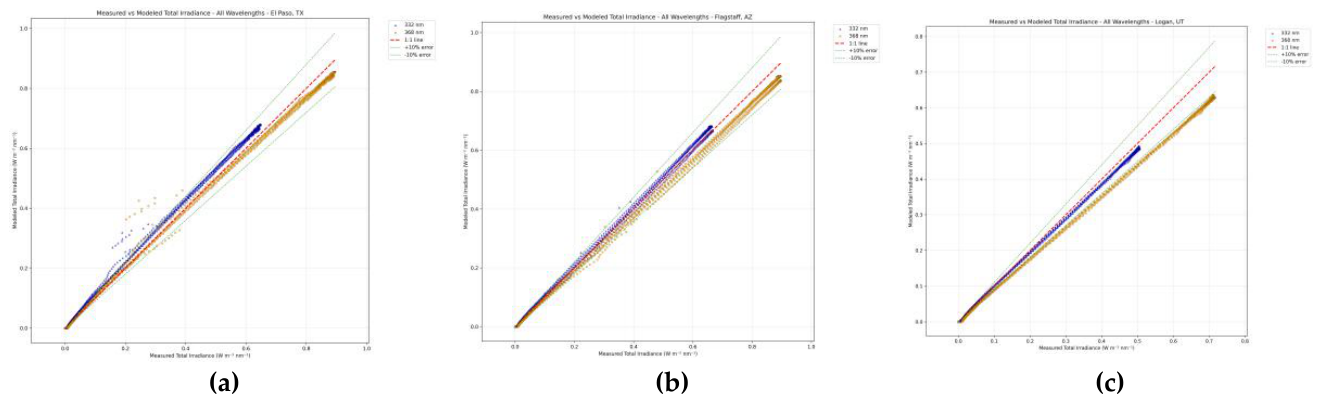
Figure 7.
Bar Graphs of the error metrics for all locations at both wavelengths: (a) RMSE; (b) MAE; (c) R²; (d) MBE.
Figure 7.
Bar Graphs of the error metrics for all locations at both wavelengths: (a) RMSE; (b) MAE; (c) R²; (d) MBE.
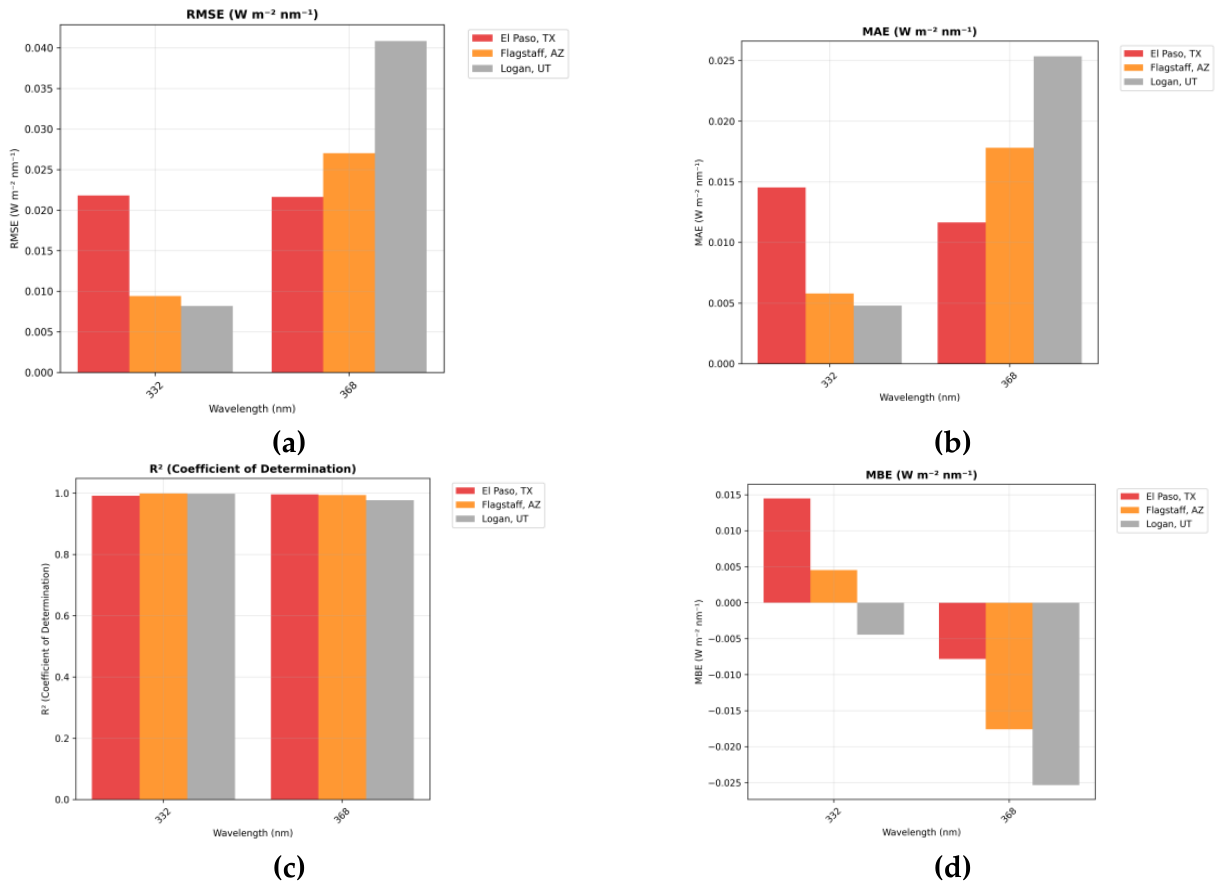

Table 1.
Relevant Satellite Instrument Information.
| Data Source | Product/Parameter | Key Variables Provided | Spatial Resolution | Temporal Resolution | Relevance to Methodology |
|---|---|---|---|---|---|
| MODIS Terra/Aqua | Aerosol Product (MOD04_L2/MYD04_L2) | Aerosol Optical Thickness, Particle Size Distribution | 10 km, 3 km | Orbital Swath | Primary input for aerosol scattering/absorption. |
| TROPOMI Sentinel-5P | TCO/O₃ Profile | Total O₃ Column, O₃ Profile (33 pressure levels) | 3.5 x 7 km² | Daily (NRT) | Crucial for accurate UV attenuation calculations. |
| TROPOMI Sentinel-5P | Nitrogen Dioxide Total/Tropospheric Columns | Tropospheric NO₂ vertical columns | 3.5 x 7 km² | Daily (NRT) | Critical for anthropogenic pollution monitoring and air quality management. |
Table 2.
Error Metrics across all locations and wavelengths.
| Location | Wavelength (nm) | RMSE () | MAE () | R2 | MBE ( | No. Data Points |
|---|---|---|---|---|---|---|
| El Paso, TX | 332 | 0.021792 | 0.014525 | 0. 991898 | 0. 014476 | 1440 |
| 368 | 0.021629 | 0. 011648 | 0. 995881 | -0. 007817 | 1440 | |
| Flagstaff, AZ | 332 | 0.009402 | 0.005787 | 0.998605 | 0.004529 | 1440 |
| 368 | 0.027003 | 0.017798 | 0.993779 | -0.01761 | 1440 | |
| Logan, UT | 332 | 0.00819 | 0.004791 | 0.99809 | -0.00444 | 1440 |
| 368 | 0.040821 | 0.025344 | 0.976817 | -0.02534 | 1440 |
Disclaimer/Publisher’s Note: The statements, opinions and data contained in all publications are solely those of the individual author(s) and contributor(s) and not of MDPI and/or the editor(s). MDPI and/or the editor(s) disclaim responsibility for any injury to people or property resulting from any ideas, methods, instructions or products referred to in the content. |
© 2026 by the authors. Licensee MDPI, Basel, Switzerland. This article is an open access article distributed under the terms and conditions of the Creative Commons Attribution (CC BY) license (http://creativecommons.org/licenses/by/4.0/).
Copyright: This open access article is published under a Creative Commons CC BY 4.0 license, which permit the free download, distribution, and reuse, provided that the author and preprint are cited in any reuse.