

Submitted:
01 July 2026
Posted:
02 July 2026
You are already at the latest version
Abstract
Biofilm is known to negatively affect the hydraulic performance of open channels by increasing friction and energy losses and, consequently, economic costs. This study proposes a method to accurately quantify the effect of flow reduction caused by biofouling in open channels. The approach is based on Manning’s equation, using the Monte Carlo Method for the propagation of input uncertainties. A case study concerning a trapezoidal concrete open channel of an agricultural irrigation network is presented, showing a relative expanded uncertainty (95 % confidence level) of 10 % for flow rates ranging from 1 m3·s-1 and 50 m3·s-1. Manning’s roughness coefficient was identified as the dominant contribution to the overall dispersion of flow rate values, being probabilistically modelled by a beta distribution using minimum, expected and maximum reference values. This information was used for conformity assessment of the studied open channel, considering flow reductions due to moderate and severe biofilm effect of 12.5 % and 31.3 %, respectively. The corresponding standard uncertainties (4.8 % and 7.8 %), the adopted confidence level (95 %), tolerance upper limit (33 %) and decision rule, led to different conformity assessment outcomes. These results highlight the importance of accurate assessment of flow reduction due to biofouling for management entities.
Keywords:
open channel
; flow rate
; biofilm
; measurement uncertainty
1. Introduction
Biofilm development in water supply and drainage systems is relevant for the design, management, and maintenance of urban, agricultural, or industrial hydraulic infrastructures [1]. The presence of this biological growth in pipes and open channels adversely affects hydraulic performance by increasing friction and energy losses, thereby increasing operation, maintenance, and environmental costs [2]. Despite its importance, incorporating biofilm effects into the design, maintenance, and operation decision-making processes of hydraulic infrastructures remains challenging due to its complex and dynamic nature [3].
This paper presents a method for the accurate quantification of flow reduction caused by biofouling in open channels. The approach is based on Manning’s equation [4] combined with a probabilistic formulation of the input quantities. Emphasis is placed on Manning’s roughness coefficient, and to its probabilistic representation using a beta distribution. The parameters of this distribution are derived from established reference values [5,6] accounting for channel type, construction material, surface condition, and the presence of biofilm.
The propagation of measurement uncertainty propagation from the input quantities to the flow rate is carried out using the Monte Carlo method [7,8]. The results are crucial for conformity assessment [9] of open channels with biofilm, based on the adoption of an appropriate decision rule and the definition of a tolerance upper limit for flow reduction. The proposed approach provides a robust tool to support risk-informed decision-making [10,11], particularly in maintenance planning and interventions scheduling. This tool can be used by infrastructure managers to determine cleaning (see Figure 1), and rehabilitation requirements with a quantifiable level of confidence, thereby reducing the risk associated with premature or delayed interventions and the corresponding economic costs.
The proposed approach is demonstrated through a case study of a sub-system of the Alqueva agricultural irrigation network, the Álamos—Loureiro trapezoidal concrete open channel, located in southern Portugal, designed for a maximum flow rate of 37 m3·s-1 [12].
2. Flow Measurement in Open Channels
In the context of open channels flow, Chézy’s equation is one of the earliest empirical formulations (proposed in seventeenth century) for calculating the cross-sectional average flow velocity, v, being given by
where C is Chézy’s roughness coefficient, Rh is the hydraulic radius, and S is the channel slope. An alternative formulation was later proposed by Manning in the late of the nineteenth century [13], given by
where n is the Manning’s roughness coefficient. This empirical formula supports one of the most widely used methods for flow rate measurement calculation in open channels, given by
where qv is the volumetric flow rate and A is the cross-sectional flow area. In this context, the hydraulic radius is defined as
where Pw the channel’s wet perimeter. Manning’s equation can be applied to a wide range of hydraulic engineering systems, including rivers, streams, floodplains, open channels, sewers and partially filled pipes, under steady, uniform free surface conditions [14]. The input quantities are primarily related to the channel geometry, flow depth and resistance to flow, the latter being represented by Manning’s roughness coefficient. For this parameter, reference values are available in literature [e.g., 5], typically provided as minimum, expected and maximum values for different types of channels (both artificial and natural), as well as for varying surface texture conditions. In artificial channels, these values depend on construction material and surface finish. Table 1 presents typical reference values of Manning’s roughness coefficient for concrete open channels [5].
v = C · √(Rh · S),
v = (1/n) · Rh2/3 · S1/2,
qv = v · A = (1/n) · Rh2/3 · S1/2 · A,
Rh = A / Pw,
The development of biofilm increases the uncertainty associated with Manning’s roughness coefficient, because of the complex and non-linear nature of this process [2,3]. This is related to: (i) viscoelastic and flow-dependent behavior, whereby, higher flow velocity can induce more compact biofilm and regular detachment of biofilm patches, decreasing the flow resistance; (ii) spatial heterogeneity, resulting from irregular and non-uniform layers of biofilm in terms of thickness, density and structure in different regions of the same channel; (iii) temporal variability, as biofilm is a metabolically active material undergoing cycles of growth, maturation, sloughing and restructuring.
3. Case Study
The case study illustrates the application of the proposed approach and concerns to a sub-system of the Alqueva agricultural irrigation network, namely the Álamos-Loureiro channel, located in southern Portugal (see Figure 2). The general design specifications of this open channel [12] are presented in Table 2.
The channel is designed for a maximum flow rate of 37 m3·s-1, corresponding to a flow depth of 3.70 m. Considering the total channel height of 4.50 m, a freeboard of 0.80 m was adopted to reduce the risk of overtopping caused by flow fluctuations associated with transient flow conditions and high intensity precipitation events.
The construction process of the channel (see Figure 3) allows to classify the surface condition as trowel finish, during the initial stage of hydraulic operation.
For a trapezoidal channel (see Figure 2.b), the following equations are used to determine the top width of the flow cross-section, B, and the corresponding area, A, and the wet perimeter, Pw:
B = b + 2 · h · tan (π / 4)
A = 0.5 · (B + b) · h;
Pw= b + 2 · h / cos (π / 4).
4. Measurement Uncertainty Evaluation
4.1. Functional Diagram and Probabilistic Formulation of the Input Quantities
Figure 4 presents the functional diagram related to the flow rate measurement in the studied open channel.
According to Figure 4, five input quantities are identified: Manning’s roughness coefficient, n; the flow depth, h; the channel bed width, b; and the channel slope horizontal and vertical dimensions, H and V, respectively. The probabilistic formulation of these quantities is presented in the following sub-sections.
4.1.1. Dimensional and Geometric Quantities
The probabilistic formulation presented in Table 3 is based on the rounding adopted in the definition of design values. A uniform distribution is assumed for each quantity, with a half-width equal to half of the corresponding rounding value.
For the slope vertical dimension and the bed width values, a rounding of 0.01 m was considered, whereas a rounding of 1 m was adopted for the horizontal dimension. These rounding values are higher than the target measurement uncertainties specified in the construction quality control procedures. In the case of the flow depth, in situ measurements with ultrasonic sensors are also associated with a target measurement uncertainty lower than the adopted rounding value of 0.01 m.
4.1.2. Manning’s Roughness Coefficient
For the probabilistic formulation of Manning’s roughness coefficient, a beta distribution is adopted as an appropriate representation of the dispersion of values associated to this input quantity. This choice is supported by the availability of minimum, expected and maximum reference values [5] to clean (biofilm-free) condition. The beta distribution is defined by two parameters, p1 and p2, allowing different, smooth and flexible probability distributions within a bounded interval defined by the minimum and maximum values.
This distribution avoids generating values outside the known minimum and maximum reference values, respectively, while allowing asymmetric probability distributions, namely, when the expected value is different from the average value between minimum and maximum values. The influence of biofilm development can be incorporated through appropriate parameterization of the distribution, allowing a realistic probabilistic formulation of a complex, spatial and time-varying, and non-linear phenomenon.
In this study, the beta distribution parameterization is based on minimum, expected and maximum reference values of Manning’s roughness coefficient. The procedure involves the calculation of the corresponding normalized average, variance estimation (by the PERT method) and normalization. Table 4 presents p1 and p2 for the reference values shown in Table 1. Figure 5 and Figure 6 illustrate the corresponding beta distribution of values associated with Manning’s roughness coefficients.
In this study, three levels of biofilm effect were considered—reduced, moderate and severe—based on reported flow reduction due to biofouling [1]. The corresponding minimum, expected and maximum of Manning’s roughness coefficient values are presented in Table 5, together with the associated parameterization of the beta distribution.
In the quantification of the reduced biofilm effect, a clean concrete channel with trowel finish was considered.
4.2. Propagation of Measurement Uncertainty
The Monte Carlo Method (MCM) was used to propagate measurement uncertainties from the input quantities to the output quantity (flow rate), as illustrated in Figure 4. The selection of this numerical method was motivated by the probabilistic modelling of the Manning’s roughness coefficient using a beta distribution, which allows dealing with asymmetrical dispersion of values, as is the case, when minimum, expected and maximum reference values are available. The MCM provides accurate and convergent results when the uncertainty propagation involves non-linear mathematical models, such as Manning’s equation (see expression 3). The influence of asymmetrical input distributions can also be evaluated in the dispersion of output values.
In this context, the main guidelines of the GUM—Guide to the expression of Uncertainty in Measurement / Supplement 1 [8] were followed. A total of 106 simulations were executed for each input quantity, ensuring convergence of the flow rate (output quantity) distribution, with a computational accuracy level below 0.1 m3·s-1.
A dedicated computational routine was developed in a MATLAB environment for this purpose, using the Mersenne-Twister pseudo-random number generator [15]. The same routine was used to conduct a sensitivity analysis of the input quantities, with the aim of identifying the main contributions for the measurement uncertainty of the flow rate. This analysis was carried out by introducing identical relative increase in the uncertainty of each input quantity and observing the corresponding normalized increase in the uncertainty of the output quantity.
5. Results
5.1. Intermediate Quantities
Table 6 presents the results of the numerical simulation obtained using the MCM method for the intermediate quantities associated with the flow rate (output quantity), considering a reduced biofilm effect (clean surface condition).
The relative 95% expanded uncertainty of Manning’s roughness coefficient at this confidence level is, approximately, 10%. Complementary results were obtained for the flow cross-sectional average velocity (by equation 2), namely, an average of 1.38 m·s-1, a mode of 1.37 m·s-1 and a (absolute) 95% expanded measurement uncertainty equal to 0.14 m·s-1, equivalent to a 10% of the mentioned estimate.
5.2. Output Quantity
Table 7 presents the measurement estimates and uncertainties of the flow rate, considering the intermediate results (in Table 6), for the studied trapezoidal concrete open channel under reduced biofilm conditions (clean surface).
Figure 7.
Numerical dispersion of values of the output quantity for a flow depth equal to 3.70 m.
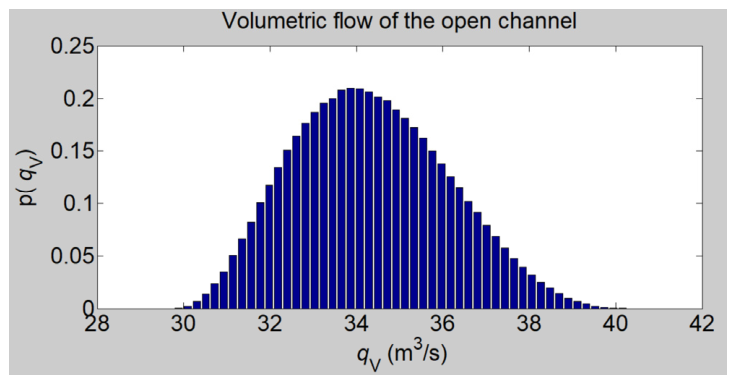
Additional simulations carried out for flow depths between 0.5 m up to overtopping limit of 4.5 m, revealed a constant relative 95% expanded measurement of 10%, for flow rate values between 1 m3·s-1 and 50 m3·s-1. Within this range, Manning’s roughness coefficient was identified as the dominant contributor (close to 99%) to the overall measurement uncertainty, while the contributions of the remaining input quantities were found to be negligible. For lower flow depths close to 0.1 m, the relative 95% expanded measurement uncertainty of the flow rate increases up to 14%, reflecting the additional influence of flow depth on the total uncertainty.
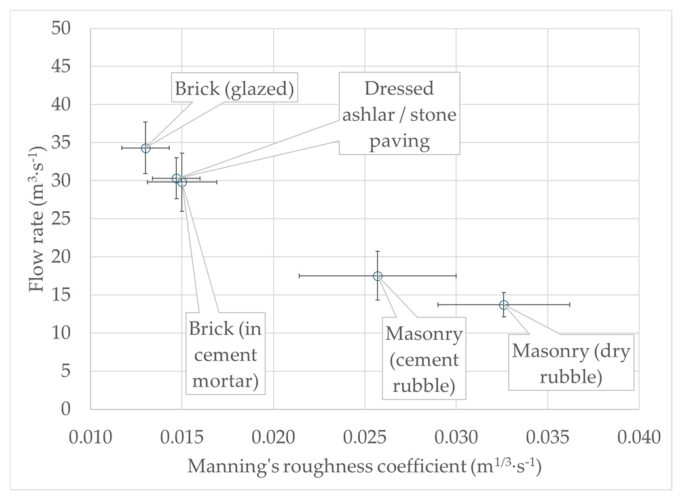
Figure 8 illustrates the relationship between Manning’s roughness coefficient and the flow rate for the studied channel, considering the maximum operation flow depth (3.70 m) and different concrete surface textures (see Table 1). Appendix A presents analogous relationships for the same open channel geometry considering different construction materials (cement, wood, hybrid materials, gravel, brick, masonry and stone), based on Manning’s roughness coefficient reported in [5].
As expected, an increase in Manning’s roughness coefficient results in a reduction in the estimated flow rate, while the relative 95% expanded measurement uncertainty varies between 7% and 12% depending on the type of concrete surface textures.
Table 8 presents the results obtained for the flow rate, considering different levels of biofilm development (as shown in Table 5).
As expected, the increase of the biofilm effect magnitude, from a reduced to a severe level, corresponds to a flow rate decrease in terms of expected value and absolute measurement uncertainty.
5.3. Flow Reduction and Conformity Assessment
The results presented in Table 8 enable the quantification of the impact of moderate and severe biofilm conditions relative to the reduced effect (clean channel) condition. The measurement estimates and associated uncertainties reported in Table 9, were obtained by propagating the flow rate results from Table 8 using the MCM.
Conformity assessment is crucial to ensure compliance of the hydraulic infrastructure performance with the requirements defined by management entities, thereby supporting confidence in risk-informed decision-making with significant impacts on operational, maintenance and environmental costs.
In the presented case study, the implementation of a conformity assessment procedure [9,10,11] is supported by:
- (i)
- a tolerance upper limit, defining the boundary between acceptable and unacceptable flow reduction due to presence of biofilm;
- (ii)
- flow reduction measurement results, including both estimates and associated uncertainties, as presented in Table 9;
- (iii)
- the selection of a decision rule, corresponding to an objective criterion for comparing the measured flow reduction with the tolerance upper limit specified by the hydraulic management entity.
When considering decisions regarding cleaning and rehabilitation of the channel due to biofouling, two types of incorrect decisions can occur: premature or delayed interventions, associated with probabilities α and β, respectively. Both cases imply costs for the management entity. Following the general guidelines mentioned in [9], a 2 × 2 decision matrix P can be defined, where the diagonal elements, (1–α) and (1–β), represent the probabilities of correct decisions, while the off-diagonal elements, α and β, correspond to the probabilities of incorrect decisions. These are associated with type I and type II errors, respectively: a type I error occurs when the channel is incorrectly classified as non-compliant (unnecessary intervention), while a type II error occurs when the channel is incorrectly classified as compliant (required intervention is not carried out).
Infrastructure managers can prioritize their risk analysis by focusing on either type I or II probabilities and their associated consequences. In the case studied, a type I error leads to the risk of unnecessary costs related to the operational shutdown, loss of revenue, and cleaning and rehabilitation activities. Conversely, a type II error implies a risk of non-compliance with service commitments (e.g., inability to deliver the contracted flow rate), and an increased risk of failure due to overtopping, driven by flow fluctuations under transient flows or intense precipitation events.
Based on the geometrical representations shown in Figure 9 and assuming the applicability of the Central Limit Theorem [16] to the flow reduction results (Table 9), a Gaussian probability function, Φ, can be assumed for the measurement uncertainty, u(ΔqV). The following decision rule can be adopted, focusing on the control of type I error:
(a) the biofouled channel is considered conform, if the hypothesis H0: P(ΔqV ≤ Tu) ≥ (1—α) is true;
(b) the biofouled channel is considered non-conform, if the hypothesis H0: P(ΔqV ≤ Tu) < (1—α) is false.
In this case, the probability of conformity is given by (8)
where Pc is the conformance probability, ΔqV is the flow reduction estimate and Tu is the tolerance upper limit.
Pc = P (ΔqV ≤ Tu) = Φ [ (Tu − ΔqV) / (u(ΔqV) ],
Table 10 presents the results of the conformity assessment for the two previously analysed biofilm-induced flow reduction scenarios (see Table 9), considering a 5% type I error probability and a tolerance upper limit of 33% (indicated by the vertical line in Figure 9).
It should be noted that, in the case of severe biofilm effect, if a simple acceptance / rejection decision rule was applied, without accounting for the measurement uncertainty in the flow reduction, the channel would be classified as conform, since the measurement estimate (31.3%) is below the tolerance upper limit (33%). In that case, the probability of a type I error (false acceptance) would increase to 50%, reducing confidence in the intervention decision.
4. Discussion
Previous studies on the impact of biofouling on flow reduction in open channels have frequently adopted a deterministic perspective, neglecting the dispersion of values associated with the input quantities that support the use of Manning’s equation. As demonstrated in the present case study, knowledge of flow rate measurement uncertainty in open channels is essential for conformity assessment and for increasing confidence in decision-making processes, particularly, regarding cleaning and rehabilitation interventions.
The study confirms that Manning’s roughness coefficient is the dominant contribution to flow rate measurement uncertainty. The use of the beta distribution for probabilistic modeling of this input quantity proved to be appropriate, as it allows to adjust its dispersion to minimum, expected and maximum reference values related to the construction material and surface condition. The MCM was particularly suited for this purpose, as it enables to account for asymmetrical dispersion of roughness coefficient values related to the non-linear behavior of flow resistance associated with biofilm development.
The proposed method is applicable to a wide range of hydraulic engineering applications beyond the studied trapezoidal concrete open channel and its operational stage. For instance, it can support early-stage design decisions, such as construction material selection, as illustrated in Appendix A, thereby enhancing confidence in these decisions. The method is also applicable to partly filled closed pipes for which reference values of Manning’s roughness coefficient are available. Furthermore, it can be extended to the analysis of natural channels and floodplains, which are increasingly relevant due to climate change, supporting risk-based approaches related to assessment of intense precipitation events.
Future research will focus on the experimental determination of Manning’s roughness coefficient in the studied open channel, particularly, before and after cleaning and maintenance operations. This will require dedicated measurement campaigns involving flow depth and flow rate to quantify the roughness coefficient using Manning’s equation. These measurements can be used to establish correlations with biofilm characteristics such as thickness, density and structure, before cleaning operations. The obtained data will contribute to refining the probabilistic representation of Manning’s roughness coefficient for different levels of biofilm effect.
Author Contributions
Conceptualization, L.M. and M.C.A.; methodology, L.M.; software, L.M. and A.R; validation, M.C.A., A.R. and C.S.; formal analysis, A.R.; investigation, M.C.A.; resources, L.M.; writing—original draft preparation, L.M.; writing—review and editing, M.C.A, A.R. and C.S.; visualization, L.M.; supervision, M.C.A. and A.R. All authors have read and agreed to the published version of the manuscript.
Funding
This research received no external funding.
Data Availability Statement
The MATLAB computational routines are available upon request to the corresponding author.
Acknowledgments
The authors are grateful to Aqualogus—Engenharia e Ambiente and EDIA—Empresa de desenvolvimento e infra-estruturas do Alqueva S.A., for sharing technical information regarding the Álamos-Loureiro open channel.
Conflicts of Interest
The authors declare no conflicts of interest.
Abbreviations
The following abbreviations are used in this manuscript:
| APRH | Associação Portuguesa de Recursos Hídricos |
| JCGM | Joint Committee for Guides in Metrology |
| LNEC | Laboratório Nacional de Engenharia Civil |
| MCM | Monte Carlo Method |
| PERT | Project Evaluation and Review Technique |
Appendix A
This Appendix presents the relationship between Manning’s roughness coefficient and flow rate measurement estimates and uncertainties, for the same flow depth, open channel dimensions and geometry but considering different construction materials and surface conditions. These results were obtained by application of the approach previously described in the paper, using the corresponding minimum, expected and maximum reference values for Manning’s roughness coefficient mentioned in [5]. The purpose of this Appendix is to provide rigorous and useful information for comparison between different construction materials and surface textures (in a clean condition, without the presence of biofilm), in the context of open channel hydraulic design.
Figure A1.
Relationship between Manning’s roughness coefficient and flow rate measurement estimates and uncertainties, for the open channel studied (3.70 m flow depth), in cement.
Figure A1.
Relationship between Manning’s roughness coefficient and flow rate measurement estimates and uncertainties, for the open channel studied (3.70 m flow depth), in cement.
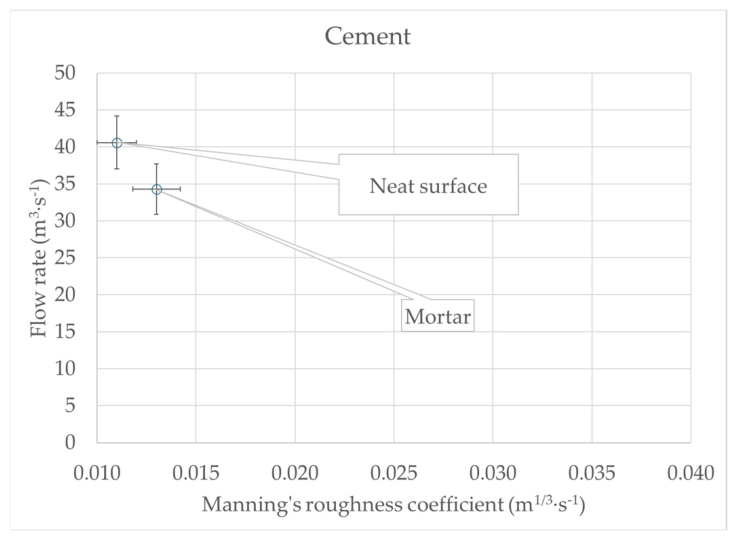
Figure A2.
Relationship between Manning’s roughness coefficient and flow rate measurement estimates and uncertainties, for the open channel studied (3.70 m flow depth), in wood.
Figure A2.
Relationship between Manning’s roughness coefficient and flow rate measurement estimates and uncertainties, for the open channel studied (3.70 m flow depth), in wood.
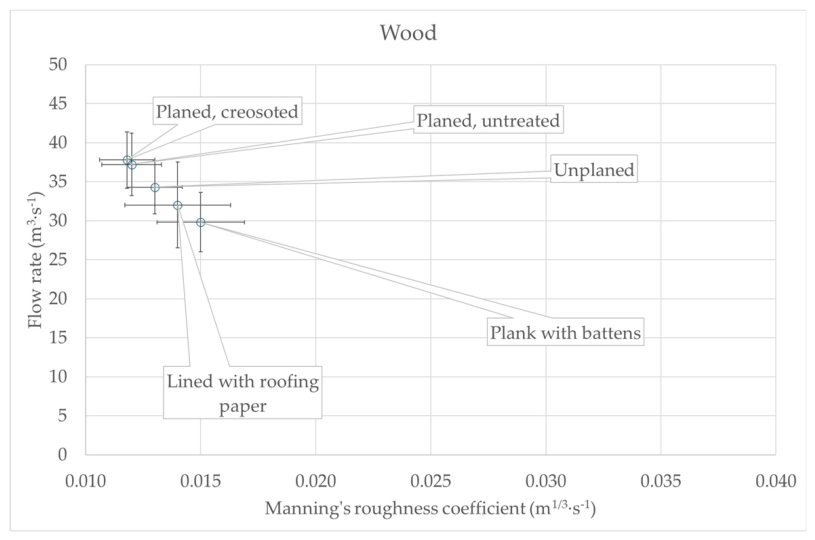
Figure A3.
Relationship between Manning’s roughness coefficient and flow rate measurement estimates and uncertainties, for the open channel studied (3.70 m flow depth), with concrete bottom float finish and different side materials.
Figure A3.
Relationship between Manning’s roughness coefficient and flow rate measurement estimates and uncertainties, for the open channel studied (3.70 m flow depth), with concrete bottom float finish and different side materials.
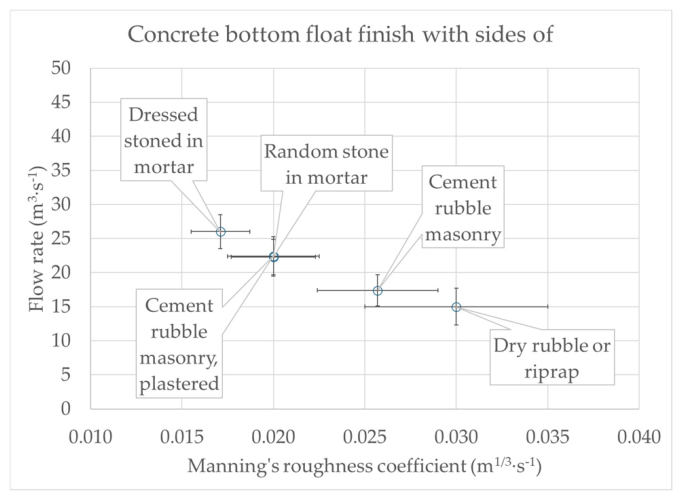
Figure A4.
Relationship between Manning’s roughness coefficient and flow rate measurement estimates and uncertainties, for the open channel studied (3.70 m flow depth), with gravel bottom and different side materials.
Figure A4.
Relationship between Manning’s roughness coefficient and flow rate measurement estimates and uncertainties, for the open channel studied (3.70 m flow depth), with gravel bottom and different side materials.
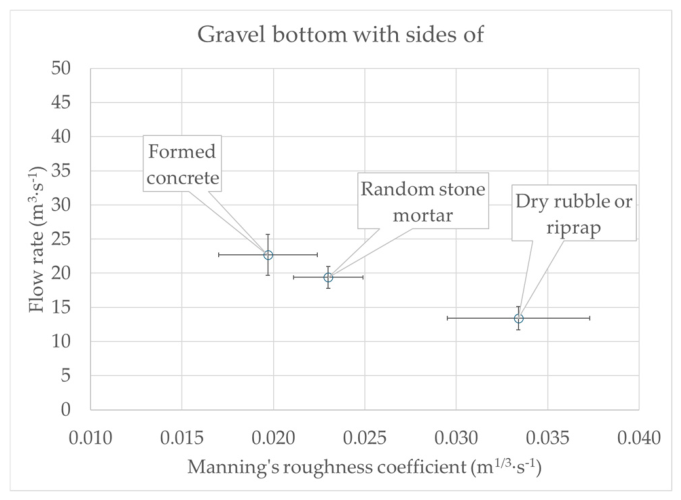
Figure A5.
Relationship between Manning’s roughness coefficient and flow rate measurement estimates and uncertainties, for the open channel studied (3.70 m flow depth), in brick or masonry.
Figure A5.
Relationship between Manning’s roughness coefficient and flow rate measurement estimates and uncertainties, for the open channel studied (3.70 m flow depth), in brick or masonry.
References
- Cowle, M.W.; Babatunde, A.O.; Rauen, W.B.; Bockelmann-Evans, B.N.; Barton, A.F. Biofilm development in water distribution and drainage systems: dynamics and implications for hydraulic efficiency. Environ. Technol. Rev. 2014. (accepted). [Google Scholar] [CrossRef]
- Barton, A.F. Friction, roughness and boundary layer characteristics of freshwater biofilms in hydraulic conduits. PhD Thesis, University of Tasmania, Australia, June 2007. [Google Scholar]
- Lambert, M. F.; Edwards, R.W.J.; Howie, S.J.; De Gilio, B.B.; Quinn, S.P. The impact of biofilm development on pipe roughness and velocity profile. In Proceedings of the World Environmental and Water Resources Congress, Kansas City (MO), USA, 17-21 May 2009. [Google Scholar]
- Manning, R. On the flow of Water in Open Channels and Pipes. Trans. Inst. Civ. Eng. Irel. 1895, 24, 179–207. [Google Scholar]
- Chow, V.T. Open-channel hydraulics, 1st ed.; Mc-Graw-Hill Book Company: New York (NY), USA, 1959; p. 680. [Google Scholar]
- Arcement, G.J.; Schneider, V.R. Guide for selecting Manning’s roughness coefficients for natural channels and flood plains; Water-Supply Paper No. 2339; Department of the Interior, U.S. Geological Survey: Reston (VA), USA, 1990. [Google Scholar]
- Martins, L.; Ribeiro, A.; Simões, C.; Mendes, R. Measurement uncertainty evaluation of equivalent roughness in hydraulic pipes. ACTA IMEKO 2024, 13(3), 1–6. [Google Scholar] [CrossRef]
- JCGM 101 Evaluation of measurement data—Supplement 1 of the “Guide to the expression of uncertainty in measurement”—Propagation of distributions using a Monte Carlo Method; Joint Committee for Guides in Metrology, 2008.
- JCGM 106 Evaluation of measurement data—The role of measurement uncertainty in Conformity Assessment; Joint Committee for Guides in Metrology, 2012.
- Rossi, G. B.; Crenna, F.A. A probabilistic approach to measurement-based decisions. Measurement 2006, 39, 101–119. [Google Scholar] [CrossRef]
- Pendrill, L.R. Using measurement uncertainty in decision-making and conformity assessment. Metrologia 2014, 51, 206–218. [Google Scholar] [CrossRef]
- Marques, P.; Costa, S.; Fonseca, B.; Carvalho, A. Design of the large canals for the Alqueva multipurpose project. In Proceedings of the Portuguese Association of Water Resources (APRH) technical workshop “The engineering of hydro-agricultural projects: current situation and future challenges”, Lisbon, Portugal, 13-15 October 2011. [Google Scholar]
- Gioia, G.; Bombardelli, F.A. Scaling and similarity in rough channel flows. Phys. Rev. Lett. 2002, 88(1), 1–4. [Google Scholar]
- Sabersky, R.H.; Acosta, A.J.; Hauptmann, E.G.; Gates, E.M. Flow in open channels. In Fluid flow—a first course in Fluid Mechanics, 4th ed.; Prentice Hall: New Jersey (NJ), USA, 1999; pp. 445–449. [Google Scholar]
- Matsumoto, M.; Nishimura, T. Mersenne Twister: a 623-dimensionally equi distributed uniform pseudo random number generator. ACM Trans. Model. Comput. Simul. 1998, 8, 1. [Google Scholar]
- JCGM 100. Evaluation of measurement data—Guide to the expression of uncertainty in measurement; Joint Committee for Guides in Metrology, 2008; (GUM 1995 with minor corrections). [Google Scholar]
Figure 1.
Cleaning operations in trapezoidal concrete channels [2].
Figure 1.
Cleaning operations in trapezoidal concrete channels [2].
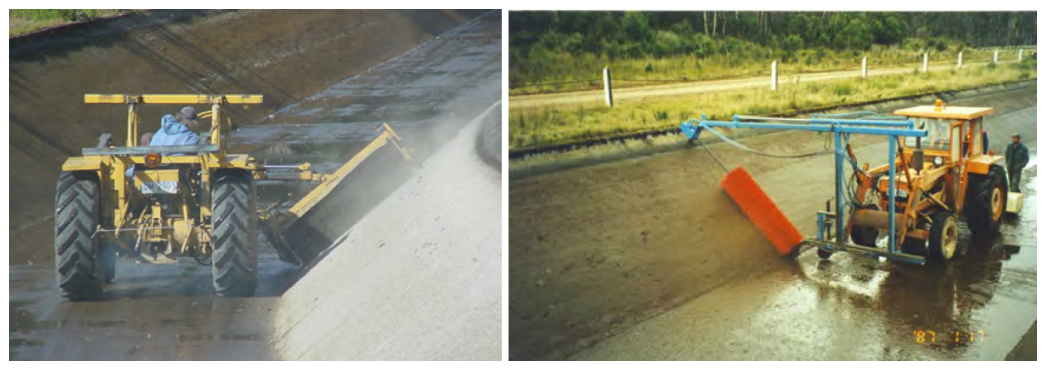
Figure 2.
Sub-system of Alqueva agricultural irrigation network: (a) The Álamos-Loureiro channel [12]; (b) Schematic representation of the channel’s cross-section (b—bed width; h—flow depth; B—top width of the flow cross-section).
Figure 2.
Sub-system of Alqueva agricultural irrigation network: (a) The Álamos-Loureiro channel [12]; (b) Schematic representation of the channel’s cross-section (b—bed width; h—flow depth; B—top width of the flow cross-section).
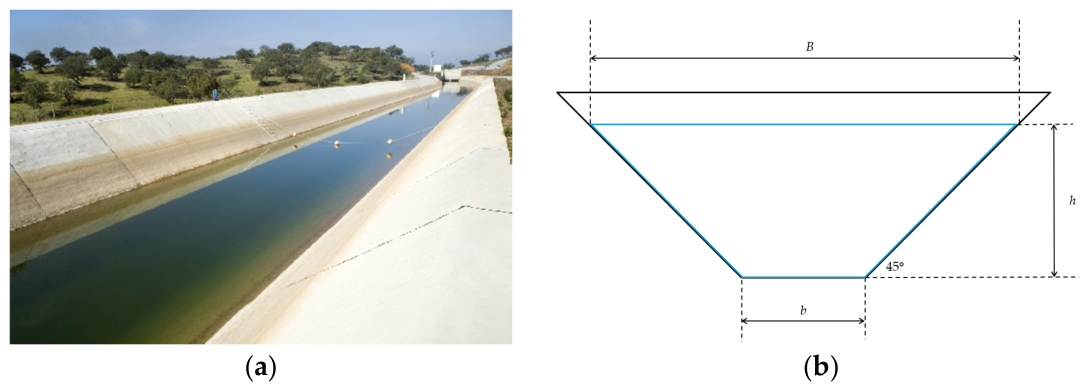
Figure 3.
Finishing construction operations in the channel: (a) Surface; (b) Joint.
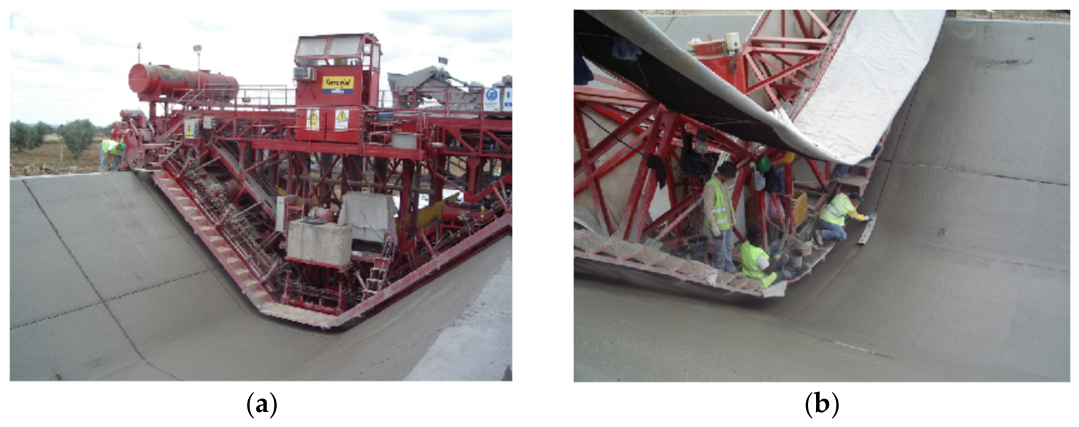
Figure 4.
Functional diagram of the flow rate measurement in the studied open channel.
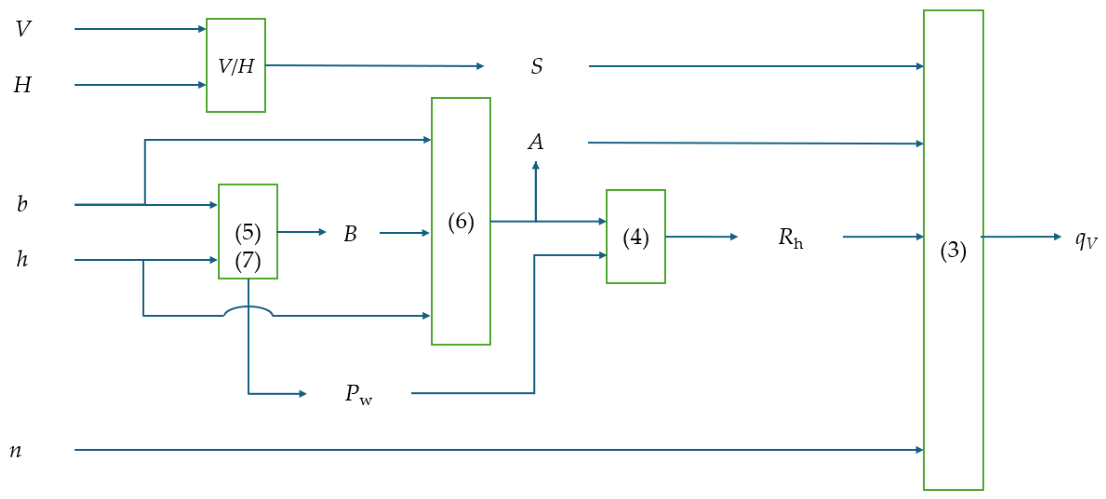
Figure 5.
Numerical dispersion of values related to Manning’s roughness coefficient for a concrete channel with: (a) trowel finish; (b) float finish.
Figure 5.
Numerical dispersion of values related to Manning’s roughness coefficient for a concrete channel with: (a) trowel finish; (b) float finish.
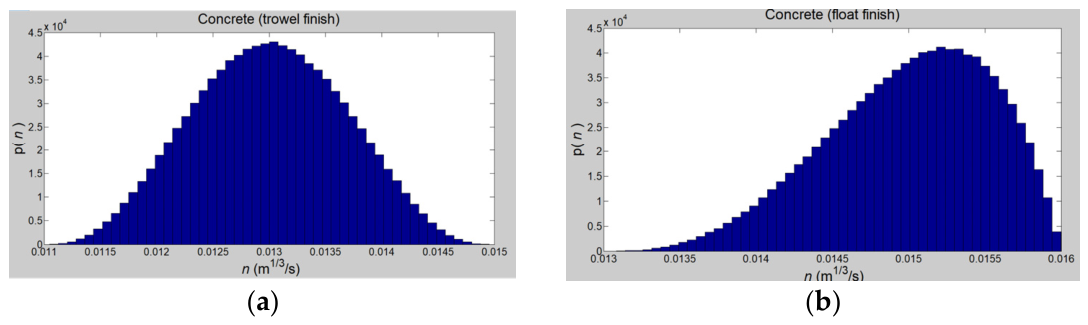
Figure 6.
Numerical dispersion of values related to Manning’s roughness coefficient for a concrete channel finished with: (a) gravel on bottom; (b) gunite (irrregular section).
Figure 6.
Numerical dispersion of values related to Manning’s roughness coefficient for a concrete channel finished with: (a) gravel on bottom; (b) gunite (irrregular section).
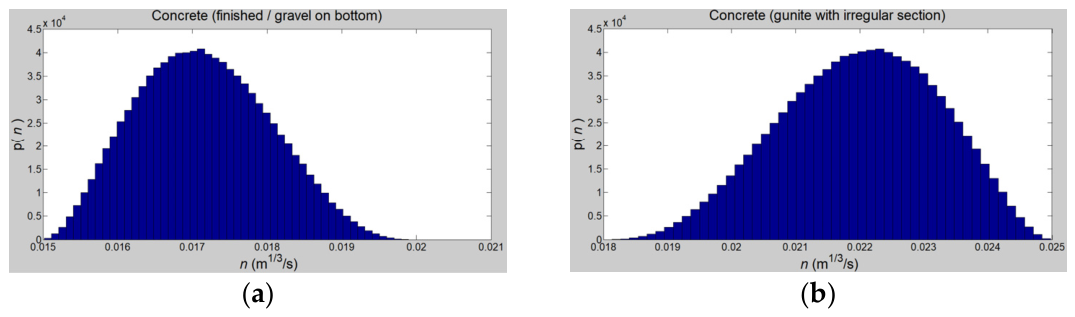
Figure 8.
Relationship between Manning’s roughness coefficient and flow rate measurement estimates and uncertainties, for the open channel studied (3.70 m flow depth) in concrete.
Figure 8.
Relationship between Manning’s roughness coefficient and flow rate measurement estimates and uncertainties, for the open channel studied (3.70 m flow depth) in concrete.
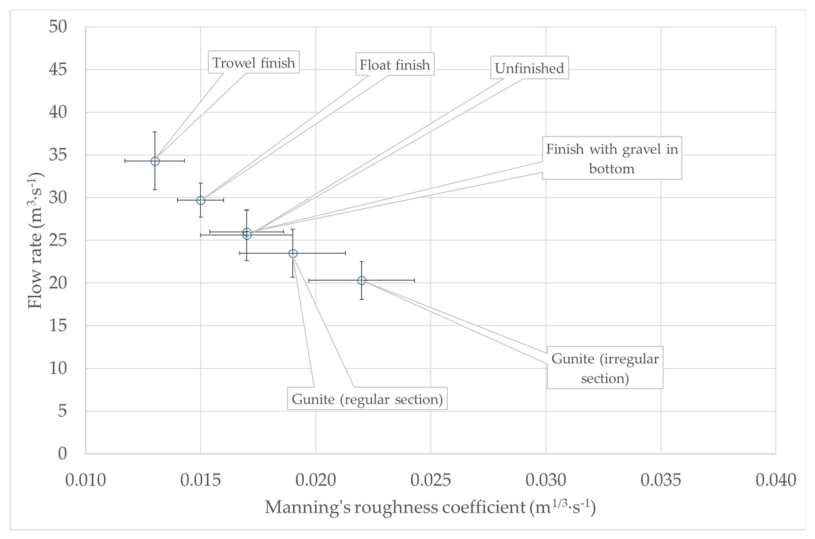
Figure 9.
Numerical dispersion of values related to the flow rate reduction, ΔqV, with: (a) moderate biofilm effect; (b) severe biofilm effect.
Figure 9.
Numerical dispersion of values related to the flow rate reduction, ΔqV, with: (a) moderate biofilm effect; (b) severe biofilm effect.
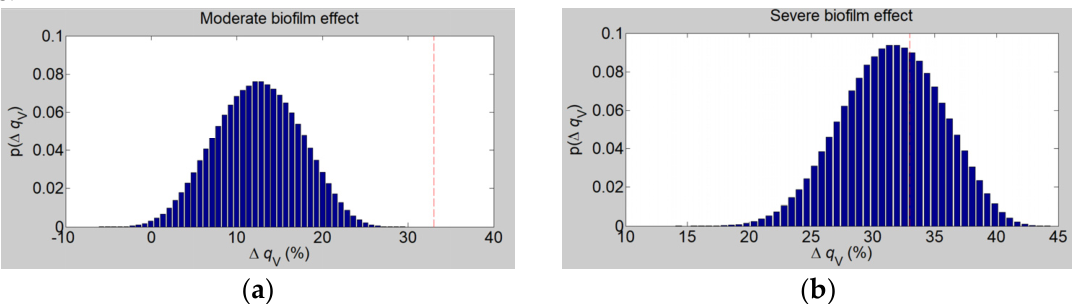

Table 1.
Manning’s roughness coefficients (in m1/3·s-1) for concrete open channels [5].
Table 1.
Manning’s roughness coefficients (in m1/3·s-1) for concrete open channels [5].
| Type of surface texture | Minimum | Expected value | Maximum |
|---|---|---|---|
| Trowel finish | 0.011 | 0.013 | 0.015 |
| Float finish | 0.013 | 0.015 | 0.016 |
| Finish with gravel in bottom | 0.015 | 0.017 | 0.020 |
| Unfinished | 0.014 | 0.017 | 0.020 |
| Gunite (regular section) | 0.016 | 0.019 | 0.023 |
| Gunite (irregular section) | 0.018 | 0.022 | 0.025 |
Table 2.
General design specifications of the Álamos-Loureiro channel [12].
Table 2.
General design specifications of the Álamos-Loureiro channel [12].
| Material | Shape | Bed width | Height | Slope |
|---|---|---|---|---|
| Concrete | Trapezoidal | 3.00 m | 4.50 m | 1.50 m / 10 800 m |
Table 3.
Probabilistic formulation of the dimensional and geometric input quantities.
| Quantity | Quantity and unit | Estimate | Distribution | Standard uncertainty |
|---|---|---|---|---|
| V | Slope vertical dimension (m) | 1.50 | Uniform | 0.002 9 m |
| H | Slope horizontal dimension (m) | 10 800 | Uniform | 0.29 m |
| b | Bed width (m) | 3.00 | Uniform | 0.002 9 m |
| h | Flow depth (m) | 3.70 | Uniform | 0.002 9 m |
Table 4.
Beta distribution parameters for Manning’s roughness coefficients (in m1/3·s-1) for concrete open channels.
Table 4.
Beta distribution parameters for Manning’s roughness coefficients (in m1/3·s-1) for concrete open channels.
| Type of surface texture | p1 | p2 |
| Trowel finish | 4.0 | 4.0 |
| Float finish | 4.7 | 2.3 |
| Finish with gravel in bottom | 3.1 | 4.6 |
| Unfinished | 4.0 | 4.0 |
| Gunite (regular section) | 3.3 | 4.5 |
| Gunite (irregular section) | 4.5 | 3.3 |
Table 5.
Manning’s roughness coefficients adopted for simulating the biofilm effect and the corresponding beta distribution parameters.
Table 5.
Manning’s roughness coefficients adopted for simulating the biofilm effect and the corresponding beta distribution parameters.
| Biofilm effect |
Minimum / m1/3·s-1 |
Expected / m1/3·s-1 |
Maximum / m1/3·s-1 |
p1 | p2 |
| Reduced | 0.011 | 0.013 | 0.015 | 3.4 | 4.4 |
| Moderate | 0.014 | 0.015 | 0.016 | 4.3 | 3.7 |
| Severe | 0.017 | 0.019 | 0.020 | 2.1 | 4.6 |
Table 6.
Measurement estimates and uncertainties of the intermediate quantities.
| Quantity | Quantity and unit | Average | Mode | 95% expanded uncertainty |
|---|---|---|---|---|
| S | Slope (m·m-1) | 1.428 6·10-4 | 1.425 0·10-4 | 0.004 5·10-4 |
| B | Top width (m) | 10.400 | 10.403 | 0.012 |
| A | Flow area (m2) | 24.790 | 24.775 | 0.057 |
| Pw | Wet perimeter (m) | 13.465 | 13.466 | 0.015 |
| Rh | Hydraulic radius (m) | 1.841 0 | 1.841 3 | 0.002 1 |
| n | Roughness coefficient (m1/3·s-1) | 0.013 0 | 0.013 4 | 0.001 3 |
Table 7.
Measurement estimates and uncertainties of the flow rate (m3·s-1).
| Average | Mode | 95% expanded uncertainty |
2.5% percentile | 97.5% percentile |
|---|---|---|---|---|
| 34.3 | 33.9 | 3.4 | 31.20 ± 0.012 | 37.93 ± 0.018 |
Table 8.
Measurement estimates and uncertainties of the flow rate (m3·s-1) for different magnitudes of biofilm effect.
Table 8.
Measurement estimates and uncertainties of the flow rate (m3·s-1) for different magnitudes of biofilm effect.
| Biofilm effect | Average | Mode | 95% expanded uncertainty |
|---|---|---|---|
| Reduced | 34.3 | 33.9 | 3.4 |
| Moderate | 30.0 | 30.0 | 1.3 |
| Severe | 23.4 | 23.1 | 1.3 |
Table 9.
Measurement estimates and uncertainties of the flow rate reduction for different magnitudes of biofilm effect.
Table 9.
Measurement estimates and uncertainties of the flow rate reduction for different magnitudes of biofilm effect.
| Biofilm effect | Average | Mode | 95% expanded uncertainty |
|---|---|---|---|
| Moderate | 12.5% | 12.2% | 9.5% |
| Severe | 31.5% | 31.4% | 7.8% |
Table 10.
Conformity assessment results.
| Biofilm effect | ΔqV | u(ΔqV) | α | Tu | Pc | Channel conformity |
| Moderate | 12.5% | 4.8% | 5% | 33% | 100% | Conform |
| Severe | 31.3% | 7.8% | 67% | Non-conform |
Disclaimer/Publisher’s Note: The statements, opinions and data contained in all publications are solely those of the individual author(s) and contributor(s) and not of MDPI and/or the editor(s). MDPI and/or the editor(s) disclaim responsibility for any injury to people or property resulting from any ideas, methods, instructions or products referred to in the content. |
© 2026 by the authors. Licensee MDPI, Basel, Switzerland. This article is an open access article distributed under the terms and conditions of the Creative Commons Attribution (CC BY) license (http://creativecommons.org/licenses/by/4.0/).
Copyright: This open access article is published under a Creative Commons CC BY 4.0 license, which permit the free download, distribution, and reuse, provided that the author and preprint are cited in any reuse.


