

Submitted:
01 July 2026
Posted:
02 July 2026
You are already at the latest version
Abstract
Pre-exercise internal cooling through cold water-induced hyperhydration may attenuate increases in core body temperature (TC) and improve endurance performance. Quantifying the extent of reduction in TC induced by hyperhydration is important for optimizing its timing before exercise. We compared TC values obtained from a wearable sensor, the CORE, with those of a gastrointestinal temperature telemetric sensor (GTS) during hyperhydration. Eleven participants (2 women; age: 24 ± 4 yrs) completed a 120 min seated period where they consumed, over the first 60 min, four boluses of 4 °C water (7.5 mL · kg fat-free mass [FFM]⁻¹), each containing 0.35 g · kg FFM⁻¹ of glycerol. Measures of TC were taken every 20 min with both sensors. According to the GTS, hyperhydration induced a peak TC decline of − 0.76 ± 0.31 °C at min 60; at this time, the change in TC from baseline estimated by the CORE was − 0.09 °C ± 0.20 °C. The greatest decline in TC detected by the CORE was − 0.11 ± 0.19 °C. Bland and Altman analyses revealed that average TC declines of − 0.2, − 0.3, − 0.4, − 0.5 and − 0.6 °C from baseline were associated with TC values estimated by the CORE that were respectively + 0.41, + 0.57, + 0.65, + 0.77 and + 0.89 °C higher than the GTS. An intraclass correlation coefficient of 0.12 suggested poor agreement between instruments. These results raise concerns about the ability of the CORE to detect changes in TC induced by a hyperhydration protocol generating a substantial heat sink.
Keywords:
cold water ingestion
; exercise
; heat flux sensors
; heat stress
; pre-exercise cooling
; wearable sensors
1. Introduction
Exercise performed in hot and humid conditions, particularly when interspersed with periods of high-intensity efforts, can predispose athletes to marked elevations in core body temperature (TC), which could potentially compromise endurance performance [1]. Various strategies can be used by athletes to attenuate the increases in TC and better sustain performance under such scenarios; pre-exercise internal cooling via the ingestion of large volumes of cold fluid (hyperhydration) or ice slurry is one of them [2]. Indeed, hyperhydration and ice slurry ingestion have been shown to lower TC before exercise [3,4,5,6]. Moreover, the volume of cold substances entering the body creates a heat sink that enables increasing body heat storage capacity. In turn, this can potentially allow greater physical work to be done before reaching a TC that compromises the maintenance of an exercise intensity judged satisfactory to sustain performance [2].
Monitoring the impact of a pre-exercise cooling strategy on the reduction in TC is important and may have important implications from a performance perspective [7,8]. First, it can help athletes choose the most effective pre-exercise internal cooling strategy possible. Next, understanding the kinetics of the reduction in TC associated with a given internal cooling strategy may help optimize its ingestion timing so that exercise begins in a state of maximal cooling. Finally, it may help athletes plan an optimal pacing strategy for the upcoming exercise. Indeed, the magnitude of the reduction in TC induced by an internal cooling strategy could be used by athletes as an indicator to estimate how long they may be able to sustain an exercise intensity that they would not normally dare to maintain under conditions in which the body had not been cooled before exercise.
Because of either their invasive nature, need for trained personnel, lack of practicality, the discomfort they may cause, or their high cost, traditionally used and accepted methods to monitor changes in TC during clinical and exercise settings [9,10,11], i.e., rectal, gastrointestinal or oesopheagal sensors, cannot be used routinely and on a large scale in field settings. Nevertheless, wearable sensors are now available to provide estimates of TC under real world context [12,13], and these devices could be used by athletes to monitor the impact of pre-exercise cooling. Over the last 5 yrs, the CORE (greenteg, Zürich, Switzerland), a wearable sensor designed to estimate TC, has received a great deal of scientific attention. Indeed, it has been the object of several validity and reliability studies conducted under various settings such as during intensive care, sleeping, free living, resting and exercise conditions [14,15,16,17,18,19,20,21,22,23,24,25,26,27,28].
To the best of our knowledge, no study has yet examined the validity of the CORE sensor under resting conditions involving cold water-induced hyperhydration, which produces a substantial internal heat sink. This seems relevant, as athletes represent part of the target market of the manufacturer of the CORE sensor, thereby rendering them susceptible to use the device under conditions of internal cooling. The CORE derives estimates of TC based on an algorithm relying on heart rate, the single-heat-flux method and skin temperature [12,25]. Internal cooling may reduce TC while producing limited changes in skin heat flux, skin temperature and heart rate [5,29]. Consequently, the CORE sensor may have difficulty detecting changes in TC under these specific conditions.
Interestingly, our laboratory has recently demonstrated that the CORE was insensitive to a 0.26 °C decline in TC induced by the ingestion of 7.5 mL · kg fat-free mass (FFM)−1 of cold water (4 °C) [19]. However, since the amount of water ingested was small and the decline in TC remained within the superior range of the normal daily variation in gastrointestinal or rectal temperatures, i.e., ± 0.25 °C [30], and the mean bias between instruments was lower than the ± 0.27 °C value often regarded as worthwhile in the literature [9,10], it would be premature and inadequate to infer from these results regarding the ability of the CORE to detect decreases in TC induced by potent internal cooling interventions.
Therefore, the purpose of this study was to compare the changes in TC measured by a gastrointestinal temperature telemetric sensor (GTS) and the CORE during a hyperhydration period at rest designed to induce a substantial decline in TC. It was hypothesized that TC measured by the CORE and the GTS would differ by more than the established threshold for a worthwhile practical difference between instruments, i.e., ± 0.27 °C.
2. Materials and Methods
Participants
Eleven individuals (2 women) participated in this study. Their mean age, height, body mass, and FFM were respectively 24 ± 4 yrs, 175 ± 9 cm, 67 ± 8 kg and 58 ± 8 kg. Prior to participating in the study volunteers were required to read a consent form and subsequently a verbal and written consent was obtained. The study was approved by the CIUSSS Estrie-CHUS Ethics Committee (2020-3606). The women completed the experiments in the follicular phase of their menstrual cycle.
Procedures
Context of the study
The current findings represent a secondary analysis of results from a study which compared the effect of pre-exercise hyperhydration and euhydration during a subsequent 5 km running time-trial performance [31]. Herein, we report results pertaining only to the hyperhydration phase and describe the technical procedures only relevant to the current study.
Preliminary Visit
Volunteers completed a preliminary visit where height (standard stadiometer), body mass (BX-300+, Atron Systems, West Caldwell, NJ, USA) and FFM (Lunar Prodigy, GE Healthcare, Chicago, IL, USA) were measured. At the end of the visit volunteers were required to return to the laboratory at 7-day intervals and always at the same time of day to complete two experimental trials administered in a randomized, counterbalanced and crossover fashion: one in which they began a 5 km running time-trial in a euhydrated state, and another in which they began the running time-trial in a hyperhydrated state.
Experiments
Prior to each experiment, diet, training, sleeping and hydration were controlled for, as previously explained [31]. Immediately after arriving at the laboratory, volunteers voided their bladder, collected a urine sample, body mass was measured, a heart rate chest strap was attached to the torso and the temperature and humidity level of the laboratory were measured (Extech H30, Flir, Goleta, CA, USA). Then, participants were seated for a 10 min stabilisation period, after which measures of heart rate and TC derived from the GTS and CORE were taken. Following these procedures, volunteers began a 120 min seated period during which they consumed, every 20 min over the first 60 min, four boluses of 4 °C water, each provided at a dose of 7.5 mL · kg FFM⁻¹ with 0.35 g · kg FFM⁻¹ of glycerol [32]. Every 20 min thereafter, measures of heart rate, TC, urine volume and body mass (post-void) were taken.
Measurements
Core body temperature was measured with GTS (CorTemp, HQ Inc., Palmetto, FL, USA). When compared to rectal temperature, the GTS has been demonstrated to represent a valid index of TC [33]. To avoid any interaction with fluid intake, participants ingested the GTS 10 h prior to their arrival at the laboratory [34,35]. Gant, Atkinson [35] reported no apparent differences between rectal and gastrointestinal temperatures after the repeated ingestion of 4 °C water before and within bouts of exercise when the GTS were ingested 10 h prior to experiment commencement. Similarly, when the GTS were ingested 8 h before the onset of experiment, O’Brien, Goosey-Tolfrey [36] demonstrated that the consumption of 6.8 g · kg−1 of ice slurry during recovery following passive heating did not produce any relevant differences between the fall in rectal and gastrointestinal temperatures. Telemetric gastrointestinal temperature signals were recorded with a single CorTemp Data Recorder (HQ Inc, Palmetto, FL, USA). Each GTS was calibrated before the beginning of the experiment. Calibration was performed at four different temperatures (37, 38, 39, and 40 °C) in a heated bath (Precision 281, Thermo Scientific, MA, USA) using a high precision, partial immersion, non-mercury glass thermometer (Thermo Scientific Ertco, USA). A 4-point regression line was used to predict gastrointestinal temperature [37]. A single CORE wearable sensor, bought in April 2021, was used for the current study. As recommended by the manufacturer, the CORE was 1) clipped to the chest strap, ~ 20 cm below the left armpit, 2) applied to the skin 10 min prior to the first data collection and; 3) operated paired with signals from the heart rate monitor. Heart rate was measured using a Garmin Premium chest electrode (Garmin, Olathe, KS, USA). Urine specific gravity was assessed using a digital refractometer (PAL-10S, Atago, Bellevue, WA, USA). Urine volume was measured with a graduate urinal. Body mass was evaluated with a high precision digital platform scale (BX-300+, Atron Systems, West Caldwell, NJ, USA). Accumulated fluid retention at each measurement time point was computed by subtracting the accumulated urine volume from the accumulated fluid intake.
Statistical Analysis
A linear mixed-effects model with random intercepts for volunteers was used to analyze the effect of time and sensors as well as their interaction on TC. Time, sensors and their interaction were treated as fixed effects. A linear mixed-effects model with random intercepts for volunteers was used to analyze the effect of time on accumulated fluid retention, urine volume, and heart rate. Time was treated as a fixed effect. For the above analysis, we used a scaled identity covariance structure to model the repeated measurements. Moreover, a variance components matrix was selected for the covariance structure of the random intercepts. The distribution of residuals was verified with a Shapiro-Wilk test as well as visualization of the Q-Q plot. If relevant, post-hoc analyses were performed using the false discovery rate procedure [38]. Data for these analyses are presented as mean ± standard deviation (SD). Statistical significance was considered as p ≤ 0.05. For describing the relative validity of the CORE, a repeated measures correlation [39] as well as an intraclass correlation coefficient (two-way mixed, absolute agreement, single measure) were computed. The correlation coefficient was interpreted as specified by Akoglu [40] and the intraclass correlation coefficient as specified by Koo and Li [41]. For description of absolute validity, the bias in measurement between sensors, the typical within-subjects variation in measurement and Bland and Altman 95% limits of agreement were calculated. The bias between sensors represents the difference between two comparisons. The typical within-subjects variation in measurement was taken as the square root of the residual covariance obtained from the linear mixed-effects model comparing sensors [42]. For the Bland and Altman-related data, we first examined the relationship over time between the differences in TC observed between sensors and their averages. A marked heteroscedastic pattern was identified, indicating that the bias between sensors was dependent upon the changes in TC. Therefore, as recommended by Bland and Altman, a regression approach for non-uniform differences was applied to determine the biases and associated standard deviations [43]. Because repeated measurements were performed within individuals over time with both sensors, a linear mixed-effects model with random intercepts for volunteers was used to derive the regression equations and associated standard deviations between the sensor’s differences and their averages, as specified by Myles and Cui [44]. The average TC between sensors was taken as the covariable. A variance components matrix was selected for the covariance structure of the random intercepts. No additional covariance structure was specified for the repeated measurements, thereby allowing estimation of a single residual variance for the differences around the predicted bias. Two Bland-Altman plots were generated. The first examined the relationship between the average TC values of the GTS and the CORE and the differences in TC between the CORE and the GTS over the entire 120 min sitting period. The maximal decline in TC measured by the GTS occurred at min 60. Hence, agreement between the CORE sensor and the GTS was also examined for changes between min 60 and baseline. For each time point (i.e., 20, 40 and 60 min), changes in TC were calculated relative to baseline for each device, and Bland and Altman analyses were performed on the differences between changes. This approach allowed us to determine whether the CORE sensor accurately tracked the magnitude of the reduction in TC induced by cold-water hyperhydration. A TC difference of ± 0.27 °C or 95% limits of agreement of ± 0.27 °C between sensors was considered practically meaningful [9,10,45,46]. Analyses were conducted using Microsoft Excel (version 2502, Redmond, WA, USA), R studio (version 2026.01.2, Posit Team) and IBM SPSS Statistics (version 21, New York, NY, USA).
3. Results
Ambient conditions, hydration state at arrival at the laboratory, glycerol ingestion, fluid intake, urine production, accumulated fluid retention, and heart rate
Mean temperature and relative humidity during the sitting period were 21.8 ± 0.3 °C and 58.0 ± 6.7%, respectively. Volunteers were apparently well hydrated at their arrival at the laboratory. Indeed, the mean urine specific gravity value (1.013 ± 0.007) suggested that the kidneys were not in a state of significant water conservation. Volunteers ingested a total of 82.6 ± 14.0 g of glycerol (1.2 ± 0.1 g · kg body mass−1) with 1762 ± 292 mL (26.4 ± 3.0 mL · kg body mass−1) of cold water. There was a significant time effect for urine production, accumulated fluid retention, and heart rate (all p < 0.01). Urine production peaked at min 60 with a volume of 292 ± 116 mL, which was significantly different from times 0, 20, 40, 100 and 120 (all p < 0.01).
Accumulated fluid retention increased continuously until min 80 where it culminated at 1014 ± 541 mL. This volume was significantly greater than those observed at 0, 20, 40, 100 and 120 min (all p ≤ 0.03). After 120 min, accumulated fluid retention reached 645 ± 546 mL, with a total volume of urine produced of 1143 ± 418 mL. Heart rate changes during the sitting period are shown in Figure 1. Heart rate decreased from 74 ± 7 to 62 ± 7 beats · min−1 during the first 40 min of the sitting period after which it remained relatively stable fluctuating between 58 and 64 beats · min−1. Post-hoc comparisons revealed a significant difference between min 0 and all other timepoints (all p < 0.01), and min 100 with timepoints 20 and 120 min (both p < 0.02).
Comparison between thegastrointestinal telemetric sensor and CORE data
Figure 2 shows the changes in TC monitored with the GTS and CORE during the 120 min sitting period. Statistically significant effects of time (p < 0.01), sensors (p = 0.046) and interaction (p < 0.01) were observed.
Hyperhydration was successful in achieving internal body cooling. In fact, the GTS demonstrated a change in TC of − 0.76 ± 0.31 °C between min 0 and 60 (p < 0.01). On the other hand, the change in TC from min 0 to 60 with the CORE was only of − 0.09 °C ± 0.20 °C (p = 0.35). The peak decline in TC captured by the CORE was of − 0.11 ± 0.19 °C, which occurred at min 120. The CORE demonstrated no significant change in estimated TC throughout the hyperhydration period, compared with baseline (all p ≥ 0.19). On the other hand, with the GTS, all timepoints differed significantly from the baseline value (all p < 0.01). Mean TC during the entire 120 min sitting period was 37.04 ± 0.39 °C with the GTS, and 36.98 ± 0.12 °C with the CORE (p = 0.046). Post-hoc analyses revealed a significant difference between sensors at min 0, 20, 60, 80 and 120 (all p ≤ 0.02).
For all comparisons combined, i.e., 0-120 min, the typical within-subjects variation in measurement was of the order of 0.19 °C, the repeated measures correlation between sensors was not statistically significant (p = 0.07) and poor with a rrm = 0.22, and the intraclass correlation coefficient was also poor at 0.12 (p = 0.15). Figure 3 shows the individual responses of all 11 participants to the hyperhydration periods, as measured by the GTS and the CORE. Only two participants, 4 and 6, showed a response with the CORE that appeared consistent with the initial pattern of change in TC expected following the use of an internal cooling strategy, namely a relatively sharp decline in TC. In the remaining 9 participants, fluctuations in CORE-derived TC relative to baseline were minimal throughout the hyperhydration period. Panels 6 and 7 represent the data for women.
Figure 4 illustrates a Bland and Altman plot showing the relationship between the averages TC measured with the GTS and CORE and the magnitude of the differences in TC observed between the CORE and the GTS.
These results indicate that the bias between the CORE and the GTS was inversely proportional to the average value of TC measured by the CORE and the GTS. More specifically, based on the line of no difference between sensors, the CORE started overestimating TC below an average TC of ~36.96 °C, whereas the opposite was observed at TC above 36.96 °C. Nevertheless, between average TC values of ~36.78 and 37.14 °C, the CORE showed no measurement difference compared with the GTS that fell within the range considered unacceptable from a physiological standpoint, i.e., ± 0.27 °C. In the context of Figure 3, 55% of the differences between the GTS and the CORE were within ± 0.27 °C.
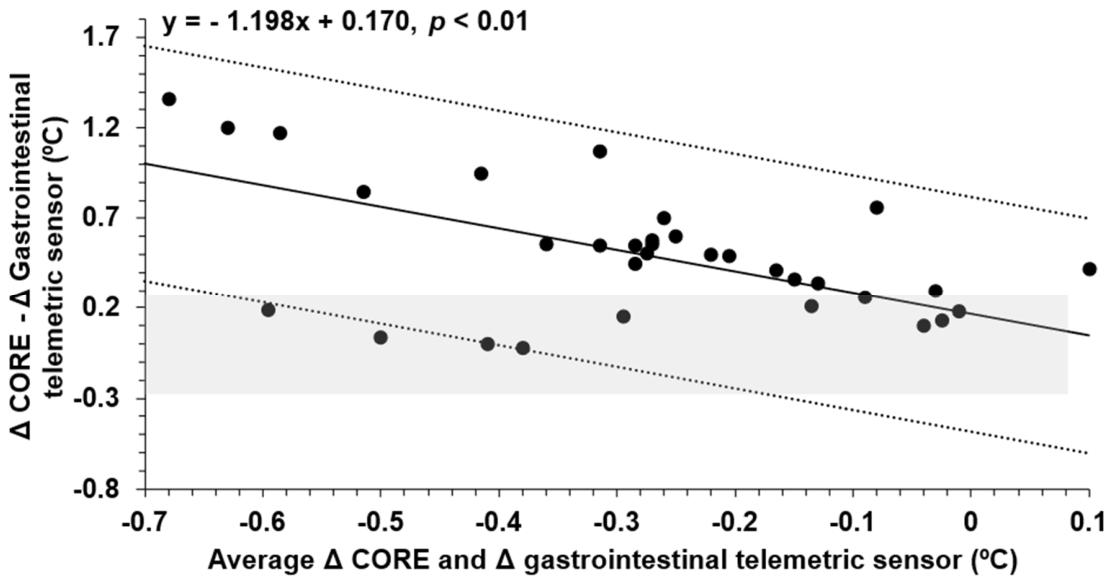
The Bland and Altman plot shown in Figure 5 indicates that the CORE had difficulty capturing the substantial declines in TC that occurred during the first 60 min of the seated period. Indeed, for average TC declines of − 0.1, − 0.2, − 0.3, − 0.4, − 0.5 and − 0.6 °C from baseline, the TC values estimated by the CORE were respectively + 0.29 (95% limits of agreements, − 0.36-0.94 °C), + 0.41 (− 0.24-1.06 °C), + 0.57 (− 0.08-1.22 °C), + 0.65 (0.00-1.30 °C), + 0.77 (0.12-1.42 °C), and + 0.89 °C (0.24-1.54 °C) higher than the GTS. Finally, during the first 60 min of the sitting period, only 30% of the TC differences between the Δ GTS and the Δ CORE fell within limits considered irrelevant from a practical perspective.
4. Discussion
This study aimed to determine whether the CORE wearable sensor could detect the decline in TC induced by a potent internal cooling strategy, specifically cold water-induced hyperhydration. The main finding was that, despite a marked reduction in GTS-derived TC during the first 60 min of the sitting period, the CORE showed difficulties in detecting the declines in TC. More specifically, while the GTS detected a substantial decline in TC of 0.76 °C from min 0 to 60, the corresponding change measured by the CORE was only of − 0.11 °C. These results raise doubts about the ability of the CORE to detect rapid reductions in TC induced by hyperhydration with cold water at rest.
The present findings extend previous observations from our laboratory, which suggested that the CORE showed limited ability to detect a modest 0.26 °C reduction in TC induced by the ingestion of a smaller dose of cold water [19], i.e., 7.5 mL · kg FFM−1 at 4 °C. In that earlier context, any conclusion that the CORE was likely unable to detect this decrease in TC remained largely speculative and could not reasonably be extended to potent internal cooling strategies, given that the magnitude of the observed change was at the lower limit of the normal daily variation in TC (i.e., ± 0.25 °C, [30]) and lower than the ± 0.27 °C value often regarded as worthwhile in the literature [9,10,30].
In the present study, however, a peak hyperhydration level of 1014 mL of 4 °C water combined with glycerol induced a much larger decline in TC, i.e., − 0.76 °C, thereby providing a stronger test of the device’s ability to detect internal cooling. Despite this pronounced decline in TC, the CORE still showed problems to reflect the magnitude and kinetics of the reduction in TC demonstrated by the GTS. To provide support to this observation, the mixed-effects linear model revealed a clear statistically significant effect for interaction (i.e., p < 0.01) between sensors despite the small sample size of the current study. The repeated measures correlation assessing the association between the TC of the two sensors was poor, thereby suggesting that the responses of the sensors did not move strongly together. The intraclass correlation coefficient was also poor, indicating that agreement between sensors was not strong. Finally, among the eleven individual responses reported, only two suggest that the CORE may detect declines in TC following hyperhydration. Taken together, these findings suggest that the limitations of the CORE are potentially not only restricted to detecting very small changes in TC induced by internal cooling strategies, but also extend to larger declines that are clearly meaningful from both a physiological and practical perspective. Studies with larger sample sizes will need to be conducted to confirm the current findings.
One important observation from the current study is that the bias between the CORE and the GTS was not constant across the range of the average TC measured. This heteroscedastic pattern is particularly problematic because it indicates that the disagreement between sensors is not random, but rather systematically related to the underlying TC. For instance, close examination of the Bland and Altman illustrated in Figure 4 reveals that the CORE began to overestimate TC below a mean TC of ~36.98 °C and to underestimate it above this threshold. Moreover, data deriving from the Bland and Altman depicted in Figure 5 indicate that average TC declines of between − 0.1 to − 0.6 °C from baseline over the first 60 min of hyperhydration were associated with TC values estimated by the CORE that were all above changes suggesting a decline in TC, as well as being above the acceptable agreement between sensors of ± 0.27 °C. These observations are contrary to what should be expected of temperature sensors from an accuracy standpoint following the use of a potent internal cooling strategy, i.e., be able to detect a decrease in TC. From an applied standpoint, these results suggest that the CORE could provide the false impression that TC is stable during cold water-induced hyperhydration when it is in fact decreasing meaningfully. This limitation may be especially relevant in the context where athletes or practitioners seek to monitor the effectiveness of a pre-exercise cooling strategy and optimize its timing before competition.
The lack of sensitivity of the CORE to internal body cooling likely relates, at least in part, to the nature of the physiological signals on which its algorithm is based. Indeed, the device estimates TC from heart rate, the single-heat-flux technique, and skin temperature. The role of heart rate in the algorithm used by the CORE to estimate the changes in TC during exercise is likely substantial. Indeed, during exercise, increases in metabolic heat production, which dictate the magnitude of TC elevation [47], are closely associated with rises in heart rate [48]. Accordingly, algorithms have previously been developed to estimate TC during exercise using changes in heart rate [49,50]. In the present study, however, substantial changes in TC occurred concomitantly with only relatively trivial changes in heart rate, as shown in Figure 1. Thus, the contribution of heart rate to the prediction of TC changes could only be limited, as supported by our findings. The effect of cold fluid or ice slurry ingestion on mean skin temperature under resting conditions in thermoneutral conditions appears to be relatively trivial [4,5,51]. Therefore, this observation suggests that this variable could not have played an important role in the estimation of the changes in TC in the current study, although we recognize that we did not monitor skin temperature during the hyperhydration period. Finally, considering our results, it must be acknowledged that skin heat flux likely played a negligible role in the ability of the CORE to estimate the changes in TC in the context of the present study. This is not surprising, as internal cooling acts to extract heat internally and, as a result, heat flux from the core to the skin decreases. Accordingly, our results suggest that the CORE may have difficulties dealing with decreases in skin heat flux, at least with those of the magnitude produced by hyperhydration with cold water. Altogether, these results suggest that the current algorithm used by the CORE may not be fully suited to predicting changes in TC occurring during internal cooling at rest.
Another noteworthy finding of the current study is that only 33% of TC differences between sensors from baseline values during the first 60 min of cooling were within ± 0.27 °C. This observation reinforces the conclusion that the CORE lacked acceptable agreement with the GTS, and this precisely during the period when accurate monitoring was most needed. In addition, and importantly, although the difference in average TC over the 120 min sitting period was trivial between sensors, this lack of difference should not be construed as evidence of validity, as the CORE showed difficulties in adequately reproducing the true temporal changes in TC measured by the GTS.
This study has some limitations that must be acknowledged. The sample size was relatively small and included only 11 participants. Therefore, all findings of the current study must be interpreted with this in mind. Nevertheless, the individual results reported in Figure 3 suggest a tendency supporting the possibility that the CORE may have difficulty capturing declines in TC during a period of internal cooling. Results of the current study apply specifically to an internal cooling strategy using hyperhydration at rest in temperate laboratory conditions. It remains to be determined whether the CORE would behave differently with other internal cooling strategies used under similar or different surrounding temperatures. Finally, despite that the use of a GTS provided a strong reference against which to assess the validity of the CORE, it is not impossible that different results would have been observed had the reference method been rectal temperature. However, it has been demonstrated that gastrointestinal temperature represents a valid index of TC compared with rectal temperature, and that both body areas may respond similarly to internal body cooling [35,36,52].
5. Conclusions
In conclusion, the present study suggests that the CORE wearable sensor may have a limited ability to detect the decline in TC induced by pre-exercise hyperhydration with cold water. Therefore, caution may be warranted when using the CORE to assess the effectiveness of cold water-induced hyperhydration or to inform performance-related decisions following the use of this internal cooling strategy. Future studies with larger sample sizes are needed to confirm our findings. Moreover, it would be interesting to test the capability of the CORE under scenarios of external body cooling.
Author Contributions
Conceptualization and methodology, EDBG.; formal analysis, EDBG.; investigation, AJD, TAD and TP.; resources, EDBG.; data curation, EDBG, writing—original draft preparation, EDBG.; writing—review and editing, AC, AJD, EDBG, MEP, TAD, TE, and TP.; supervision, EDBG.; project administration, EDBG.; funding acquisition, EDBG.
Funding
This research was funded by the University of Sherbrooke.
Institutional Review Board Statement
The study was conducted in accordance with the Declaration of Helsinki, and approved by the CIUSSS Estrie-CHUS Ethics Committee (#2020-3606) for studies involving humans.
Informed Consent Statement
Informed consent was obtained from all volunteers involved in the study.
Data Availability Statement
The raw data supporting the conclusions of this article will be made available by the authors on request.
Acknowledgments
The authors wish to thank all volunteers who participated in this study.
Conflicts of Interest
The authors declare no conflicts of interest. The funder had no role in the design of the study; in the collection, analyses, or interpretation of data; in the writing of the manuscript; or in the decision to publish the results”.
Abbreviations
The following abbreviations are used in this manuscript:
| CT | Core body temperature |
| FFM | Fat-free mass |
| GTS | Gastrointestinal temperature telemetric sensor |
| SD | Standard deviation |
References
- Périard JD, Eijsvogels TMH, Daanen HAM. Exercise under heat stress: thermoregulation, hydration, performance implications, and mitigation strategies. Physiol Rev. 2021;101(4):1873-979.
- Bongers CC, Thijssen DH, Veltmeijer MT, Hopman MT, Eijsvogels TM. Precooling and percooling (cooling during exercise) both improve performance in the heat: a meta-analytical review. British journal of sports medicine. 2015;49(6):377-84.
- Byrne C, Owen C, Cosnefroy A, Lee JK. Self-paced exercise performance in the heat after pre-exercise cold-fluid ingestion. Journal of athletic training. 2011;46(6):592-9.
- Lee JK, Shirreffs SM, Maughan RJ. Cold drink ingestion improves exercise endurance capacity in the heat. Med Sci Sports Exerc. 2008;40(9):1637-44.
- Siegel R, Maté J, Brearley MB, Watson G, Nosaka K, Laursen PB. Ice slurry ingestion increases core temperature capacity and running time in the heat. Med Sci Sports Exerc. 2010;42(4):717-25.
- Yeo ZW, Fan PW, Nio AQ, Byrne C, Lee JK. Ice slurry on outdoor running performance in heat. Int J Sports Med. 2012;33(11):859-66.
- Roriz M, Brito P, Teixeira FJ, Brito J, Teixeira VH. Performance effects of internal pre- and per-cooling across different exercise and environmental conditions: A systematic review. Frontiers in Nutrition. 2022;Volume 9 - 2022.
- Bongers CC, Hopman MT, Eijsvogels TM. Cooling interventions for athletes: An overview of effectiveness, physiological mechanisms, and practical considerations. Temperature (Austin). 2017;4(1):60-78.
- Casa DJ, Becker SM, Ganio MS, Brown CM, Yeargin SW, Roti MW, et al. Validity of devices that assess body temperature during outdoor exercise in the heat. Journal of athletic training. 2007;42(3):333-42.
- Ganio MS, Brown CM, Casa DJ, Becker SM, Yeargin SW, McDermott BP, et al. Validity and reliability of devices that assess body temperature during indoor exercise in the heat. Journal of athletic training. 2009;44(2):124-35.
- Lim CL, Byrne C, Lee JK. Human thermoregulation and measurement of body temperature in exercise and clinical settings. Ann Acad Med Singap. 2008;37(4):347-53.
- Hashimoto Y. A Comprehensive Review of Non-Invasive Core Body Temperature Measurement Techniques. Sensors (Basel). 2026;26(3).
- Dolson CM, Harlow ER, Phelan DM, Gabbett TJ, Gaal B, McMellen C, et al. Wearable Sensor Technology to Predict Core Body Temperature: A Systematic Review. Sensors (Basel). 2022;22(19).
- Daanen HAM, Kohlen V, Teunissen LPJ. Heat flux systems for body core temperature assessment during exercise. J Therm Biol. 2023;112:103480.
- Ehlers UE, Ulmer J, Keller M, Klein C, Pietsch U. Comparison of continuous temperature measurement methods in the intensive care unit: standard bladder catheter measurements versus non-invasive transcutaneous sensors. J Clin Monit Comput. 2025;39(1):193-203.
- Etienne S, Oliveras R, Schiboni G, Durrer L, Rochat F, Eib P, et al. Free-living core body temperature monitoring using a wrist-worn sensor after COVID-19 booster vaccination: a pilot study. Biomed Eng Online. 2023;22(1):25.
- Goods PSR, Maloney P, Miller J, Jennings D, Fahey-Gilmour J, Peeling P, et al. Concurrent validity of the CORE wearable sensor with BodyCap temperature pill to assess core body temperature during an elite women’s field hockey heat training camp. Eur J Sport Sci. 2023;23(8):1509-17.
- Januário WM, Lessa NF, Schittine AJdO, Prata ERBdA, Marins JCB, Natali AJ, et al. Validity and reproducibility of the CALERA Research Sensor to estimate core temperature at different intensities of a cycling exercise in the heat. Journal of Thermal Biology. 2024;123:103907.
- Jolicoeur Desroches A, Naulleau C, Deshayes TA, Pancrate T, Goulet EDB. CORE™ wearable sensor: Comparison against gastrointestinal temperature during cold water ingestion and a 5 km running time-trial. J Therm Biol. 2023;115:103622.
- Kaltsatou A, Anifanti M, Flouris AD, Xiromerisiou G, Kouidi E. Validity of the CALERA Research Sensor to Assess Body Core Temperature during Maximum Exercise in Patients with Heart Failure. Sensors (Basel). 2024;24(3).
- Kubota N, Okada K, Yamanaka Y. Circadian Phase Assessment of Core Body Temperature Using a Wearable Temperature Sensor Under the Real World. Sleep Sci. 2025;18(3):e246-e52.
- McLaughlin BC, Aguilera JT, D’Lugos AC. Validity of the CORE wearable sensor during constant-load cycling exercise in the heat. J Therm Biol. 2025;132:104241.
- Priego-Quesada JI, MacKay N, Adejuwon DC, Keir DA. Effect of aerobic fitness on the validity of the Calera Research™ sensor to estimate core temperature during exercise. Journal of Thermal Biology. 2025;127:104067.
- Richard NA, Cheung SS, Claydon VE, Koehle MS, Coté AT. Accuracy and Precision of the SlateSafety BandV2 and CORE Devices in Estimating Resting and Moderate Hyperthermic Exercise Temperature in Eumenorrheic Females. Int J Sports Physiol Perform. 2025;20(8):1068-78.
- Verdel N, Podlogar T, Ciuha U, Holmberg HC, Debevec T, Supej M. Reliability and Validity of the CORE Sensor to Assess Core Body Temperature during Cycling Exercise. Sensors (Basel). 2021;21(17).
- Wolfe C, Watkins E, Halsey L, Tyler CJ. Is wearable technology the future of body core temperature measurement? An analysis of multiple commercial devices. An analysis of multiple commercial devices.
- Xie T, Xu Y, Zhen M, Zhu H, Tian Z, Cheng Y, et al. Performance of a wearable CORE sensor for nocturnal core temperature monitoring during sleep. J Therm Biol. 2026;139:104477.
- Xu H, Xu Y, Wang H, Lei T-H, Wang F. Validity of the wearable CORE temperature sensor during 8-hour indoor heat exposure with and without electric fan use. Building and Environment. 2025;282:113288.
- Savoie FA, Asselin A, Goulet ED. Comparison of Sodium Chloride Tablets-Induced, Sodium Chloride Solution-Induced, and Glycerol-Induced Hyperhydration on Fluid Balance Responses in Healthy Men. Journal of strength and conditioning research / National Strength & Conditioning Association. 2016;30(10):2880-91.
- Edwards B, Waterhouse J, Reilly T, Atkinson G. A comparison of the suitabilities of rectal, gut, and insulated axilla temperatures for measurement of the circadian rhythm of core temperature in field studies. Chronobiology international. 2002;19(3):579-97.
- Jolicoeur Desroches A, Naulleau C, Deshayes TA, Parent-Roberge H, Pancrate T, Goulet EDB. Effect of Glycerol-Induced Hyperhydration on a 5-kilometer Running Time-Trial Performance in the Heat in Recreationally Active Individuals. Nutrients. 2023;15(3).
- Savoie FA, Dion T, Asselin A, Goulet ED. Sodium-induced hyperhydration decreases urine output and improves fluid balance compared with glycerol- and water-induced hyperhydration. Applied physiology, nutrition, and metabolism = Physiologie appliquee, nutrition et metabolisme. 2015;40(1):51-8.
- Byrne C, Lim CL. The ingestible telemetric body core temperature sensor: a review of validity and exercise applications. British journal of sports medicine. 2007;41(3):126-33.
- Bongers CC, Hopman MT, Eijsvogels TM. Using an Ingestible Telemetric Temperature Pill to Assess Gastrointestinal Temperature During Exercise. J Vis Exp. 2015(104).
- Gant N, Atkinson G, Williams C. The validity and reliability of intestinal temperature during intermittent running. Med Sci Sports Exerc. 2006;38(11):1926-31.
- O’Brien TJ, Goosey-Tolfrey VL, Leicht CA. Rectal and gastrointestinal temperature differ during passive heating and subsequent recovery. Journal of Thermal Biology. 2024;119:103755.
- Challis GG, Kolb JC. Agreement Between an Ingestible Telemetric Sensor System and a Mercury Thermometer Before and After Linear Regression Correction. Clinical Journal of Sport Medicine. 2010;20(1):53-7.
- Curran-Everett D. Multiple comparisons: philosophies and illustrations. American journal of physiology Regulatory, integrative and comparative physiology. 2000;279(1):R1-8.
- Bakdash JZ, Marusich LR. Repeated Measures Correlation. Frontiers in psychology. 2017;Volume 8 - 2017.
- Akoglu H. User’s guide to correlation coefficients. Turk J Emerg Med. 2018;18(3):91-3.
- Koo TK, Li MY. A Guideline of Selecting and Reporting Intraclass Correlation Coefficients for Reliability Research. J Chiropr Med. 2016;15(2):155-63.
- Blozis SA, Craft M. Alternative covariance structures in mixed-effects models: Addressing intra- and inter-individual heterogeneity. Behav Res Methods. 2024;56(3):2013-32.
- Bland JM, Altman DG. Measuring agreement in method comparison studies. Stat Methods Med Res. 1999;8(2):135-60.
- Myles PS, Cui J. I. Using the Bland&Altman method to measure agreement with repeated measures. British Journal of Anaesthesia. 2007;99(3):309-11.
- Hosokawa Y, Adams WM, Stearns RL, Casa DJ. Comparison of Gastrointestinal and Rectal Temperatures During Recovery After a Warm-Weather Road Race. Journal of athletic training. 2016;51(5):382-8.
- Miller KC, Adams WM. Common body temperature sites provide invalid measures of body core temperature in hyperthermic humans wearing American football uniforms. Temperature (Austin). 2021;8(2):166-75.
- Institute of Medicine Committee on Military Nutrition R. In: Marriott BM, editor. Nutritional Needs in Hot Environments: Applications for Military Personnel in Field Operations. Washington (DC): National Academies Press (US).Copyright 1993 by the National Academy of Sciences. All rights reserved.; 1993.
- Arngrímsson SÁ, Stewart DJ, Borrani F, Skinner KA, Cureton KJ. Relation of heart rate to percentV˙o 2 peak during submaximal exercise in the heat. Journal of applied physiology. 2003;94(3):1162-8.
- Buller MJ, Tharion WJ, Cheuvront SN, Montain SJ, Kenefick RW, Castellani J, et al. Estimation of human core temperature from sequential heart rate observations. Physiol Meas. 2013;34(7):781-98.
- de Korte JQ, Veenstra BJ, van Rijswick M, Derksen EJK, Hopman MTE, Bongers C, et al. A Heart Rate Based Algorithm to Estimate Core Temperature Responses in Elite Athletes Exercising in the Heat. Front Sports Act Living. 2022;4:882254.
- Siegel R, Maté J, Watson G, Nosaka K, Laursen PB. Pre-cooling with ice slurry ingestion leads to similar run times to exhaustion in the heat as cold water immersion. J Sports Sci. 2012;30(2):155-65.
- Deshayes TA, De La Flore A, Gosselin J, Beliveau J, Jeker D, Goulet EDB. The Impact of an Ice Slurry-Induced Gastrointestinal Heat Sink on Gastrointestinal and Rectal Temperatures Following Exercise. Sports (Basel). 2019;7(9).
Figure 1.
Changes in heart rate during the 120 min sitting period. * = significantly different from all other timepoints, p < 0.05. ** = significantly different from min 20 and 120, p < 0.05. Results are mean ± SD.
Figure 1.
Changes in heart rate during the 120 min sitting period. * = significantly different from all other timepoints, p < 0.05. ** = significantly different from min 20 and 120, p < 0.05. Results are mean ± SD.
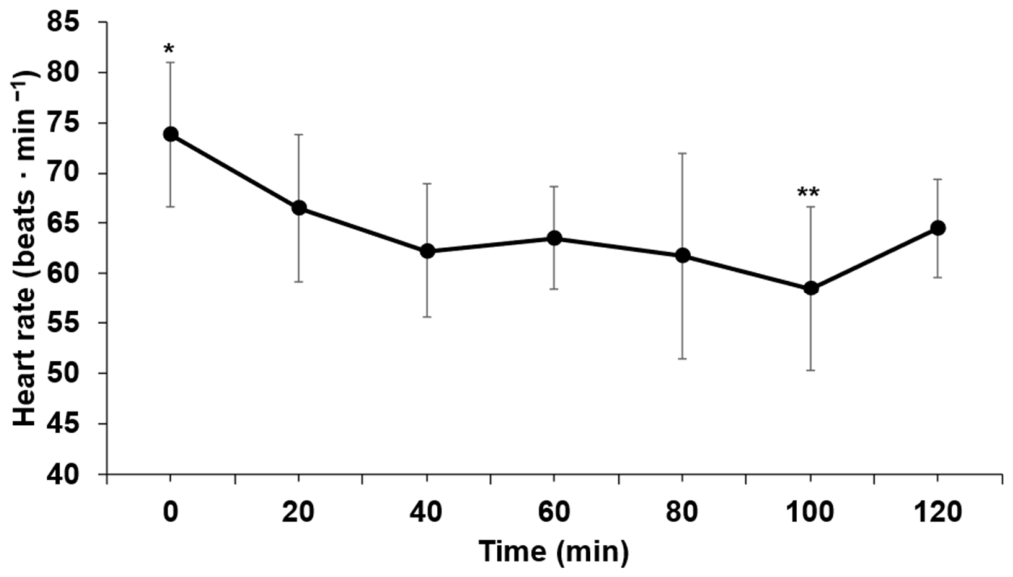
Figure 2.
Changes in core body temperature monitored with the gastrointestinal telemetric sensor and the CORE during the 120 min sitting period. * = p < 0.05 compared with the CORE at the same timepoint. ** = all timepoints significant different from min 0, p < 0.05. *** = no timepoint significantly different from min 0, p > 0.05. Results are mean ± SD.
Figure 2.
Changes in core body temperature monitored with the gastrointestinal telemetric sensor and the CORE during the 120 min sitting period. * = p < 0.05 compared with the CORE at the same timepoint. ** = all timepoints significant different from min 0, p < 0.05. *** = no timepoint significantly different from min 0, p > 0.05. Results are mean ± SD.
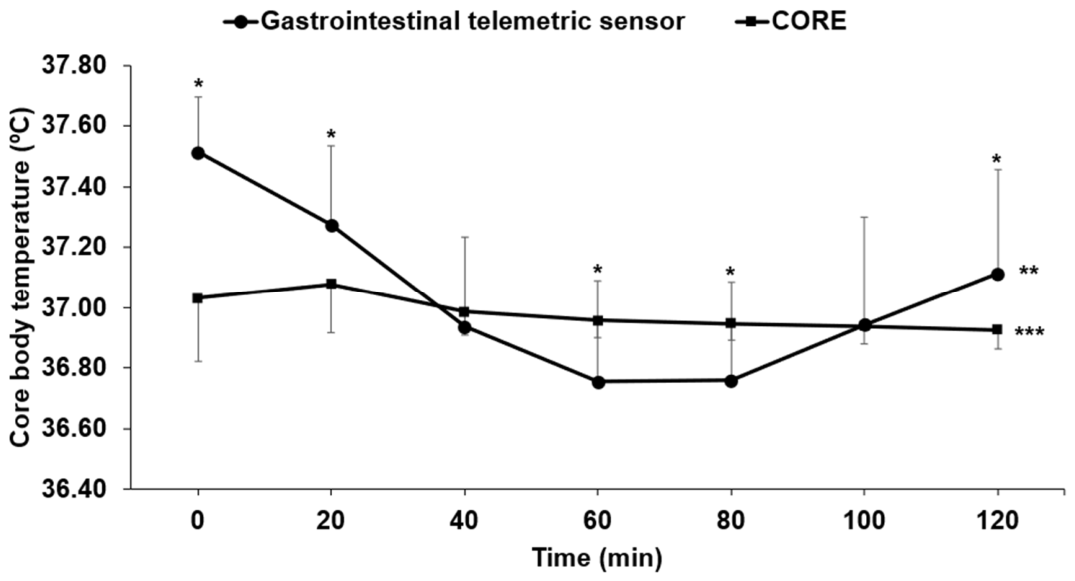
Figure 3.
Individual responses of all 11 participants to the hyperhydration periods, as measured by the gastrointestinal telemetric sensors and the CORE. Panels 6 and 7 represent data for the two women.
Figure 3.
Individual responses of all 11 participants to the hyperhydration periods, as measured by the gastrointestinal telemetric sensors and the CORE. Panels 6 and 7 represent data for the two women.
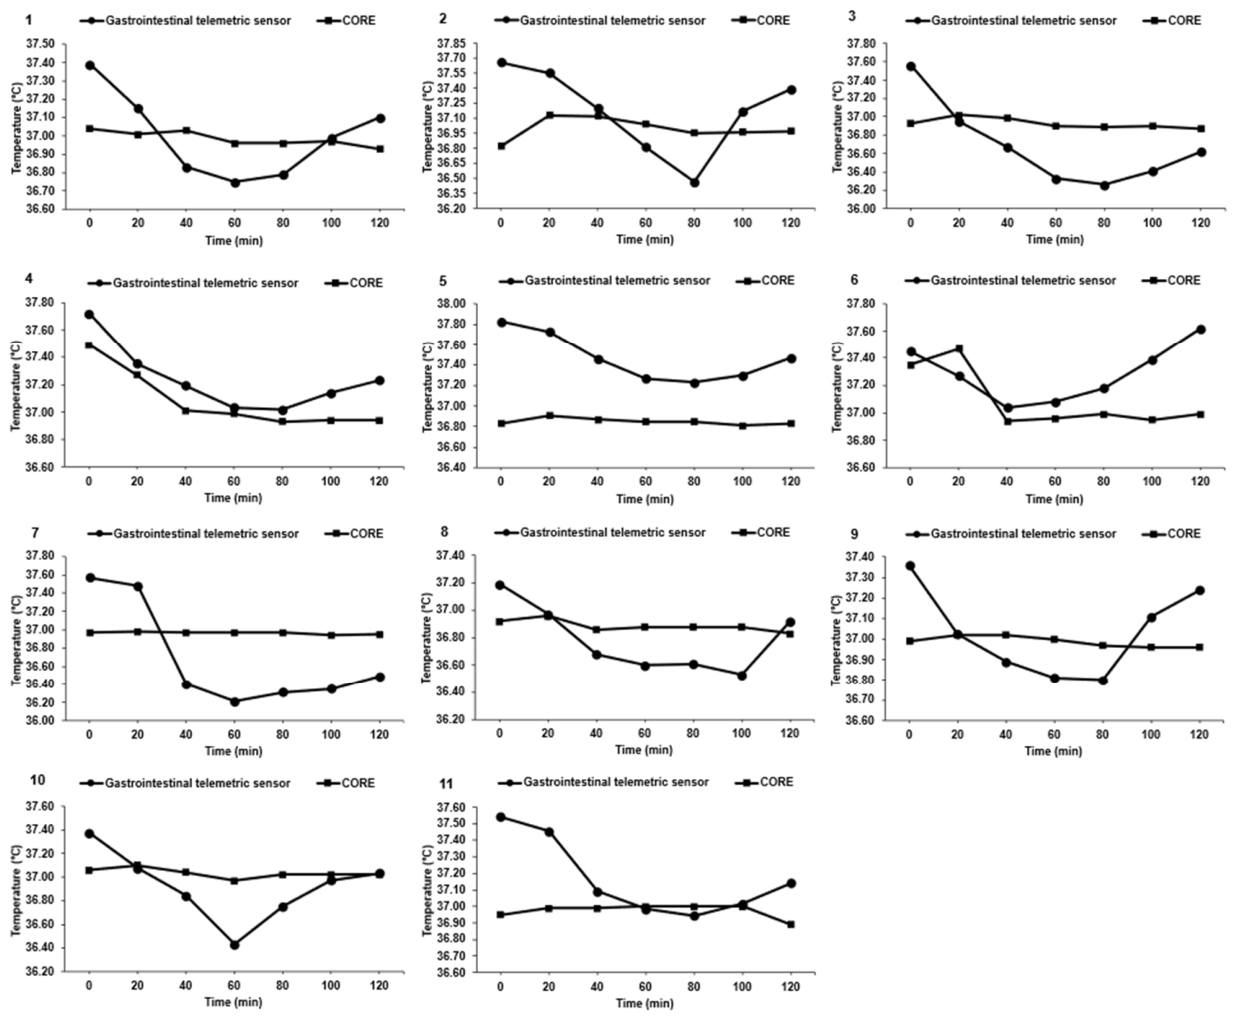
Figure 4.
Bland-Altman plot showing the relationship between the average core body temperature measured with the CORE and gastrointestinal telemetric sensor and the magnitude of the differences in core body temperature observed between the CORE and the gastrointestinal telemetric sensor during the entire 120 sitting period. The black line represents the line of zero difference between sensors. The grey area represents the zone of acceptable difference (± 0.27 °C) in core body temperature between sensors. The dotted lines represent ± 1.96 x SD around the regression line.
Figure 4.
Bland-Altman plot showing the relationship between the average core body temperature measured with the CORE and gastrointestinal telemetric sensor and the magnitude of the differences in core body temperature observed between the CORE and the gastrointestinal telemetric sensor during the entire 120 sitting period. The black line represents the line of zero difference between sensors. The grey area represents the zone of acceptable difference (± 0.27 °C) in core body temperature between sensors. The dotted lines represent ± 1.96 x SD around the regression line.
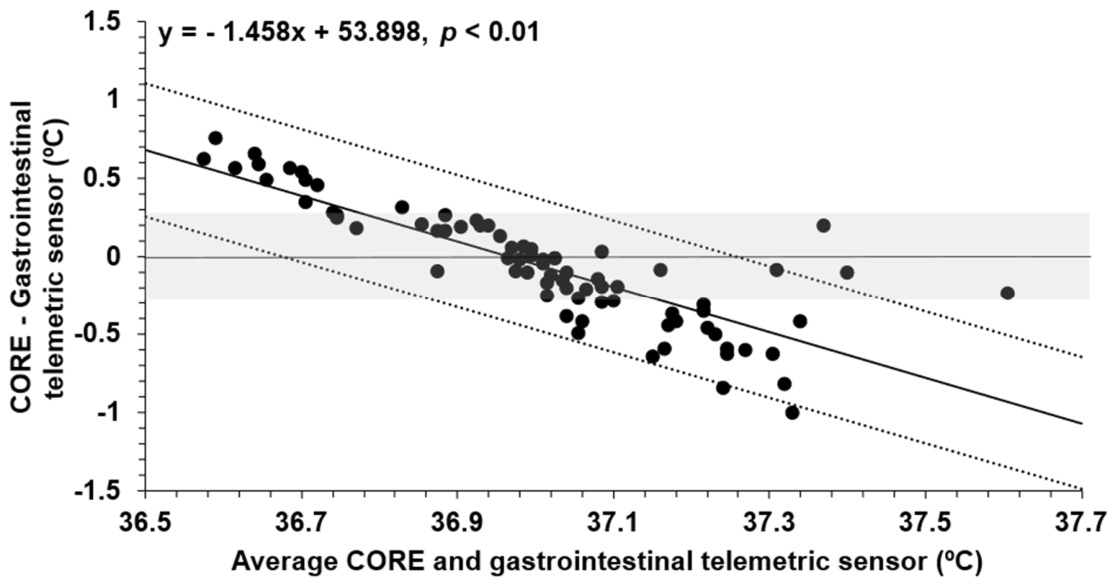
Figure 5.
Bland-Altman plot showing agreement between the CORE sensor and the gastrointestinal telemetric sensor for changes in core body temperature from baseline during the first 60 min of the hyperhydration period. At each 20-min interval, the mean change from baseline between the two sensors is plotted against the difference in change from baseline between sensors (ΔTCORE − ΔTGI). The grey area represents the zone of acceptable difference (± 0.27 °C) in core body temperature between sensors. The dotted lines represent ± 1.96 x SD around the regression line.
Figure 5.
Bland-Altman plot showing agreement between the CORE sensor and the gastrointestinal telemetric sensor for changes in core body temperature from baseline during the first 60 min of the hyperhydration period. At each 20-min interval, the mean change from baseline between the two sensors is plotted against the difference in change from baseline between sensors (ΔTCORE − ΔTGI). The grey area represents the zone of acceptable difference (± 0.27 °C) in core body temperature between sensors. The dotted lines represent ± 1.96 x SD around the regression line.
Disclaimer/Publisher’s Note: The statements, opinions and data contained in all publications are solely those of the individual author(s) and contributor(s) and not of MDPI and/or the editor(s). MDPI and/or the editor(s) disclaim responsibility for any injury to people or property resulting from any ideas, methods, instructions or products referred to in the content. |
© 2026 by the authors. Licensee MDPI, Basel, Switzerland. This article is an open access article distributed under the terms and conditions of the Creative Commons Attribution (CC BY) license (http://creativecommons.org/licenses/by/4.0/).
Copyright: This open access article is published under a Creative Commons CC BY 4.0 license, which permit the free download, distribution, and reuse, provided that the author and preprint are cited in any reuse.