

Submitted:
01 July 2026
Posted:
02 July 2026
You are already at the latest version
Abstract
Seamless steel tubes are widely used in various fields such as energy and chemical industry, machinery manufacturing, construction engineering, transportation, military and aerospace. Rolling is one of the main processes for producing seamless steel pipes, featuring high efficiency, low cost, and good quality. The Fine Quality Mill (FQM) is the core equipment of an advanced seamless steel pipe and tube production line. Rolling force is a critical process parameter in the FQM seamless steel pipe production line. During the rolling process, seamless steel pipes undergo complex deformation affected by multiple influencing factors. The rolling force fluctuates significantly in the first pass, which directly determines the dimensional accuracy of product profiles and the uniformity. Clarifying the weight contributions of key process factors to rolling force is essential for improving the modeling accuracy of rolling processes. Combining rolling deformation theory with field-measured production data, Slab Method (SM) Analysis, Grey Relational Analysis (GRA) and Finite Element Method (FEM) were adopted to quantify the influence weights of parameters on rolling force, including dynamic yield stress of materials, roll speed, mandrel speed, and friction coefficient. Consistent results obtained from the three integrated methods demonstrate that the dynamic yield stress of materials acts as the dominant factor affecting rolling force, and rolling force exhibits far higher sensitivity to dynamic yield stress than to other process parameters. Furthermore, this paper analyzes the intrinsic factors governing the dynamic yield stress of materials during the continuous rolling of seamless steel pipes. The research findings provided solid theoretical support and data references for selecting key input data and enhancing the prediction accuracy of data-driven rolling force models in engineering applications.
Keywords:
PQM mill
; seamless pipe rolling
; rolling force
; SM
; GRA
; FEM
The large-scale industrial production of seamless steel tubes has evolved from the late 1880s to the present day [1]. Over more than a century, numerous hot-rolling processes for seamless steel pipes have emerged, including the Ehrhardt push bench process [2], Pilger rolling process [3], Plug mill process [4], Expander process [5], Assel rolling process [6], Diescher process [7], Ugine extrusion process [8], and continuous rolling processes (fully floating mandrel, MPM [9], semi-restricted mandrel, MRK-S [10], and three-roll continuous rolling (PQF [11]and FQM [12,13]). Each of these methods achieved a certain degree of widespread application during specific periods.
Among these, multi-stand continuous tube rolling technology stands out as a significant process. It first appeared in 1887 with the Kellogg continuous rolling mill in the United States and has since undergone over a century of development [14]. Since the 1950s onward, continuous rolling tube production technology has advanced significantly due to breakthroughs in transmission and electrical control technologies. Key developments include the transition from a floating mandrel to a restricted mandrel, the reduction of stands from nine or seven to six or five, the shift from two-roll to three-roll rolling processes, and the evolution from manual operation to fully automated CPU- and PLC-controlled systems. Supported by hydraulic mini-cage control technology and process control software, these advancements have greatly enhanced the overall equipment capabilities of continuous rolling mills.
Compared to other methods, continuous rolling mills have become the preferred choice for major seamless steel pipe manufacturers due to their advantages in high quality, productivity, efficiency, and low material loss.
The three-roll retained mandrel continuous rolling process is centered around three-roll pass design technology. The world’s first PQF continuous rolling mill was commissioned in August 2003, jointly developed and designed by Tianjin Pipe Group Corporation Ltd., Germany’s SMS MEER, and Italy’s INNSE [15]. The FQM mill [16] was developed by Italy’s DANIELI.
Compared with MPM mills, PQF and FQM mills offer some key technical advantages, including better product geometry, improved profile shape during rolling, a more efficient hydraulic system and enhanced product capability. As with other rolling processes, rolling force is one of the most critical parameters in the FQM continuous rolling process. Based on traditional force analysis and the finite element method, scholars have carried out extensive research work.
The traditional slab method, while theoretically well-established, provides a mechanical description of the steel pipe rolling process based on force balance and yield conditions, however it suffers from inherent limitations due to its extensive simplifying assumptions. These approximations introduce systematic deviations between model predictions and actual physical phenomena. Furthermore, the mathematical formulation of the model involves multiple interdependent variables, posing analytical challenges in isolating and evaluating the dominant factors affecting rolling force. Li et al. analyzed and improved the calculation accuracy of rolling force model of seamless steel tube during tandem rolling process, based on SM [17]. Zhang et al. established a rolling force model by using the unified yield criterion, taking into account temperature changes and roll radius [18]. Gao reviewed and evaluated tube rolling model in light of rolling theory development and on-site requirement [19]. Wei developed a new analytical model to predict the profile and stress distribution of tube in three-roll continuous retained mandrel rolling, the model got a very high accuracy in rolling force and cross-section prediction [20].
SM and FEM are relatively common research methods, the use of SM offers the advantages of quick and convenient calculations along with a strong theoretical foundation. However, its application requires a solid grasp of underlying principles and details to enrich the understanding of the seamless steel pipe rolling process, enabling better intervention and control to improve product precision. Theoretically, the SM method is somewhat difficult. With the advancement of computer technology, FEM has become an effective tool for further research. The rapid development of commercial finite element software has made FEM becoming a crucial tool for process optimization and quality control in the field of seamless steel pipe rolling. By employing three-dimensional elastoplastic finite element models (such as Abaqus, ANSYS/LS-DYNA, and Deform-3D), researchers can simulate the thermo-mechanical coupling behavior during tube rolling, analyzing strain and stress distribution as well as metal flow behavior to optimize parameters like pass design, rolling force, and feed angle. Additionally, FEM enables the prediction of potential defects, such as cracks and wall thickness variations during the rolling process. In recent years, FEM has further advanced in multi-scale and multi-physics coupling, enabling comprehensive prediction from process parameters to final product performance.
Abaqus excels in handling highly nonlinear problems, including material nonlinearity (e.g., elastoplastic deformation), geometric nonlinearity (large deformations), and contact nonlinearity (dynamic interaction between rolls and steel tubes). This makes it well suited for accurately simulate complex mechanical behaviors during pipe rolling processes, such as metal flow and stress-strain distribution.
Seamless steel pipe rolling typically involves high-temperature deformation. Abaqus can perform thermo-mechanical coupling analysis, integrating the interaction between temperature fields and stress fields to more precisely predict rolling forces, temperature distribution, and potential defects such as cracks, wall thickness variations.
Adrián Ojeda-López presented a literature review covering the latest developments in the field of numerical simulation of rolling processes [21]. Han et al. used Abaqus to simulate the seamless steel pipe rolling process, conducting dynamic response analysis of the rolls to obtain their dynamic response curves under rolling conditions, thereby providing technical support for rolling schedules with the calculated rolling force as the load [22]. Zhang et al. employed Abaqus to simulate the distributions of stress, strain and displacement on the cross-sections of steel tubes, as well as the evolutions of wall thicknesses and diameters during the rolling processes in retained mandrel tube mills [23]. These studies demonstrated that the finite element method offers significant advantages in analyzing the deformation behavior of steel tube rolling. Key parameters such as stress and strain are intuitively visualized in the post-processing interface of Abaqus, facilitates a clearer understanding of the forces and deformation conditions experienced by the workpiece. This aids in process optimization, improving wall thickness uniformity, and enhancing product quality. With its high precision, multi-physics coupling capabilities, and efficient computational performance, Abaqus has become the preferred tool for simulating rolling forces in seamless tube production, significantly reduces trial-and-error costs and improves product quality.
With the widespread application of data-driven methods in rolling processes, the advantages of using data to predict and assess the sensitivity of influencing parameters are becoming increasingly evident. Chen et al. proposed a rolling force prediction modeling method for seamless steel pipe rolling mills that uses a hybrid Differential Evolution (DE) and Grey Wolf Optimization (GWO) algorithm optimized BP neural network (DE-GWO-BP), improved the accuracy of rolling force prediction and the accuracy of seamless steel pipe wall thickness control [24]. Based on a Multi-Channel Convolutional Neural Network (MCNN) combined with a Transformer Temporal Network (TTN), Yan et al. developed a data-driven model to forecast rolling force in the PQF seamless steel tube mill [25].
In addition to the prediction of rolling force, the analysis of influencing factors is also very important. However, there is limited research literature on the factors affecting the rolling force in three-roll retained mandrel mills. Compared to purely statistical methods (such as PCA [26]/Entropy Method [27]) or purely subjective methods (such as AHP [28]), GRA has an irreplaceable advantage in handling small samples, nonlinear relationships, and non-normally distributed data.
Grey Relational Analysis (GRA) [29] is a comprehensive evaluation method based on grey system theory, suitable for systems with limited data and incomplete information. Its core idea is to quantify the influence of various factors on the target by calculating the geometric similarity (i.e., relational degree) between each factor sequences and a reference sequence.
GRA has been applied across a wide range of fields, including medicine [30], military [31], transportation [32], mining [33], and parameter optimization [34]. The data obtained from the FQM rolling line showed good coverage but poor repeatability, indicating a small sample size. Therefore, the GRA algorithm is suitable for performing weighted analysis of the influencing factors.
In the complex deformation process of FQM three-roll retained mandrel seamless steel pipe rolling, the influencing factors are numerous and their interaction patterns are highly complicated. This study aims to analyze the key factors and their weights using multiple methods in order to identify the significant influencing factors. Specifically, the SM method is first applied based on rolling theory; then, Abaqus modeling is employed together with the control variable method to investigate the influence of various factors on rolling force. Finally, the results obtained from the above analyses are compared with the GRA weight analysis results to determine the main factors affecting rolling force. Moreover, due to the considerable variation in metal deformation patterns between passes, the upstream passes exhibit greater metal deformation and more pronounced transverse flow, leading to a more substantial influence of various factors on rolling force. Therefore, the first stand of the finishing mill is selected as the research object.
1. Effective Factors Analysis Based on Rolling Theory
FQM continuous rolling is a complex, large-deformation forming process, the billet is heated and pierced to become a shell, which is then rolled in the FQM mill, resulting in a reduction in pipe diameter and wall thickness, FQM milling is the key process in rolling forming. Analyzing the stress state of the pipe in the rolling mill deformation zone can provide theoretical guidance for actual steel pipe production. Typically, when calculating the rolling force using Slab Method, the deformation zone is divided into the diameter-reduction zone and the wall-thinning zone, each with its own method for calculating unit pressure. Before these two, there is a flattening zone, but it is not included in the rolling force calculation area, during this stage, the shell’s perimeter and cross-sectional area remain constant, while the contact zone height gradually decreases. As illustrated in the subsequent analysis, the method for calculating rolling force, especially its limitations, will be discussed, using a schematic diagram of the deformation zone composition of seamless steel pipes as an example, as shown in Figure 1, which was described by Yan’s book [35].
The model describes the simplified deformation process of steel pipe rolling. Firstly, as the shell progressively advances into the deformation zone, the flattening intensifies until the majority of the shell surface (excluding the roll gap area) establishes full contact with the roll groove. This marks the transition to the diameter reduction stage, where the roll groove geometry actively reduces both the shell diameter and perimeter. However, the wall thickness typically exhibits a slight increase rather than reduction during this phase, accompanied by moderate longitudinal metal elongation. The following wall thickness reduction stage commences when the shell’s inner surface contacts the mandrel and continues until the material exits the deformation zone. This stage is characterized by rapid wall thickness reduction with concurrent minor diameter reduction, producing significant longitudinal elongation. A phenomenon occurs in the roll gap region, where the absence of contact with both rolls and mandrel prevents radial deformation. Consequently, metal displaced from the groove base and sidewalls flows laterally toward the roll gap, resulting in localized wall thickening in this region.
As mentioned earlier, the rolling force during the steel pipe rolling process is the sum of the rolling forces in the reducing zone and the wall-thinning zone, both of which are obtained by multiplying the rolling stress by the contact area.
The total rolling force P is then obtained by summing the forces from both zones. The calculation formula is as follows:
where, is the average pressure in the diameter reduction zone, MPa; is the average pressure in the wall thickness reduction zone, MPa; is the horizontal projection of the contact area in the diameter reduction zone, mm2; is the horizontal projection of the contact area in the wall thickness reduction zone, mm2.
Equation 1 describes the sum of the products of stress and the corresponding area. Its physical meaning is clear, and the logic is very straightforward. The challenge lies in determining the four variables involved. Firstly, is calculated by Equation (2).
In which,
where, is the wall thickness of the inlet steel pipe, mm; is the average diameter of the steel pipe in the reducing zone, mm; is the deformation resistance of the metal at rolling temperature, MPa; is the influence coefficient of average unit pressure; and are the horizontal projection length of the reducing zone and wall-thinning zone, mm; is the minimum radius of the roll; is the wall thickness of the steel pipe after rolling, mm; is the roll pass groove height at the top in this rolling pass, mm; is the groove width in the previous rolling pass, mm. is the nominal roll diameter, mm; is the tube diameter of the inlet steel pipe, mm.
In the calculation of Equation (2) and its variables, is based on a simplification of the geometric relationship, while the calculations of and are based on the concept of the length of the contact arc in rolling theory.
The average unit pressure in the wall-thinning zone is calculated using the Tselikov curve [36]. The key parameters include,
where, is friction coefficient; is change in wall thickness, mm; is the dynamic yield stress, MPa.
Area of in the reducing zone:
where, is diameter of mandrel, mm; is diameter of groove bottom, mm; is wall thickness reduction, mm; is groove opening angle, rad; is the central angle of the contact area between pipe wall and the mandrel, rad.
Area of in the wall-thinning zone:
where, is the wall thickness at groove opening, mm; is a coefficient.
When employing the slab method for modeling, appropriate simplifications are implemented by taking into account the conditions of static equilibrium, boundary constraints, and yield criteria, while considering a relatively limited number of factors. The variables within the model are categorized into equipment parameters, intermediate variables, and process parameters, with the relationship among each parameter and F1, F2 and Pc1, Pc2 is described in Figure 2.
The wall thickness of the inlet steel pipe , the wall thickness of the steel pipe after rolling , and is the pipe diameter of the inlet steel pipe effect Pc1. The friction coefficient and the tube diameter of the inlet steel pipe, the dynamic yield stress , , and with a intermediate variable l2 effect Pc2. The wall thickness at groove opening, the groove opening angle, and the central angle of the contact area between tube wall and the mandrel effect F2, and the groove opening angle , and the central angle of the contact area between tube wall and the mandrel effect F1.
The relationship among these variables and rolling force is complex. Among all process parameters in the model, the dynamic yield stress , the wall thickness of the inlet steel pipe and the wall thickness of the steel tube after rolling are input data with definite values, while the groove opening angle and the central angle of the contact area between pipe wall and the mandrel are data that require calculation or are difficult to measure. When studying the influencing factors of rolling force, and , which have precise values, were selected, and the controlled variable method was employed to obtain the influence patterns. To avoid complex changes caused by altering the mandrel size, the impact of variations on rolling force was not considered. The influence patterns of the aforementioned various factors on rolling force are not clear. The influence patterns of the aforementioned factors on rolling force cannot be directly derived from the model.
To study the influence patterns of various factors on rolling force, using the control variable method, the input parameters were varied, and the corresponding rolling forces were calculated through Formula 1-5 (by consulting tables as well). Based on Figure 2, the selected parameter data should meet certain conditions, they should not be equipment parameters, as equipment parameters are closely interrelated; nor should they be intermediate parameters, as intermediate parameters lack independence, these input parameters should be process parameters that have relative independence in the model. Considering the relationship among various parameters in Figure 2, the selected input parameters are the inlet wall thickness , friction coefficient , and the dynamic yield stress .
The input parameters were then normalized to compare their sensitivity to the rolling force, and the results are presented in Figure 3. As can be seen, the curve of material deformation resistance versus rolling force exhibits the largest slope, indicating that the rolling force is most sensitive to the deformation resistance, followed by the inlet wall thickness and the friction coefficient. Furthermore, a positive correlation is observed between the rolling force and all the listed influencing parameters.
Due to the structure of the model, important factors such as rolling speed, mandrel speed, and friction between the pipe inner wall and the mandrel are not reflected.
Simultaneously, considering actual production conditions, the roll gap, roll speed, and mandrel speed are also acknowledged as critical influencing factors, in addition to the geometric dimensions of the rolls. However, the rolling force model for seamless steel pipes, grounded in the slab method, encompasses a plethora of assumptions and requires numerous input parameters that exhibit intricately interrelated relationships. The influence patterns of these input parameters on rolling force calculations exhibit a high degree of complexity. When significant discrepancies emerge between the computed and actual rolling force values, swiftly pinpointing the root causes poses a formidable challenge. Merely depending on advancements in rolling theory is unlikely to result in significant breakthroughs in the short term. Under such circumstances, performing data analysis based on actual production data offers distinct advantages in clarifying the relationships between various factors and the calculated rolling force values. This methodology lays the groundwork for identifying production issues on-site and improving both the accuracy of rolling force calculations and the dimensional precision of the final product.
2. GRA Relational Grade Analysis
It is well known that different steel grades exhibit significant differences in their stress-strain curves, making deformation resistance the dominant factor affecting rolling force. This is unfavorable for analyzing the influence of other factors, particularly in the seamless tube rolling process, where the complexity of three-dimensional deformation complicates the effects of groove design, friction between rolls and workpiece, friction between the mandrel and workpiece, mandrel speed, and other variables on rolling force.
For the first stand, as well as the separative rolling force, the following process parameters were collected:
- 1)
- Average temperature of tube
- 2)
- Dynamic yield stress
- 3)
- Inlet wall thickness
- 4)
- Outlet wall thickness
- 5)
- Tube-roll friction coefficient
- 6)
- Tube-mandrel friction coefficient under stand
- 7)
- Tube speed
- 8)
- Tube-roll relative speed
- 9)
- Mandrel speed
Based on the operational characteristics of seamless steel tube rolling, a total of 2,014 actual production data records were collected from a domestic manufacturing site. These records encompass equipment parameters, process parameters, and actual rolling force values from the first stand of the FQM seamless steel tube continuous rolling production line. To display the data more clearly, the data were normalized as shown in Figure 4. The minimum, maximum, and median values of each parameter are listed in Table 1. These data come from a random single day and cover a relatively short period of time, which avoids interference from operating conditions. However, due to the limited amount of data, there are certain limitations. The size of these seamless steel pipe is 192 mm.
Theoretical analysis indicates inherent correlations among the aforementioned parameters. Specifically, the roll gap directly determines the outlet wall thickness, while the dynamic yield stress of conventional steel materials exhibits a pronounced variation with temperature. Meanwhile, the outer diameter of the rolled piece, a vital process parameter, is equivalent to the sum of the mandrel diameter and twice the rolled piece thickness, thereby rendering its individual listing unnecessary. The intricate interplay and diverse coupling of these influencing factors pose substantial challenges for analyzing the error sources in rolling force calculation. Furthermore, the computational accuracy of rolling force directly governs the regulation precision of roll gap, and further affects the wall thickness uniformity and overall shape quality of finished products. The complex weighting analysis and the limited availability of experimental samples necessitate a suitable algorithm to accomplish the weighting analysis.
GRA (Grey Relational Analysis) weighting analysis method is a decision-making analysis tool based on grey system theory, which performs exceptionally well in scenarios with limited data or incomplete information. The advantages of GRA weighting analysis lie in its adaptability to small samples, simplicity and ease of use, and capability for dynamic multi-factor correlation analysis, making it particularly suitable for systems with limited data or ambiguous relationships.
The actual values of the rolling force for the first stand are used as the reference sequence, and the actual values of the influencing factors for each stand are used as the comparison sequences. After applying dimensionless treatment to the data sequences, the grey relational coefficients under different distinguishing coefficients are calculated. These grey relational coefficients serve as a measure of the overall degree of correlation between each influencing factor and the target throughout the entire time span, providing the basis for the final weight ranking. Using GRA weight analysis, standardization, decorrelation, and discarding components with small variances were performed, laying the foundation for further analysis of the impact of various factors on rolling force.
The aforementioned characteristics meet the fundamental requirements for analyzing the influencing factors of rolling force in seamless steel tube production. Specifically, constrained by the equipment capacity of a specific production line, product specifications, and process parameter ranges, the actual rolling line data is inherently limited. The data collected on-site for research purposes is subject to constraints, and there may be direct or indirect correlations among various influencing factors—correlations that cannot be directly deduced using existing theoretical models.
Treating the aforementioned 9 influencing factors as comparative sequences and the rolling force at the first stand as the reference sequence, a Grey Relational Analysis (GRA) was conducted for weight analysis, followed by a sensitivity assessment. The results are illustrated in the accompanying figure.
As illustrated in Figure 5, the relative magnitudes of the grey relational grades of all influencing factors remain basically consistent when the resolution coefficient varies from 0.1 to 0.9. With the increase in the resolution coefficient, the numerical discrepancies among the grey relational grades of different factors gradually decline, whereas their ranking order remains stable.
Consistent with conventional rolling theory, material deformation resistance serves as the most dominant factor affecting rolling force, with a grey relational grade of 0.753. Roll gap also exerts a substantial influence on rolling force and ranks second among all factors, with a relational grade of 0.747. The friction coefficient between the tube and mandrel ranks third, with a corresponding relational grade of 0.702. Both dynamic yield stress and friction coefficient are physical quantities that are difficult to acquire accurately in real time during practical production. These two parameters are affected by numerous factors and follow highly complex influence mechanisms. , making their influence mechanisms and accurate acquisition methods long-standing challenges in rolling research. Rolling speed is also a non-negligible factor affecting rolling force. In the tube rolling process, both the rolling speed and mandrel speed serve as critical influencing parameters. Specifically, the mandrel speed exerts the most prominent effect and ranks fifth among all factors, followed by the tube rolling speed, which ranks sixth. Deformation magnitude is another key determinant of rolling force. Nevertheless, the tube deformation occurring in the first rolling stand presents a complex variation pattern, which cannot be fully characterized merely by the inlet and outlet wall thicknesses. Accordingly, the correlation degrees of the inlet and outlet wall thicknesses are insufficiently reflected in the results, ranking seventh and eighth, respectively. The rolled piece acts as the sole heat source within the deformation zone. Its temperature affects rolling force by altering the material deformation resistance and interfacial friction conditions. The rolled piece temperature ranks sixth among all influencing factors, with a grey relational grade of 0.556.
A comparison between the weighting results derived from the theoretical model and the GRA method reveals that dynamic deformation resistance is identified as the predominant influencing factor in both analyses, whereas obvious discrepancies exist in the ranking of other parameters. The theoretical model only quantifies the weights of three process parameters, among which dynamic deformation resistance ranks first, followed by inlet wall thickness and friction coefficient. Nevertheless, such weighting characteristics exhibit variable patterns under different thickness conditions. When the inlet wall thickness is relatively thin, the weight gap between the inlet thickness and friction coefficient is negligible, with the friction coefficient presenting an even slightly lower weight. In contrast, for thick inlet wall thicknesses, the inlet thickness possesses a significantly higher weight than the friction coefficient, which is closely associated with the wall thickness reduction rate. Compared with the theoretical model, the GRA weighting analysis covers a more comprehensive set of influencing factors. Although dynamic deformation resistance remains the dominant factor, the friction coefficient achieves a higher ranking while the inlet wall thickness ranking declines, thereby generating a distinct difference in factor weight distribution between the two methods.
3. FEM Analysis
The theoretical calculation model for tube rolling force is constrained by its inherent structural limitations, which hinders the intuitive and comprehensive quantitative analysis of the influences of various impacting factors. Meanwhile, data-driven correlation analysis is restricted by limited data collection scope and inherent algorithm defects, thereby necessitating theoretical and practical validation of analytical results. As an effective numerical approach, the finite element method possesses unique advantages in the thermo-mechanical coupling analysis of tube rolling processes and has been widely adopted in relevant research and engineering applications.
Finite element modeling features flexible modification of boundary conditions and intuitive acquisition of computational results, providing remarkable superiority for parametric analysis. To further verify the aforementioned analytical conclusions, a finite element model of the tube rolling process for FQM continuous rolling mills is established in this study using Abaqus software. Targeting the first rolling stand, corresponding numerical simulations are implemented to validate the theoretical rolling force calculation results and further investigate the multi-factor coupling effects on rolling force.
A 3D thermo-mechanical coupled model of the FQM seamless steel tube rolling process was established using Abaqus, which exhibits high computational accuracy [37,38]. The rolling force and the shape of the rolled piece are in good agreement with the measured values on site, as illustrated in the Figure 6, the following process characteristics are observed from a technological perspective: The first rolling stand adopts a large reduction rate, which induces substantial circumferential, radial and axial strains in the workpiece at the groove base. Progressing from the groove base toward the roll gap, the contact between the workpiece and groove wall transitions from full constraint to gradual detachment. Near the roll gap, the workpiece contacts neither the groove wall nor the mandrel, resulting in no strain occurrence and unchanged wall thickness.
To explore the effects of various process parameters on rolling force, the control variable method was employed in this study. Specifically, key parameters affecting rolling force were adjusted individually while all other conditions remained constant, and the detailed parameter settings are listed in Table 2. Thermo-mechanical coupling simulations were performed via Abaqus software to acquire the rolling force curves. The average value of the stable segment of each curve was extracted as the final calculated rolling force.
The relationship curve between the normalized values of various influencing factors and rolling force is shown in Figure 7. Normalize the influencing parameter variables as the horizontal axis, and plot the rolling force obtained under different parameter conditions as the vertical axis for linear fitting. It was found that all influencing parameters have a good linear relationship with the rolling force. The dynamic yield stress is positively correlated with the rolling force, and the slope of the fitted curve is the largest, showing the most prominent performance among all influencing factors. The inlet thickness of the rolled piece is also a parameter positively correlated with the rolling force, and the slope of its fitting curve is relatively large. The performance of other influencing factors is not prominent, showing a basically linear relationship with rolling force, but the absolute values of their slopes are relatively small. Among these factors, the effects of entry thickness and roll gap are relatively significant, while the influence of friction coefficient and rolling speed is smaller. The impact of mandrel speed is the least significant, with an absolute slope value of only 0.4. The slopes of the fitting curves for the relationship between the normalized values of various influencing factors and the rolling force are listed in Table 3.
4. Analysis of Calculation Results
The results of sensitivity analysis of influencing parameters using the slab method model are not comprehensive enough. By comparing the results of GRA analysis and FEM analysis, it can be found that their assessments of the weight of influencing factors on the rolling force of FQM seamless steel tubes do not completely align. However, the commonality between the two is that the most significant factor identified is the dynamic yield stress of the material. According to the GRA analysis results, although the influence weight of deformation resistance ranks first, the gap between its weight factor and those of other influencing factors is narrow. Friction coefficient between tube and mandrel, friction between tube and roll, relative speed between tube and roll and roll gap follow closely behind. Additionally, this paper does not consider the influence of groove parameters on rolling force. The reason is that groove parameters constitute the core of seamless steel tube rolling technology, and their optimization is highly sensitive. During actual rolling processes, fluctuations may occur due to factors such as wear, potentially necessitating roll changes. However, for products of specific specifications, groove parameters remain relatively stable. It is also challenging to conduct research on fluctuations within a certain range for a specific groove parameter.
Analyze the reasons for differences in the weights of influencing factors between the two methods, the subject addressed by both methods—rolling force—manifests as curves in actual production. Due to on site conditions and the limitations of measurement instruments, its values fluctuate intensely within a certain range. Therefore, the final reported rolling force is generally a processed average over a period of time. Interestingly, the rolling force curve obtained through Abaqus simulations coincidentally also displays a similar serrated shape, which is related to factors such as numerical oscillations, time step settings, hourglass control, and meshing in the computational process—these are unavoidable during simulation. The rolling force value derived from Abaqus calculations is likewise an average taken during the stable phase. Both the actual rolling force values and those computed by Abaqus exhibit intense fluctuations within a range. When analyzing the weight of influencing factors using controlled variables in an Abaqus environment, it should be noted that the rolling force possesses a certain degree of differentiation, whereas this issue does not arise in data-driven analysis. In data-based analysis, influencing factors are derived from actual engineering records, and the intervals between controlled variables are not specifically constrained, resulting in more comprehensive data.
On-site engineering conditions are complex and highly variable. GRA (Grey Relational Analysis) based on engineering data does not focus solely on specific scenarios, whereas when using the controlled variable method in an Abaqus environment for calculation and analysis, it is impossible to encompass all complex on-site conditions—such as abnormal fluctuations in temperature, unusual variations in rolling mill equipment status, and so on. The computational results only provide theoretical general patterns, whereas GRA analysis is more comprehensive and inclusive.
The process of conducting simulations and analyzing data using the FEM within the Abaqus environment is relatively straightforward and streamlined, with clear and concise results. In contrast, when applying the GRA method to engineering studies, factors such as data sources, outlier handling, data normalization, and the selection of key parameters can all influence the outcome of the weight analysis. Moreover, any issues that arise in this process may be difficult to detect.
A comprehensive evaluation of the weighting of influencing factors on rolling force, employing both data-driven methods and finite element simulation approaches, reveals that each method has its own strengths and weaknesses. In practical applications, these two methods should be integrated. Both the data-driven method and the finite element method agree that the material’s deformation resistance is the most significant factor affecting rolling force, while the influence of other process parameters is relatively weaker. Considering actual production conditions—where process factors such as rolling speed, friction, and lubrication conditions are either relatively fixed or difficult to measure and control in real time—the material’s deformation resistance becomes the primary consideration. All factors affecting dynamic yield stress, primarily temperature and strain rate, warrant priority consideration. By ensuring that temperature remains within a reasonable range, rolling force can be controlled within acceptable limits. This, in turn, improves the control level of other conditions such as the entry thickness of each pass and roll gap, creating a positive feedback loop.
5. Conclusions
This study systematically investigated the weight contributions of key process factors to rolling force at the first stand of FQM seamless steel tube continuous rolling by integrating three complementary methods: Slab Method (SM) sensitivity analysis, Grey Relational Analysis (GRA) based on field production records, and Finite Element Method (FEM) simulations using Abaqus thermo-mechanical coupling models with the control variable approach. The principal findings are summarized as follows.
1) all three methods consistently identified the dynamic yield stress of the material as the dominant factor affecting rolling force.
2) the GRA results corroborated this conclusion, with the dynamic yield stress achieving the highest grey relational grade of 0.753, followed by roll gap (0.747), tube-mandrel friction coefficient (0.702), and tube-roll friction coefficient. The ranking order remained stable across resolution coefficients ranging from 0.1 to 0.9, confirming the robustness of the GRA weighting results.
3) the SM theoretical analysis revealed that the rolling force is most sensitive to material deformation resistance among all model input parameters, although the SM framework is inherently limited in its inability to account for critical factors such as rolling speed, mandrel speed, and tube-mandrel friction due to structural simplifications.
While discrepancies exist in the weight distributions of secondary factors between the GRA and FEM methods—attributable to the controlled variable conditions in simulation versus the comprehensive variability captured in field production data—the consensus on the paramount importance of dynamic yield stress across all three approaches is unequivocal. The predominance of dynamic yield stress reflects the fundamental role of material deformation resistance during high-temperature plastic deformation in seamless tube rolling. Temperature and strain rate, as the primary intrinsic factors governing dynamic yield stress, warrant priority attention in both process design and online control. Specifically, maintaining the rolled piece temperature within an optimal range not only enables effective regulation of rolling force but also enhances the controllability of downstream process parameters such as roll gap and inlet wall thickness, thereby establishing a positive feedback loop for product quality improvement. Furthermore, the high influence weights of friction-related parameters identified by GRA underscore the significance of accurate friction characterization for improving rolling force prediction accuracy. These research findings provide a prioritized parameter hierarchy and solid theoretical foundation for selecting key input features and enhancing the prediction accuracy of data-driven rolling force models in FQM seamless steel tube production.
References
- Agrawal, P.; Aggarwal, S.; Banthia, N.; Singh, U.S.; Kalia, A.; Pesin, A. A comprehensive review on incremental deformation in rolling processes. J. Eng. Appl. Sci. 2022, 69, 1–28. [Google Scholar] [CrossRef]
- Gulyayev, Y.G.; Mamuzić, I.; Shyfrin, Y.I.; Buršak; M. i Garmashev, D.Y. Perfection of processes of seamless steel tubes production. Metalurgija 2011, 50, 285–288. [Google Scholar]
- An, N.; Hai, L. Finite Element Analysis of Rolling Process for Pilger Mill. Adv. Mater. Res. 2014, 881-883, 1420–1423. [Google Scholar] [CrossRef]
- Unnikrishnan, V.; Navin, G.; Breitenfeld, F. Improved Bearing Design in Workover Motor Boosts Operational Efficiency for Plug Milling in North America. SPE/ICoTA Well Intervention Conference and Exhibition, LOCATION OF CONFERENCE, United StatesDATE OF CONFERENCE.
- Scattina, A. Numerical analysis of tube expansion process for heat exchangers production. Int. J. Mech. Sci. 2016, 118, 268–282. [Google Scholar] [CrossRef]
- Dobrucki, W.; Pietrzykowski, A. Loads in the process of elongating rolling in the assel mill. J. Mech. Work. Technol. 1988, 16, 243–255. [Google Scholar] [CrossRef]
- Pater, Z.; Kazanecki, J. Complex Numerical Analysis of the Tube Forming Process Using Diescher Mill. Arch. Met. Mater. 2013, 58, 717–724. [Google Scholar] [CrossRef]
- Sejourneti, J. Origin of the invention of steel extrusion by glass lubrication. J. Frankl. Inst. 1956, 261, 315–318. [Google Scholar] [CrossRef]
- Fang, G. H.; Wang, J. B.; Zheng, W. S. Study on dynamic characteristics of hydraulic pressure system of MPM tube rolling mill. AMR 2013, 706, 1580–1584. [Google Scholar] [CrossRef]
- Oberem, D. I. K. A review of the production processes for seamless tubes. Steel Times 1985, 213, 320. [Google Scholar]
- Wang, F.; Dong, F.; Yu, H.; et al. Forming simulation system of 3-roll continual tube rolling PQF based on finite element method. In 2009 IEEE 10th International Conference on Computer-Aided Industrial Design & Conceptual Design; IEEE, 2009; pp. 862–865. [Google Scholar]
- Toporov, V.; Khalezov, A.; Nukhov, D.S. Evaluation of the Effect of Holding the Mandrel in the Extreme Position of the FQM Mill on the Formation of Surface Defects. Solid State Phenom. 2021, 316, 375–379. [Google Scholar] [CrossRef]
- Toporov, V.A.; Ibragimov, P.A.; Panasenko, O.A.; Nukhov, D.S.; Khalezov, A.O. Development of the Mathematical Model of Continuous Pipe Rolling and Study of the Influence of Technological Factors on the Formation of Surface Defects. Steel Transl. 2023, 53, 978–982. [Google Scholar] [CrossRef]
- Gerd, P. Geschichte der fertigung von nahtlosen rohren und die rolle der erfindungen der gebrüder mannesmann. Stahl. Eisen 1985, 105, 85–90. [Google Scholar]
- Li, X.; Tu, Y.; Guo, Y. FE Analysis of Temperature Field of PQF Mandrel. 2012 9th International Pipeline Conference; LOCATION OF CONFERENCE, CanadaDATE OF CONFERENCE; pp. 197–202.
- Chernykh, I.N.; Ulyanov, A.G.; Trubnikov, K.V.; Maltsev, A.V. Rational use of rolling mill mandrels. Metallurgist 2024, 67, 1–6. [Google Scholar] [CrossRef]
- Li, L. J.; Han, X.; Liu, S. Q. Analysis of computational model of seamless steel pipe rolling contact force. Key Eng. Mater. 2018, 764, 376–382. [Google Scholar] [CrossRef]
- Zhang, S. H.; Li, Q. H.; Li, Y. X.; et al. An analytical model for the prediction of rolling force of thin slab. Adv. Mater. Process. Technol. 2023, 9, 1210–1224. [Google Scholar]
- Gao, X. Tube and pipe rolling. In The ECPH encyclopedia of mining and metallurgy; Springer Nature Singapore: Singapore, 2026; pp. 2202–2208. [Google Scholar]
- Wei, Z.; Wu, C. A new analytical model to predict the profile and stress distribution of tube in three-roll continuous retained mandrel rolling. J. Mech. Work. Technol. 2022, 302, 117491. [Google Scholar] [CrossRef]
- Ojeda-López, A.; Botana-Galvín, M.; González-Rovira, L.; Botana, F.J. Numerical Simulation as a Tool for the Study, Development, and Optimization of Rolling Processes: A Review. Metals 2024, 14, 737. [Google Scholar] [CrossRef]
- Han, X.; Li, L. J. Dynamic response analysis of tandem rolling mill in rolling process. Key Eng. Mater. 2018, 764, 391–398. [Google Scholar] [CrossRef]
- Zhang, D.; Guan, M.; Zhang, Q.; et al. Simulation of deformation behaviors and laws of steel pipes in rolling processes of retained mandrel pipe mills. CME 2020, 31, 2691–2698. [Google Scholar]
- Chen, J.-Q.; Sun, Y.-Z.; Wang, X.-C.; Zhou, J.-B.; Yang, Q.; Li, J.-D. Rolling theory-guided prediction of PQF mill rolling force based on DE-GWO-BP. Ironmak. Steelmak. 2024, 53, 611–620. [Google Scholar] [CrossRef]
- Yan, X.; Li, Y.; Xue, Y.; et al. Prediction of rolling force in hot continuous rolling seamless steel tube based on data-driven[C]//2025 37th Chinese Control and Decision Conference (CCDC). IEEE 2025, 1316–1321. [Google Scholar]
- Maćkiewicz, A.; Ratajczak, W. Principal components analysis (PCA). Comput. Geosci. 1993, 19, 303–342. [Google Scholar] [CrossRef]
- Zhu, Y.; Tian, D.; Yan, F. Effectiveness of Entropy Weight Method in Decision-Making. Math. Probl. Eng. 2020, 2020, 1–5. [Google Scholar] [CrossRef]
- Podvezko, V. Application of AHP Technique. J. Bus. Econ. Manag. 2009, 10, 181–189. [Google Scholar] [CrossRef]
- Liu, S.; Yang, Y.; Cao, Y.; Xie, N. A summary on the research of GRA models. Grey Syst. Theory Appl. 2013, 3, 7–15. [Google Scholar] [CrossRef]
- Liu, A.; Guo, X.; Liu, T.; Zhang, Y.; Tsai, S.-B.; Zhu, Q.; Hsu, C.-F. A GRA-Based Method for Evaluating Medical Service Quality. IEEE Access 2019, 7, 34252–34264. [Google Scholar] [CrossRef]
- Tian, C.; Song, M.; Tian, J.; Xue, R. Evaluation of Air Combat Control Ability Based on Eye Movement Indicators and Combination Weighting GRA-TOPSIS. Aerospace 2023, 10, 437. [Google Scholar] [CrossRef]
- Lu, M.; Wevers, K.; Van der Hijden, R.; et al. Use of GRA to evaluate road traffic safety strategies. J. Grey Syst.-Uk 2005, 17, 243–256. [Google Scholar]
- Soltani, E.; Ahmadi, O.; Rashnoudi, P. A decision-making model for blasting risk assessment in mines using FBWM and GRA methods. Sci. Rep. 2024, 14, 1–18. [Google Scholar] [CrossRef] [PubMed]
- Ghangas, G.; Singhal, S. Modelling and optimization of process parameters for friction stir welding of armor alloy using RSM and GRA-PCA approach. Mater. Res. Express 2018, 6, 026553. [Google Scholar] [CrossRef]
- Yan, Z. S. Modern continuous hot-rolling production of seamless steel tubes and pipes; Metallurgical Industry Press: Beijing, 2009. [Google Scholar]
- Tarnovskii, I.; Pozdeyev, A.; Lyashkov, V. Deformation of Metals During Rolling; Elsevier: Amsterdam, NX, Netherlands; ISBN, 2013. [Google Scholar]
- Zhang, T. FEM Simulation on continuously rolling process of PQF and optimization of tension system; Northeastern University, 2019. [Google Scholar]
- Niu, W.; Gong, D.; Chai, H.; et al. Finite element analysis of three-dimensional stress in rolled piece during PQF continuous rolling process. Steel Pipe 2024, 53, 20–26. [Google Scholar]
Figure 1.
Composite of rolling deformation zone.
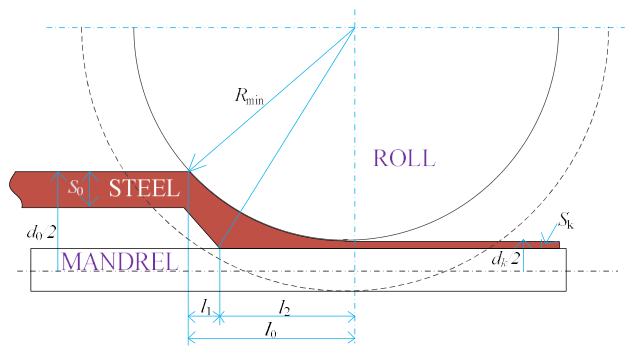
Figure 2.
Parameters of rolling force calculation.
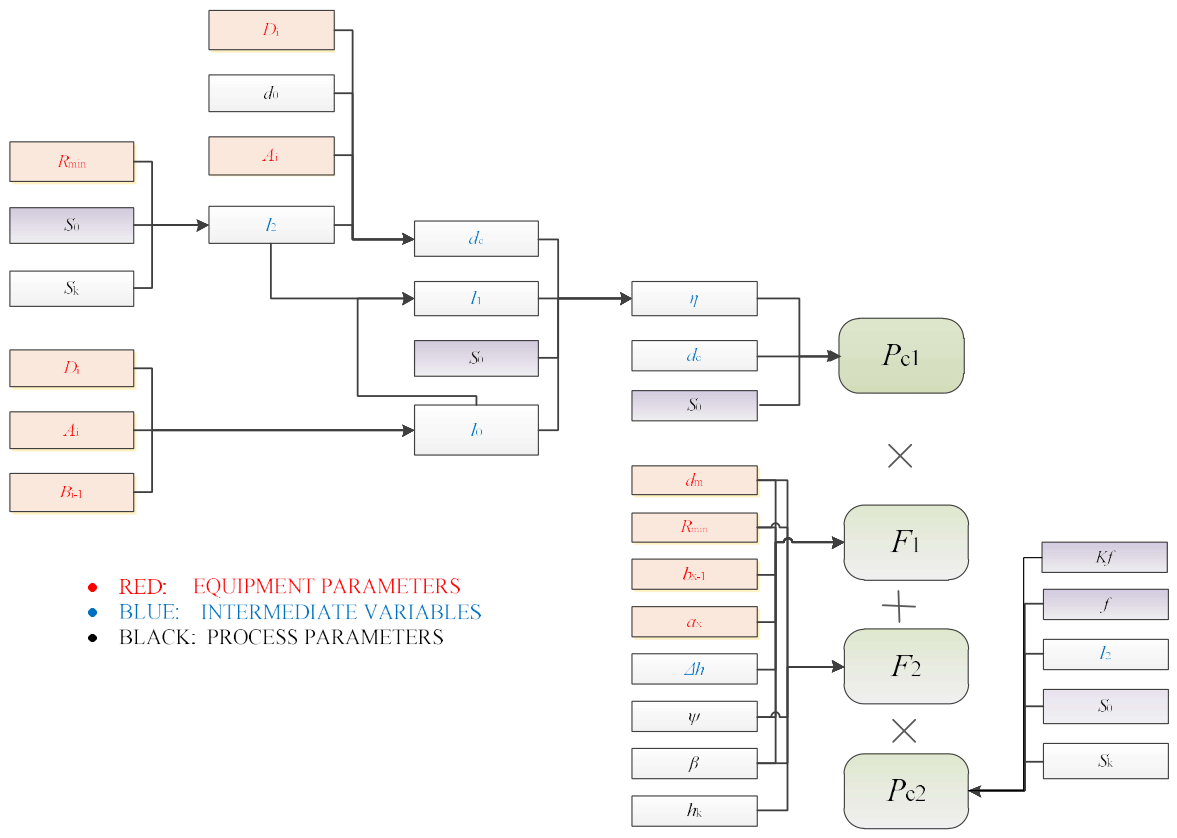
Figure 3.
Relationship between rolling force and value of normalized effective parameters.
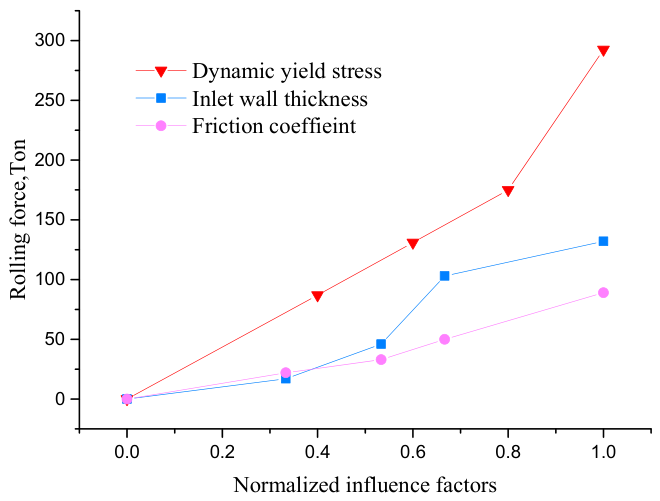
Figure 4.
Box plots of normalized data.
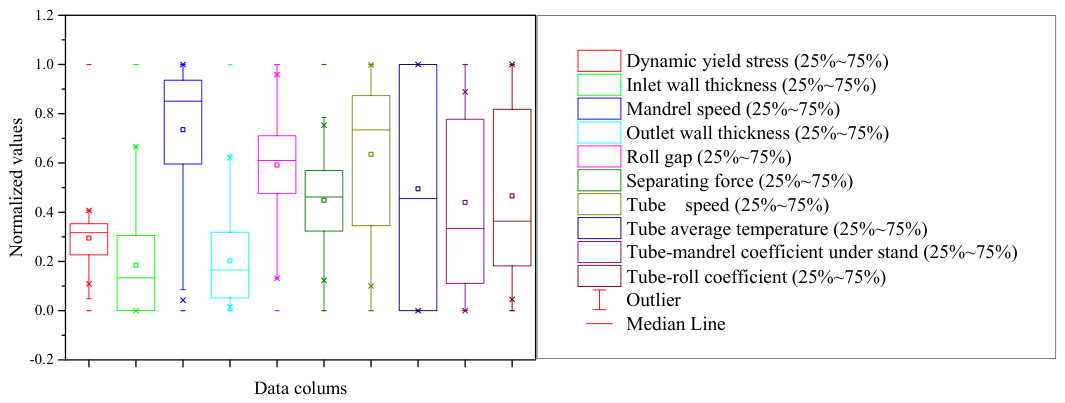
Figure 5.
Grey relational grade of the influencing factors along with different resolution coefficients.
Figure 5.
Grey relational grade of the influencing factors along with different resolution coefficients.
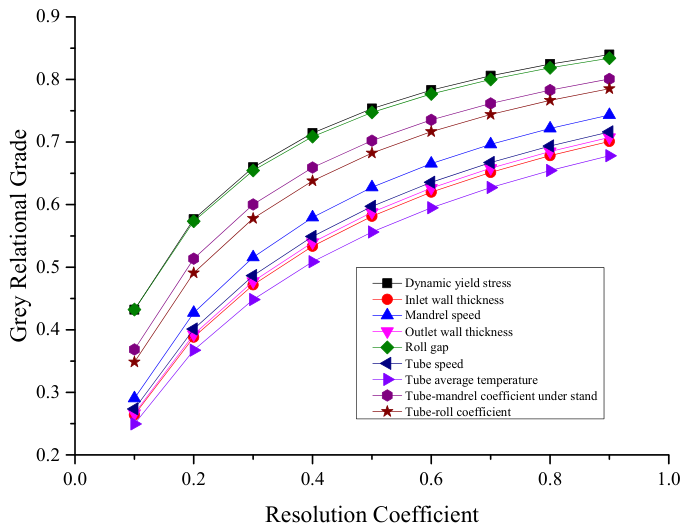
Figure 6.
Assembly of Abaqus 3D thermal-mechanical coupled model for FQM rolling.
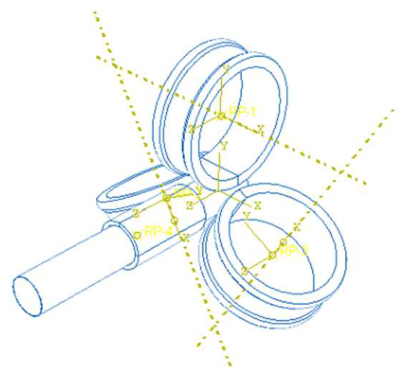
Figure 7.
Relationship between rolling force and value of normalized effective parameters.
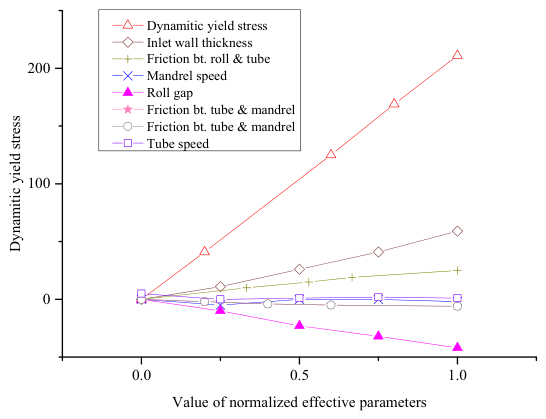

Table 1.
Minimum, maximum, median value and unit of initial data.
| Parameter | Min | Median | Max | Unit |
| Dynamic yield stress | 11.12 | 14.14 | 20.66 | MPa |
| Inlet wall thickness | 14.74 | 17.39 | 34.68 | mm |
| Mandrel speed | 480 | 880 | 950 | mm/s |
| Outlet wall thickness | 7.62 | 10.91 | 27.57 | mm |
| Roll gap | 11.5 | 14.47 | 16.37 | mm |
| Pipe speed | 719 | 1292.4 | 1500 | mm/s |
| Pipe average temperature | 1090 | 1099.1 | 1110 | ℃ |
| Pipe-mandrel coefficient under stand | 0.05 | 0.053 | 0.059 | - |
| Pipe-roll coefficient | 0.354 | 0.362 | 0.376 | - |
| Separating force | 132 | 192 | 262 | ton |
Table 2.
Input data of effective parameters.
| Parameter Name | No.1 | No.2 | No.3 | No.4 | No.5 | Unit |
| Friction coefficient bt. Roll & Tube | 0.2 | 0.3 | 0.359 | 0.4 | 0.5 | |
| Inlet wall thickness | 17 | 18 | 19 | 20 | 21 | mm |
| Friction coefficient bt. Tube & Mandrel | 0.04 | 0.05 | 0.06 | 0.07 | 0.09 | |
| Dynamic yield stress (multiple) | 0.75 | 1 | 1.5 | 1.75 | 2 | |
| Rolling speed | 6.6 | 7.6 | 8.6 | 9.6 | 10.6 | m/s |
| Mandrel speed | 820 | 920 | 1020 | 1120 | 1220 | mm/s |
| Roll gap | 17.5 | 18.5 | 19.5 | 20.5 | 21.5 | mm |
Table 3.
Slope of the fitted curve.
| Value of Normalized Effective Parameters | Slope of the Fitted Curve |
| Dynamic yield stress | 211 |
| Inlet wall thickness | 59.2 |
| Roll gap | 42 |
| Friction coefficient between roll and tube | 25 |
| Friction between tube and mandrel | 6 |
| Tube speed | 2.4 |
| Mandrel speed | 0.4 |
Disclaimer/Publisher’s Note: The statements, opinions and data contained in all publications are solely those of the individual author(s) and contributor(s) and not of MDPI and/or the editor(s). MDPI and/or the editor(s) disclaim responsibility for any injury to people or property resulting from any ideas, methods, instructions or products referred to in the content. |
© 2026 by the author. Licensee MDPI, Basel, Switzerland. This article is an open access article distributed under the terms and conditions of the Creative Commons Attribution (CC BY) license.
Copyright: This open access article is published under a Creative Commons CC BY 4.0 license, which permit the free download, distribution, and reuse, provided that the author and preprint are cited in any reuse.


