

Submitted:
01 July 2026
Posted:
02 July 2026
You are already at the latest version
Abstract
Greek olive groves are subject to multiple thermal, water, biotic, and extreme-weather pressures, yet national-scale maps of their combined historical exposure remain limited. The present study quantified climate risk for olive cultivation across Greece using twenty agroclimatic indicators grouped into four thematic categories. Using hourly ERA5-Land data (1995–2024) and quality-controlled ESWD reports (2014–2024), each indicator rec-orded how often predefined adverse thresholds were met at the grid-cell level during the reference period. We integrated the resulting layers using a weighted multi-criteria deci-sion analysis, with lethal frost applied as a separate constraint, to produce a composite spatial distribution of climate risk and district-level summaries linked to CORINE Land Cover 2018, olive-grove class (2.2.3). Composite risk was spatially heterogeneous: cold and frost recurrence predominated in northern and upland areas, whereas water-related indicators occurred most persistently in southern and island districts, including eastern Crete. Most of the mapped olive-grove area fell into intermediate composite classes ra-ther than at the extremes of the score range. Comparison with a recent nationwide olive suitability assessment showed agreement in major western and southern producing dis-tricts, but also contrasting patterns where high suitability coincided with elevated recur-rence-based risk. The resulting products provide a national historical baseline for cli-mate-risk recurrence in Greek olive groves, offer a spatial basis for regionally targeted adaptation planning, and demonstrate the applicability of an AI-Assisted geospatial framework for reproducible national-scale climate-risk assessment of perennial crops.
Keywords:
ERA5-Land
; agroclimatic indicators
; Mediterranean agriculture
; multi-criteria decision analysis
; frost risk
; water stress
; pest and disease bioclimatic risk
; olive cultivation
1. Introduction
Global climate change is fundamentally altering terrestrial ecosystems, posing significant challenges to agricultural production, food security, and worldwide economic stability [1]. The Mediterranean Basin, in particular, is widely recognized as a primary climate change hotspot, experiencing warming rates that significantly exceed global averages, alongside profound alterations in seasonal precipitation patterns [2,3]. These rapid climatic shifts may lead to a higher frequency of extreme weather events, forcing the spatial redistribution of agricultural zones and threatening the viability of traditional crops. In this context of increasing uncertainty, understanding and evaluating climate risk has become imperative for agricultural sustainability. Climate risk in the agricultural sector is formally defined as the potential for adverse consequences resulting from the complex interaction between climate-related hazards, the exposure of crop systems to these hazards, and their underlying vulnerability [1]. Accurately assessing this risk requires a holistic approach, as it manifests through multiple interacting dimensions: abiotic stressors directly impact plant physiology, while shifting climatic conditions simultaneously alter the population dynamics of biotic threats, such as pests and diseases.
Among the crops highly exposed to these multifaceted climate risks, the olive tree (Olea europaea L.) holds a distinctly prominent position. Historically intertwined with the Mediterranean landscape, olive cultivation is a fundamental pillar of the regional agro-ecosystem and diet [4]. In Greece, the olive sector is of paramount socio-economic importance, sustaining rural livelihoods and employment and contributing significantly to national agricultural production and regional economies [5,6]. Consequently, disruptions to olive production may have substantial economic implications for the country.
Despite its historical reputation for resilience and drought tolerance, the physiological and phenological cycles of the olive tree are highly sensitive to recent climatic anomalies. Proper floral differentiation and successful budbreak largely depend on the accumulation of winter chilling units. Rising winter temperatures increasingly disrupt this essential dormancy period, resulting in poor flower development, high percentages of staminate flowers, reduced fruit set, and substantial yield declines in abnormally warm years [4,7]. Furthermore, extreme heat stress combined with severe water deficits during the critical stages of late spring flowering and summer fruit development limits the plant's photosynthetic capacity, induces early fruit drop, and negatively alters the biochemical composition and quality of the produced olive oil [8,9]. Due to these synergistic stressors, spatial shifts in cultivation suitability are projected, forcing optimal olive-growing zones to migrate northward, potentially widening regional economic disparities [10,11].
To accurately map these spatial vulnerabilities and quantify climate risks, the scientific community increasingly leverages Geographic Information Systems (GIS), meteorological reanalysis datasets, and Multi-Criteria Decision Analysis (MCDA). These advanced geospatial tools enable the detailed visualization of agricultural risks and form the backbone of modern precision farming and adaptation strategies [12,13]. Within Greece, recognizing and mitigating these spatial climate risks is an urgent national priority [6]. A growing body of scientific literature has sought to quantify these impacts; however, the existing research landscape remains notably fragmented. For instance, while valuable projections regarding the implications of climate change on olive flowering phenology or the adverse effects of reduced winter chilling have been developed, such analyses are frequently restricted to specific regional environments, such as the island of Crete or the peninsula of Halkidiki [14,15]. Other investigations have focused strictly on single climatic parameters, such as spatiotemporal changes in growing degree days [11], or isolated biotic threats like the olive fruit fly (Bactrocera oleae) in specific islands [16].
Despite these valuable localized contributions, a significant research gap remains. To date, no study has simultaneously evaluated multiple interacting climate risks, encompassing both abiotic extremes and biotic risk factors, across the Greek olive-producing sector. To address this significant research gap, the primary aim of the present study is to evaluate, model, and map the multifaceted climate risks for olive cultivation throughout Greece.
The novelty of this study lies in integrating twenty agroclimatic indices into the first national-scale climate-risk assessment for olive cultivation in Greece, supported by an AI- Assisted geospatial workflow (Oasis) to enable reproducible indicator mapping and spatial analysis. Specifically, these parameters were classified into four main categories: (i) Thermal Indicators, (ii) Water Stress indices, (iii) Bioclimatic indices evaluating the risk of pests and diseases, and (iv) Extreme Weather Events. Climatic thresholds for the individual indices were established primarily from the literature and, where necessary, supplemented by operational mapping rules, such as consecutive-day windows, minimum event durations, and annual frequency criteria, to enable consistent national-scale analysis. Historical climatic datasets were derived mainly from hourly Copernicus ERA5-Land reanalysis for 1995–2024 and complemented by quality-controlled event reports from the European Severe Weather Database for 2014–2024 for selected mechanical hazards.
To facilitate the complex spatial analyses required by this study, a dedicated AI-Assisted geospatial analysis framework, named Oasis, was developed. The system automatically transforms natural-language analytical requests into executable workflows for climate and geospatial processing, enabling the generation of standardized raster-based indicators and spatial assessment products.
2. Materials and Methods
2.1. Study Area
The study area covers the entire territory of Greece. Greece accounts for approximately 9% of olive orchard area in the Mediterranean Basin [4]. The country has a typical Mediterranean climate, although complex topography and maritime influence cause pronounced spatial variability in temperature and precipitation [17]. All analyses were performed at a national scale on a regular gridded domain covering the entire territory of Greece.
2.2. Data Source
Climate inputs were obtained from two complementary sources. Hourly ERA5-Land reanalysis data (Copernicus Climate Change Service) were used for gridded climate data over 1995–2024. The European Severe Weather Database (ESWD) was used to identify severe hail and wind events associated with mechanical crop damage (2014–2024). Both datasets were processed over the full Greek national domain.
2.2.1. ERA5-Land Hourly Reanalysis
The primary climatic data source used in this study was the ERA5-Land dataset provided by the Copernicus Climate Change Service (C3S). ERA5-Land is a global land surface reanalysis dataset that provides a temporally consistent representation of climatic conditions over several decades [18].
The dataset is generated by integrating numerical weather prediction models with multiple observational sources, including satellite observations, surface meteorological stations, and radiosonde measurements. Through this approach, ERA5-Land reconstructs land surface processes and the terrestrial water cycle while maintaining consistency with historical observations [19].
Hourly ERA5-Land data were retrieved from the Copernicus Climate Data Store (CDS) in GRIB format and processed for the period 1995–2024. This 30-year interval was selected to represent long-term climatic conditions in accordance with the climatological normal periods recommended by the World Meteorological Organization [20]. The dataset covers the entire Greek territory and is provided on a regular spatial grid of 0.1° × 0.1°, corresponding to a native spatial resolution of approximately 9 km [18]. Compared with the coarser spatial resolution of the standard ERA5 reanalysis (approximately 31 km), ERA5-Land offers a substantially improved representation of local climatic variability, making it particularly suitable for agroclimatic applications.
The analyses were based on four ERA5-Land variables: total precipitation (TP), potential evaporation (PEV), 2 m air temperature (T2M), and 2 m dew point temperature (D2M). These variables served as the basis for calculating the agroclimatic indicators examined in this study, including metrics related to temperature conditions, precipitation regimes, drought stress, frost occurrence, and bioclimatic risks.
The analysis was conducted at the native spatial resolution of the input datasets. Due to the coarse spatial resolution of ERA5-Land (approximately 9 km) and the pixel center masking approach used during spatial processing, very small islands and narrow coastal features may be underrepresented or excluded when no raster cell center falls within the corresponding land polygon. Coastal grid cells may also represent mixed land and sea conditions, introducing local scale uncertainty. These effects may influence individual coastal pixels but are not expected to affect the broader spatial patterns or regional scale comparisons presented in this study.
2.2.2. European Severe Weather Database (ESWD)
In addition to ERA5-Land reanalysis data, severe weather events with the potential to cause direct mechanical damage to olive groves were analyzed using records from the European Severe Weather Database (ESWD). The ESWD, maintained by the European Severe Storms Laboratory (ESSL), is one of the main sources of severe weather reports across Europe [21].
Only quality-controlled ESWD reports were retained in order to improve data reliability. Specifically, records classified as QC1 and QC2 were included, while unverified QC0 reports were excluded. In the ESWD quality-control scheme, QC1 reports are confirmed by a reliable source, whereas QC2 reports have undergone more comprehensive verification.
Two hazard types were considered:
- Severe wind gusts, defined as wind gusts exceeding 25 m s⁻¹ or gusts causing damage of equivalent intensity, according to the ESWD reporting criteria.
- Large hail, defined as hail with a reported diameter of at least 2.0 cm.
These hazards were selected because they are particularly relevant to olive cultivation and can cause direct mechanical damage, create entry points for microbes, and lead to fruit loss, branch breakage, and structural damage to trees. ESWD reports for Greece were initially retrieved for the period 1995-2024. However, preliminary processing and visualization showed a pronounced increase in the number of reports from 2014 onwards (Figure 1). This increase is likely related primarily to improvements in reporting efficiency and other non-meteorological factors, rather than to an abrupt change in the actual climatic frequency of severe weather events. To reduce potential reporting bias and ensure greater temporal consistency, the analysis was therefore restricted to the more consistently documented period 2014-2024.
Special attention was given to the treatment of multiple reports associated with the same meteorological event. A single severe weather system may generate several ESWD entries when impacts are reported from different locations. Consequently, relying on the raw number of reports could overestimate the frequency of damaging events. To minimize this bias, the analysis was based on the annual presence or absence of at least one qualifying event within each analysis unit, rather than on the absolute number of reports.
2.3. Corine Land Cover
Corine Land Cover (CLC) data use MMU of 25 ha for areal elements (fields, pastures, etc.), minimum width of 100 m for linear elements (https://land.copernicus.eu/pan-european/corine-land-cover). CLC was initiated in 1985 (reference year 1990). Thus far, updates have been produced in the years 2000, 2006, 2012, and 2018, while the latest version is still under validation. The regular cycle information provided allows the demonstration of differences between succeeding records [22]. Their results are comparable since the basic technical parameters of the inventory have not changed from the beginning of the project
In this study, the olive-grove raster layer included in the dataset was used to map the spatial distribution of olive cultivation in Greece and to support the statistical analyses.
2.4. Design and Implementation of an AI-Assisted Geospatial Analysis System
Processing hourly ERA5-Land data for the period 1995 to 2024 and deriving multiple indicator layers at the national scale required repeated spatiotemporal operations on large multidimensional climate datasets. Although platforms such as Google Earth Engine provide extensive processing capabilities, the combination of an hourly temporal resolution, a 30-year analysis period, and national-scale spatial coverage introduces practical constraints on runtime, data handling, and workflow reproducibility. To address these challenges, an AI-Assisted system named Oasis was developed to support local analysis of archived climate datasets and the reproducible generation of raster outputs. Oasis translates analytical requests expressed in natural language into executable Python workflows. For each task, it combines dataset metadata, predefined processing rules, and AI model capabilities to generate code tailored to the selected datasets, variables, spatial extent, temporal window, and threshold criteria. Before execution, the system checks the scripts for syntax, dataset compatibility, and consistency with the requested logic. The resulting spatial output is then visualized directly within the application for immediate inspection. Export of the generated raster layer and the corresponding Python script is optional and can be performed when further storage, validation, or reuse is required.
The AI component supports both locally hosted models through Ollama and externally hosted models accessed through OpenRouter using user-provided API keys, enabling flexible model selection. Regardless of the selected provider, the generated code executes locally on archived datasets, ensuring the analysis remains reproducible and directly linked to the study data. In general, compared with conventional GIS workflows requiring manual scripting and repeated preprocessing, Oasis improves workflow reproducibility, reduces operator-dependent variability, and enables rapid generation of standardized agroclimatic indicators.
In the present study, the ERA5-Land data were externally preprocessed and organized in NetCDF format, with the relevant variables converted into consistent units where necessary, such as millimeters and degrees Celsius. Oasis was then used to generate the raster layers of the indicators derived from ERA5-Land. The two ESWD-derived variables, severe wind gusts and large hail, were processed separately outside Oasis and converted into annual presence-absence layers.
The system also includes a multi-criteria decision analysis module that combines the saved raster layers using user-defined weights and constraints. This module was used to produce the final integrated climate-risk map, along with the contribution layers for each indicator, which were later used in the statistical summaries and comparative spatial analyses presented in the study. Technical documentation and a demonstration video for OASIS are available in a Zenodo record [23] (https://doi.org/10.5281/zenodo.20764711).
The role of Oasis within the overall methodological procedure, from prepared climate data and indicator rules to raster generation and final MCDA mapping, is summarized in Figure 2.
2.5. Indicator Definitions
The climate risk mapping was based on indicators selected to represent adverse conditions for olive cultivation. Rather than describing average climate, these indicators quantify the recurrence of events or stress conditions that may affect olive phenology, water availability, pest and disease pressure, or directly damage trees and fruit. Each indicator was therefore expressed as the number of years, or cultivation periods, within the reference period in which a predefined adverse-condition rule was met at each raster cell.
Indicator rules were defined using literature-based thresholds and operational criteria adapted to national-scale comparative assessment. The following subsections describe the indicators by thematic group.
2.5.1. Thermal Indicators
Thermal conditions are among the main climatic controls of olive phenology, productivity, and tree survival. Both low and high temperature extremes can affect key developmental stages, from winter dormancy and bud differentiation to flowering, fruit set, and summer fruit growth. For this reason, the thermal component of the analysis included indicators describing cold exposure, insufficient winter chilling, heat stress, and short-term temperature variability. The specific rules for representing these thermal risks are described below.
- Extreme frost. Severe winter minimum temperatures were represented using two thresholds. In both cases, exposure was counted when at least one day included six consecutive hours below the respective temperature limit. The first threshold, Tmin ≤ −5 °C, identifies areas where recurrent winter cold may increase cultivation risk; damage to annual shoots and permanent fruit shrinkage, even at slightly higher sub-zero values, may affect long-term productivity. The second threshold, Tmin ≤ −12 °C, represents a more severe cold condition approaching the survival limit of the tree crown. At this level, damage may extend to woody tissues and the trunk, increasing the risk of irreversible injury or tree loss [24,25].
- Heat stress. Heat stress was defined as years with more than 20 days of daily maximum temperatures above 35 °C. Recurrent exceedance of this threshold within a year may suppress photosynthesis, reduce tree vigour, and adversely affect fruit development, yield, and oil quality [26].
- Flowering heat stress. Heat exposure during flowering was assessed for April and May, when olive flowers are particularly sensitive [26]. Daily maximum temperature above 32 °C has been associated with reduced pollen viability and impaired fruit set [27]. In this study, a high-risk year was operationally defined as one with at least one three-day event above this threshold.
- Spring frost. Late frost events after dormancy break were assessed for the period from 1 March to 30 April. Years were counted when at least one day recorded six consecutive hours with a temperature at or below 0 °C. Unlike winter frost, spring frost can damage developing buds, flowers, and young tissues, with direct consequences for flowering, fruit set, and total production [25,28].
- Chilling hours Winter chilling was assessed for each cross-year season from 15 November to 15 March. Chilling hours were accumulated for temperatures between 0 and 7.2 °C using the simple chilling-hours model [29]; periods with fewer than 200 hours were recorded as adverse. Requirements vary among cultivars, and values in the order of 200–300 hours have been reported as a lower range below which flowering and bearing may be affected [30]. Insufficient chilling is further associated with disrupted flowering and fruit-bud development [31].
- Mean annual temperature. Broader thermal departure from favourable conditions was assessed using annual mean air temperature. Years were counted when values fell outside the 15 to 20 °C range. Lower values are associated with slower growth and delayed phenology, while higher values, especially where rainfall is limited, may increase thermal stress and affect both quantity and quality [24].
- Diurnal temperature range. Large day-night temperature swings during the pre-flowering period were assessed for March and April. A year was counted when more than twenty days recorded a daily temperature range (Tmax — Tmin) exceeding 12 °C. The March-April window and the 12 °C and 20-day criteria were adopted as operational mapping rules. Such conditions before flowering may bring flowering forward [32]. In rainfed olive systems, higher DTR has also been linked to lower yields [33].
2.5.2. Water Stress Indicators
Water stress is a major constraint for olive cultivation in Mediterranean environments, where rainfall is highly seasonal and prolonged dry periods often coincide with high evaporative demand. Although olive trees are relatively drought tolerant, water limitation during sensitive phenological stages can reduce vegetative growth, flowering, fruit set, and oil accumulation. The selected indicators therefore describe complementary aspects of hydrological stress, including insufficient rainfall, uneven seasonal distribution, prolonged dry spells, climatic aridity, and precipitation deficits during key stages of crop development.
- Annual total precipitation.
Total precipitation was summed for each calendar year, and years with cumulative precipitation below 350 mm were recorded as adverse. Although olive is drought tolerant, this threshold represents a minimum annual water input commonly associated with rainfed cultivation in dry Mediterranean systems [10].
- Precipitation seasonality index.
Rainfall distribution within each year was assessed using the seasonality index, calculated as:
where Pdriest and Pwettest are the total precipitation of the three driest and three wettest months, respectively. High Is values indicate strongly concentrated wet seasons and pronounced summer dryness, whereas low values indicate a more uniform distribution of rainfall across the year. In Mediterranean climate classification, Is has been interpreted alongside the spatial distribution of olive cultivation, which acts as a bioclimatic indicator of suitable rainfall regimes. Olive groves are concentrated mainly in intermediate Is classes and are largely absent from climates with near-uniform rainfall or desert-like seasonality. Olive cultivation therefore corresponds to an intermediate Mediterranean window rather than to either extreme of the index [34]. In the present study, years with Is < 0.60 or Is > 0.95 were treated as departures from an adapted acceptable range for Greece.
- Aridity index (AIPEV).
The balance between annual precipitation and atmospheric evaporative demand was assessed using an aridity index. In conventional applications, the aridity index (AI) is defined as the ratio of precipitation to potential evapotranspiration (PET) and is widely used to classify dryland climates; values below 0.20 are commonly associated with arid conditions. Because ERA5-Land provides potential evaporation (PEV) over open water surface rather than PET for a reference crop, a modified index was adopted to reflect the available reanalysis variables. PEV does not account for the regulatory effect of vegetation and is systematically higher than PET, especially under very dry conditions, when enhanced PEV may overestimate evaporative demand [19]. AIPEV therefore represents a conservative measure of climatic water deficit and atmospheric evaporative pressure. Annual aridity was expressed as:
where TP is total annual precipitation, and PEV is total annual potential evaporation. Lower values indicate stronger water deficit, whereas higher values correspond to more favourable hydroclimatic conditions. Years with AIPEV below 0.20 were recorded as adverse. Retaining the conventional 0.20 threshold for AIPEV, rather than recalibrating it for PEV, makes the indicator more sensitive to water-limited conditions, under which rain-fed olive production is unlikely to remain viable and irrigation becomes necessary.
- Consecutive dry days.
Prolonged rain-free periods were assessed during the active growing season, from 1 April to 31 October. For each year, the maximum sequence of consecutive days with daily precipitation below 1 mm was calculated, and years with more than 40 consecutive dry days were recorded as adverse. This seasonal window excludes winter dormancy, when olive water requirements are comparatively low. The 40-day threshold was used to represent prolonged water limitation during the main growth and fruit-development period, consistent with evidence that Mediterranean olive cultivars differ in drought tolerance, with Koroneiki showing high sensitivity and more drought-resistant cultivars tolerating rain-free periods of around 42 days [35]. Extended consecutive dry periods are mainly observed in southern Greece [17] .
- Standardized Precipitation Index.
Relative precipitation anomalies were evaluated using the three-month Standardized Precipitation Index (SPI) [36], calculated for two phenologically important periods: April to June and September to November. The first period corresponds to flowering and fruit set, while the second corresponds to fruit ripening and oil accumulation. SPI compares accumulated precipitation during each period with the long-term local distribution for the same calendar window, allowing unusually dry conditions to be identified relative to the normal rainfall regime of each area [37].
For each trimester, accumulated precipitation totals were fitted to a probability distribution and transformed to a standardized normal variate, with negative values indicating drier-than-normal conditions relative to the local reference period. Years with SPI below -1.5 were recorded as adverse, corresponding to severely to extremely dry conditions. Because SPI measures relative precipitation anomalies rather than absolute water deficit, it identifies years in which rainfall during a critical phenological window departed substantially from local climatological expectations.
2.5.3. Bioclimatic Indicators of Pest and Disease Risk
The incidence and severity of olive pests and diseases depend strongly on prevailing thermo-hygrometric conditions, which determine how favourable the climate is for biological activity and infection. This component of the analysis did not model life cycles, host phenology, or management interventions. Instead, it identified climatic windows of elevated risk based on combinations of temperature, humidity, and the duration of suitable conditions. The specific rules used to represent these bioclimatic risks are described below.
- Olive fruit fly.
Climatic favourability for the olive fruit fly (Bactrocera oleae) was assessed for July to October, when adult activity, oviposition, and population development are most critical. A high-risk episode was defined as three consecutive days with daily maximum temperature between 25 and 29 °C and mean daily relative humidity between 55 and 75%, conditions associated with optimal insect activity and successful oviposition [38,39]. Years with more than five such three-day episodes were recorded as adverse. Frequent occurrence of these conditions indicates increased climatic suitability for fly reproduction and sustained pest pressure, with potential effects on fruit infestation, yield, and oil quality [31].
- Olive anthracnose.
Risk conditions for olive anthracnose (Colletotrichum spp.) were assessed for October and November, when fruit ripening coincides with the main period of epidemic development. Free moisture on the fruit surface, required for infection, was approximated using dew-point depression (DPD), defined as the difference between air temperature and dew-point temperature; values below 1.8 °C indicate conditions conducive to surface wetness [40]. A high-risk day was defined as any day with at least one consecutive 12-hour period during which the mean hourly temperature was between 17 and 25 °C and the DPD was below 1.8 °C, reflecting temperature and wetness requirements for infection and sporulation [41]. Years with more than 3 high-risk days during October–November were considered adverse. Under such conditions, fruit rot, premature fruit drop, and deterioration in oil quality may become more likely.
- Olive peacock spot.
Risk conditions for olive peacock spot (Venturia oleagina) were assessed for September to May, covering the main infection period in Mediterranean olive groves [42]. Infection requires free moisture on leaf surfaces; high relative humidity alone is insufficient when liquid water is absent [43]. Surface wetness was therefore approximated using DPD ≤ 1.8 °C [40]. A high-risk day was defined as any day with at least nine consecutive hours with mean hourly temperature between 15 and 20 °C and DPD at or below 1.8 °C, consistent with the leaf wetness duration required for infection near optimal temperatures [43]. Cross-year seasons with more than 20 high-risk days were recorded as adverse. Prolonged occurrence of such conditions favours leaf infection, defoliation, and progressive yield decline [44].
2.5.4. Extreme Weather Indicators
Heavy rain, hail, and severe wind can damage olive groves directly, affecting both the current harvest and the long-term condition of the trees. Intense rainfall may increase runoff, soil erosion, and nutrient loss, whereas hail and storm-force wind can injure fruit, shoots, and permanent wood.
- Heavy precipitation.
Years with at least one day of daily precipitation exceeding 50 mm were recorded as adverse. This threshold provides a clear measure of very intense rainfall associated with runoff, soil degradation, and limited soil moisture recharge in Mediterranean olive groves [45,46].
- Hail.
Hail risk was assessed from episodes with hailstone diameter greater than 2.0 cm. Years with at least one such episode were recorded as adverse. Hailstones of this size can cause severe mechanical injury to fruits and shoots, extensive fruit drop, defoliation, and wounds that may facilitate secondary infection, including olive knot caused by Pseudomonas savastanoi [44,47].
- Severe wind.
Severe wind risk was assessed from episodes with wind gusts equal to or greater than 25 m s⁻¹, corresponding approximately to storm-force conditions. Years with at least one such episode were recorded as adverse. Although olive trees are relatively wind-resistant, repeated exposure to storm-force gusts can break branches, uproot trees on shallow soils, and cause extensive flower or fruit drop, with negative consequences for orchard productivity and long-term viability [44].
For clarity, Table 1 summarizes the adverse-condition definitions, temporal windows, and literature basis used for all agroclimatic indicators included in the MCDA framework.
2.6. Indicator Scoring and Multi-Criteria Synthesis
The individual indicator layers were combined to produce a composite climate risk map for olive cultivation in Greece. The analysis followed a frequency approach, in which each raster cell records how often an adverse condition occurred during the corresponding reference period. These frequency layers were then multiplied by the assigned indicator weights and summed to obtain a composite risk score. The resulting score was subsequently normalized to a 0–1 scale for classification and interpretation.
Nineteen indicators were included in the weighted calculation. The lethal frost indicator, defined by Tmin ≤ −12 °C, was treated separately as a hybrid constraint, because it represents a critical biological limit for olive tree survival rather than a gradual stress factor. The following subsections describe the definition of indicator weights, the calculation of indicator risk scores, the composite risk calculation, and the final treatment of lethal frost and risk classification.
2.6.1. Definition of Indicator Weights
To combine the individual indicator layers into a single climate risk map, each indicator was assigned a weight expressing its relative contribution to overall risk for olive cultivation. The weighting scheme was based on the expected severity of each stress factor, its potential effect on tree survival and/or productivity, the reversibility of the associated damage, and the degree to which the condition can be managed through cultivation practices.
Higher weights were assigned to indicators associated with critical phenological stages, severe thermal stress, water limitation, or long-term impacts on tree productivity. Lower weights were assigned to indicators representing more localized, episodic, or partly manageable risks. The lethal frost indicator, defined by Tmin ≤ -12 °C, was excluded from the weighting scheme and was treated separately as a constraint in the final classification step.
Table 2 presents the indicators included in the weighted calculation, together with the assigned weights.
The weights were not assigned arbitrarily but were defined according to the agronomic relevance of each indicator, the severity of the adverse condition represented by the selected threshold, and the strength of the available literature support. Greater weight was assigned to indicators representing conditions with well-documented and direct effects on olive tree physiology, productivity, or long-term cultivation risk.
Although the weighting scheme inevitably contains an expert-based component, the assigned values reflect the relative agronomic importance of each stress factor as consistently reported in the literature and were selected to provide a balanced representation of olive climate risk rather than to optimize the prediction of any specific historical dataset.
Hail and severe wind were retained because they can cause direct mechanical damage to olive groves, but were assigned conservative weights, as they are based on ESWD records for the shorter period 2014–2024. Spatial differences in reporting efficiency may also affect these layers.
2.6.2. Calculation of Indicator Risk Scores
For each indicator, the corresponding raster layer represented the number of years or cultivation periods in which the predefined adverse condition was met at each pixel. These count values were converted into frequency scores in order to account for differences in the length of the reference period among indicators. For indicator I and pixel p, the score was calculated as:
where Rᵢ,p is the frequency score of indicator I at pixel p, nᵢ,p is the number of years or cultivation periods in which the adverse condition was recorded, and Nᵢ is the total number of reference periods available for that indicator.
For most indicators derived from ERA5-Land, Nᵢ = 30, corresponding to the 1995–2024 period. For indicators based on ESWD reports, Nᵢ = 11, corresponding to the 2014–2024 period. For cross-year periods, such as chilling hours and olive peacock spot, Nᵢ was defined according to the number of complete seasons available in the dataset. The resulting score ranges from 0 to 1, with higher values indicating more frequent occurrence of the adverse condition.
2.6.3. Composite Risk Calculation
After the frequency score of each indicator was calculated, the weighted contribution of each indicator was estimated by multiplying its frequency score by the assigned weight. For indicator I and pixel p, the weighted contribution was calculated as:
where Cᵢ,p is the weighted contribution of indicator I at pixel p, Rᵢ,p is the corresponding frequency score, and Wᵢ is the assigned indicator weight expressed as a proportion of the total weight.
Cᵢ,p = Wᵢ · Rᵢ,p ,
The composite climate risk score was then calculated as the sum of the weighted contributions of all indicators included in the weighted calculation:
where Sₚ is the composite risk score at pixel p. The resulting raster represents the combined recurrence of adverse climatic, bioclimatic, and extreme weather conditions, accounting for both the frequency of each condition and its relative importance in the weighting scheme. The weighted indicator layers were summed within the MCDA module to produce a raw composite climate-risk score. The same module then rescaled the composite output to a 0–1 range, allowing the final raster to be classified and compared across the study area.
Sₚ = Σ Cᵢ,p ,
2.6.4. Lethal Frost Constraint and Risk Classification.
The lethal frost indicator, defined as Tmin ≤ −12 °C for at least six consecutive hours, was applied separately from the weighted calculation. This threshold was treated as a hybrid constraint because it represents a critical biological limit for olive tree survival rather than a gradual stress condition.
For each raster cell, the number of years meeting the lethal frost rule was evaluated after the normalized composite score had been calculated. Cells with three or more years of lethal frost occurrence were assigned to the maximum risk value of 1.0. Cells with one or two years of occurrence received an additional risk penalty of 0.3, with the final value capped at 1.0. Cells with no lethal frost occurrence remained unchanged.
The final climate-risk score was classified into five equal classes, ranging from very low to very high risk. This classification was used to produce the final climate-risk map and to support spatial interpretation of the results.
3. Results and Discussion
The maps below show where adverse agroclimatic conditions recurred most often across Greece during the reference period. The presentation follows the four thematic groups used in the analysis. Each indicator map displays recurrence at grid-cell level: green tones indicate lower frequency and red tones higher frequency, marking areas where the corresponding rule was satisfied more often during the reference period. Two choices were made to keep the maps readable at the national scale. Areas with zero recorded occurrences remain transparent, so colour appears only where exposure was observed at least once. In addition, the colour scale of each map is adjusted to that indicator’s national maximum, so that spatial contrast within Greece remains visible even when absolute frequencies differ greatly from one indicator to another.
The indicator maps are followed by the composite risk surface, a statistical assessment of existing olive groves by risk class, and summary analyses at the regional and district levels where olive coverage is substantial. In general, the individual indicator maps should be interpreted as recurrence layers that describe the historical frequency of adverse climatic conditions, rather than as deterministic predictions of crop damage.
To facilitate the interpretation of the spatial patterns, two reference maps are provided in the Supplementary Materials. Error! Reference source not found. Presents the administrative regions and district boundaries of Greece, while Error! Reference source not found. Shows the country’s major physiographic features, including the principal mountain systems. These figures provide geographic context for the administrative and physiographic names used throughout the Results and Discussion.
Figure 3 shows the spatial recurrence of extreme frost (Tmin ≤ −5 °C) and lethal frost (Tmin ≤ −12 °C). Extreme frost is widespread across mainland Greece, with the highest frequencies in northern Greece, Thrace, the Pindus range, and parts of central Peloponnese. Lowland coastal areas and most islands show much lower recurrence or none. Lethal frost is far more restricted: the strongest signals occur in northern and northwestern uplands and along the Pindus axis. Together, the two maps show that moderate to severe winter minima recur widely inland, whereas lethal frost is confined mainly to upland zones. Its spatial footprint is limited, but where it occurs, even a few years within the reference period can impose a severe local constraint on olive cultivation.
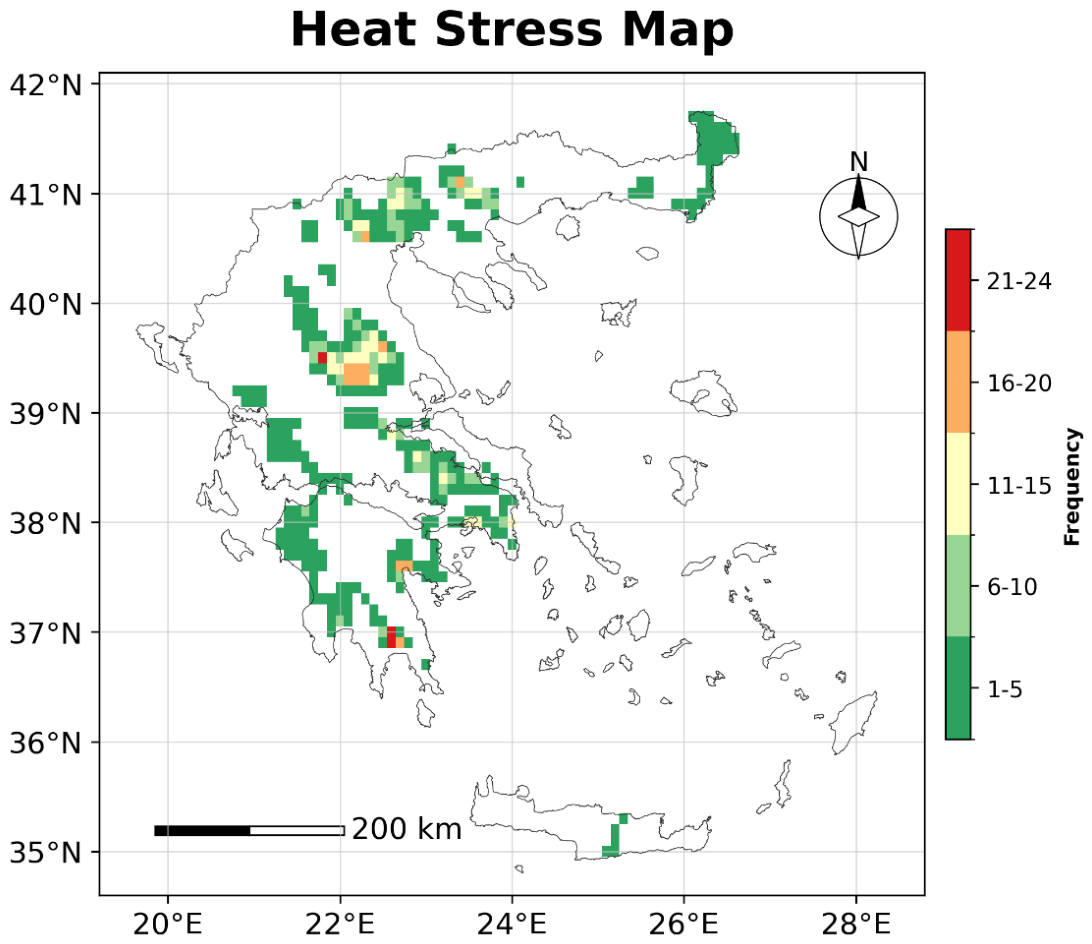
The highest recurrence of heat stress is concentrated in a limited number of inland hotspots. Values of 16 years or more occur mainly in Thessaly, especially in the Larissa-Trikala-Karditsa basin, and in the interior southern Peloponnese, where recurrence reaches up to 24 years in parts of Laconia and Messenia. Elsewhere, including northern Greece, western mainland, coastal belts, and Crete, exposure remains lower, with most areas recording fewer than 16 years or no recurrence at all. Heat stress is therefore concentrated in continental basins rather than in the main coastal and island olive zones.
Figure 4.
Spatial distribution of years affected by heat stress across Greece.
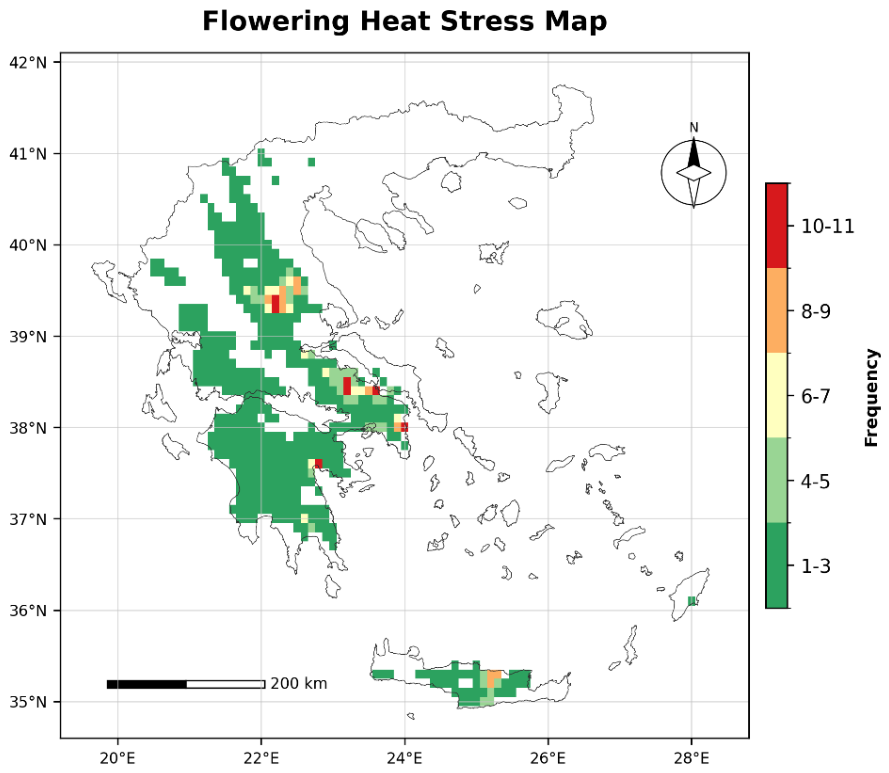
Flowering heat stress is concentrated mainly in lowland central and eastern Greece. The highest recurrence, reaching 10-11 years, occurs in Boeotia, the Karditsa-Larissa lowlands, Chalkida, southern Euboea, and parts of Argolis. Heraklion also records relatively frequent occurrence, at around 8 years, whereas northern Greece shows little or no recurrence.
Figure 5.
Spatial distribution of years affected by flowering heat stress across Greece.
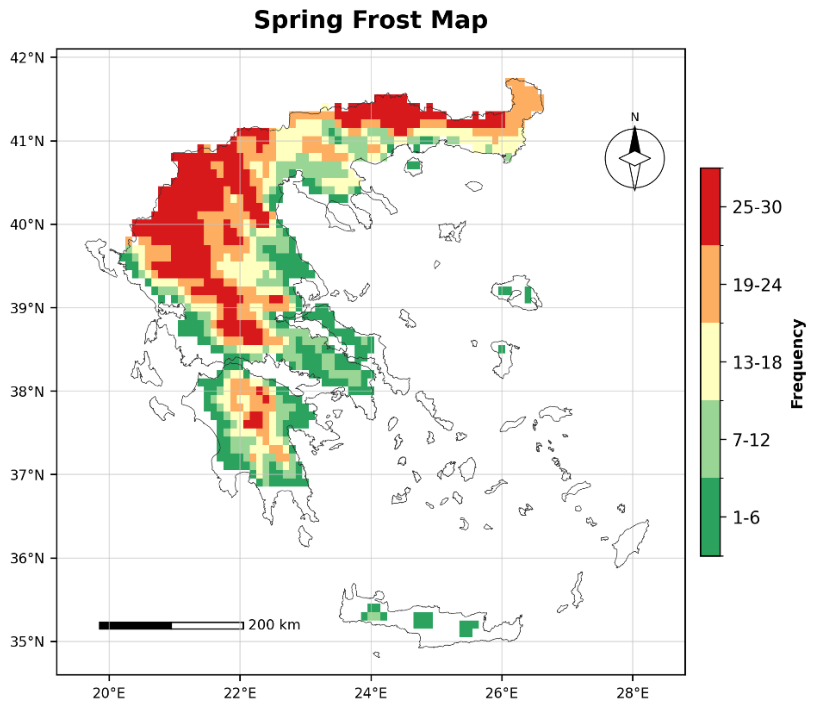
Spring frost is concentrated mainly in inland and upland mainland Greece, with the highest recurrence in northern Greece, the central mountain axis, and parts of the interior Peloponnese. In contrast, most coastal and lowland olive-growing areas, including much of Crete and the southern island zone, show little or no recurrence.
Figure 6.
Spatial distribution of years affected by spring frost across Greece.
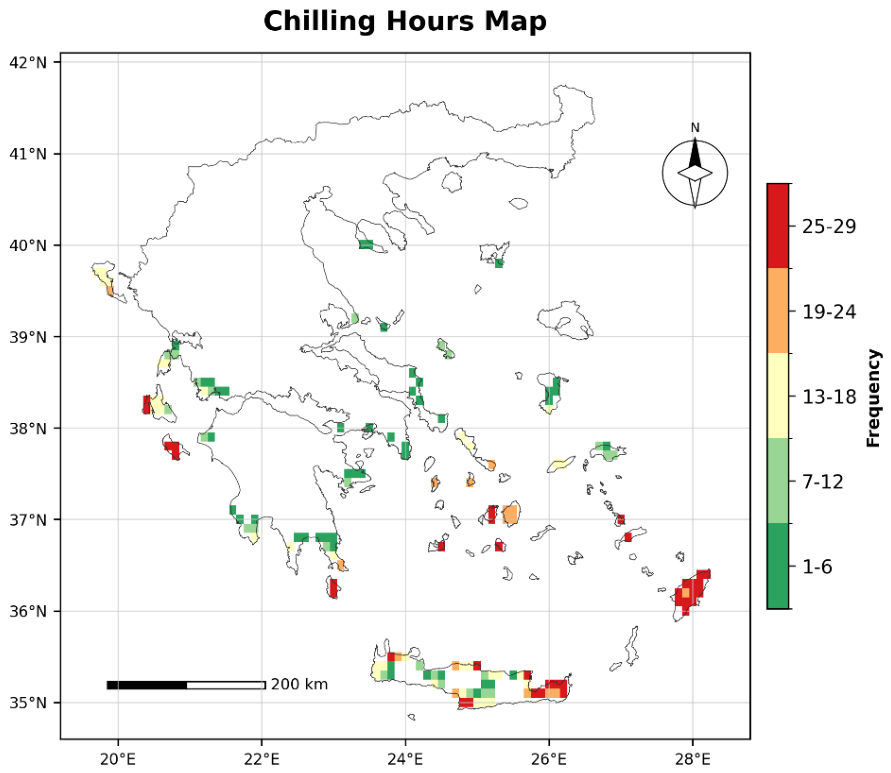
Inadequate accumulation of chilling requirements is confined to southern islands and the coastal fringe. The highest recurrence appears in eastern Crete, Rhodes, the Dodecanese, Kythera (off southeastern Laconia), Zakynthos, and parts of the Cyclades.
Figure 7.
Spatial distribution of seasons affected by insufficient chilling hours across Greece.
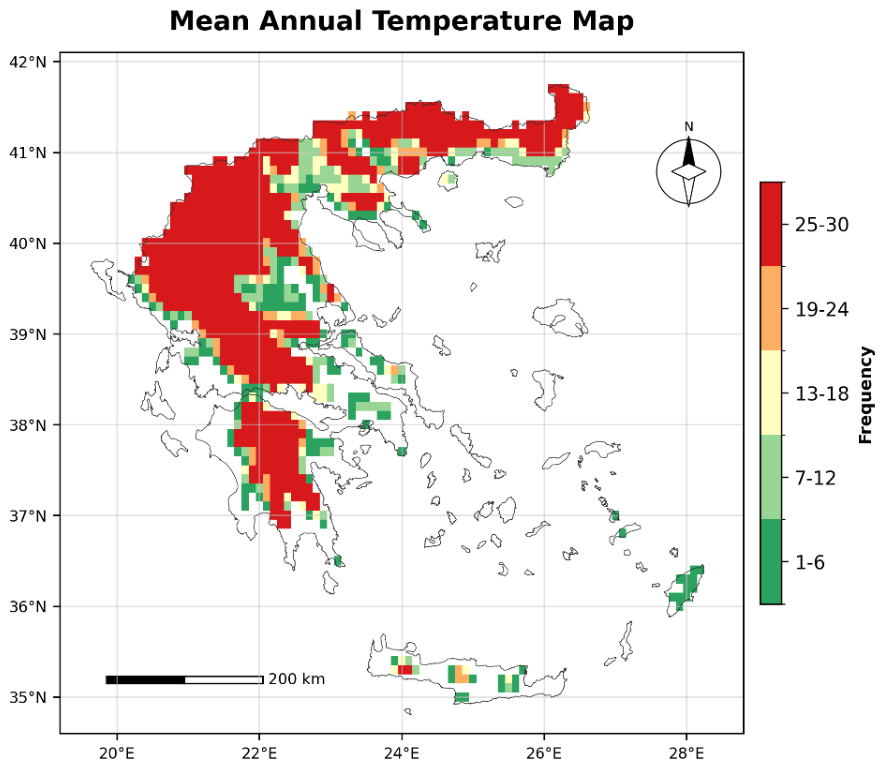
Departure from the optimal mean annual temperature range is most pronounced across the continental interior, especially over western and northern mountain-influenced zones, northeastern Greece and parts of the central and southern mainland. In contrast, the maritime character of the southern coastal belt, the island regions, and much of Crete is associated with fewer occurrences of this thermal mismatch.
Figure 8.
Spatial distribution of years affected by deviation from the optimal mean annual temperature range across Greece.
Figure 8.
Spatial distribution of years affected by deviation from the optimal mean annual temperature range across Greece.
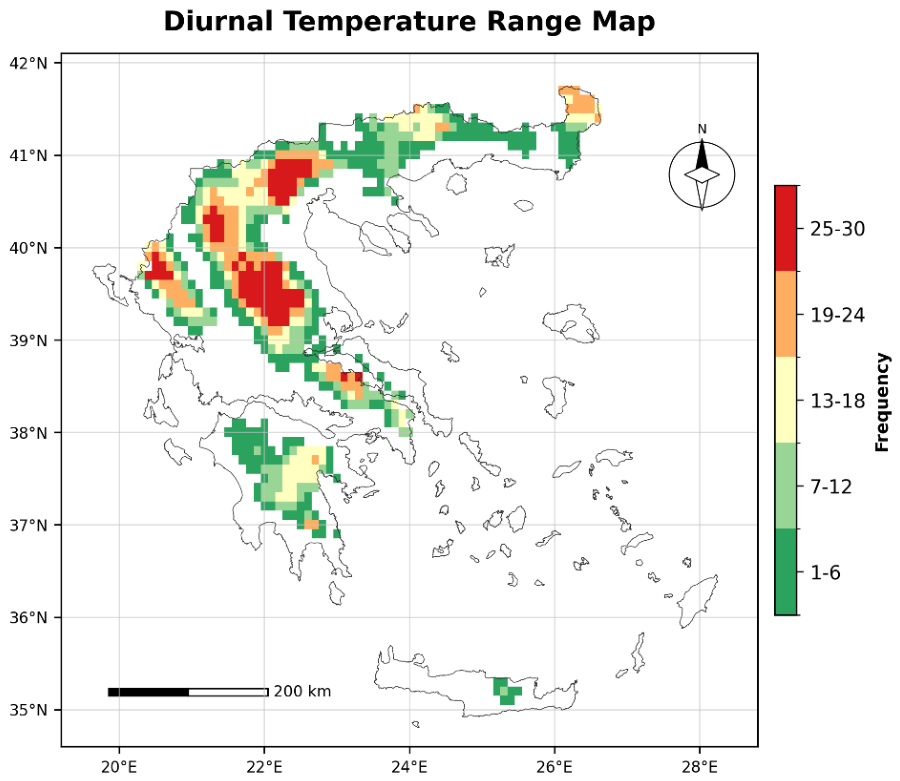
Elevated diurnal temperature variability in March-April is concentrated mainly in inland mainland Greece, especially in Thessaly, western and central Macedonia, northeastern Thrace, Boeotia, and parts of Argolis. This pattern highlights the greater exposure of continental basins and interior lowlands to strong day-night thermal contrasts during a critical phenological period, whereas most coastal areas, the Aegean islands, and much of Crete remain only weakly affected.
Figure 9.
Spatial distribution of years affected by elevated diurnal temperature variability in March-April across Greece.
Figure 9.
Spatial distribution of years affected by elevated diurnal temperature variability in March-April across Greece.
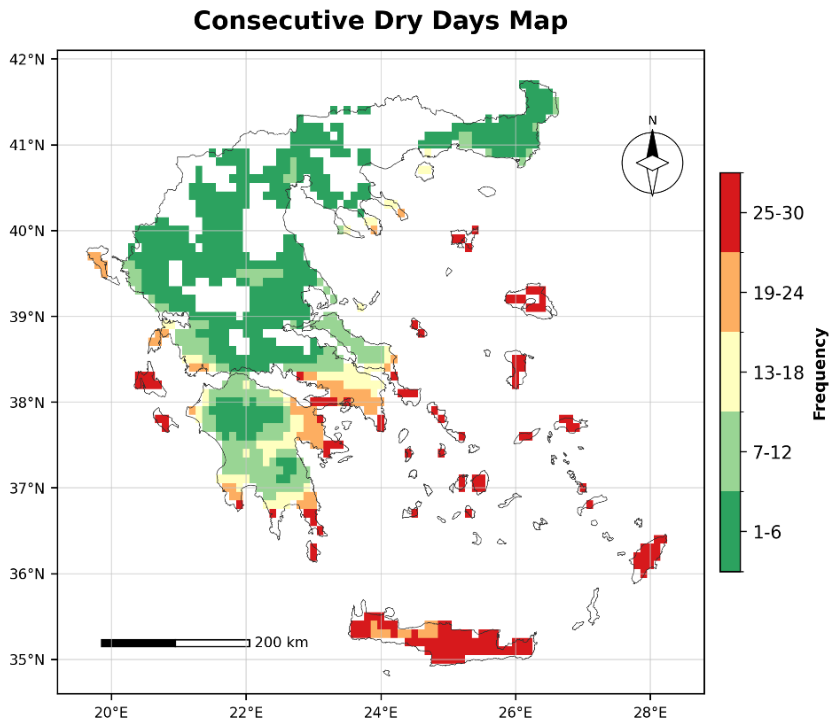
Years with prolonged dry spells recur most often in southern Greece, the islands, and the coastal fringe. The highest frequencies (25–30 years) occur in Crete, the Cyclades, the Dodecanese, Rhodes, the Ionian islands, Euboea, Attica, Lesvos, Chios, and eastern Laconia. Northern Greece, Thessaly, and the western mainland show the lowest frequencies.
Figure 10.
Spatial distribution of years affected by prolonged dry spells across Greece.
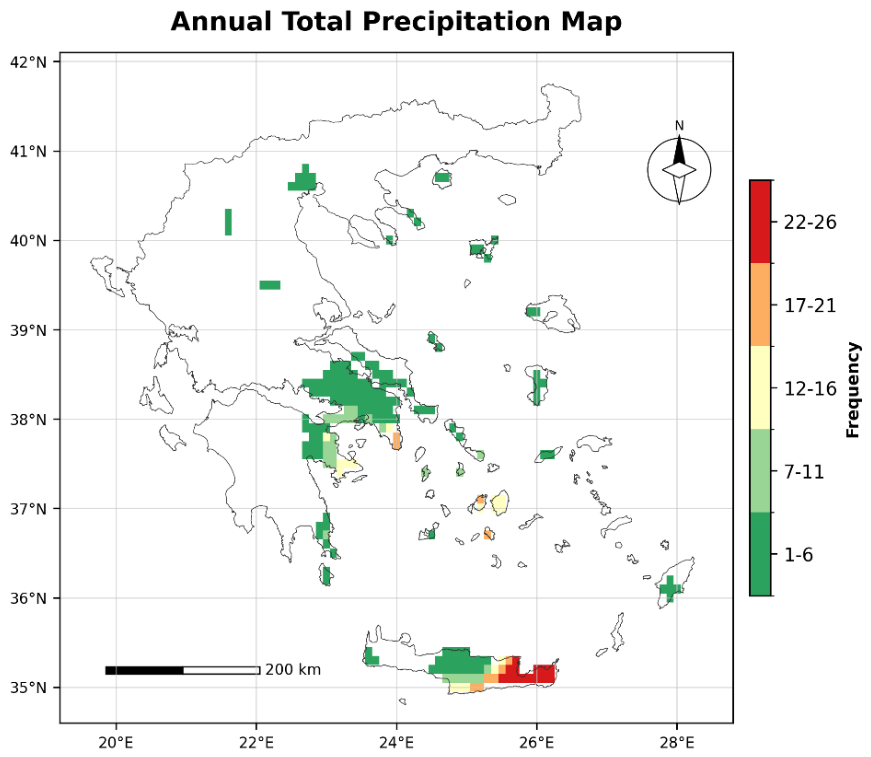
Years with low annual precipitation are concentrated mainly in southern and eastern Greece, with the strongest recurrence in eastern Crete, the southern Aegean, eastern Attica, and parts of the northeastern Peloponnese. This pattern is consistent with the broader hydrological signal observed in the following indicators, where water-related climatic stress tends to intensify progressively toward the southeast.
Figure 11.
Spatial distribution of years affected by low annual precipitation across Greece.
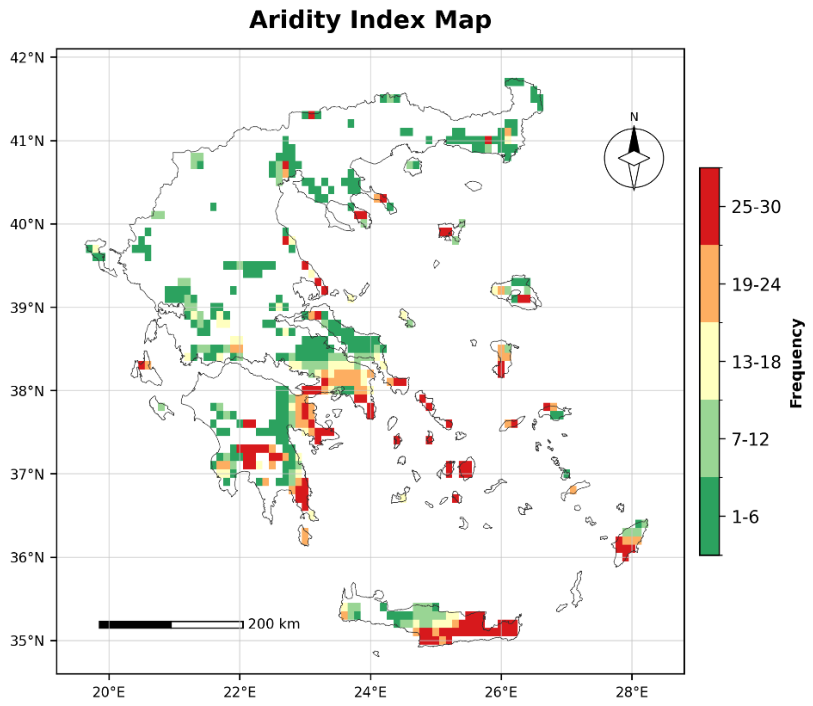
Years with low aridity index values recur most often in southern Greece, the Aegean islands, and parts of the eastern coastal mainland. The highest frequencies are concentrated in eastern Crete, especially in Lasithi and parts of Heraklion, as well as in Laconia, Argolis, and Attica. High recurrence is also evident across the Cyclades and several eastern island districts, including Rhodes, Lesvos, and Chios, highlighting a strong south-eastern concentration of aridity-related stress. In contrast, northern Greece, Thessaly, and the Ionian islands show much lower recurrence.
Figure 12.
Spatial distribution of years affected by low aridity index values across Greece.
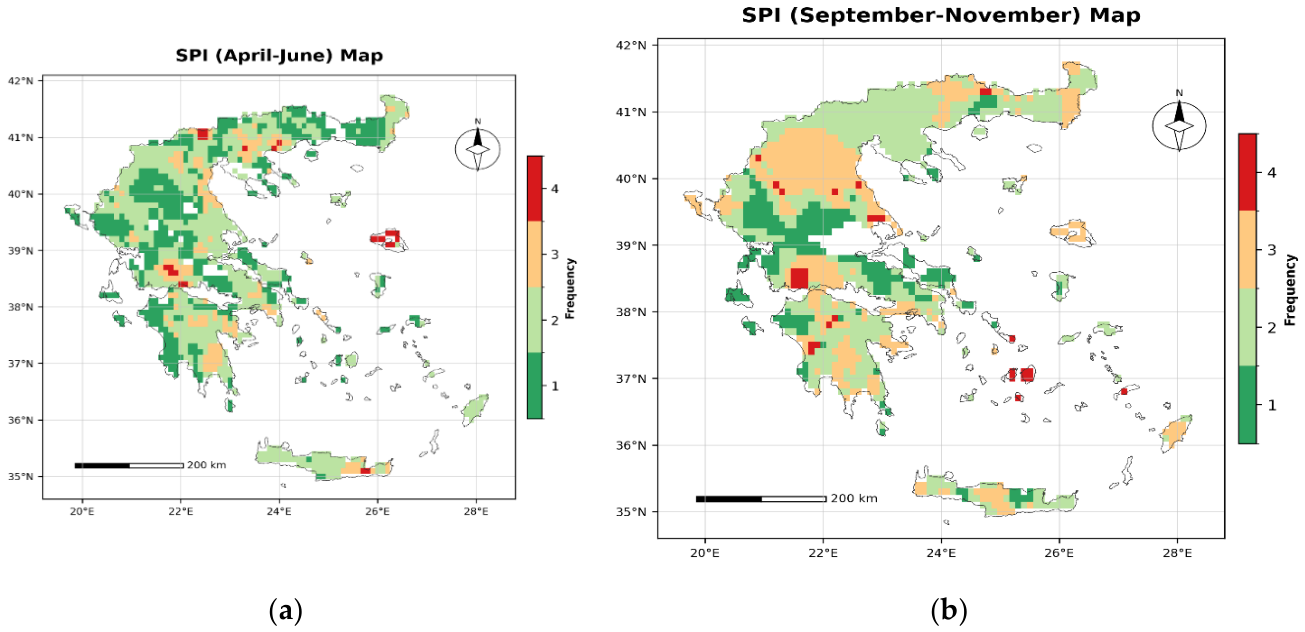
The two SPI maps show the recurrence of severe seasonal drought anomalies during April-June and September-November. In both seasons, the maximum recorded recurrence is four years, indicating repeated seasonal rainfall deficits in specific parts of Greece.
The two SPI maps show the recurrence of severe seasonal drought anomalies during April-June and September-November. For SPI (April-June), the highest recurrence is concentrated mainly in eastern Aetolia-Acarnania, as well as in Lesvos, eastern Crete, parts of Laconia and Argolis, and Pieria and central Macedonia. For SPI (September-November), the highest recurrence shifts toward eastern Macedonia and Thrace, Lesvos, western Macedonia, the coastal zone of Thessaly, Aetolia-Acarnania, several Aegean islands including Rhodes, central Crete, and extensive parts of the Peloponnese.
Under a stationary climate, SPI values below −1.5 would be expected in about two years over the 1995–2024 reference period. Because SPI follows a standard normal distribution, the probability of falling below this threshold is approximately 0.0668 [48] , which corresponds to about 30 × 0.0668 ≈ 2 years in a 30-year record. Observed maxima of four years therefore indicate that severe seasonal dry anomalies recur more frequently than expected relative to the local rainfall regime. In the most affected pixels, this pattern suggests greater climatic sensitivity to seasonal drought and a higher potential burden of water stress on olive-growing systems.
Figure 13.
Spatial distribution of years affected by severe SPI anomalies across Greece: (a) April-June and (b) September-November.
Figure 13.
Spatial distribution of years affected by severe SPI anomalies across Greece: (a) April-June and (b) September-November.
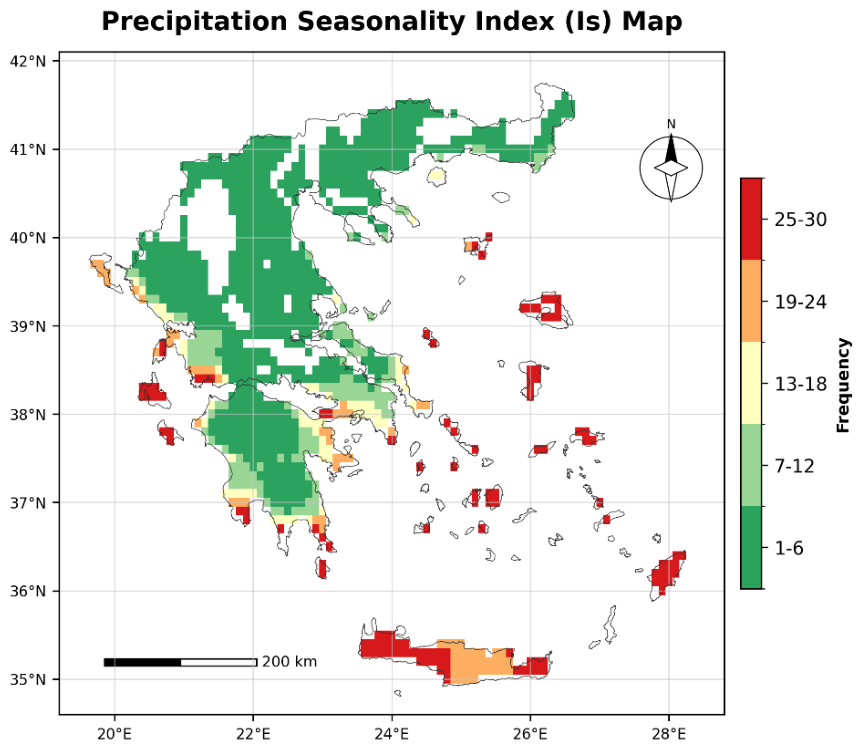
Years with extreme precipitation seasonality (Is < 0.60 or Is > 0.95) recur most intensively along the southern Aegean arc. The highest frequencies (25–30 years) occur in eastern Crete, the Cyclades, the Dodecanese, and parts of Laconia, where it is repeatedly exceeded 0.95 and rainfall was strongly concentrated in a short wet season. The Ionian islands and western Greece also show frequent exceedances, often exceeding 15 years and locally reaching the upper legend class, but these reflect predominantly low Is (< 0.60) associated with excessively uniform annual rainfall rather than desert-like seasonality. Across most of the mainland interior and northern Greece, recurrence remains low.
Figure 14.
Spatial distribution of years with precipitation seasonality index values outside the optimal range across Greece.
Figure 14.
Spatial distribution of years with precipitation seasonality index values outside the optimal range across Greece.
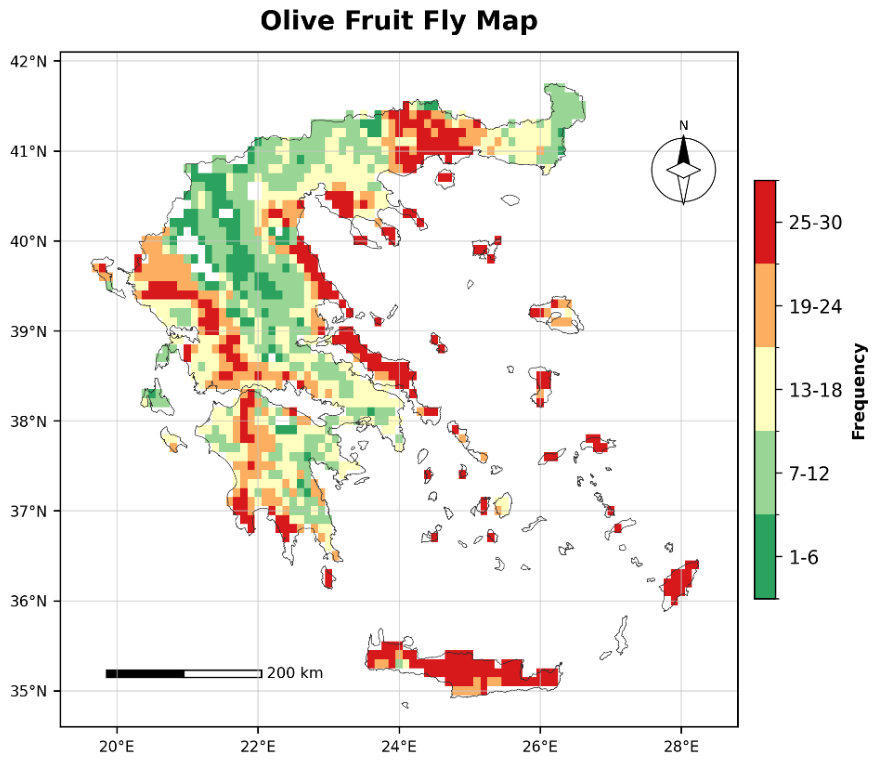
Years with climatically favourable conditions for olive fruit fly activity recurred most intensively along the coastal fringe and across the islands. The highest frequencies (25–30 years) occur in Crete, the Cyclades, the Dodecanese, southern Laconia and Messenia, parts of Achaea and Elis, Euboea, Lesvos, Chios, parts of Chalkidiki, eastern Thessaly, and eastern Macedonia, as well as along the western mainland coast, western Greece, and the Ionian islands. In these areas, maritime influence more often maintained the combined temperature and humidity window required during July-October.
Figure 15.
Spatial distribution of years affected by olive fruit fly risk across Greece.
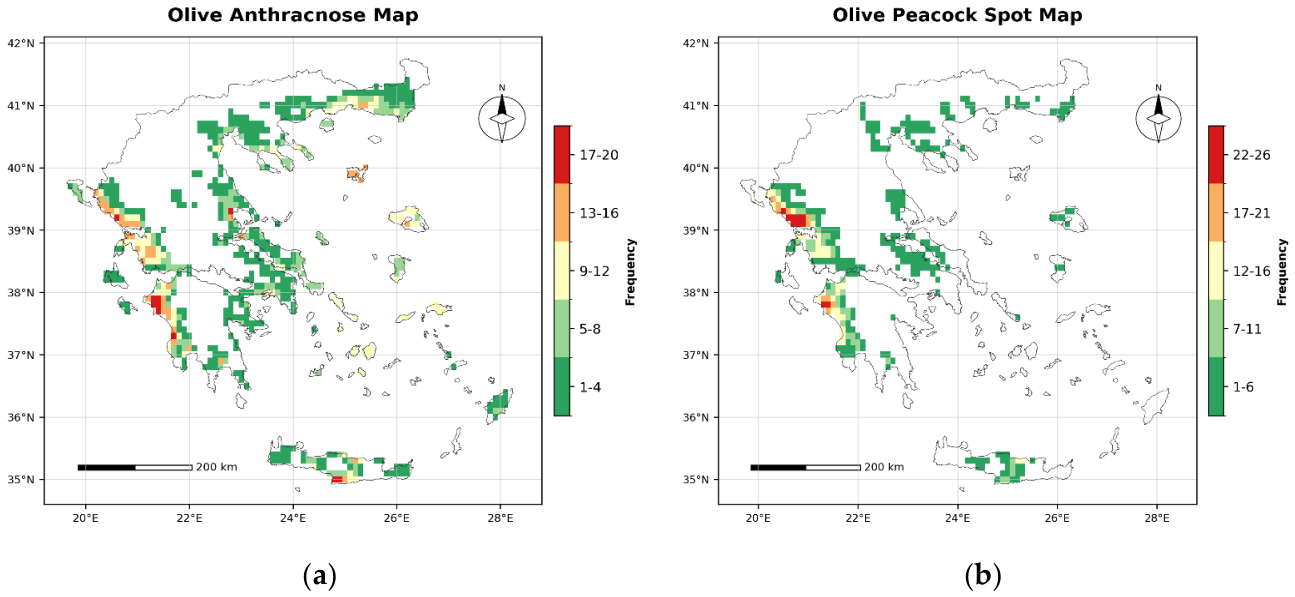
For olive anthracnose, the highest recurrence during October–November appears mainly along the coastal fringe. Maxima concentrates in western Greece and the western Peloponnese, Thrace, the Cyclades, Lesvos, central and southern Crete, and areas of southern Magnesia. These patterns reflect the combined effect of mild autumn temperatures and persistently humid air near the sea, which favours prolonged surface wetness on ripening fruit. The mainland interior records lower frequencies, as drier, more variable autumn conditions limit infection risk.
For peacock spot, the highest recurrence during the September–May season is concentrated in western Greece and the Peloponnese. In these areas, frequent autumn and winter rainfall and mild temperatures more often maintain leaf-surface wetness during the main infection period. Eastern and northern inland areas show clearly lower frequencies, where such combinations recur less often.
Figure 16.
Spatial distribution of years affected by (a) olive anthracnose risk and (b) olive peacock spot risk across Greece.
Figure 16.
Spatial distribution of years affected by (a) olive anthracnose risk and (b) olive peacock spot risk across Greece.
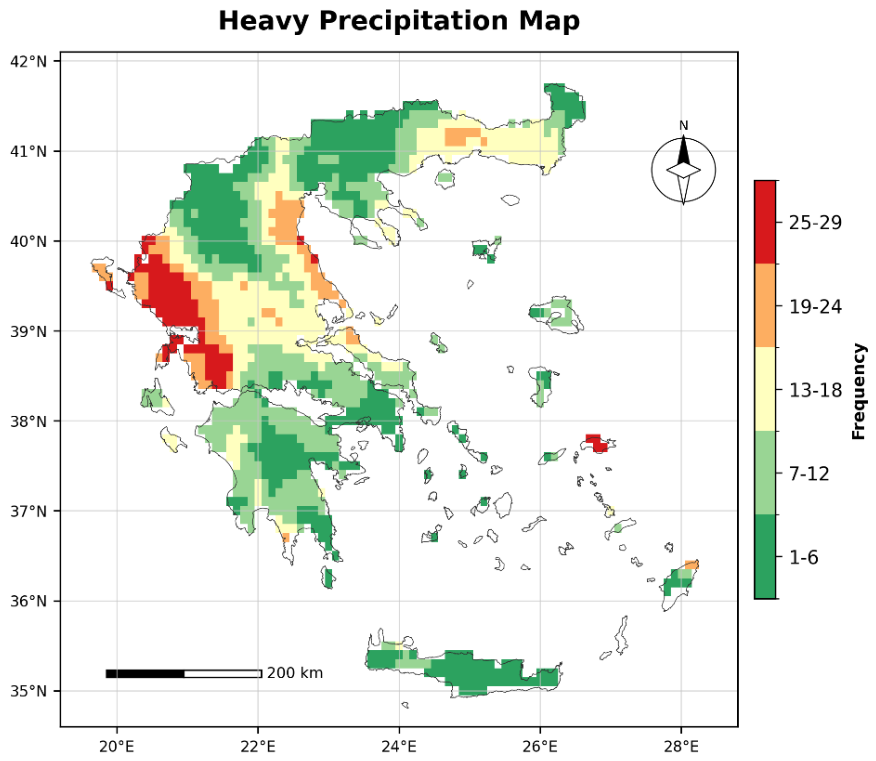
Years with extreme daily rainfall recurred most intensively in Epirus and western Greece, especially on the windward western slopes of the Pindus range, along the western Thessaly coastline, and on Samos. There, moist air from the Ionian Sea is forced to rise orographically or remains highly unstable near the coast, enhancing intense precipitation. Eastern mainland areas, Crete, and most of the remaining Aegean islands show lower recurrence.
Figure 17.
Spatial distribution of years affected by heavy precipitation across Greece.
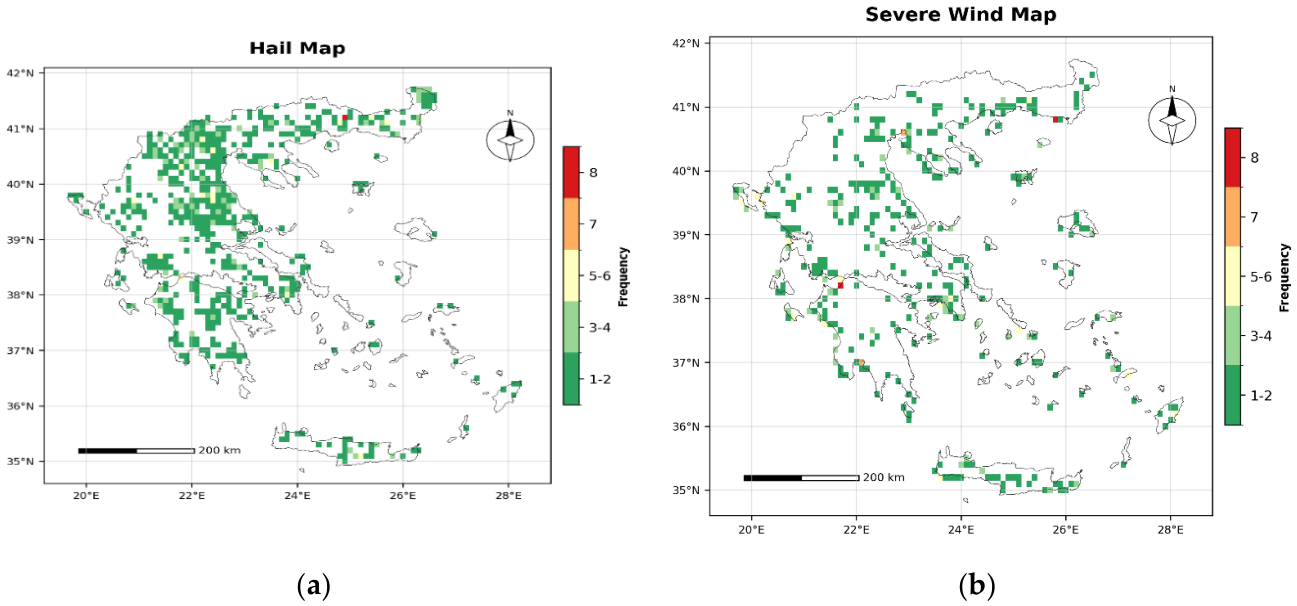
Storm-force wind episodes are identified mainly in coastal and otherwise exposed areas, where open terrain and proximity to the sea favour stronger gusts. These include parts of the western Peloponnese coastline, scattered Aegean islands, and northeastern Thrace. Inland and sheltered areas show fewer affected locations. Because both indicators are derived from ESWD reports, the mapped patterns reflect reported event occurrence and may be influenced to some degree by reporting density and observational coverage.
Figure 18.
Spatial distribution of years affected by (a) severe hail and (b) storm-force wind across Greece (2014-2024).
Figure 18.
Spatial distribution of years affected by (a) severe hail and (b) storm-force wind across Greece (2014-2024).
Composite climate risk shows strong spatial heterogeneity across Greece, reflecting the combined influence of thermal, water, biotic, and extreme-weather pressures. The continuous composite score was classified into five equal classes (0.2 intervals on the 0–1 scale), with higher classes indicating greater overall climate pressure on olive cultivation.
Figure 19.
Spatial distribution of composite climate-risk classes for olive cultivation and CLC olive groves across Greece.
Figure 19.
Spatial distribution of composite climate-risk classes for olive cultivation and CLC olive groves across Greece.
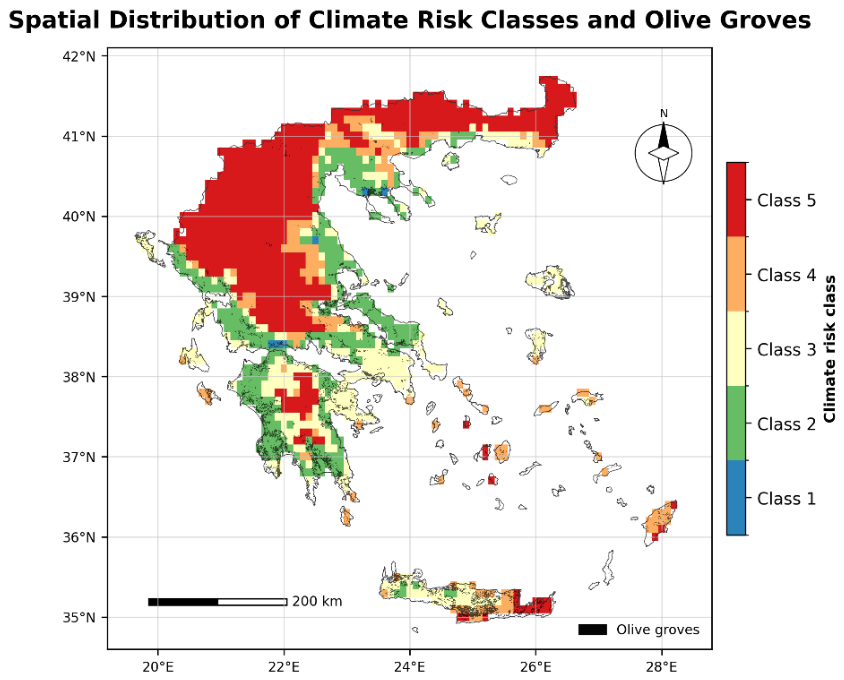
Class 1 is extremely restricted, appearing only as isolated low-risk pockets in Chalkidiki, northeastern Larissa, and the Fokida–Aetolia-Acarnania coastal zone. Class 2 forms the most extensive moderate-risk band. It covers much of western Greece and the western Peloponnese, extends across many southern areas, and appears in parts of central Greece, central and northern Euboea, eastern Thessaly, Chalkidiki, and parts of the Thessaloniki area. Class 3 occupies broad intermediate zones, mainly in southern Thrace, Attica, central and western Crete, the central Peloponnese, Lesvos, Lemnos, Corfu, and Kefalonia. Class 4 appears more patchily in Larissa and central Macedonia, the Cyclades, the Dodecanese, eastern Crete, Kythera, southeastern Laconia, and Zakynthos. Class 5 dominates the highest-risk areas, mainly along the Pindus range and other upland zones in northern Greece, including Epirus and Ioannina, Thrace, northern Macedonia, the mountains of central Peloponnese above Tripoli, and eastern Crete. In the northern mainland and mountain belt, Class 5 is associated mainly with recurrent cold stress and frost exposure, whereas in eastern Crete it reflects mainly prolonged water stress and summer dryness.
To complement the spatial patterns shown in the maps, additional statistical analyses were performed to summarize the distribution of olive-growing areas across the final climate-risk surface.
Figure 20.
Percentage distribution of CLC olive-grove area (2018) across composite climate-risk classes.
Figure 20.
Percentage distribution of CLC olive-grove area (2018) across composite climate-risk classes.
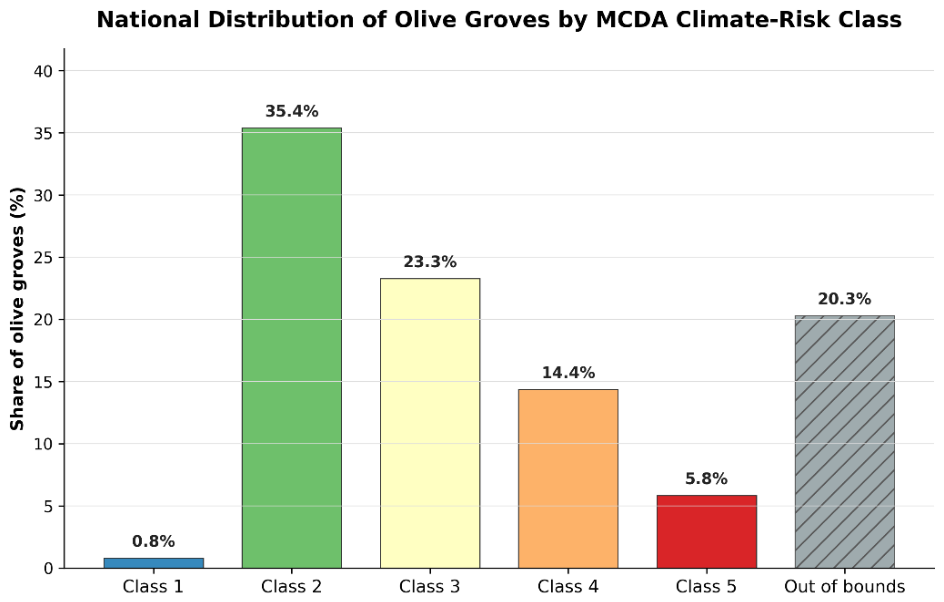
Overlaying the composite climate-risk map with CLC olive groves (2018) shows that most existing olive area is concentrated in the intermediate risk classes rather than at either end of the score range. Class 2 accounts for 35.4% of mapped olive groves and Class 3 for 23.3%, together representing about 59% of the national olive area. Classes 4 and 5 account for 14.4% and 5.8%, respectively, indicating that about one fifth of olive groves is located in the upper risk classes. By contrast, Class 1 includes only 0.8% of olive area. The very limited extent of the lowest class reflects the composite MCDA framework, which combines many normalized indicators, leaving only a small number of pixels consistently low-risk across the full set of stressors. In most areas, at least some indicators contribute moderate risk, shifting pixels toward the intermediate classes. A further 20.3% of olive pixels could not be assigned to a risk class because they fall within coastal grid cells excluded from the climate layer.
Figure 21.
Spatial distribution of mean composite climate-risk score by district across Greece.
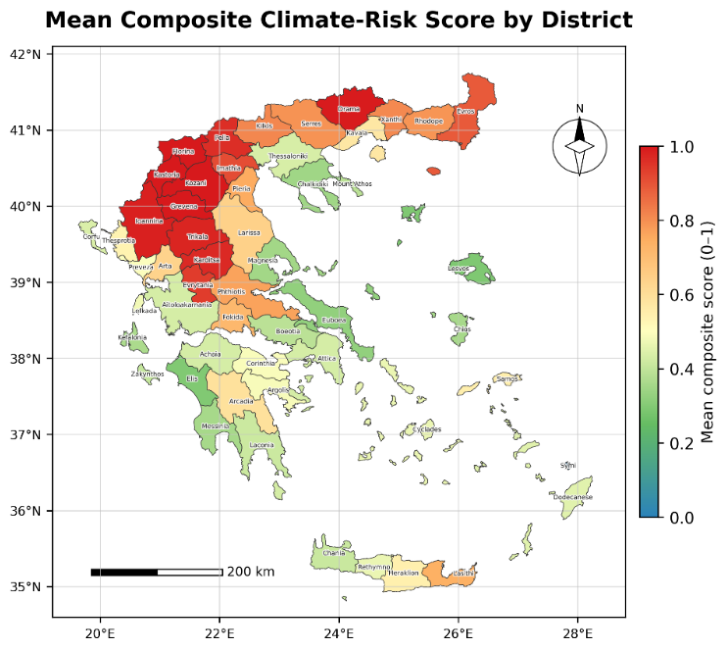
Figure 21 aggregates the national composite climate-risk surface at district level by averaging the continuous MCDA score across all grid cells within each administrative boundary. The lowest district means occur in Lesvos, Elis, Euboea, Chalkidiki, Magnesia, and Messenia, where values remain below 0.36. The highest values are concentrated in northern and upland districts, including Florina, Kozani, Grevena, Kastoria, Ioannina, Drama, and Trikala, where district means approach or reach the upper end of the national range. Among major olive-producing districts, Elis, Messenia, Laconia, and Chalkidiki fall in the lower part of the distribution. In contrast, Lasithi and Heraklion show comparatively higher district means, at about 0.74 and 0.55, respectively. This district-level summary provides the climate-risk dimension used in the following bivariate comparison with olive-grove cover.
To further relate composite climate risk to the current spatial distribution of olive cultivation, a bivariate district-level map was produced by combining the mean district MCDA score with olive-grove cover share derived from CLC 2018. For visualization purposes, both variables were classified into tertiles (low, medium, high) based on their district-level distributions.
Figure 22.
Bivariate map of mean district composite climate-risk score and olive-grove cover share across Greece. Both variables are grouped into tertiles (low, medium, high).
Figure 22.
Bivariate map of mean district composite climate-risk score and olive-grove cover share across Greece. Both variables are grouped into tertiles (low, medium, high).
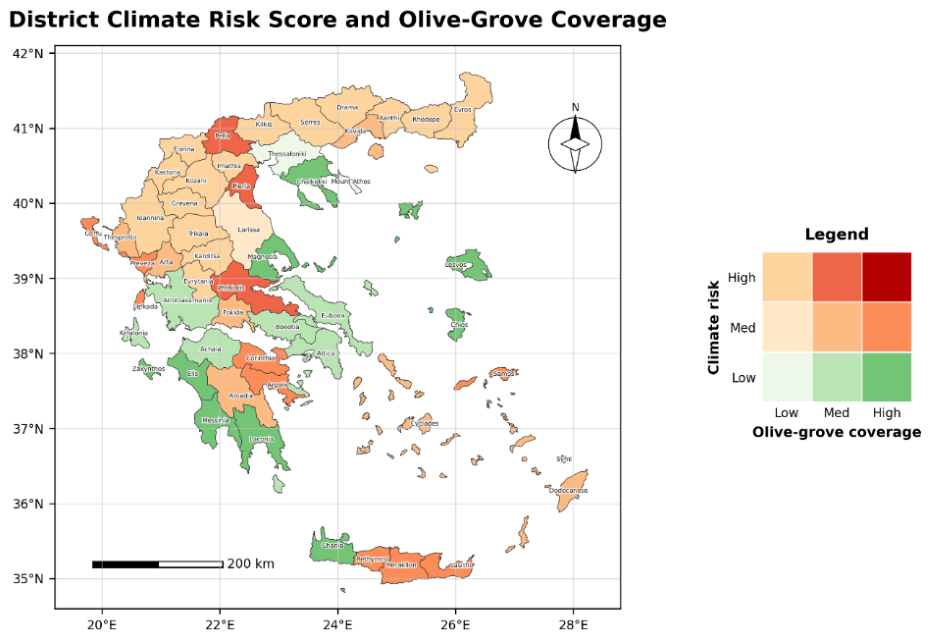
The bivariate map highlights three broad district patterns. The most prominent combines high olive-grove cover with relatively low mean composite climate-risk scores. This pattern is evident in Messenia, Laconia, Elis, and Chania, as well as in Chalkidiki, Magnesia, Lesvos, Zakynthos, and Chios, indicating that a substantial share of current olive cultivation is concentrated in districts with comparatively favorable district-level climate profiles.
A second pattern combines high olive-grove cover with medium-to-high district climate-risk scores. The clearest examples are Lasithi and Heraklion in Crete, with similar combinations also appearing in Rethymno, Corfu, and Lefkada. These districts show that extensive olive cultivation is also present in areas exposed to a comparatively stronger composite climatic burden.
By contrast, several districts combine relatively low mean scores with limited olive-grove cover, while others, such as Euboea, Boeotia, Achaia, and Attica, pair relatively low district risk with only modest olive-grove extent. Overall, the bivariate pattern shows how the present distribution of olive groves co-varies with district-level climate risk across Greece, rather than identifying land suitability or future expansion potential.
Only districts with at least 10% olive-grove cover were retained for further discussion. For these districts, Figure 23 maps the mean district composite score across all classified land pixels (left) and summarises the mean indicator contributions for the same district areas (right).
Figure 23.
Mean district composite climate-risk score in districts with at least 10% olive-grove cover (left) and mean indicator contributions over all classified land pixels in the same districts (right).
Figure 23.
Mean district composite climate-risk score in districts with at least 10% olive-grove cover (left) and mean indicator contributions over all classified land pixels in the same districts (right).
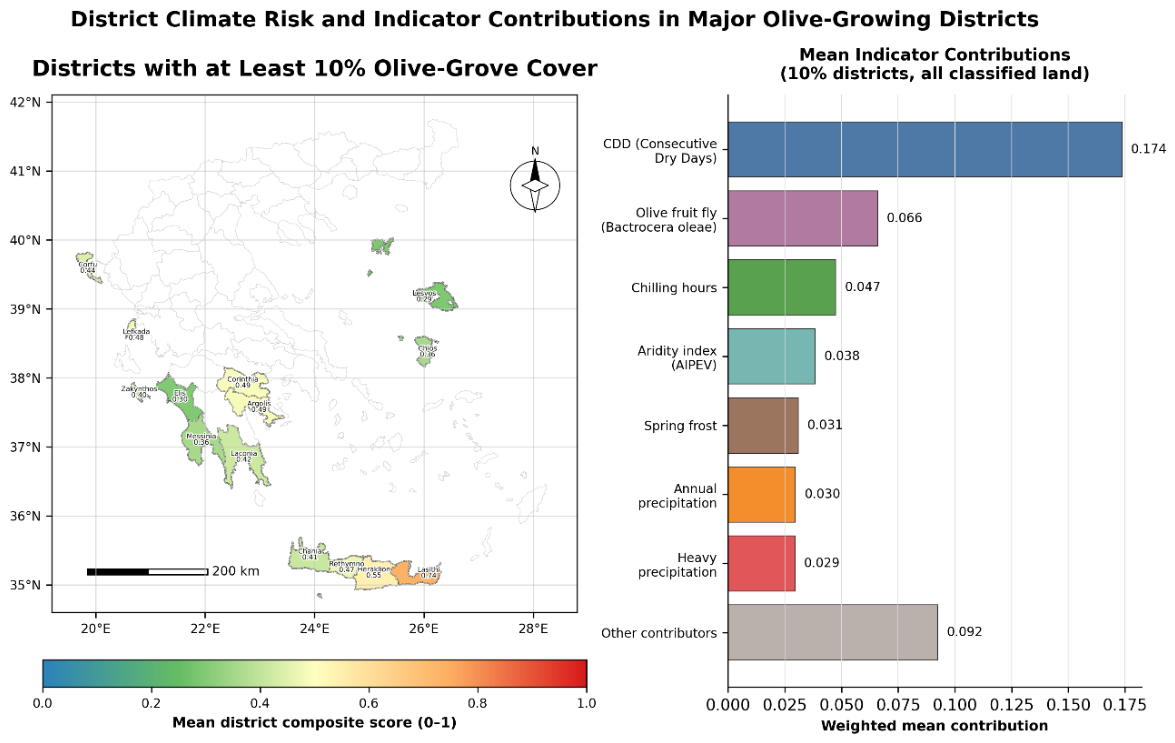
Among the 14 districts with at least 10% olive-grove cover, mean district composite scores (averaged over all classified land pixels in each district, as shown on the map) remain lowest in Lesvos, Elis, and Messenia (below 0.36), with Laconia also in the lower part of the range. The highest district means appear in Lasithi and Heraklion (about 0.74 and 0.55, respectively). In the right panel, mean indicator contributions were calculated across all classified land pixels within the same districts; consecutive dry days provided the largest overall contribution, followed by olive fruit fly pressure, chilling hours, and aridity.
To place these district-level patterns in a broader geographical context, the weighted composition of the composite score was summarized by administrative periphery, grouping indicators into thermal, water, biotic, and extreme-weather stress categories.
Figure 24.
Regional composition of composite climate-risk scores by stress category across Greece.
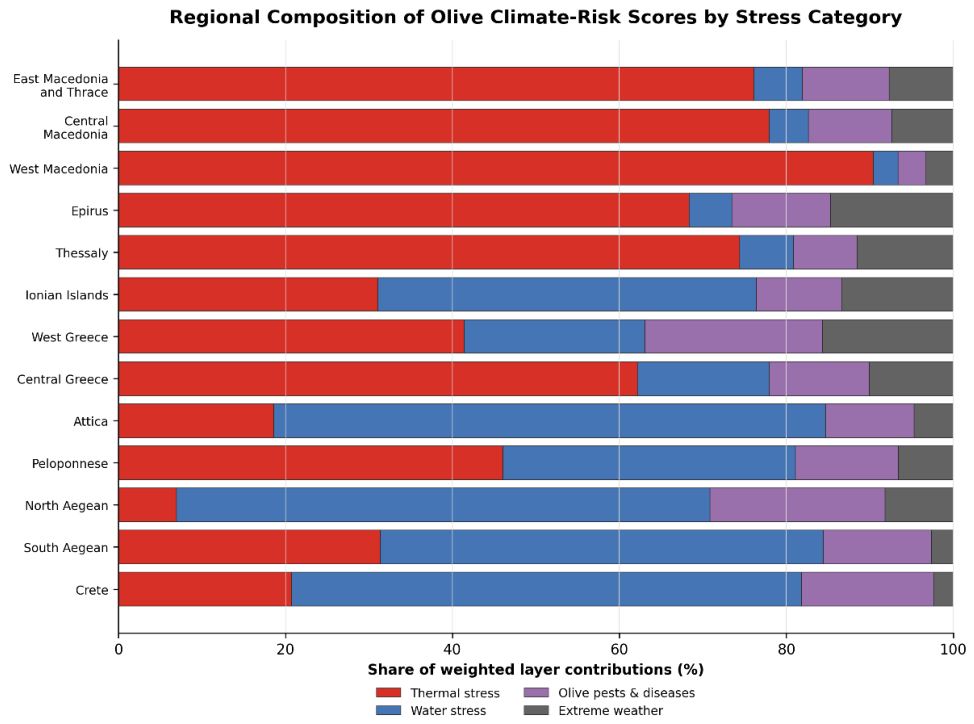
The regional summary reveals a marked north–south contrast in the stress categories underlying the composite score. In East and Central Macedonia, West Macedonia, Epirus, and Thessaly, the thermal category accounts for approximately 68–90% of the weighted contribution. Here, “thermal” should not be interpreted as heat exposure; in this framework it aggregates cold-related and temperature-regime indicators, including extreme frost (Tmin ≤ -5 °C), spring frost, insufficient chilling, and - where applicable -the separate lethal frost constraint (Tmin ≤ -12 °C). In upland and northern peripheries, these cold-related components dominate the thermal share and largely explain the elevated composite scores, particularly in West Macedonia and parts of Epirus and Thessaly, where lethal frost affects a substantial fraction of classified land. Central Greece shows a similar predominantly thermal profile, although with a larger water component than in the northern peripheries.
By contrast, water stress provides the largest share in Crete (61%), the North Aegean (64%), Attica (66%), and the South Aegean (53%), while the Ionian Islands also show a predominant water contribution (45%). The Peloponnese and West Greece occupy an intermediate position, combining substantial thermal and water contributions (about 46% and 35%, respectively, in the Peloponnese). In these regions, the composite score reflects a mixed climatic profile, with frost-related thermal pressures remaining important in upland areas, while water-related indicators become more influential in lowland olive-growing zones. Biotic and extreme-weather categories remain smaller overall but are non-negligible in several western and central regions.
The spatial patterns identified above take on meaning when read alongside the most recent nationwide olive suitability assessment for Greece and the broader Mediterranean literature on olive–climate interactions. Charalampopoulos et al. [49] combined geomorphological parameters with 11 climatic thresholds on a 0-10 scale to show where mean atmospheric and terrain conditions meet cultivation requirements. They report high climatic suitability over about 59% of the country and scores of 8–10 over approximately 91.6% of the CLC olive-grove area. The present study asks a different question. Rather than identifying where long-term mean conditions remain favorable, it quantifies how often 20 adverse thermal, water, biotic, and extreme-weather conditions occurred during 1995–2024 and integrates them using a weighted MCDA framework. Suitability mapping, therefore, indicates where cultivation is favorable in principle, whereas the present analysis shows where climatic stressors recurred most persistently under recent conditions. The two approaches are complementary rather than competing.
A close correspondence is evident in the traditional Western and Southern olive belts. In the nationwide suitability assessment, Elis, Messenia, Zakynthos, and the western and southern Peloponnese rank among the districts with the highest suitability levels [49]. The present results align with that pattern. Elis, Messenia, and Laconia display among the lowest district mean composite-risk scores in Figure 21, and the bivariate map places Messenia, Laconia, Elis, and Chania in the combination of high olive-grove cover and comparatively low district risk. Both exercises also agree that the northern interior and uplands differ fundamentally from the lowland olive core. Florina and Kastoria are classified as unsuitable in the threshold-based suitability map [49], whereas the present composite surface assigns the highest risk classes along the Pindus belt, in Epirus, Macedonia, Thrace, and the upland Peloponnese, where cold- and frost-related indicators dominate. Overlaying the CLC olive area with the five-class composite surface shows that about 59% of the mapped groves fall in intermediate classes 2 and 3 rather than at the extreme. That distribution reflects a different metric than the suitability scores reported above, yet it supports the same broader picture: long-established olive cultivation remains concentrated in areas with broadly favorable conditions, even though recurring climatic hazards persist.
The most instructive differences concern Crete, the eastern and southern Aegean, and parts of northern Greece. In the suitability assessment, eastern Crete receives the maximum climatic score of 10, while much of the rest of the island, including Heraklion, falls within the 8–9 range [49]. That pattern reflects weak frost limitation and generally suitable mean thermal conditions. Under the present recurrence-based framework, however, eastern Crete emerges as one of the areas of highest composite risk, with Class 5 concentrated in Lasithi and parts of Heraklion. The contrast is mainly driven by prolonged dry spells, low aridity index values, and recurrent seasonal water anomalies rather than by cold limitation. At the district level, Lasithi and Heraklion show comparatively high mean composite scores, about 0.74 and 0.55, respectively, whereas Elis and Messenia remain among the lowest in the national distribution, at about 0.30–0.36. The periphery-level decomposition reinforces this south–north contrast, with water stress accounting for about 61% of the mean thematic contribution in Crete, compared with thermal shares of 68–90% in northern peripheries. These divergent signals do not indicate disagreement between the two mapping approaches but reflect their different analytical aims. The suitability framework evaluates whether mean climatic conditions remain within favorable bounds, whereas the present study measures how often adverse thresholds were exceeded during the reference period. The former excludes irrigation, soil properties, and pest pressure and anticipates future extensions to pathogens and projected climates [49]. The present analysis already operationalizes several of those omitted dimensions, which appear particularly relevant in Crete, where Grillakis et al. [14] documented climate-related pressure on olive flowering and where recurrent fruit-fly activity and water-stress signals are consistent with broader evidence on olive responses under Mediterranean summer conditions [8,9,16].
A similar contrast appears in northern Greece. Coastal Thrace, including Xanthi and Kavala, ranks among the highest in district suitability in the threshold-based assessment [49], yet Xanthi shows a high composite score, and Kavala shows a non-negligible composite burden. Favorable mean conditions in coastal lowlands can therefore coexist with repeated cold and frost hazards in the recent climatological record. High suitability scores should not be translated automatically into low climate-risk scores at the district level.
As reviewed by Charalampopoulos et al. [49], recent European suitability and niche-modeling studies indicate declining suitability in several water-limited southern olive-growing areas, alongside potential northward or upslope expansion in some cooler marginal regions under warming, with substantial regional variation in the direction and magnitude of these changes. Charalampopoulos et al. [11] projected a northward spread of olive growing degree days across the Balkans by mid-century. The present results do not directly test those future scenarios, but they provide a contemporary baseline against which such projections can be interpreted. In Greece, northward expansion implied by growing degree day projections coexists with a present-day composite burden dominated by cold and frost recurrence in northern and upland peripheries, whereas southern and island areas that already host dense olive cover exhibit the strongest water-related recurrence. Tsiaras and Domakinis [12] likewise showed, in a mountainous area of northern Greece, that site selection for olive cultivation requires the joint consideration of climatic, topographic, and soil-related constraints.
Taken together, the comparison supports three broader conclusions. First, current olive distribution in Greece broadly coincides with areas of high suitability in the nationwide assessment and with relatively lower composite risk in the western Peloponnese and several island districts. Second, high climatic suitability does not imply low multi-hazard recurrence, as shown most clearly by Crete and parts of the eastern island zone. Third, the composite and district-level risk products presented here should be interpreted as diagnostic tools for adaptation planning in existing groves, including water management, cultivar choice, frost awareness, and pest monitoring, rather than as mirrors of suitability or maps of planting potential. This interpretation is consistent with forward-looking economic assessments showing regionally differentiated climate pressure on Greek agriculture [5,6] and with Mediterranean-scale evidence that olive systems may face both opportunities and losses depending on climatic exposure and management [10]. Several limitations remain. The analysis relies on ERA5-Land at approximately 9 km resolution, excludes 20.3% of CLC olive pixels from class assignment, uses expert-based indicator weights, and treats biotic layers as climatic favorability rather than observed outbreaks. The extreme-weather layers are based on ESWD reports for 2014–2024 and should therefore be interpreted with caution given the short reporting period and the known reporting constraints of event-based databases [17,21]. A further limitation is that the analysis represents olive cultivation as a single biological unit, without differentiating among cultivars or accounting for regional variation in phenological timing and stage-specific sensitivity. The resulting indicators should therefore be interpreted as generalized diagnostics of climatic stress exposure across the olive sector, rather than as cultivar-specific or locally phenology-calibrated estimates. Future work could combine scenario-based suitability mapping with the recurrence-based risk approach adopted here, while also incorporating cultivar-specific thresholds, irrigation adaptation scenarios, and validation against historical production losses, to deliver a more integrated assessment of current hazard burden and projected climatic change across the Greek olive sector.
From a practical perspective, the recurrence-based maps developed here may help inform regional adaptation planning and extension priorities by identifying where water, thermal, frost, or biotic pressures recur most persistently in olive-growing areas. This perspective is consistent with broader assessments indicating that climate pressure on Greek agriculture is regionally differentiated and calls for targeted adaptation responses [5,6]. They are intended as decision-support information rather than as validated estimates of yield loss or compensation need; linking them to damage records would be required before use in insurance or parametric schemes.
4. Conclusions
This study produced a national, recurrence-based climate-risk assessment for olive cultivation in Greece by integrating twenty agroclimatic indicators through a weighted MCDA framework for 1995–2024. The main findings can be summarized as follows:
- Composite climate risk shows strong spatial heterogeneity across Greece, with cold and frost recurrence dominating northern and upland areas, whereas water-related indicators recur most persistently in southern and island districts, especially in eastern Crete.
- Most of the CLC olive-grove area falls into intermediate composite classes rather than at the extremes of the risk range, indicating that existing cultivation remains concentrated in broadly favorable environments that still experience recurring climatic pressure.
- Comparison with the nationwide suitability assessment by Charalampopoulos et al. [49] shows broad agreement in the western and southern Peloponnese and several island districts, but also clear contrasts. In Crete, high suitability coexists with elevated recurrence-based risk driven mainly by water stress.
- High climatic suitability and low multi-hazard recurrence should not be treated as equivalent; the two mapping approaches address different questions and are complementary rather than competing.
- This study provides a national-scale climate risk assessment for olive cultivation in Greece, identifying spatial patterns of climate vulnerability and delivering diagnostic tools to support adaptation planning and the sustainable management of existing olive groves under changing climatic conditions, rather than assessing land suitability or planting potential.
- Interpretation remains subject to ERA5-Land resolution, coastal pixel exclusion, expert-based weights, and the short ESWD reporting period for extreme-weather layers. Future work linking this framework with scenario-based suitability mapping and damage records would support a more integrated assessment of hazard burden and projected change.
- The AI-Assisted Oasis workflow supported the reproducible generation of national indicator rasters and the final MCDA composite from archived climate data, offering a transferable framework for similar recurrence-based geospatial assessments.
- Future developments should include validation against historical production losses, integration of CMIP6 climate projections, cultivar-specific thresholds, and irrigation adaptation scenarios.
Supplementary Materials
The supporting information can be downloaded at the website of this paper posted on Preprints.org. Figure S1 Topography and major mountain systems of Greece. Figure S2 Administrative regions and districts of Greece.
Author Contributions
Conceptualization, I.C. and K.P.D; methodology, K.P.D and I.C.; software, K.P.D; validation, I.C, K.P.D, P.A.R, E.P. and F.D.; formal analysis, K.P.D.; investigation, K.P.D and I.C.; resources, K.P.D.; data curation, K.P.D.; writing—original draft preparation, K.P.D.; writing—review and editing, F.D, P.A.R, E.P, I.C.; visualization, K.P.D.; supervision, I.C.; project administration, I.C.
Funding
This research received no external funding.
Data Availability Statement
Data, code and results are available at: https://doi.org/10.5281/zenodo.21029850
Conflicts of Interest
The authors declare no conflicts of interest.
Abbreviations
The following abbreviations are used in this manuscript:
| MDPI | Multidisciplinary Digital Publishing Institute |
| DOAJ | Directory of open access journals |
| TLA | Three letter acronym |
| LD | Linear dichroism |
References
- Calvin, K.; Dasgupta, D.; Krinner, G.; Mukherji, A.; Thorne, P.W.; Trisos, C.; Romero, J.; Aldunce, P.; Barrett, K.; Blanco, G.; et al. IPCC, 2023: Climate Change 2023: Synthesis Report. Contribution of Working Groups I, II and III to the Sixth Assessment Report of the Intergovernmental Panel on Climate Change [Core Writing Team, H. Lee and J. Romero (Eds.)]. IPCC, Geneva, Switzerland.; First.; Intergovernmental Panel on Climate Change (IPCC), 2023.
- Fraga, H.; Pinto, J.; Santos, J. Climate Change Projections for Chilling and Heat Forcing Conditions in European Vineyards and Olive Orchards: A Multi-Model Assessment. Clim. Change 2019, 152, 179–193. [CrossRef]
- Funes, I.; Savé, R.; De Herralde, F.; Biel, C.; Pla, E.; Pascual, D.; Zabalza, J.; Cantos, G.; Borràs, G.; Vayreda, J.; et al. Modeling Impacts of Climate Change on the Water Needs and Growing Cycle of Crops in Three Mediterranean Basins. Agric. Water Manag. 2021, 249, 106797. [CrossRef]
- Fraga, H.; Moriondo, M.; Leolini, L.; Santos, J.A. Mediterranean Olive Orchards under Climate Change: A Review of Future Impacts and Adaptation Strategies. Agronomy 2021, 11, 56. [CrossRef]
- Georgopoulou, E.; Mirasgedis, S.; Sarafidis, Y.; Vitaliotou, M.; Lalas, D.P.; Theloudis, I.; Giannoulaki, K.-D.; Dimopoulos, D.; Zavras, V. Climate Change Impacts and Adaptation Options for the Greek Agriculture in 2021–2050: A Monetary Assessment. Clim. Risk Manag. 2017, 16, 164–182. [CrossRef]
- Tsadilas, C.D. Impact of Climate Change on the Primary Agricultural Sector of Greece: Adaptation Policies and Measures. Earth 2023, 4, 758–775. [CrossRef]
- Koubouris, G.; Limperaki, I.; Darioti, M.; Sergentani, C. Effects of Various Winter Chilling Regimes on Flowering Quality Indicatorsof Greek Olive Cultivars. Biol. Plant. 2019. [CrossRef]
- Haworth, M.; Marino, G.; Brunetti, C.; Killi, D.; De Carlo, A.; Centritto, M. The Impact of Heat Stress and Water Deficit on the Photosynthetic and Stomatal Physiology of Olive (Olea Europaea L.)—A Case Study of the 2017 Heat Wave. Plants 2018, 7, 76. [CrossRef]
- Brito, C.; Dinis, L.-T.; Moutinho-Pereira, J.; Correia, C.M. Drought Stress Effects and Olive Tree Acclimation under a Changing Climate. Plants 2019, 8, 232. [CrossRef]
- Ponti, L.; Gutierrez, A.P.; Ruti, P.M.; Dell’Aquila, A. Fine-Scale Ecological and Economic Assessment of Climate Change on Olive in the Mediterranean Basin Reveals Winners and Losers. Proc. Natl. Acad. Sci. 2014, 111, 5598–5603. [CrossRef]
- Charalampopoulos, I.; Polychroni, I.; Psomiadis, E.; Nastos, P. Spatiotemporal Estimation of the Olive and Vine Cultivations’ Growing Degree Days in the Balkans Region. Atmosphere 2021, 12, 148. [CrossRef]
- Tsiaras, S.; Domakinis, C. Use of GIS in Selecting Suitable Tree Crop Cultivation Sites in Mountainous Less Favoured Areas: An Example from Greece. Forests 2023, 14, 1210. [CrossRef]
- Toromade, A.; Chiekezie, N. * Corresponding Author: Adekunle Stephen Toromade GIS-Driven Agriculture: Pioneering Precision Farming and Promoting Sustainable Agricultural Practices. World J. Adv. Sci. Technol. 2024, 06, 057–072. [CrossRef]
- Grillakis, M.G.; Kapetanakis, E.G.; Goumenaki, E. Climate Change Implications for Olive Flowering in Crete, Greece: Projections Based on Historical Data. Clim. Change 2022, 175, 7. [CrossRef]
- Kalfas, I.; Anagnostopoulou, C.; Manios, E.M. The Impact of Climate Change on Olive Crop Production in Halkidiki, Greece. Environ. Sci. Proc. 2023, 26, 69. [CrossRef]
- Katsikogiannis, G.; Kavroudakis, D.; Tscheulin, T.; Kizos, T. Population Dynamics of the Olive Fly, Bactrocera Oleae (Diptera: Tephritidae), Are Influenced by Different Climates, Seasons, and Pest Management. Sustainability 2023, 15, 14466. [CrossRef]
- Kotroni, V.; Bezes, A.; Dafis, S.; Founda, D.; Galanaki, E.; Giannaros, C.; Giannaros, T.; Karagiannidis, A.; Koletsis, I.; Kyros, G.; et al. Long-Term Statistical Analysis of Severe Weather and Climate Events in Greece. Atmosphere 2025, 16, 105. [CrossRef]
- Muñoz Sabater, J. ERA5-Land Hourly Data from 1950 to Present Available online: (accessed on 23 December 2025) . [CrossRef]
- Muñoz-Sabater, J.; Dutra, E.; Agustí-Panareda, A.; Albergel, C.; Arduini, G.; Balsamo, G.; Boussetta, S.; Choulga, M.; Harrigan, S.; Hersbach, H.; et al. ERA5-Land: A State-of-the-Art Global Reanalysis Dataset for Land Applications. Earth Syst. Sci. Data 2021, 13, 4349–4383. [CrossRef]
- World Meteorological Organization (WMO) WMO Climatological Normals Available online: https://community.wmo.int/site/knowledge-hub/programmes-and-initiatives/climate-services/wmo-climatological-normals (accessed on 23 December 2025).
- Dotzek, N.; Groenemeijer, P.; Feuerstein, B.; Holzer, A.M. Overview of ESSL’s Severe Convective Storms Research Using the European Severe Weather Database ESWD. Atmospheric Res. 2009, 93, 575–586. [CrossRef]
- Efthimiou, N.; Psomiadis, E.; Papanikolaοu, I.; Soulis, K.; Borrelli, P.; Panagos, P. Developing a High-Resolution Land Use/Land Cover Map by Upgrading CORINE’s Agricultural Components Using Detailed National and Pan-European Datasets. Geocarto Int. 2022, 37, 1–34. [CrossRef]
- Papadopoulos-Dorlis, K. OASIS: Technical Architecture and Workflow Record. 2026. [CrossRef]
- Bartsokas, N. Θερμοκρασία Και Ελιές - Olivenews.Gr Available online: https://www.olivenews.gr/el/episthmh/kalliergeia/thermokrasia-kai-elies/ (accessed on 3 May 2025).
- Petruccelli, R.; Bartolini, G.; Ganino, T.; Zelasco, S.; Lombardo, L.; Perri, E.; Durante, M.; Bernardi, R. Cold Stress, Freezing Adaptation, Varietal Susceptibility of Olea Europaea L.: A Review. Plants 2022, 11, 1367. [CrossRef]
- Koubouris, G.; León, L.; Benlloch, M. High Temperatures | World Catalogue of Olive Varieties Available online: https://worldolivecatalogue.internationaloliveoil.org/en/document/module-2-variability/high-temperatures (accessed on 26 December 2025).
- Vemmos, S. The Threat of Very High Temperatures for Fruit Setting in Olive Trees in Greece. olivenews.gr 2020.
- M. Hosseini-Mazinan; Issa Karamatlou; P. Valverde; C. Trapero Frost | World Catalogue of Olive Varieties Available online: https://worldolivecatalogue.internationaloliveoil.org/en/document/module-2-variability/frost (accessed on 27 December 2025).
- Rojo, J.; Orlandi, F.; Ben Dhiab, A.; Lara, B.; Picornell, A.; Oteros, J.; Msallem, M.; Fornaciari, M.; Pérez-Badia, R. Estimation of Chilling and Heat Accumulation Periods Based on the Timing of Olive Pollination. Forests 2020, 11, 835. [CrossRef]
- Rezazadeh, A. Growing Olive Tree in Florida. UFIFAS Ext. St Lucie Cty. 2022.
- Caselli, A.; Petacchi, R. Climate Change and Major Pests of Mediterranean Olive Orchards: Are We Ready to Face the Global Heating? Insects 2021, 12, 802. [CrossRef]
- Podgornik, M.; Fantinič, J.; Pogacar, T.; Zupanc, V. Climate Change Induced Olive Trees Phenological Changes, Frosts and Droughts – Analysis for the Northern Mediterranean Region 2024.
- Al-Kofahi, S.; Khudirat, W.; Alshibli, F.; El Afandi, G. Assessing the Influence of Climate Extremes on the Cultivation of Rainfed Wheat (Triticum Aestivum) and Olive Trees (Olea Europaea) in Arid Regions. Earth Syst. Environ. 2025, 9. [CrossRef]
- Allam, A.; Moussa, R.; Najem, W.; Bocquillon, C. Specific Climate Classification for Mediterranean Hydrology and Future Evolution under Med-CORDEX Regional Climate Model Scenarios. Hydrol. Earth Syst. Sci. 2020, 24, 4503–4521. [CrossRef]
- Rico, E.I.; de la Fuente, G.C.M.; Morillas, A.O.; Ocaña, A.M.F. Physiological and Biochemical Study of the Drought Tolerance of 14 Main Olive Cultivars in the Mediterranean Basin. Photosynth. Res. 2024, 159, 1–16. [CrossRef]
- Guidelines on Ensemble Prediction Systems and Forecasting; World Meteorological Organization: Geneva, Switzerland, 2012; ISBN 978-92-63-11091-6.
- McKee, T.B.; Doesken, N.J.; Kleist, J. THE RELATIONSHIP OF DROUGHT FREQUENCY AND DURATION TO TIME SCALES. 1993.
- Broufas, G.D.; Pappas, M.L.; Koveos, D.S. Effect of Relative Humidity on Longevity, Ovarian Maturation, and Egg Production in the Olive Fruit Fly (Diptera: Tephritidae). Ann. Entomol. Soc. Am. 2009, 102, 70–75. [CrossRef]
- Ordano, M.; Engelhard, I.; Rempoulakis, P.; Nemny-Lavy, E.; Blum, M.; Yasin, S.; Lensky, I.M.; Papadopoulos, N.T.; Nestel, D. Olive Fruit Fly (Bactrocera Oleae) Population Dynamics in the Eastern Mediterranean: Influence of Exogenous Uncertainty on a Monophagous Frugivorous Insect. PLOS ONE 2015, 10, e0127798. [CrossRef]
- Sentelhas, P.C.; Dalla Marta, A.; Orlandini, S.; Santos, E.A.; Gillespie, T.J.; Gleason, M.L. Suitability of Relative Humidity as an Estimator of Leaf Wetness Duration. Agric. For. Meteorol. 2008, 148, 392–400. [CrossRef]
- Moral, J.; Jurado-Bello, J.; Sánchez, M.I.; de Oliveira, R.; Trapero, A. Effect of Temperature, Wetness Duration, and Planting Density on Olive Anthracnose Caused by Colletotrichum Spp. Phytopathology 2012, 102, 974–981. [CrossRef]
- Thomidis, T.; Michos, K.; Chatzipapadopoulos, F.; Tampaki, A. Evaluation of Two Predictive Models for Forecasting Olive Leaf Spot in Northern Greece. Plants 2021, 10, 1200. [CrossRef]
- Obanor, F.; Walter, M.; Jones, E.; Jaspers, M. Effect of Temperature, Relative Humidity, Leaf Wetness and Leaf Age on Spilocaea Oleagina Conidium Germination on Olive Leaves. Eur. J. Plant Pathol. 2007, 120, 211–222. [CrossRef]
- Therios, I. Ελαιοκομία; 3rd ed.; Gartaganis Dionysios, 2015; ISBN 960-88706-0-7.
- Nastos, P.T.; Zerefos, C.S. On Extreme Daily Precipitation Totals at Athens, Greece. In Proceedings of the Advances in Geosciences; Copernicus GmbH, April 26 2007; Vol. 10, pp. 59–66.
- Chang, D.; Li, S.; Lai, Z. Effects of Extreme Precipitation Intensity and Duration on the Runoff and Nutrient Yields. J. Hydrol. 2023, 626, 130281. [CrossRef]
- Sanzani, S.; Schena, L.; Nigro, F.; Sergeeva, V.; Ippolito, A.; M.G, S. Abiotic Diseases of Olive JPP 2013.
- University of Arizona Standard Normal Cumulative Probability Table Available online: https://math.arizona.edu/~jwatkins/normal-table.pdf.
- Charalampopoulos, I.; Droulia, F.; Mavridi, A.; Roussos, P. Mapping the Climatic Suitability for Olive Groves in Greece. Agronomy 2025, 15, 2604. [CrossRef]
Figure 1.
Annual number of quality-controlled ESWD reports in Greece for severe wind gusts and large hail during 1995-2024. The marked increase in reports after 2014 supports the restriction of the analysis to the 2014-2024 period.
Figure 1.
Annual number of quality-controlled ESWD reports in Greece for severe wind gusts and large hail during 1995-2024. The marked increase in reports after 2014 supports the restriction of the analysis to the 2014-2024 period.
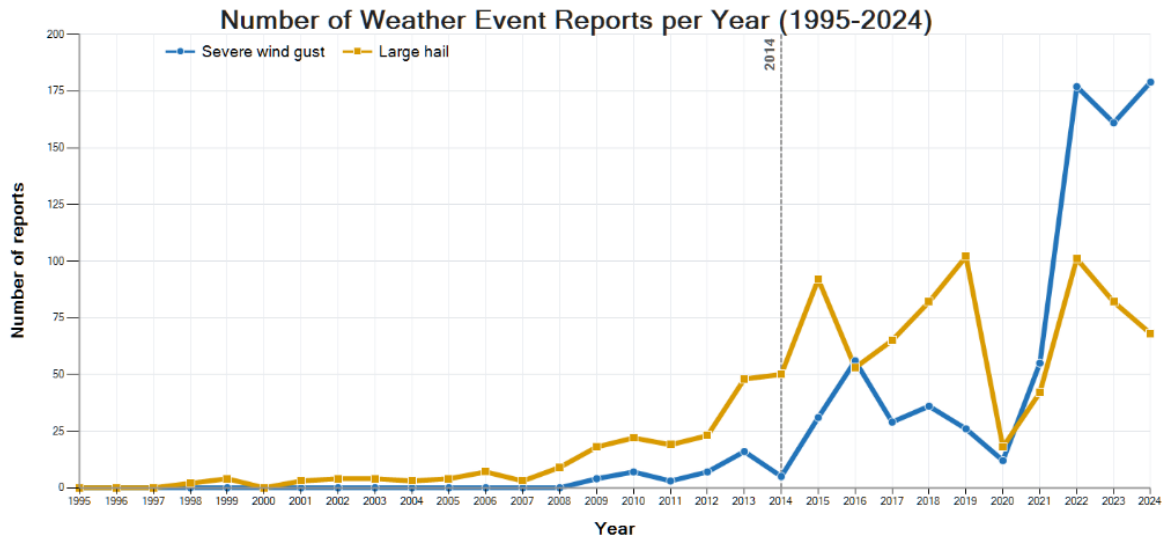
Figure 2.
Oasis workflow used in this study for raster generation and MCDA climate-risk mapping. Prepared climate data and natural-language prompts are interpreted within Oasis to generate, check, and execute Python workflows. The resulting indicator rasters are then combined through the MCDA module to produce the final climate-risk map.
Figure 2.
Oasis workflow used in this study for raster generation and MCDA climate-risk mapping. Prepared climate data and natural-language prompts are interpreted within Oasis to generate, check, and execute Python workflows. The resulting indicator rasters are then combined through the MCDA module to produce the final climate-risk map.
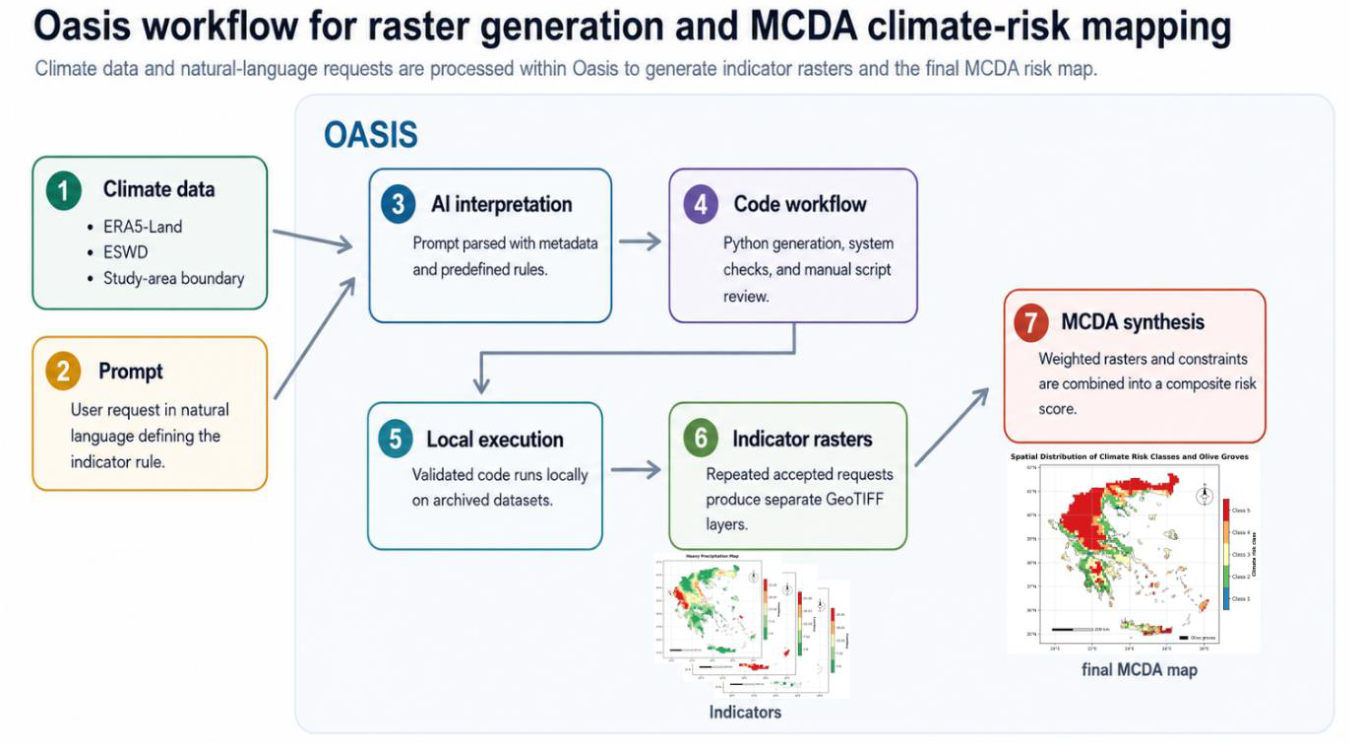
Figure 3.
Spatial distribution of years affected by (a) extreme frost and (b) lethal frost across Greece.
Figure 3.
Spatial distribution of years affected by (a) extreme frost and (b) lethal frost across Greece.
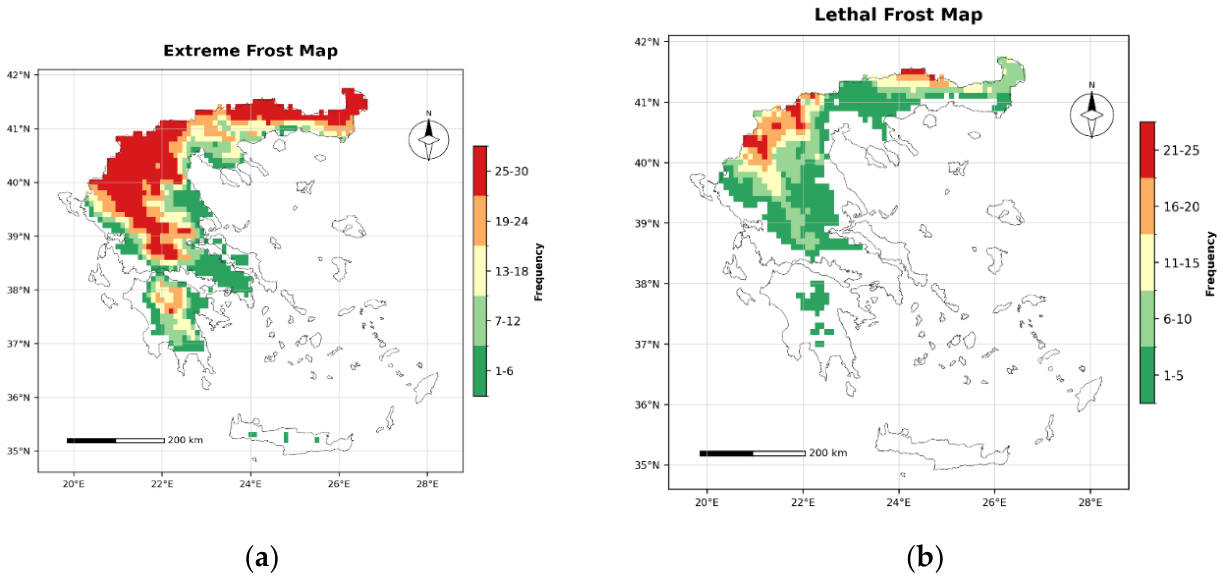

Table 1.
Adverse-condition rules used to derive the agroclimatic indicators included in the MCDA framework.
Table 1.
Adverse-condition rules used to derive the agroclimatic indicators included in the MCDA framework.
| Indicator | Adverse-condition definition | References |
|---|---|---|
| Extreme frost | Calendar year: at least 1 day per year with 6 consecutive hours of T ≤ -5 °C | [24,25] |
| Lethal frost | Calendar year: at least 1 day per year with 6 consecutive hours of T ≤ -12 °C | [24,25] |
| Heat stress | Calendar year: more than 20 days per year with Tmax > 35 °C | [26] |
| Flowering heat stress | April-May: at least 1 event per year with 3 consecutive days of Tmax > 32 °C | [26,27] |
| Spring frost | 1 Mar-30 Apr: at least 1 day per year with 6 consecutive hours of T ≤ 0 °C | [25,28] |
| Chilling hours | 15 Nov-15 Mar (cross-year): fewer than 200 chilling hours per season within 0-7.2 °C | [29,30,31] |
| Mean annual temperature | Calendar year: annual mean temperature < 15 °C or > 20 °C | [24] |
| Diurnal temperature range | March-April: more than 20 days per season with daily Tmax — Tmin > 12 °C | [32,33] |
| Annual total precipitation | Calendar year: annual precipitation total < 350 mm | [10] |
| Precipitation seasonality index (Is) | Calendar year: Is < 0.60 or Is > 0.95 | [34] |
| Aridity index (AIPEV) | Calendar year: AIPEV < 0.20 | [19] |
| Consecutive dry days | 1 Apr-31 Oct: annual maximum dry spell exceeds 40 consecutive days, with daily precipitation < 1 mm | [35] |
| SPI (April-June) | April-June: SPI < -1.5 | [36,37] |
| SPI (September-November) | September-November: SPI < -1.5 | [36,37] |
| Olive fruit fly | July-Oct: more than 5 events per year, each defined as 3 consecutive days with Tmax 25-29 °C and mean daily RH 55-75% | [31,38,39] |
| Olive anthracnose | Oct-Nov: more than 3 high-risk days per season; a high-risk day includes at least 1 consecutive 12-h period with mean hourly T 17-25 °C and DPD < 1.8 °C | [40,41] |
| Olive peacock spot | Sep-May (cross-year): more than 20 high-risk days per season; a high-risk day includes at least 9 consecutive hours with mean hourly T 15-20 °C and DPD ≤ 1.8 °C | [42,43,44] |
| Heavy precipitation | Calendar year: at least 1 day per year with daily precipitation > 50 mm | [45,46] |
| Hail | Calendar year: at least 1 event per year with hailstone diameter > 2.0 cm | [21,44,47] |
| Severe wind | Calendar year: at least 1 event per year with wind gust ≥ 25 m s-1 | [21,44] |
Table 2.
Indicators and weights used in the composite climate risk calculation.
| Indicator | Wi (%) |
|---|---|
| Flowering heat stress | 12 |
| Extreme frost | 12 |
| Chilling hours | 12 |
| Consecutive dry days | 11 |
| Spring frost | 10 |
| Annual total precipitation | 10 |
| Heavy precipitation | 5 |
| AIPEV | 4 |
| Olive fruit fly | 4 |
| Heat stress | 3 |
| Mean annual temperature | 3 |
| Olive anthracnose | 3 |
| Olive peacock spot | 3 |
| SPI (April–June) | 2 |
| SPI (September–November) | 2 |
| Diurnal temperature range | 1 |
| Precipitation seasonality index (Is) | 1 |
| Hail | 1 |
| Severe wind | 1 |
Note: The lethal frost indicator (Tmin ≤ −12 °C) was not included in the weighted sum and was applied separately as a hybrid constraint.
Disclaimer/Publisher’s Note: The statements, opinions and data contained in all publications are solely those of the individual author(s) and contributor(s) and not of MDPI and/or the editor(s). MDPI and/or the editor(s) disclaim responsibility for any injury to people or property resulting from any ideas, methods, instructions or products referred to in the content. |
© 2026 by the authors. Licensee MDPI, Basel, Switzerland. This article is an open access article distributed under the terms and conditions of the Creative Commons Attribution (CC BY) license (http://creativecommons.org/licenses/by/4.0/).
Copyright: This open access article is published under a Creative Commons CC BY 4.0 license, which permit the free download, distribution, and reuse, provided that the author and preprint are cited in any reuse.


