

Submitted:
30 June 2026
Posted:
02 July 2026
You are already at the latest version
Abstract
Porous polymer nanocomposites incorporating metal oxide nanoparticles (SiO₂, ZrO₂, and TiO₂) were synthesized via the aza–Michael addition reaction of ethyleneamines with poly(ethylene glycol) diacrylate (PEGDA) under polymerization-induced phase separation conditions. The resulting nanocomposites exhibited interconnected particulate morphologies with particle diameters ranging from less than 0.5 to 5.0 μm. Increasing the nanoparticle content led to a significant reduction in particle size, indicating that the nanoparticles influenced the phase-separation process and the development of the porous structure. Energy-dispersive X-ray spectroscopy confirmed the homogeneous distribution of nanoparticles throughout the polymer matrix. The refinement of the porous morphology increased the bulk density and consequently enhanced the Young’s modulus of the nanocomposites. In addition, porous nanocomposites containing SiO₂ nanoparticles exhibited distinct coloration when immersed in toluene owing to the Christiansen filter effect. The transmission wavelength shifted toward longer wavelengths with increasing SiO₂ content, which was attributed to an increase in the effective refractive index of the porous nanocomposites. These results demonstrate that incorporation of metal oxide nanoparticles provides an effective strategy for controlling the morphology, mechanical properties, and optical functionality of porous polymer nanocomposites.
Keywords:
porous polymer
; metal oxide
; nanocomposite
; Christiansen filter effect
1. Introduction
Polymer nanocomposites have attracted considerable attention as an effective approach for enhancing the performance of polymeric materials [1,2,3,4]. The incorporation of nanoscale fillers into polymer matrices can significantly modify the physical properties of polymers through interfacial interactions between the polymer chains and nanoparticles 5-7]. Representative examples include epoxy resin–silica, polyolefin–clay, epoxy resin–carbon nanotube, and polycarbonate- or poly(methyl methacrylate)-metal oxide nanocomposites, as well as electrical insulation polymers containing dielectric nanoparticles such as SiO₂, Al₂O₃, and silicon nitride [8,9]. These nanocomposites exhibit improved mechanical strength, thermal stability, gas-barrier performance, electrical and thermal conductivity, hardness, dielectric breakdown strength, and long-term durability.
The nanocomposite strategy has also been extended to porous polymer materials, which have been developed for applications requiring thermal resistance, electrical insulation, and gas separation performance [10,11,12,13,14,15]. In such systems, the incorporation of nanoparticles not only improves the intrinsic properties of the polymer matrix but also influences the formation and characteristics of the porous structure.
We have previously reported the preparation of porous polymer nanocomposites through polymerization-induced phase separation (PIPS) in the presence of metal oxide nanoparticles. Examples include radical polymerization of methyl methacrylate in the presence of polymerizable SiO₂ nanoparticles and ring-opening polymerization of multifunctional aziridines containing SiO₂, ZrO₂, or TiO₂ nanoparticles [16,17]. These studies demonstrated that nanoparticle incorporation effectively modifies the porous morphology and enhances the mechanical properties of the resulting materials.
In our laboratory, various porous network polymers have been developed based on the Joint–Linker Concept, which employs multifunctional monomers as joint monomers and α,ω-bifunctional compounds as linker monomers [18]. This molecular design strategy enables precise control of both network architecture and phase-separated morphology, allowing the preparation of porous polymers with tunable structures and properties.
In addition to their structural and mechanical characteristics, porous polymers can exhibit unique optical functions. Christiansen-filter-based optical materials have attracted increasing attention as wavelength-selective transmission media because their optical response can be tuned by controlling the refractive-index match between dispersed domains and the surrounding medium [19]. Such materials exhibit characteristic coloration when the refractive indices of the two phases become comparable at a specific wavelength [20,21,22,23]. Furthermore, some of our porous polymers exhibit optical functionality based on the Christiansen filter effect. For example, porous polymers prepared from ethyleneamines and poly(ethylene glycol) diacrylate (PEGDA) display distinct coloration when immersed in toluene, whose refractive index is close to that of the polymer matrix [24].
In this study, porous polymer nanocomposites were synthesized by the aza–Michael addition reaction of ethyleneamine compounds with different molecular weights and PEGDA in ethanol in the presence of SiO₂, ZrO₂, or TiO₂ nanoparticles, accompanied by PIPS, as illustrated in Scheme 1. The effects of the molecular structure of the ethyleneamines and the type and content of metal oxide nanoparticles on the morphology, mechanical properties, thermal stability, and optical characteristics of the resulting porous nanocomposites were systematically investigated. Particular attention was paid to the influence of SiO₂ nanoparticles on the coloration behavior of the porous polymers immersed in toluene through the Christiansen filter effect.
2. Materials and Methods
2.1. Materials
Triethylenetetramine (TETA, Tokyo Chemical Industry Co., Ltd.), tetraethylenepentamine (TEPA, Kanto Chemical Co., Inc.), and pentaethylenehexamine (PEHA, Kanto Chemical Co., Inc.) were used as received. Poly(ethylene glycol) diacrylate (PEGDA, average ethylene oxide unit number = 4, PEGDA200) was kindly supplied by Shin-Nakamura Chemical Co., Ltd. and purified by passing through an alumina (activated) column to remove polymerization inhibitors before use. Ethanol (EtOH), methanol, and toluene of analytical grade were purchased commercially and used without further purification.
Methanol-based metal oxide sols were kindly supplied by Nissan Chemical Corporation: silica sols (Methanol Silica Sol, SiO₂ (SiO₂-S) content: 30 wt%, particle diameter: 12 nm, pH 3.4; MA-ST-M, SiO₂ (SiO₂-M) content: 40 wt%, particle diameter: 22 nm, pH 3.1; MA-ST-L, SiO₂ (SiO₂-L) content: 40 wt%, particle diameter: 45 nm, pH 3.0), zirconia sol (OZ-S30M, ZrO₂ content: 26.7 wt%, particle diameter: 30–50 nm, pH 5.7), and titania sol (OT-R305M7-20, TiO₂ content: 16.8 wt%, particle diameter: 10–30 nm, pH 5.5).
2.2. Synthesis of Porous Polymer Nanocomposites
The molar ratio of active hydrogen atoms in the ethyleneamines ([NH]) to acrylate groups in PEGDA was fixed at 1.0 for all reaction systems.
A representative preparation procedure is described for the TEPA/PEGDA system in the presence of SiO₂-S at a monomer concentration of 20 wt%. SiO₂-S Methanol Silica Sol (0.229 g), EtOH (2.51 g), TEPA (0.102 g, 0.541 mmol), and PEGDA (0.583 g, 1.89 mmol; [TEPA]/[PEGDA] = 2/7 mol/mol) were placed in a 20 mL glass vial and mixed using a vortex mixer for several minutes until a homogeneous solution was obtained. The reaction mixture was transferred into a polyethylene mold (18 mm × 18 mm × 30 mm) and allowed to stand at 20 °C for 24 h. After polymerization, the resulting porous polymer was immersed in methanol to exchange the residual solvent and subsequently dried at ambient temperature for 24 h under atmospheric pressure, followed by vacuum drying for 4 h.
Porous polymer nanocomposites containing other ethyleneamines and/or metal oxide nanoparticles were prepared using the same procedure.
2.3. Characterization
Fourier-transform infrared (FT-IR) spectra of the monomers and porous polymer nanocomposites were recorded using an FT/IR-410 spectrometer (JASCO Corporation). Liquid samples were placed between KBr crystal plates (International Crystal Laboratories), and spectra were collected over the range of 4000–500 cm⁻¹ with 30 accumulated scans. Samples of porous polymers were prepared as KBr disk method.
The morphology of the porous polymer nanocomposites was observed using a field-emission scanning electron microscope (FE-SEM, JSM-7610F, JEOL Ltd.) operated at an accelerating voltage of 3.0 kV. Elemental distributions were analyzed by SEM/energy-dispersive X-ray spectroscopy (SEM–EDS) at an accelerating voltage of 20 kV. Nitrogen contents were quantified using the atomic number–absorption–fluorescence (ZAF) correction method. Average particle diameters were determined from SEM images using ImageJ software.
Mechanical properties were evaluated by compression testing using a Tensilon RTE-1210 universal testing machine (ORIENTEC Co., Ltd.). Cubic specimens (10 mm × 10 mm × 10 mm) were compressed at a crosshead speed of 0.5 mm min⁻¹ at room temperature. At least three specimens were tested for each sample, and the median values are reported.
Thermogravimetric analysis (TGA) was carried out using a TG-DTA2020SA instrument (Bruker AXS). Samples were heated from room temperature to 500 °C at a heating rate of 20 °C min⁻¹ under an argon atmosphere.
Optical properties were evaluated using a UV–visible spectrophotometer (UV-1600PC, Shimadzu Corporation). Porous polymer nanocomposites immersed in toluene were analyzed in transmission mode over the visible wavelength range with a spectral resolution of 0.1 nm and a scan rate of 50 nm min⁻¹.
3. Results and Discussion
3.1. Optimization of Reaction Conditions for the Preparation of Porous Polymer Nanocomposites
The aza–Michael addition reaction between ethyleneamines and PEGDA (Scheme 1) was conducted in ethanol in the presence of metal oxide sols at a monomer concentration of 20 wt% and 20 °C. In all reaction systems, network polymers were successfully formed without the use of any catalyst. The morphology of the resulting polymers was strongly influenced by the concentration and type of metal oxide nanoparticles. At relatively low metal oxide contents, PIPS occurred during network formation, yielding porous polymer nanocomposites. In contrast, increasing the nanoparticle concentration gradually suppressed phase separation and resulted in transparent or opaque gel materials.
Figure 1 summarizes the production diagrams of the ethyleneamine–PEGDA systems containing SiO₂ nanoparticles with different particle sizes (SiO₂-S, SiO₂-M, and SiO₂-L). Porous polymers were successfully obtained over a relatively wide composition range at low SiO₂ contents. However, the accessible porous region decreased with increasing SiO₂ concentration, and gel formation became dominant at higher nanoparticle loadings. Interestingly, larger SiO₂ nanoparticles (SiO₂-L) allowed porous polymers to be obtained even at SiO₂ contents as high as 12 wt%, whereas smaller nanoparticles more readily induced gel formation.
This behavior may be explained by the influence of the nanoparticles on the relative rates of polymerization and phase separation. One possible explanation is that smaller nanoparticles possess a larger specific surface area and therefore interact more strongly with the ethyleneamine monomers. Such interactions may increase the compatibility between the growing polymer network and the reaction medium, thereby suppressing phase separation. Another possible factor is the acidity of the silica sols. The SiO₂ sols used in this study exhibited slightly different pH values, which may affect the basicity of the reaction system and consequently the kinetics of the aza–Michael addition reaction. Variations in the relative rates of network formation and phase separation are expected to influence the onset of PIPS. When phase separation proceeds prior to gelation, porous structures are formed, whereas rapid network formation tends to immobilize the system before phase separation is completed, resulting in gel materials.
Similar tendencies were observed for systems containing ZrO₂ and TiO₂ nanoparticles (Figure S1). Porous polymer nanocomposites were obtained at relatively low nanoparticle concentrations (<5 wt%), while higher nanoparticle loadings predominantly yielded gels. These results indicate that metal oxide nanoparticles play an important role in determining the balance between network formation and phase separation during the aza–Michael polymerization process. The observed reduction in the porous region with increasing nanoparticle content suggests that the nanoparticles not only influence the occurrence of phase separation but also modify the resulting porous morphology. Since the porous morphology is expected to affect the mechanical and optical properties of the nanocomposites, the structural characteristics of the resulting materials were investigated in detail in the following sections.
3.2. Characterization of Porous Polymer Nanocomposites
The chemical structures of the porous polymer nanocomposites were first characterized by FT-IR spectroscopy. Figure 2 shows representative FT-IR spectra of the monomers, the TETA–PEGDA porous polymer, and the corresponding SiO₂-containing nanocomposite. The successful aza–Michael addition reaction between TETA and PEGDA was confirmed by the disappearance of the characteristic absorption bands at 3350 cm⁻¹ assigned to N–H stretching vibrations of TETA and at 840 cm⁻¹ assigned to the out-of-plane deformation of the acrylate groups in PEGDA. In addition, the SiO₂-containing nanocomposite exhibited a strong absorption band at approximately 1100 cm⁻¹ corresponding to Si–O–Si stretching vibrations, confirming the successful incorporation of silica nanoparticles into the porous polymer network.
Surface morphology of the porous polymer nanocomposites was studied by SEM. The SEM images of TETA-PEGDA SiO2 porous polymer nanocomposites are shown in Figure 3. All the porous polymer nanocomposites showed the morphology composed of half-fused particles. This structure should be formed by PIPS via spinodal decomposition process, as we reported previously in other reaction systems (Scheme S1). When the reaction system is fixed by formation of polymer network before phase separation, the gel is yielded. At the early stage of the phase separation, co-continuous monolithic structure is formed. Progress of the phase separation transfers the structure to droplets by interfacial tension accompanied by particle growth. The morphology in the porous polymer is affected by the fixed stage of the phase separation, which is determined by the relative rate of polymerization (network formation) to phase separation. When the phase separation occurs in preference to the formation of polymer network in the reaction system, the precipitates are formed. Addition of SiO2 decreased sizes of the particles (summarized in Table 2), which should be attributed to increase of the relative polymerization rate to the phase separation rate and fixed the morphology at the early stage of the phase separation.
There are two factors to decrease the sizes of the particles in the porous polymer nanocomposites with increasing with the SiO2 feed. One is existence of SiO2 in the reaction systems. Another in increase of MeOH content, as a solvent of SiO2 sols, in the reaction systems with increasing of the SiO2 feed. Besides the porous polymer composites, we prepared the TETA-PEGDA porous polymers (without SiO2) in the EtOH/MeOH mixed solvents. Although the increase of the MeOH ratio in the solvent decreased the particles sizes in the resulting porous polymers, the decline was not that significant (Figure S2). The results indicate that the existence of SiO2 must be essential for the particles’ decrease with increasing of the SiO2 feed ratio in the reaction systems. The existence of SiO2 increases the relative ratio of polymerization rate to phase separation rate, that should fix the morphology at the earlier stage of the phase separation process. Furthermore, the SiO2 with small size (SiO2-S) effectively decreased the particles in the porous polymer nanocomposites. The similar results were observed in the TEPA-PEGDA and PEHA-PEGDA SiO2 porous polymer nanocomposites (Figures S3 and S4). Those results cleared that increase in number of SiO2 nanoparticles should be dominant to decrease the particles’ size of the resulting porous polymer nanocomposites. In the reactions with same SiO2 feed (wt%), the number of SiO2 nanoparticles increases with decreasing in the nanoparticles’ size. That means that that the reaction with SiO2-S contained larger numbers of the SiO2 nanoparticles than that with the SiO2-M or SiO2-L. Notably, the influence of nanoparticle size was more pronounced than that of the methanol content introduced by the metal oxide sols. Smaller silica nanoparticles (SiO₂-S) produced the finest porous structures, suggesting that the number of nanoparticles rather than their total mass plays a dominant role in determining the morphology. At a fixed SiO₂ loading, smaller nanoparticles provide a larger total interfacial area and a greater number of interaction sites, thereby exerting a stronger influence on the phase-separation process.
The SEM images of the corresponding porous polymer nanocomposites with ZrO2 are summarized in Figure 4. In the same way of the porous polymer nanocomposites with SiO2, the half-fused particle’s sizes decreased with increasing in the ZrO2 feed ratio (Table 2). Furthermore, the PEHA-PEGDA porous polymer nanocomposites prepared through the reaction with 6.0 wt% ZrO2 showed the co-continuous monolithic structure which should be fixed at earlier stage of the phase separation (Figure 4 (f)).
The reactions with TiO2 successfully yielded the porous polymer nanocomposites formed by the half-fused particles with diameters on the order of several nanometres, as shown in Figure 5. The size of the nanoparticles in the porous polymer composites decreased with increasing TiO2 feed ratio (Table 2), as observed in those with SiO2 and ZrO2 nanoparticles.
Distribution and content of metal oxide in the porous polymer nanocomposites were determined by SEM-EDS. Figure 6 shows SEM-EDS element mappings, Si, Zr, or Ti element, of PEHA-PEGDA porous polymer nanocomposites. The elements derived from the metal oxides were dispersed all over the images. The elements’ contents determined from SEM- energy dispersive X-ray spectrometer (EDS) are summarized in Table 1. The content of the metal oxide increased with increasing in the feed ratios in the reaction systems. The composition rate of the metal oxides ranged from about 60 to 80% based on the theoretical values. SEM–EDS analysis further demonstrated that the metal oxide nanoparticles were homogeneously distributed throughout the porous polymer matrix without noticeable aggregation. Such uniform dispersion is expected to contribute not only to the observed refinement of the porous morphology but also to the enhancement of the mechanical properties discussed in the following section.
3.3. Properties of Porous Polymer Nanocomposites
The mechanical properties of the porous polymer nanocomposites were evaluated by compression testing. Representative stress–strain curves of the TETA–PEGDA porous polymer nanocomposites containing SiO₂-S are shown in Figure 7, and the mechanical properties of the TETA-, TEPA-, and PEHA–PEGDA porous polymer nanocomposites are summarized in Table 2(i)–(iii), respectively. For all metal oxide systems examined, the Young’s modulus increased with increasing nanoparticle content. As discussed in the previous section, increasing the concentration of metal oxide nanoparticles resulted in a progressive reduction in the size of the phase-separated particles and an increase in the bulk density of the porous materials. Consequently, the porous nanocomposites exhibited enhanced resistance to compressive deformation, leading to higher Young’s modulus values.
The size of the silica nanoparticles also significantly influenced the mechanical properties of the porous polymer nanocomposites. At a fixed SiO₂ loading, smaller silica nanoparticles produced finer porous structures with smaller particle diameters and higher bulk densities. As a result, the nanocomposites containing SiO₂-S generally exhibited higher Young’s moduli than those containing SiO₂-M or SiO₂-L. This trend is consistent with the morphological observations discussed in Section 3.2 and suggests that the mechanical properties are strongly governed by the porous architecture formed during polymerization-induced phase separation.
Similar tendencies were observed for the porous polymer nanocomposites containing ZrO₂ and TiO₂ nanoparticles. In both systems, increasing the nanoparticle content led to a reduction in particle size and a corresponding increase in bulk density, which contributed to enhanced mechanical stiffness. These results indicate that the incorporation of metal oxide nanoparticles improves the mechanical performance of the porous polymer nanocomposites primarily through morphological refinement and densification of the porous framework. Notably, the increase in Young’s modulus was more closely associated with the increase in bulk density than with the nanoparticle content itself. Samples exhibiting finer porous structures generally possessed higher bulk densities and correspondingly higher Young’s moduli, regardless of the type of metal oxide employed. This observation suggests that the enhancement of mechanical properties is primarily governed by the morphology of the porous framework rather than by a direct filler-reinforcement effect. The observed correlation between particle size, bulk density, and Young’s modulus suggests that control of the phase-separation process provides an effective strategy for tailoring the mechanical properties of porous polymer nanocomposites.
The observed correlation between particle size, bulk density, and Young’s modulus suggests that control of the phase-separation process provides an effective strategy for tailoring the mechanical properties of porous polymer nanocomposites. Thus, the metal oxide nanoparticles serve not only as reinforcing fillers but also as morphology-controlling agents during polymerization-induced phase separation.

Table 2.
(i). Structure and mechanical properties of TETA-PEGDA porous polymer nanocomposites.
| Run | MO2 1 |
MO2 in feed [wt%] |
Particle diameter [mm] |
Bulk density [g/cm3] |
Young’s modulus [MPa] |
| 1 | --- | 0 | 6.8 | 0.287 | 0.048 |
| 2 | SiO2-S | 1.0 | 1.3 | 0.317 | 0.054 |
| 3 | SiO2-S | 2.0 | 0.78 | 0.541 | 0.144 |
| 4 | SiO2-S | 3.0 | 0.99 | 0.670 | 0.490 |
| 5 | SiO2-M | 2.0 | 0.99 | 0.394 | 0.057 |
| 6 | SiO2-M | 4.0 | 0.81 | 0.547 | 0.308 |
| 7 | SiO2-M | 6.0 | <0.50 | 0.727 | 0.664 |
| 8 | SiO2-M | 8.0 | <0.50 | 0.767 | 0.776 |
| 9 | SiO2-L | 4.0 | 4.79 | 0.370 | 0.106 |
| 10 | SiO2-L | 8.0 | 0.74 | 0.652 | 0.609 |
| 11 | SiO2-L | 12.0 | <0.50 | 0.664 | 1.77 |
| 12 | ZrO2 | 1.0 | 1.13 | 0.498 | 0.264 |
| 13 | TiO2 | 1.0 | 1.15 | 0.527 | 0.074 |
| 14 | TiO2 | 2.0 | <0.50 | 0.659 | 18.2 |
1 M = Si, Zr, or Ti.
Table 2.
(ii). Structure and mechanical properties of TEPA-PEGDA porous polymer nanocomposites.
| Run | MO2 1 |
MO2 in feed [wt%] |
Particle diameter [mm] |
Bulk density [g/cm3] |
Young’s modulus [MPa] |
| 15 | --- | 0 | 5.2 | 0.274 | 0.035 |
| 16 | SiO2-S | 1.0 | 3.4 | 0.352 | 0.095 |
| 17 | SiO2-S | 2.0 | 2.8 | 0.475 | 0.198 |
| 18 | SiO2-S | 3.0 | 1.2 | 0.659 | 0.201 |
| 19 | SiO2-S | 4.0 | 0.88 | 0.728 | 1.46 |
| 20 | SiO2-M | 2.0 | 1.4 | 0.345 | 0.072 |
| 21 | SiO2-M | 4.0 | 0.98 | 0.554 | 0.311 |
| 22 | SiO2-M | 6.0 | 0.73 | 0.603 | 0.369 |
| 23 | SiO2-L | 4.0 | 1.0 | 0.472 | 0.111 |
| 24 | SiO2-L | 8.0 | 0.83 | 0.551 | 0.372 |
| 25 | ZrO2 | 1.0 | 2.9 | 0.296 | 0.055 |
| 26 | ZrO2 | 2.0 | 2.0 | 0.381 | 0.085 |
| 27 | TiO2 | 1.0 | 0.96 | 0.446 | 0.096 |
1 M = Si, Zr, or Ti.
Table 2.
(iii). Structure and mechanical properties of PEHA-PEGDA porous polymer nanocomposites.
| Run | MO2 1 |
MO2 in feed [wt%] |
Particle diameter [mm] |
Bulk density [g/cm3] |
Young’s modulus [MPa] |
| 28 | --- | 0 | 4.7 | 0.377 | 0.135 |
| 29 | SiO2-S | 2.0 | 1.2 | 0.511 | 0.418 |
| 30 | SiO2-S | 4.0 | 0.89 | 0.721 | 0.458 |
| 31 | SiO2-M | 1.0 | 3.6 | 0.379 | 0.141 |
| 32 | SiO2-M | 2.0 | 2.7 | 0.560 | 0.602 |
| 33 | SiO2-L | 4.0 | 1.1 | 0.339 | 0.180 |
| 34 | SiO2-L | 8.0 | <0.50 | 0.529 | 0.902 |
| 35 | ZrO2 | 2.0 | 4.5 | 0.371 | 0.136 |
| 36 | ZrO2 | 4.0 | 2.5 | 0.472 | 0.308 |
| 37 | ZrO2 | 6.0 | <0.50 | 0.481 | 0.491 |
| 38 | TiO2 | 1.0 | 3.8 | 0.406 | 0.154 |
| 39 | TiO2 | 2.0 | 0.73 | 0.618 | 0.533 |
1 M = Si, Zr, or Ti.
The thermal stability of the porous polymer nanocomposites was evaluated by thermogravimetric (TG) analysis. Representative TG curves of the TETA–PEGDA porous polymer nanocomposites containing SiO₂-L (runs 9, 10, and 11) are shown in Figure 8. The porous polymer nanocomposites exhibited higher initial decomposition temperatures (approximately 230 °C) than the corresponding porous polymer without SiO₂ (run 1) (approximately 170 °C), indicating improved thermal stability upon incorporation of silica nanoparticles. This enhancement may be attributed to interactions between the polymer network and the silica nanoparticles, which restrict the thermal motion of the polymer chains and retard thermal degradation. In addition, the residual weight at 500 °C increased with increasing SiO₂ content, reflecting the presence of thermally stable inorganic components in the nanocomposites.
As reported previously, porous TEPA–PEGDA200 polymers exhibit distinct coloration when immersed in toluene. This phenomenon originates from the Christiansen filter effect, which is governed by wavelength-dependent refractive-index matching between the porous polymer and the infiltrated solvent. When the refractive indices of the polymer and solvent become identical at a specific wavelength, light scattering is selectively suppressed, resulting in preferential transmission of that wavelength. Because both the polymer and solvent exhibit optical dispersion, refractive-index matching occurs only within a limited wavelength range, producing characteristic coloration as a scatter light of the complemental color. Consequently, the observed color is highly sensitive to changes in solvent composition, temperature, and polymer structure.
Figure 9(i) shows the transmission spectra of TEPA–PEGDA porous polymer nanocomposites immersed in toluene, and the corresponding optical parameters are summarized in Table 3. The TEPA–PEGDA porous polymer without SiO₂ exhibited a transmission maximum (λmax) at 436.5 nm and appeared orange in color. The refractive index of toluene is 1.496–1.498 at 20 °C and 589 nm, and is estimated to be approximately 1.500 at 40 °C and 436.5 nm based on the Cauchy equation and literature refractive-index data. This value is close to that of the TEPA–PEGDA porous polymer, resulting in refractive-index matching at this wavelength. Increasing the SiO₂ content in the porous polymer nanocomposites progressively shifted λmax toward longer wavelengths (red shift) and altered the observed coloration. Since silica possesses a lower refractive index (approximately 1.458 at 589 nm) than the polymer matrix, incorporation of SiO₂ decreases the effective refractive index of the porous polymer nanocomposite. As illustrated schematically in Figure 9(ii), the wavelength at which the refractive indices of the porous polymer nanocomposite and toluene coincide therefore shifts to longer wavelengths. Consequently, the transmission maximum exhibits a red shift with increasing SiO₂ content. The complementary colors corresponding to the transmitted wavelengths were observed as scattered light from the porous polymer–toluene systems.
Notably, the observed wavelength shift was achieved without altering the chemical structure of the polymer network or the external solvent environment. Instead, the optical response was controlled solely through incorporation of inorganic nanoparticles, highlighting the effectiveness of nanocomposite design as a means of tuning Christiansen-filter-based optical properties. These results demonstrate that the optical response of the porous polymer nanocomposites can be tuned through control of the nanoparticle composition, providing a simple strategy for designing wavelength-selective optical materials based on the Christiansen filter effect.
4. Conclusions
Porous polymer nanocomposites were successfully prepared via the aza–Michael addition reaction of ethyleneamines and poly(ethylene glycol) diacrylate (PEGDA) in EtOH in the presence of metal oxide (SiO₂, ZrO₂, and TiO₂) nanoparticles. Porous polymer nanocomposites containing approximately 1.5–10 wt% metal oxide were obtained through PIPS. Most of the nanocomposites exhibited characteristic porous morphologies composed of partially fused particles with diameters ranging from less than 0.5 μm to 5.0 μm, while some ZrO₂-containing systems formed co-continuous monolithic structures.
Increasing the metal oxide content reduced the size of the phase-separated particles and increased the bulk density of the porous framework, resulting in enhanced Young’s modulus. The incorporation of metal oxide nanoparticles also improved the thermal stability of the porous polymers. These results indicate that the nanoparticles function not only as inorganic fillers but also as morphology-controlling agents during the polymerization-induced phase separation process.
Furthermore, incorporation of SiO₂ enabled tuning of the optical properties of TEPA–PEGDA porous polymers immersed in toluene through the Christiansen filter effect. Because the refractive index of SiO₂ is lower than that of the polymer network, increasing the SiO₂ content decreased the effective refractive index of the porous polymer nanocomposites, resulting in a red shift of the transmission wavelength and a corresponding change in the observed color as a scatter light of the complemental color.
The present study demonstrates a simple and versatile one-pot approach for the preparation of porous polymer nanocomposites through polymerization-induced phase separation in metal oxide sols without the need for specialized equipment. The methodology is expected to be applicable to a wide range of porous polymer systems and nanoparticle species, providing a useful platform for the development of multifunctional porous materials with tunable mechanical, thermal, and optical properties.
Supplementary Materials
The following supporting information can be downloaded at: https://www.mdpi.com/article The following supporting information can be downloaded at https://www.mdpi.com/article/doi/s1: Figure S1: Production diagram of ethyleneamine-PEGDA in the presence of ZrO2 and TiO2 nanoparticles, Figure S2: SEM images of TETA-PEGDA porous polymers prepared in EtOH/MeOH mixed solvents, Figure S3: SEM images of TEPA-PEGDA SiO2 porous polymer nanocomposites, Figure S4: SEM images of PEHA-PEGDA SiO2 porous polymer nanocomposites.
Author Contributions
Conceptualization, N.N. and T.N.; investigation, Y.U. and N.N.; analysis, Y.U., N.N., and T.N.; writing—original draft preparation, N.N.; writing—review and editing, T.N.; supervision, N.N. and T.N.; project administration, N.N.; funding acquisition, N.N. and T.N. All authors have read and agreed to the published version of the manuscript.
Funding
This work was partially supported by ICAT, Hokkaido University, through the Joint Usage/Research Center for Catalyst grant.
Institutional Review Board Statement
Not applicable.
Informed Consent Statement
Not applicable.
Data Availability Statement
The original contributions presented in this study are included in the article/supplementary material. Further inquiries can be directed to the corresponding author(s).
Conflicts of Interest
The authors declare no conflicts of interest.
References
- Alexandre, M.; Dubois, P. Polymer-layered silicate nanocomposites: preparation, properties and uses of a new class of materials. Mater. Sci. Eng. R 2000, 28, 1–63. [Google Scholar] [CrossRef]
- Ray, S.; Okamoto, M. Polymer/layered silicate nanocomposites: a review from preparation to processing. Prog. Polym. Sci. 2003, 28, 1539–1641. [Google Scholar] [CrossRef]
- Zou, H.; Wu, S.; Shen, J. Polymer/Silica Nanocomposites: Preparation, Characterization, Properties, and Applications. Chem. Rev. 2008, 108, 3893–3957. [Google Scholar] [CrossRef] [PubMed]
- Kango, S.; Kalia, S.; Celli, A.; Njuguna, J.; Habibi, Y.; Kumar, R. Surface modification of inorganic nanoparticles for development of organic–inorganic nanocomposites. Prog. Polym. Sci. 2013, 38, 1232–1261. [Google Scholar] [CrossRef]
- Bréchet, Y.; Cavaillé, J.--Y.; Chabert, E.; Chazeau, L.; Dendievel, R.; Flandin, L.; Gauthier, C. Polymer Based Nanocomposites: Effect of Filler-Filler and Filler-Matrix Interactions. Adv. Eng. Mater. 2001, 3, 571–577. [Google Scholar]
- Fu, S. Y.; Feng, X. Q.; Lauke, B.; Mai, Y. W. Effects of particle size, particle/matrix interface adhesion and particle loading on mechanical properties of particulate–polymer composites. Compos. Part B 2008, 39, 933–961. [Google Scholar]
- Drakopoulos, S. X.; Wu, J.; Priestley, R. D. Polymer nanocomposites: Interfacial properties and capacitive energy storage. Prog. Polym. Sci. 2024, 156, 101870. [Google Scholar] [CrossRef]
- Lewis, T. J. Nanometric dielectrics. IEEE Trans. Dielectr. Electr. Insul.> 1994, 1, 812–825. [Google Scholar] [CrossRef]
- Nelson, J. K.; Fothergill, J. C. Internal charge behaviour of nanocomposites. Nanotechnology 2004, 15, 586–595. [Google Scholar] [CrossRef]
- Mahajan, R.; Koros, W. J. Mixed matrix membrane materials with glassy polymers. Polym. Eng. Sci. 2002, 42, 1420–1431. [Google Scholar] [CrossRef]
- Li, Y.; Chung, T.-S. Molecular-level mixed matrix membranes comprising Pebax and POSS for hydrogen purification. J. Membr. Sci. 2008, 326, 520–528. [Google Scholar]
- Zornoza, B.; Téllez, C.; Coronas, J.; Gascon, J.; Kapteijn, F. Mixed matrix membranes for gas separation with MOFs. Microporous Mesoporous Mater. 2013, 166, 67–78. [Google Scholar]
- Wolf, C.; Angellier-Coussy, H.; Gontard, N.; Doghier, F.; Guillard, V. How the shape of fillers affects the barrier properties of polymer/non-porous particles nanocomposites: A review. J. Membr. Sci. 2018, 556, 393–418. [Google Scholar]
- Pai, A.R.; Puthiyaveettil Azeez, N.; Thankan, B.; Gopakumar, N.; Jaroszewski, M.; Paoloni, C.; Kalarikkal, N.; Thomas, S. Recent Progress in Electromagnetic Interference Shielding Performance of Porous Polymer Nanocomposites—A Review. Energies 2022, 15, 3901. [Google Scholar] [CrossRef]
- Okay, O. Polymerization-induced phase separation and porous materials. Prog. Polym. Sci. 2000, 25, 711–779. [Google Scholar]
- Oehl, G.; Naga, N.; Ziegmann, G. Facile Synthesis of Poly(methyl methacrylate) Silica Nanocomposite Monolith by In Situ Free Radical Polymerization of Methyl Methacrylate in the Presence of Functionalized Silica Nanoparticles. ACS Omega 2025, 10, 51839–51847. [Google Scholar]
- Naga, N.; Janas, J.; Takenouchi, T.; Nakano, T. Synthesis and Properties of Ethylene Imine-Based Porous Polymer Nanocomposites with Metal Oxide Nanoparticles. Molecules 2025, 30, 3574. [Google Scholar] [CrossRef] [PubMed]
- Naga, N.; Jinno, M.; Wang, Y.; Nakano, T. The first space-filling polyhedrons of polymer cubic cells originated from Weaire-Phelan structure created by polymerization induced phase separation. Sci. Rep. 2022, 12, 19141. [Google Scholar] [PubMed]
- Christiansen, C. Untersuchungen über die optischen Eigenschaften von fein verteilten Körpern. Ann. Phys. Chem. 1884, 23, 298–306. [Google Scholar]
- Asher, S. A.; Weissman, J. M. Photonic crystal and Christiansen filter based optical materials. Acc. Chem. Res. 2001, 34, 510–519. [Google Scholar]
- Takeoka, Y.; Seki, T. Biform Structure Colored Hydrogel for Observation of Subchain Coformations. Macromolecules 2007, 40, 5513–5518. [Google Scholar]
- Samitsu, S.; Miyazaki, H. T.; Segawa, H. Transmitting and scattering coloros for porous particles of poly(vinyl chloride) based on Christiansen effect. Polymer 2018, 147, 237–246. [Google Scholar]
- Takeuchi, Y.; Hayashi, Y.; Uyama, H. Christiansen Effect-Based Physical Coloration of a Cellulosic Monolith Conveniently Fabricated Using Thermally Induced Phase Separation. Macromol. Chem. Phys. 2020, 221, 2000272. [Google Scholar]
- Naga, N.; Nakai, R.; Yamato, M.; Noguchi, K.; Nakano, T. Coloration of Ethyleneamine-Diacrylate-Based Porous Polymer-Toluene Systems Induced by the Christiansen Effect: Color Control by the Molecular Design of the Polymer Networks. ACS Omega 2025, 10, 51839–51847. [Google Scholar] [PubMed]
Scheme 1.
Synthesis of porous polymer nanocomposites by through aza-Michel addition reaction of ethyleneamine with PEGDA in the presence of metal oxide nanoparticles.
Scheme 1.
Synthesis of porous polymer nanocomposites by through aza-Michel addition reaction of ethyleneamine with PEGDA in the presence of metal oxide nanoparticles.
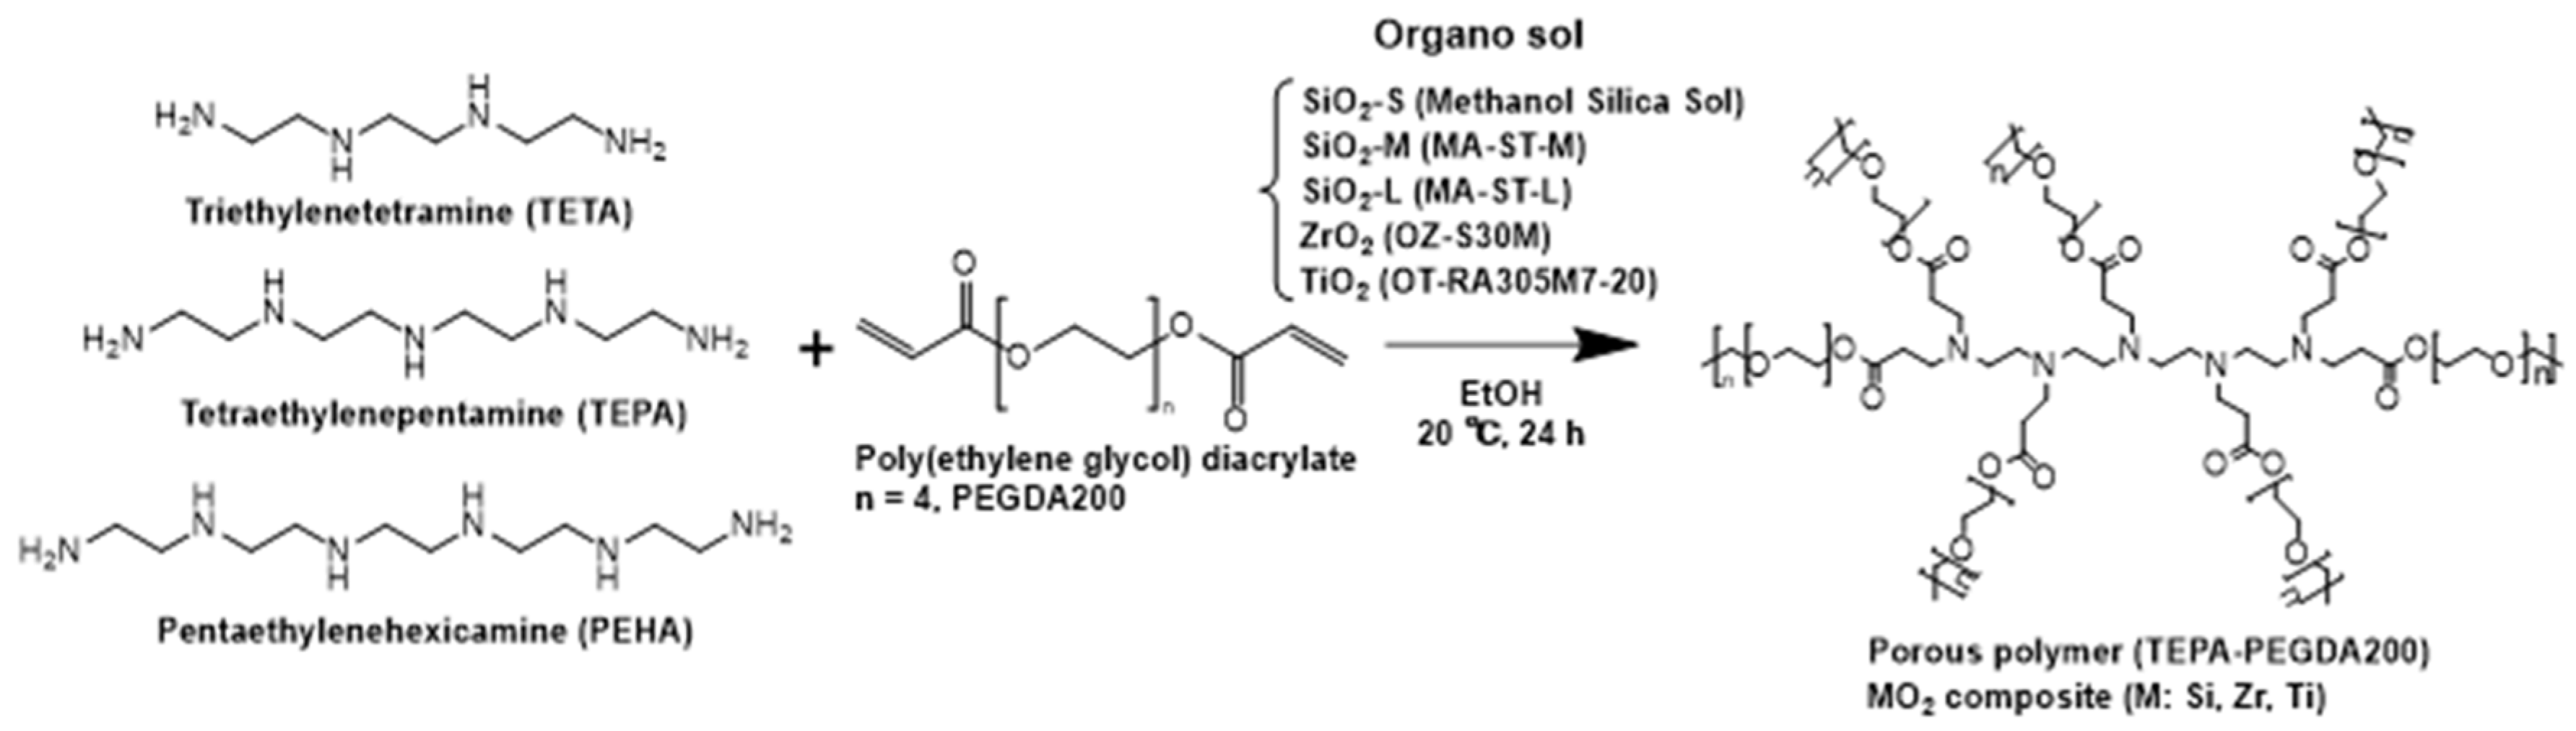
Figure 1.
Production diagram (●gel, ▲white gel, ◆gel/porous, ■porous, ◆precipitate) of polyethyleneamine-PEGDA in the presence of (a) SiO2-S, (b) SiO2-M, (c) SiO2-L nanoparticles, monomer concentration: 20 wt%, reaction temperature: 20 oC.
Figure 1.
Production diagram (●gel, ▲white gel, ◆gel/porous, ■porous, ◆precipitate) of polyethyleneamine-PEGDA in the presence of (a) SiO2-S, (b) SiO2-M, (c) SiO2-L nanoparticles, monomer concentration: 20 wt%, reaction temperature: 20 oC.
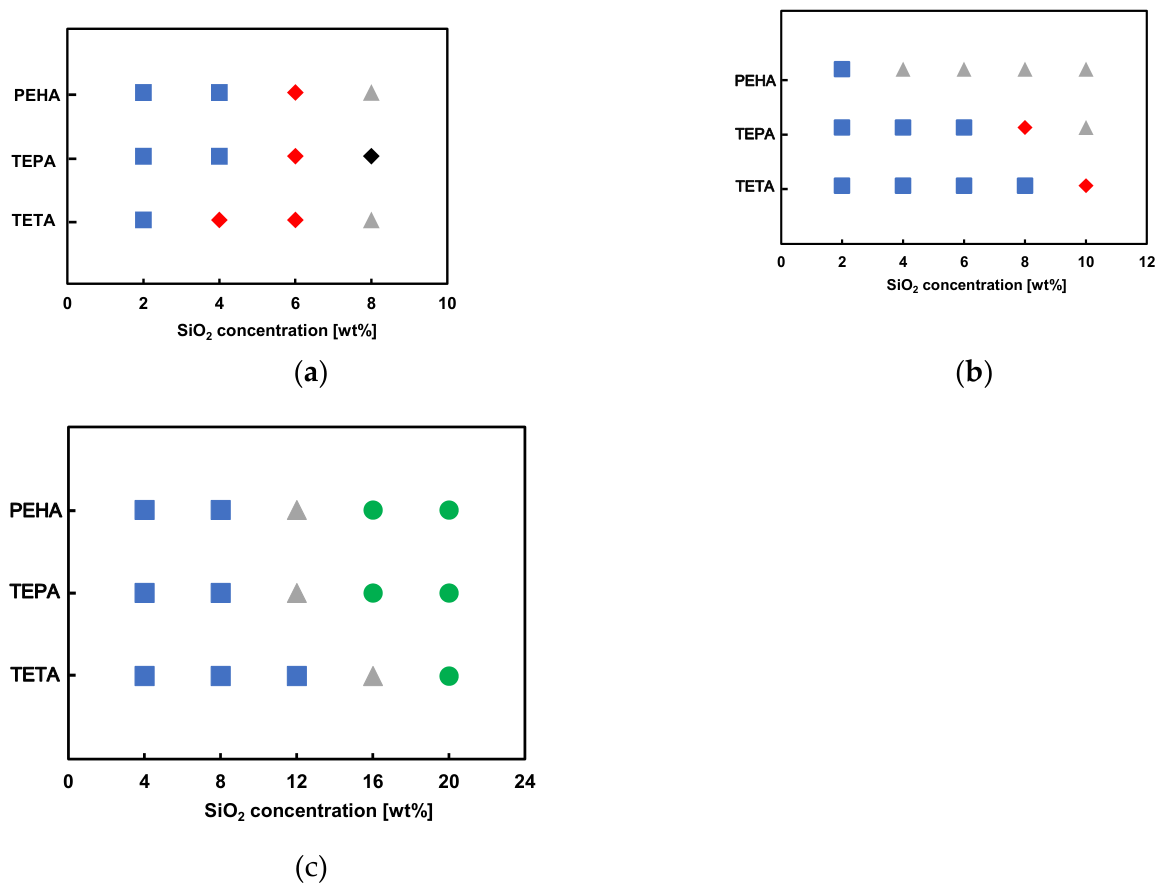
Figure 2.
FT-IR spectra of (a) TETA, (b) PEGDA, (c) TETA-PEGDA porous polymer, and (d) TETA-PEGDA SiO2-L porous polymer nanocomposite (SiO2 concentration in the reaction system: 4.0 wt%), monomer concentration: 20 wt%.
Figure 2.
FT-IR spectra of (a) TETA, (b) PEGDA, (c) TETA-PEGDA porous polymer, and (d) TETA-PEGDA SiO2-L porous polymer nanocomposite (SiO2 concentration in the reaction system: 4.0 wt%), monomer concentration: 20 wt%.
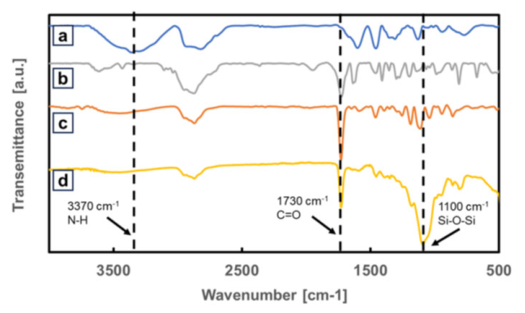
Figure 3.
SEM images of TETA-PEGDA SiO2 porous polymer nanocomposites, SiO2 concentration in the reaction solution (a) without SiO2, (b) with 2 wt% SiO2-S, (c) with 2 wt% SiO2-M, (d) with 4 wt% SiO2-M, (e) with 4 wt% SiO2-L, and (f) with 8 wt% SiO2-L, monomer concentration: 20 wt%, magnification: ×2000.
Figure 3.
SEM images of TETA-PEGDA SiO2 porous polymer nanocomposites, SiO2 concentration in the reaction solution (a) without SiO2, (b) with 2 wt% SiO2-S, (c) with 2 wt% SiO2-M, (d) with 4 wt% SiO2-M, (e) with 4 wt% SiO2-L, and (f) with 8 wt% SiO2-L, monomer concentration: 20 wt%, magnification: ×2000.
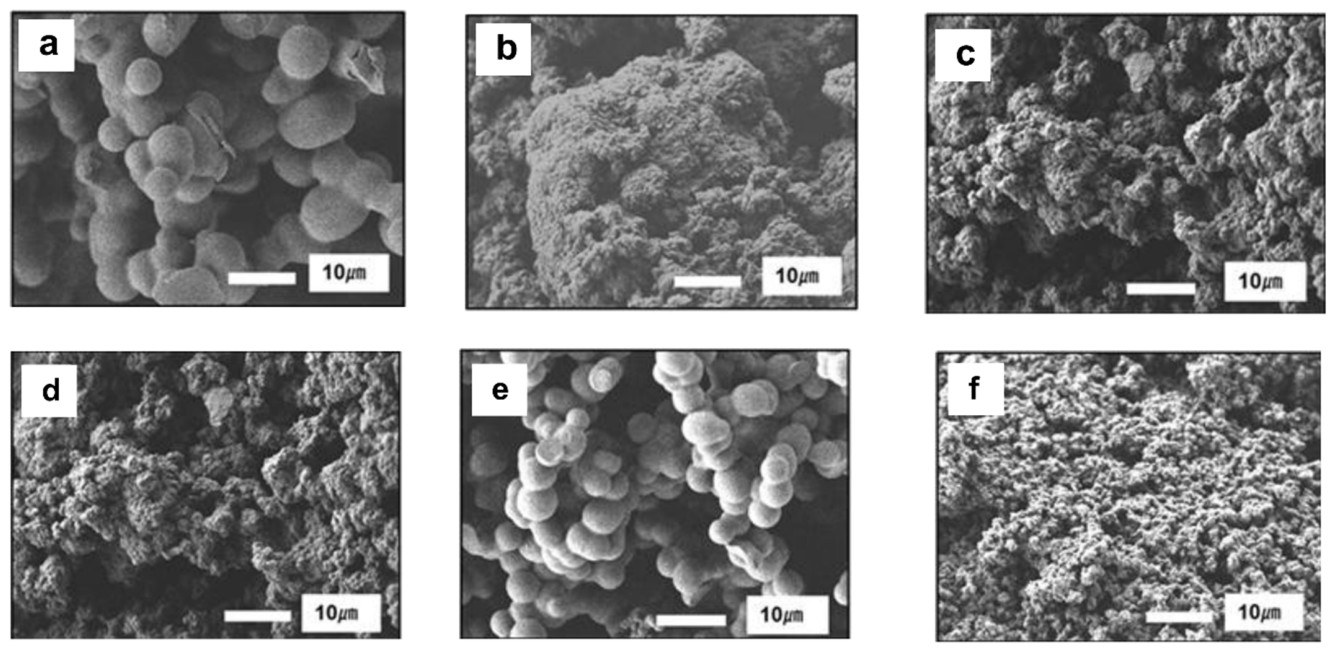
Figure 4.
SEM images of (a) TETA-PEGDA ZrO2, (b)-(c) TEPA-PEGDA ZrO2, (d)-(f) PEHA-PEGDA ZrO2 porous polymer nanocomposite, ZrO2 concentration in the reaction solution: (a) 1.0 wt%, (b) 1.0 wt%, (c) 2.0 wt%, magnification: ×1000, (d) 2.0 wt%, (e) 4.0 wt%, and (f) 6.0 wt%, , magnification: ×2000.
Figure 4.
SEM images of (a) TETA-PEGDA ZrO2, (b)-(c) TEPA-PEGDA ZrO2, (d)-(f) PEHA-PEGDA ZrO2 porous polymer nanocomposite, ZrO2 concentration in the reaction solution: (a) 1.0 wt%, (b) 1.0 wt%, (c) 2.0 wt%, magnification: ×1000, (d) 2.0 wt%, (e) 4.0 wt%, and (f) 6.0 wt%, , magnification: ×2000.
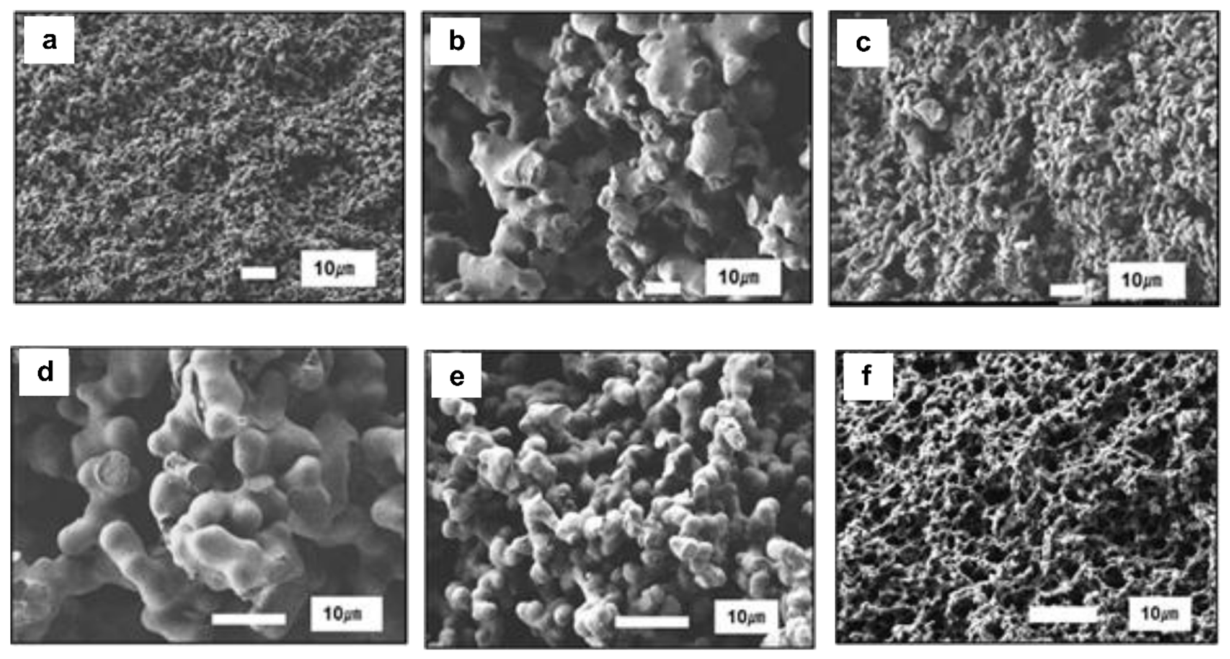
Figure 5.
SEM images of (a)-(b) TETA-PEGDA TiO2 porous polymer nanocomposites, (c) TEPA-PEGDA200 porous polymer nanocomposite, and (d)-(e) PEHA-PEGDA200 TiO2 porous polymer nanocomposites, TiO2 in the reaction solution: (a) 1.0 wt%, (b) 2.0 wt%, (c) 1.0 wt%, (d) 1.0 wt%, and (e) 2.0 wt%, magnification: ×2000.
Figure 5.
SEM images of (a)-(b) TETA-PEGDA TiO2 porous polymer nanocomposites, (c) TEPA-PEGDA200 porous polymer nanocomposite, and (d)-(e) PEHA-PEGDA200 TiO2 porous polymer nanocomposites, TiO2 in the reaction solution: (a) 1.0 wt%, (b) 2.0 wt%, (c) 1.0 wt%, (d) 1.0 wt%, and (e) 2.0 wt%, magnification: ×2000.
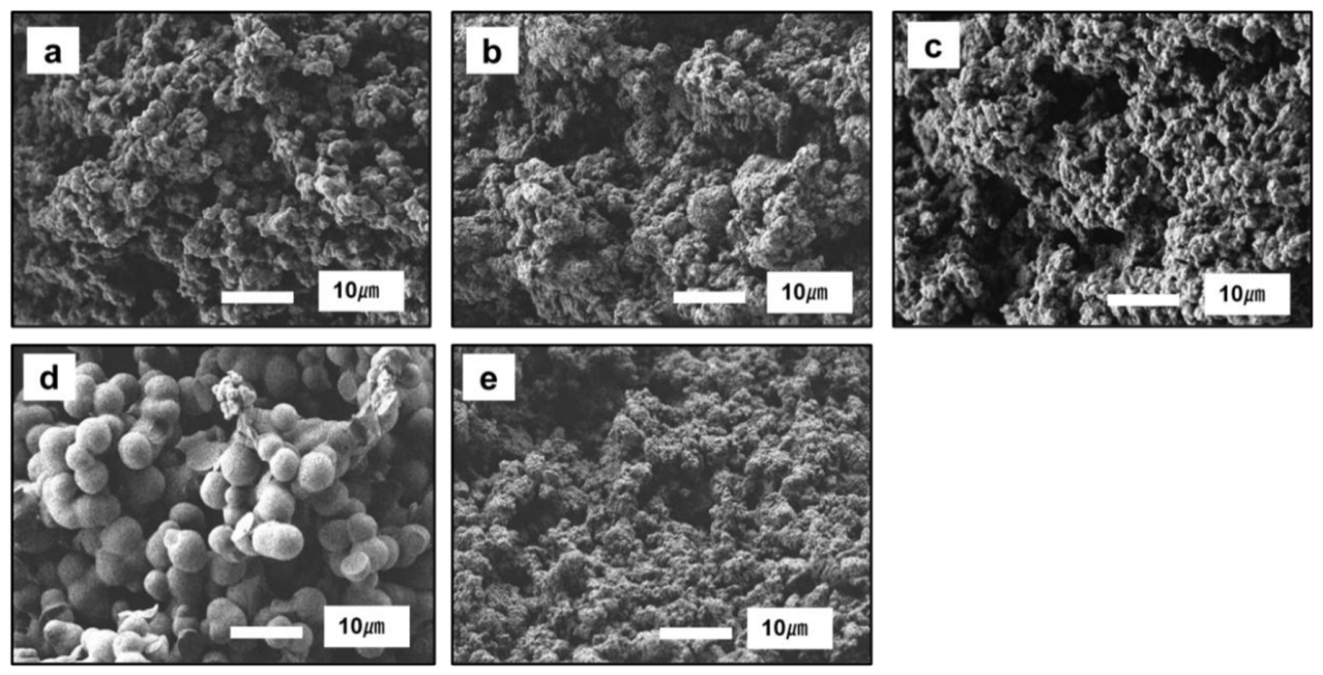
Figure 6.
SEM images (left) and EDS element mappings (right) (Si, Zr, or Ti element) of PEHA-PEGDA porous polymer nanocomposites with (a), (b) SiO2-L 4.0 wt%, (c), (d) ZrO2 6.0 wt%, and (e), (f) TiO2 2.0 wt%, monomer concentration: 20 wt%.
Figure 6.
SEM images (left) and EDS element mappings (right) (Si, Zr, or Ti element) of PEHA-PEGDA porous polymer nanocomposites with (a), (b) SiO2-L 4.0 wt%, (c), (d) ZrO2 6.0 wt%, and (e), (f) TiO2 2.0 wt%, monomer concentration: 20 wt%.
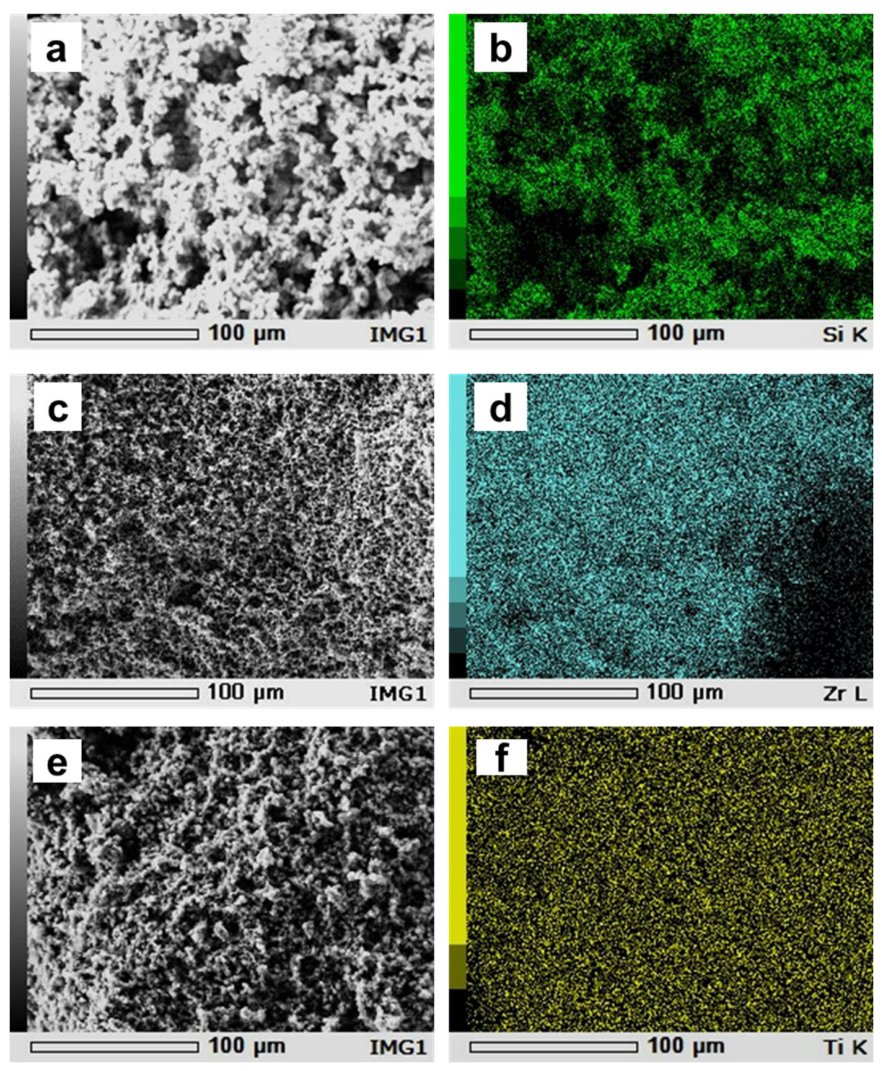
Figure 7.
Stress-Strain curves of TETA-PEGDA SiO2-S porous polymer nanocomposites, SiO2 concentration in the reaction solution: (a) 0 wt% (run 1), (b) 1.0 wt% (run 2), (c) 2.0 wt% (run 3), and (d) 3.0 wt% (run 4), monomer concentration: 20 wt%.
Figure 7.
Stress-Strain curves of TETA-PEGDA SiO2-S porous polymer nanocomposites, SiO2 concentration in the reaction solution: (a) 0 wt% (run 1), (b) 1.0 wt% (run 2), (c) 2.0 wt% (run 3), and (d) 3.0 wt% (run 4), monomer concentration: 20 wt%.
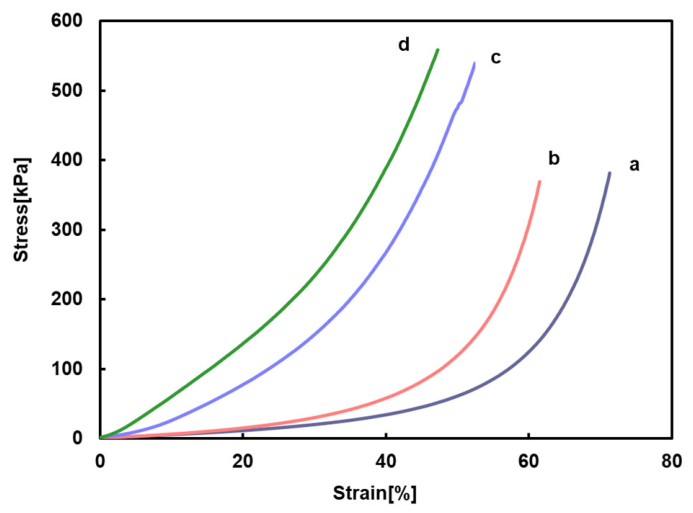
Figure 8.
TG curves of (a) TETA-PEGDA porous polymer (run 1), (b)-(d) TETA-PEGDA SiO2-L porous polymer nanocomposites in the argon condition, SiO2 concentration in the feed: (b) 4.0 wt% (run 9), (c) 8.0 wt% (run 10), (d) 12 wt% (run 11), monomer concentration: 20 wt%.
Figure 8.
TG curves of (a) TETA-PEGDA porous polymer (run 1), (b)-(d) TETA-PEGDA SiO2-L porous polymer nanocomposites in the argon condition, SiO2 concentration in the feed: (b) 4.0 wt% (run 9), (c) 8.0 wt% (run 10), (d) 12 wt% (run 11), monomer concentration: 20 wt%.
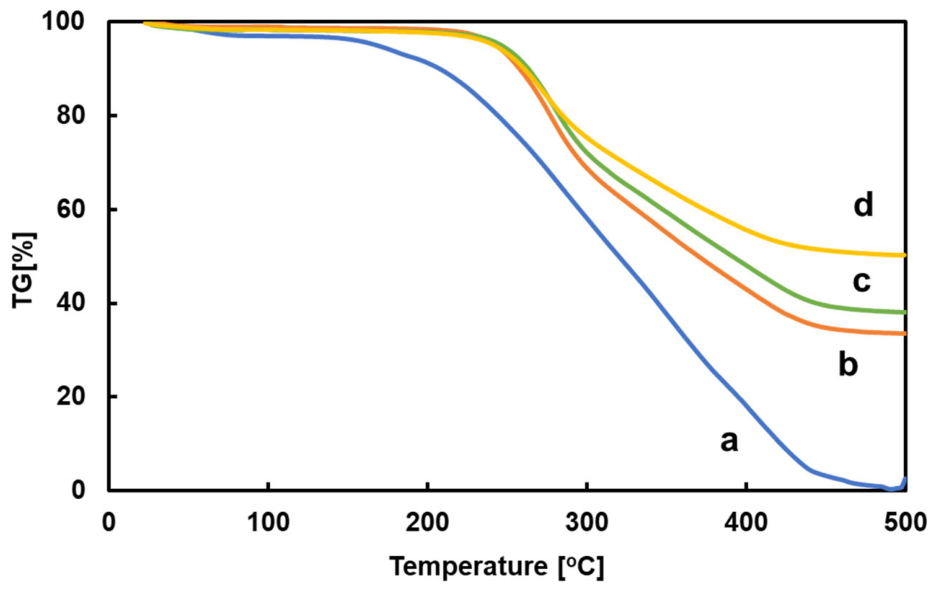
Figure 9.
(i) Photos and transmission spectra of TEPA-PEGDA SiO2-S porous polymer nanocomposites immersed in toluene, SiO2 concentration in the reaction solution: (a) 0 wt% (run 15), (b) 2.0 wt% (run 17), and (c) 4.0 wt% (run 19), monomer concentration: 20 wt%, observation temperature: 40 ºC, (ii) graphical images of the Christiansen filter effect observed in TEPA-PEGDA SiO2 porous polymer nanocomposite, np1: refractive index of TEPA-PEGDA porous polymer, np2: refractive index of TEPA-PEGDA SiO2-S porous polymer nanocomposite, ni: refractive index of toluene.
Figure 9.
(i) Photos and transmission spectra of TEPA-PEGDA SiO2-S porous polymer nanocomposites immersed in toluene, SiO2 concentration in the reaction solution: (a) 0 wt% (run 15), (b) 2.0 wt% (run 17), and (c) 4.0 wt% (run 19), monomer concentration: 20 wt%, observation temperature: 40 ºC, (ii) graphical images of the Christiansen filter effect observed in TEPA-PEGDA SiO2 porous polymer nanocomposite, np1: refractive index of TEPA-PEGDA porous polymer, np2: refractive index of TEPA-PEGDA SiO2-S porous polymer nanocomposite, ni: refractive index of toluene.
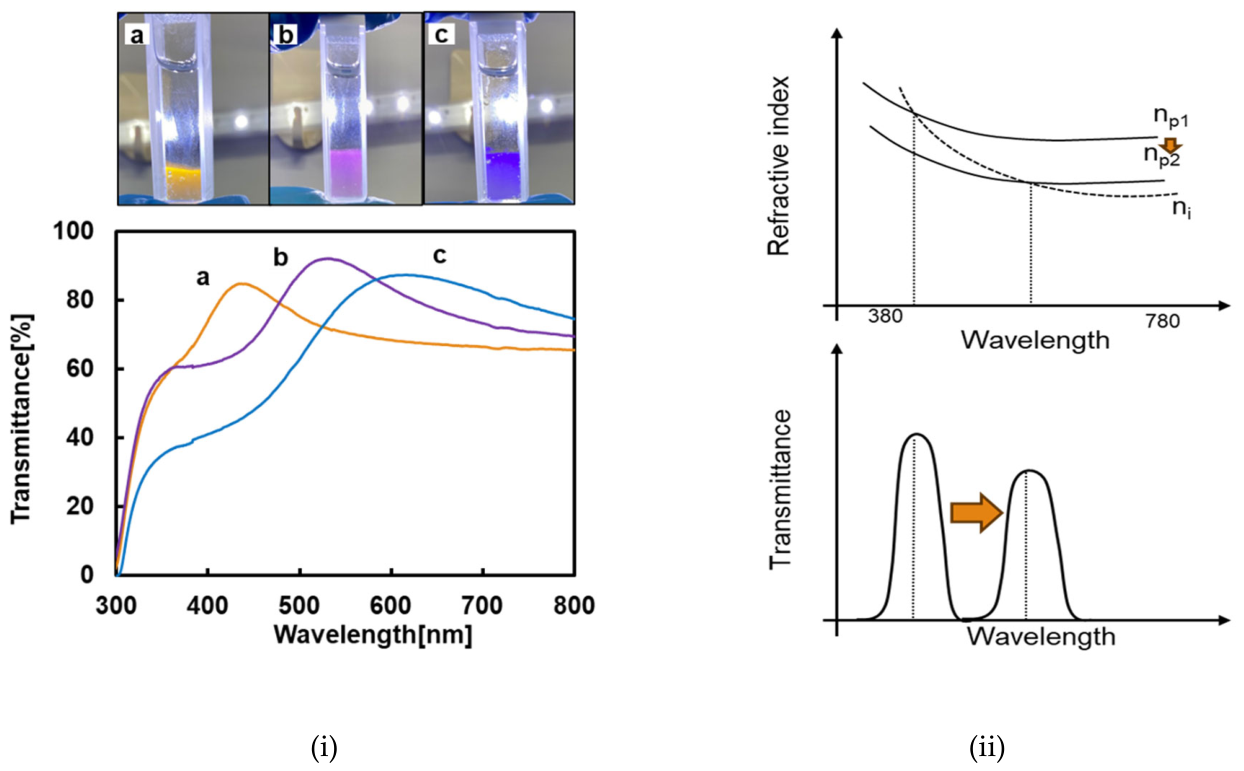
Table 1.
Compositions of ethyleneamine-PEGDA200 porous polymer nanocomposites with SiO2, ZrO2, or TiO2.
Table 1.
Compositions of ethyleneamine-PEGDA200 porous polymer nanocomposites with SiO2, ZrO2, or TiO2.
| ethyleneamine | MO2 1 |
MO2 in feed [wt%] |
M contentin porous polymer composite [wt%] |
Composition efficiency [%] |
| TETA | SiO2-M | 4.0 | 5.8 | 75.6 |
| TETA | SiO2-M | 8.0 | 8.8 | 66.8 |
| TETA | SiO2-L | 4.0 | 5.9 | 76.5 |
| TETA | SiO2-L | 8.0 | 9.4 | 71.4 |
| TEPA | SiO2-S | 4.0 | 4.5 | 60.0 |
| TEPA | SiO2-M | 4.0 | 5.4 | 70.4 |
| TEPA | SiO2-L | 4.0 | 5.4 | 70.7 |
| TEPA | ZrO2 | 2.0 | 4.8 | 70.8 |
| PEHA | SiO2-M | 1.0 | 1.6 | 74.0 |
| PEHA | ZrO2 | 2.0 | 4.6 | 68.8 |
| PEHA | ZrO2 | 4.0 | 9.9 | 79.9 |
| PEHA | TiO2 | 1.0 | 2.4 | 82.7 |
1 M = Si, Zr, or Ti.
Table 3.
Peak wavelength of transmission spectra of TEPA-PEGDA200 SiO2-S porous polymer nanocomposites.
Table 3.
Peak wavelength of transmission spectra of TEPA-PEGDA200 SiO2-S porous polymer nanocomposites.
|
SiO2-S concentration In the feed [wt%] |
lmax [nm] |
Transmission color |
Observation color |
| 0 | 436.5 | indigo | orange |
| 2.0 | 525.1 | green | purple |
| 4.0 | 605.5 | orange | ultramarine |
Disclaimer/Publisher’s Note: The statements, opinions and data contained in all publications are solely those of the individual author(s) and contributor(s) and not of MDPI and/or the editor(s). MDPI and/or the editor(s) disclaim responsibility for any injury to people or property resulting from any ideas, methods, instructions or products referred to in the content. |
© 2026 by the authors. Licensee MDPI, Basel, Switzerland. This article is an open access article distributed under the terms and conditions of the Creative Commons Attribution (CC BY) license (http://creativecommons.org/licenses/by/4.0/).
Copyright: This open access article is published under a Creative Commons CC BY 4.0 license, which permit the free download, distribution, and reuse, provided that the author and preprint are cited in any reuse.


