

Submitted:
29 June 2026
Posted:
02 July 2026
You are already at the latest version
Abstract
This study demonstrates the generation of excess energy and isotopes via Low-Energy Nuclear Reactions (LENR) of water in 11 reactors. Cross-verification using Mass Spectrometry (MS), Nuclear Magnetic Resonance (NMR), and Cavity Ring-Down Spectroscopy (CRDS) confirmed that 17O production concurrently occurs with excess energy release, establishing the reproduci-bility of the LENR process. For mass production of 17O-enriched water, a batch-type internal circulation system integrating a storage tank and a circulation pump was developed. This setup allows continuous manufacturing of 17O-enriched water, with concentrations controlled via cir-culation time. Specifically, a 32 L system successfully yielded 30 mol% 17O-enriched water within 290 h. For high-concentration measurement, a 17O NMR-verified dilution method was es-tablished. Moreover, the LENR process induces the formation of stable, 200 nm nanobubbles (density: 9.33 x 10⁶ particles/mL for reactor #185r12), predominantly composed of 17O com-pounds of non-condensable gases (O2 and CO2). These persistent nanobubbles prevent gas loss, significantly enhancing the long-term storage stability and practical utility of the product. Uti-lizing this low-cost, mass-produced 17O-enriched water, a preliminary MTT assay revealed that 17O disrupts cancer cell metabolism, offering promising insights for future oncology research. Overall, this cost-effective mass-production technology facilitates the deployment of 17O in healthcare and biomedical sectors, promoting further academic and clinical exploration.
Keywords:
17O-enriched water
; 17O isotopes
; low-energy nuclear reactions
1. Introduction
The phenomenon of cold fusion, initially reported in 1989 using deuterated heavy water as an electrolyte solution during electrolysis [1,2], garnered widespread attention. Subsequent studies demonstrated that similar nuclear fusion-like phenomena could also be induced using light water (ordinary water) as the electrolyte [3,4,5,6,7,8,9]. Furthermore, anomalous energy yields have been observed in water-arc-induced fog generation [10], as well as during micron-sized droplet formation via electrohydrodynamic atomization (EHDA) of pure water [11]. These findings strongly imply that deuterated heavy water is not a strict prerequisite for inducing fusion-like phenomena, and that light water poses a viable alternative.
Our energy engineering research team has focused on investigating technologies that utilize cavitation in light water to generate excess heat via Low-Energy Nuclear Reactions (LENR). Our previous experimental findings [12] included calorimetric measurements of excess heat, as well as analyses of reactor failures caused by processing anomalies. Scanning Electron Microscopy (SEM) and Energy-Dispersive X-ray spectroscopy (EDX) cross-sectional evaluations confirmed that these failures were driven by nuclear transmutation. Subsequent experiments across a series of diverse reactors revealed that water can be excited to undergo nuclear reactions that yield excess energy. Concurrently, this process generates 22Ne and 17O isotope compounds, including H217O, 17O2, and 12C17O2 [13]. Because the 17O isotope is generated as a low-cost byproduct of this energy-production process, its inherent medical value presents a compelling new frontier for clinical and biomedical applications.
To advance this technology, we have designed a variety of reactors to systematically explore how water cavitation can be leveraged to excite nuclear reactions and generate both excess energy and isotopic compounds [14]. In addition to utilizing mass spectrometry (MS) to analyze the effluents, we implemented nuclear magnetic resonance (NMR) spectroscopy and cavity ring-down spectroscopy (CRDS) for precise characterization. This paper presents our latest research on this topic, focusing on the reproducibility of the LENR phenomenon, product verification, the mass production of low-cost, high-concentration 17O-enriched water (H217O), and its associated concentration measurement techniques.
Recent advancements in quantum biology [16,17,18] suggest that because 17O possesses a non-zero nuclear spin, its magnetic isotope effect (MIE) may influence free radical generation or cellular signaling pathways, thereby disrupting cancer cell metabolism and inducing apoptosis. Consequently, this mechanism holds potential for developing novel healthcare protocols or cancer therapies. However, the prohibitively high manufacturing cost of 17O-enriched water has historically hindered clinical and translational evaluation. Utilizing the low-cost H217O mass-produced by our LENR reactors, we conducted preliminary in vitro MTT assays on cancer cells to provide a baseline reference for future medical applications.
2. Materials and Methods
2.1. Reproducibility of Low-Energy Nuclear Reactions (LENR) in Water
We have previously reported that cavitation in pure water can generate excess heat, and our mass spectrometry (MS) analysis of the resulting water samples revealed the presence of isotopes, thereby confirming that this phenomenon is driven by low-energy nuclear reactions [12,13]. To verify the reproducibility of these findings, we designed and fabricated additional reactors for subsequent testing. Beyond measuring the excess heat yield (expressed as the coefficient of performance, COPx), we employed multiple analytical techniques to characterize the effluents and validate the underlying nuclear reactions, including:
- Mass Spectrometry (MS) Analysis: Conducted to determine the molecular and isotopic composition of the reaction effluents.
- 17O Nuclear Magnetic Resonance (17O-NMR) Spectroscopy: Utilized to analyze and quantify the specific 17O components within the generated products.
- Cavity Ring-Down Spectroscopy (CRDS): Implemented for the high-precision detection and analysis of 17O, 18O, and D (deuterium) isotopes.
2.2. Reactor Design
To achieve high energy output efficiency, previous investigations utilized either a triple-pipe heat exchanger (VCS/THX series) that employed refrigerant vapor discharged from a refrigerant compressor to heat water, or a double-pipe heat exchanger (DHX series) that used boiler steam for water heating [12]. Although these two designs achieved remarkable thermal efficiencies (COPx > 4.2), the highly intense LENR they induced led to an exceptionally short reactor lifespan (< 1 week). Due to their structural complexity and low reliability, these reactor configurations are impractical for real-world engineering applications such as power generation. To address these limitations, the present study adopts a resonant cavity structure design, as shown in Figure 1. This new configuration facilitates large-scale scale-up while confining the cavitation phenomena to a region safely away from the reactor walls.
2.3. Collection of Reaction Water
To facilitate the collection and subsequent analysis of the nuclear reaction products, the gas-liquid two-phase water flow discharged from the reactor is routed through an air-cooled radiator for heat dissipation. Upon reaching thermal equilibrium, the effluent condenses into stable liquid reaction water suitable for storage, utilization, or analytical testing, and is subsequently collected in a water tank, as illustrated in Figure 2.
2.4. Gas Collection for Mass Spectrometry Analysis
The mass spectrometer employed in this study (Extorr XT300) is designed exclusively for gas-phase analysis; therefore, the reaction water stored in the reservoir must be converted into a gaseous state prior to measurement. The analytical results from mass spectrometry can be significantly influenced by sampling techniques and operational parameters, such as the vaporization process of the water sample, mass spectrometer inlet flow rates, system pressures, and interference caused by condensation. To ensure the consistency and reproducibility of the mass spectrometry measurements, a gas collection system, as illustrated in Fig. 3, was utilized along with a standard operating procedure (SOP) to convert the reaction water into water vapor. The sequential steps are outlined below:
2.4.1. Temperature Control of Water Samples
The glass jar containing the water sample was connected to the gas collector, vacuum pump, valves, nitrogen cylinder, and air cylinder as illustrated in Figure 3. The glass jar was immersed in a constant-temperature water bath equipped with an electric heater and a stirrer, and a temperature controller was employed to maintain a constant temperature of 40 1 oC.
2.4.2. Gas Collector Evacuation (Isolated from the Sample Jar)
The vacuum pump was turned on. Valves Vn and Va were closed, while valves Vg, Vs, and Ve were opened. Evacuation was conducted for at least 1 min before switching off the pump and closing Ve.
2.4.3. Gas Collection in the Collector (Connected to the Sample Jar)
Valves Ve, Vn, and Va were closed, while valves Vg and Vs were opened and maintained for 20 min. The vacuum state was utilized to vaporize the liquid water sample, allowing the water vapor to flow into the gas collector. The process was stopped by closing Vg and Vs once the gas pressure reached 30 torr.
2.4.4. Injection of 99.999% N2
Valve Vn was opened until the pressure reached 630 torr. This step was primarily implemented to reduce the humidity of the collected gas, thereby preventing water vapor from condensing due to ambient temperature drops, which could otherwise interfere with the mass spectrometry operation.
2.4.5. Injection of Standard Air
Valves Va and Vg were opened, while Vn, Vs, and Ve were closed, and the process was stopped by closing Va and Vg when the pressure reached 760 torr. Because the concentration of 40Ar in water is extremely low, the injection of standard air provided a sufficient amount of 40Ar components to enhance the intensity of the m/z 40 internal standard signal in the mass spectrometer.
This gas collection procedure was optimized through extensive experimental experience. The connection between the gas collector and the mass spectrometer is shown in Figure 4. To ensure the consistency and reliability of the analytical results, this study simultaneously collected and compared the water after the LENR reaction with the unreacted background water (Reverse Osmosis water, RO water). The differences between the data sets obtained from both samples can be effectively utilized to determine whether additional components were generated by the nuclear reactions.
2.5. Analytical Methods for the Composition (Qualitative) and Concentration (Quantitative) of LENR Products
Following the aforementioned vaporization and collection processes, both the reaction water obtained after the LENR process and the unreacted background RO water were introduced into a mass spectrometer (model: Extorr XT300M) for analysis. By comparing the resulting mass spectra with those of the unreacted water, it is possible to qualitatively determine whether the LENR process generated any anomalous or additional components.
2.5.1. Qualitative Analysis of Product Composition via MS
For non-condensable gases dissolved in water, m/z 40 was utilized as the internal standard, defined as follows:
where # represents the mass number of the element, and BG denotes the unreacted water (background water). A value of LL#(gas) > 1.0 indicates that the LENR process generated elements in excess of those found in the background water.
For water isotopes in the liquid phase, such as H217O, m/z 18 was employed as the internal standard (ordinary water), defined as follows:
Where BG denotes the unreacted water (background water). A value of LL198 > 1.0 indicates that the LENR process successfully generated m/z 19 elements (H217O) exceeding the background water baseline.
To minimize experimental error, two water samples—the reaction water and the unreacted background RO water (BG)—were analyzed simultaneously. This dual-sampling approach effectively eliminates interference arising from variability in water quality.
2.5.2. Quantitative Analysis of Product Concentration via MS
The measured mass spectrometry signal intensity, I#, can be utilized to obtain a quantitative approximation of the concentration (expressed in mol%). Based on the definition in Eq. (1), I# represents the ratio of the mass-to-charge (m/z) signal of element # to that of 40Ar. Within the linear range of the mass spectrometer, this ratio can be assumed to represent the concentration ratio of the two elements within the gaseous sample, given by:
where Cx # is the concentration of the element with mass number #, and C40Ar is the concentration of 40Ar in the gas sample. The gas sample in the gas collector was charged with water vapor (30 torr, pure nitrogen gas (630 torr), and standard air (100 torr, Note: adjusted to match standard total atmospheric pressure of 760 torr). Given that standard air contains 40Ar at a concentration of 0.00934 (0.934 mol%), the concentration of 40Ar within the gas sample is determined as:
CAr40 = (130/760) x 0.934 %mol = 0.16%mol
Consequently, the concentration of the target element can be calculated as:
which can be explicitly determined from the measured value of I#. This estimation of non-condensable gas concentration remains valid provided that the operational parameters fall within the linear detection range of the mass spectrometer.
2.5.3. Qualitative Verification of 17O Components in Water Samples via NMR and CRDS
The 17O isotope can be detected and characterized utilizing 17O Nuclear Magnetic Resonance (NMR) spectroscopy. To ensure cross-institutional validation and scientific rigor, the water samples in this study were submitted to three independent research facilities for analysis using three distinct 17O -NMR spectrometers:
- National Taiwan University: Employed a Bruker AVIII HD 400 MHz spectrometer (A525, operating at 54.2 MHz) and a Bruker AVIII 400 MHz spectrometer (B662, operating at 54.2MHz).
- National Central University: Employed a Bruker AVIII HD 600 MHz spectrometer (operating at 81.37 MHz), conducted both with and without an inner tube configuration.
- Rewave Tech Co (Bruker BioSpin), Ltd.: Employed a Bruker AVIII HD 400 MHz NMR spectrometer.
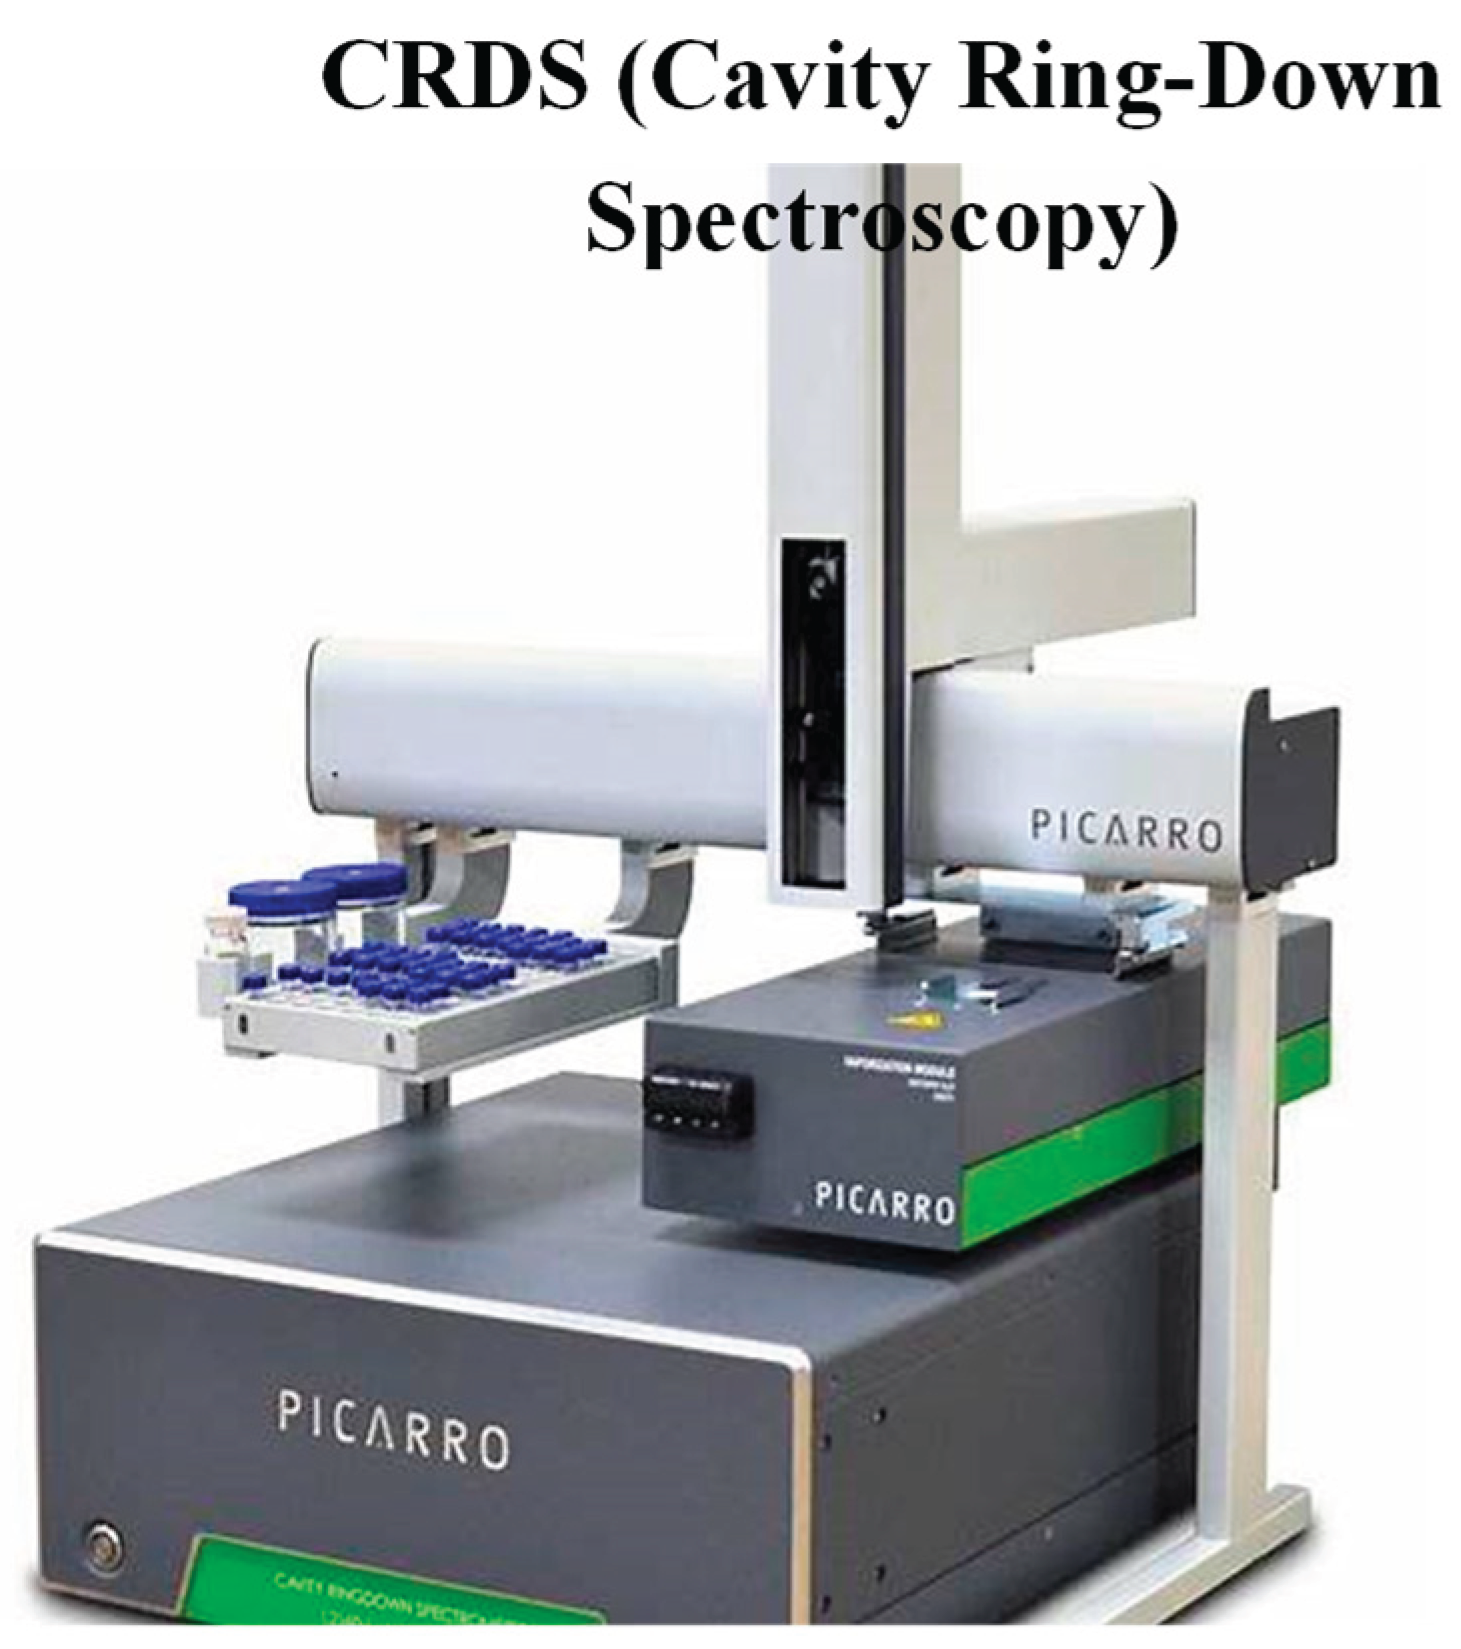
Furthermore, isotopic verification was conducted using a Cavity Ring-Down Spectrometer (CRDS; Picarro L2140-i isotope analyzer) located at National Chung Hsing University, as structurally illustrated in Fig. 6.
Figure 5.
Verification of 17O isotopes using different NMR spectrometers.
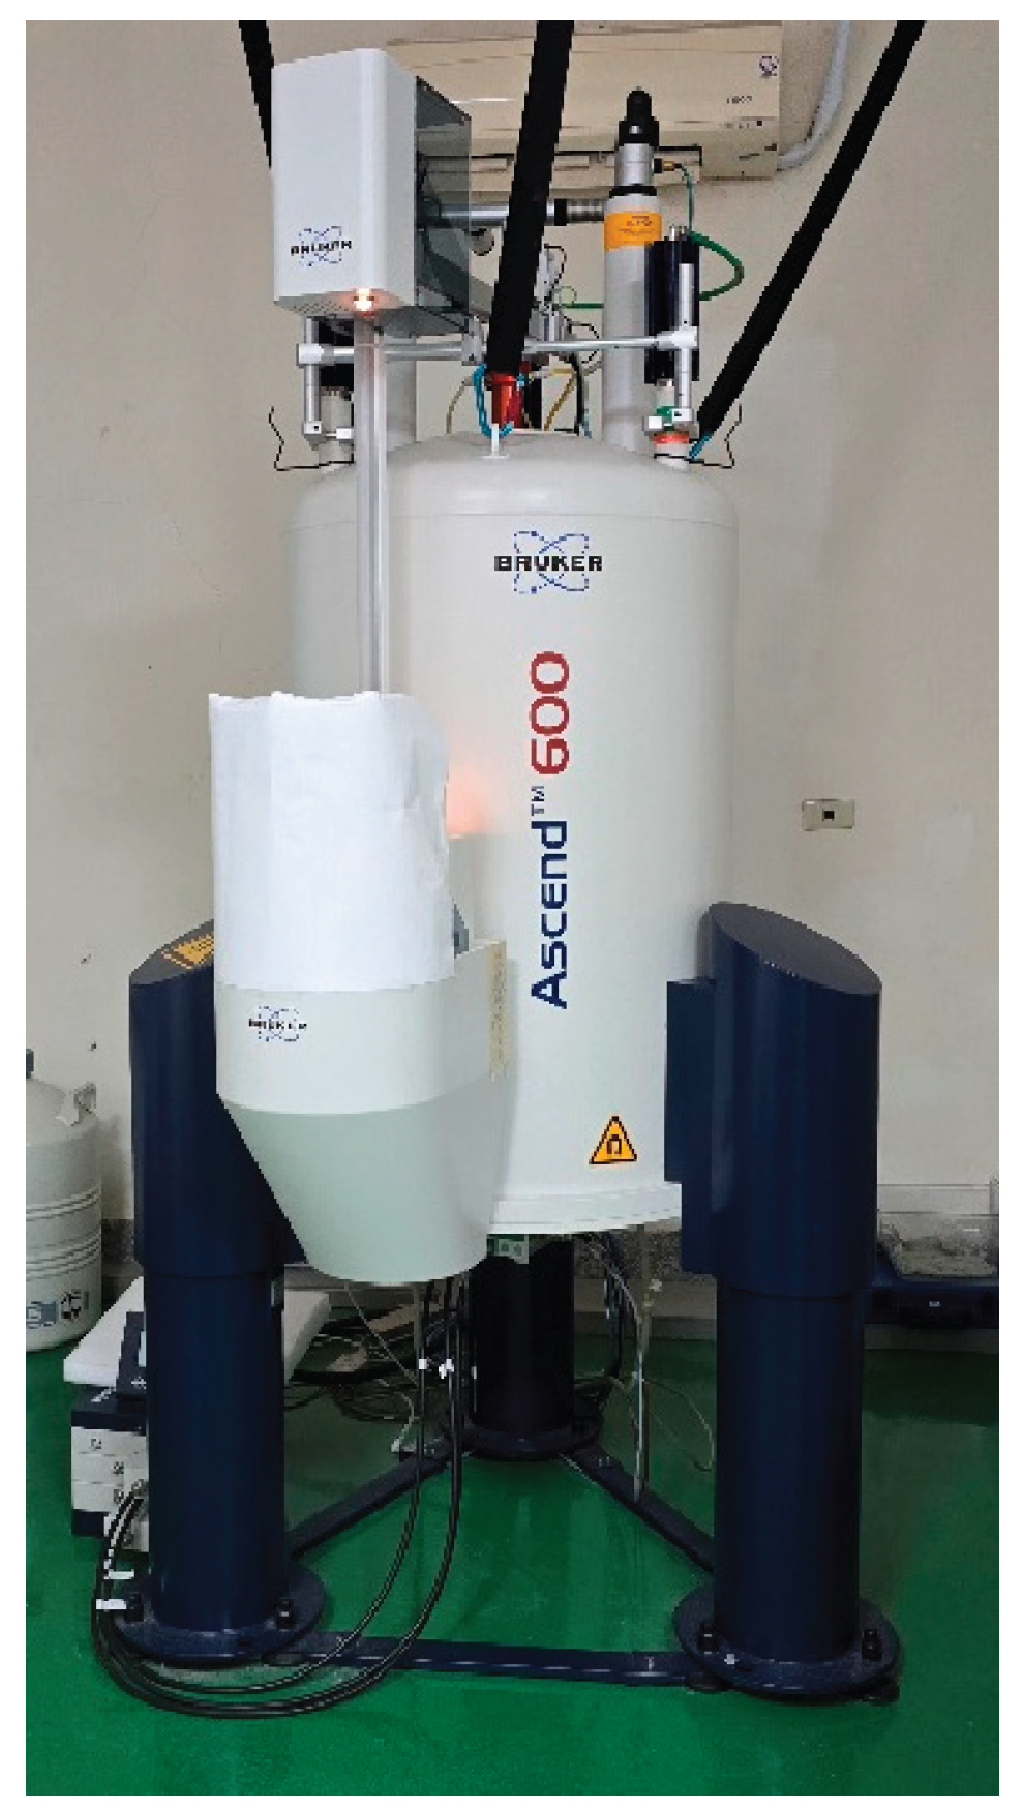
Figure 6.
Isotopic product verification via CRDS: 17O,18O,D.
2.6. Enrichment and Mass Production of 17O-Enriched Water
By incorporating a storage tank (capacity V) and a circulation pump into the LENR reaction configuration from Figure 2, a closed circulation system was constructed to continuously manufacture 17O water (Figure 7). The accumulation of H217O content in the water volume V after each circulation loop can be determined via Equation (6), derived from Equation (2):
Figure 8 shows the concentration as a function of circulation cycles at LL198 = 1.6 (DEX-1Aa). With a 20 L batch size, reaching 20 mol% takes about 5 days (120 hrs).
3. Results
3.1. Replication and Verification of LENR
Eleven distinct LENR reactors were designed and fabricated for the experiments. Water samples were collected both before and after the reactor treatments, and the samples were subsequently gathered according to the gas collection process illustrated in Figure 3. These gas samples were then subjected to Mass Spectrometry (MS) analysis to qualitatively determine and compare the composition of the reaction products. The results summarized in Table 1 reveal several noteworthy phenomena:
1. Excess 22Ne consistently co-occurs with four 12C-containing compounds and five 17O-containing compounds, aligning with the conjectured nuclear reactions proposed in [12].
2. For the two 17O-containing CO2 isotopologues, the MS index consistently follows the trend of LL45 > LL46, with the exception of reactors No. 10 and No. 11. This implies that the generation of a mono-substituted 17O species in CO2 via LENR is energetically more favorable than that of a di-substituted species.
3. For the two 17O-containing O2 isotopologues, the MS index always exhibits LL33 > LL34, implying that the generation of a mono-substituted 17O species in O2 via LENR is more favorable.
These results demonstrate the reproducibility of LENR, laying the foundation for the mass production of 17O-enriched water.
3.2. Quantitative Verification of Product Concentrations via MS Analysis
By analyzing the MS data using Equations (3)–(5), the concentrations of the reaction products can be estimated, as summarized in Table 2.
- 18O is produced in the form of six distinct isotopic gases, which are dissolved in the water.
- Among these isotopes, the species with the highest concentration is 17O17O (0.016 mol%), which represents pure isotopic oxygen.
3.3. Qualitative Verification of 17O in Water Samples via NMR Spectroscopy
The liquid water products collected from three reactors (DEX-1, DEX-1Aa, and VCS-5RT) operated under varied conditions were analyzed utilizing three distinct 17O-NMR spectrometers across three independent organizations, and the findings were compared with the MS data. As summarized in Table 3, the results demonstrate high consistency among the different methods. This cross-verification robustly substantiates the MS findings, further confirming that excess 17O is generated within the reactor via LENR.
3.4. Isotopic Composition Analysis of Water Samples via CRDS
The third analytical technique employed for isotopic identification of the LENR products was cavity ring-down spectroscopy (CRDS). The , , and values in the Tube116 and 190r1 samples reveal a significant enrichment of 1718 and 2H/1H ratios relative to the background (unreacted) water. Conversely, sample 185r12 exhibits enrichment exclusively in 17O/16O and 18O/16O. Notably, as summarized in Table 4, these results demonstrate not only the expected synthesis of the 17O isotope but also provide the first reports of anomalous 18O and HDO enrichment in this system.
3.5. Mass production of 17O-enriched water
The LENR closed-loop circulation system configuration based on the DEX-1G reactor, as illustrated in Figure 7, was employed for the production of 17O-enriched water. For a batch volume (V) of 32 L, the incremental increase in H217O content per cycle can be calculated using Equation (6). Continuous operation of the DEX-1G system for 290 hours (12 days) yielded 32 L of 17O-enriched water with a concentration of 30 mol%, corresponding to an average daily production rate of 2.6 L. Furthermore, extending the operation to 480 hours (20 days) enables the synthesis of 7O-enriched water with a concentration of 50 mol%, as demonstrated in Figure 9.
3.6. Determination of 17O-Enriched Water Concentration via 17O-NMR Spectroscopy
The natural abundance of 17O in natural water is 0.0375 mol%. Because the 17O concentrations produced in this study exceed 5 mol% (more than 133 times the natural abundance), the precise determination of such high 17O-enriched water concentrations is exceptionally challenging. To meet the quality control requirements for mass production, a dilution method was developed in this study to estimate the 17O concentration. By analyzing the 17O-NMR signals across various dilution factors (di), the dilution factor (diBG) at which the 17O-NMR signal becomes identical to that of the background water (unreacted reverse osmosis [RO] water) can be identified. This specific dilution factor closely correlates with the concentration of the undiluted stock solution (Cx), which is expressed as follows:
Cx = diBG x 0.0375 mol% (natural abundance)
Figure 10 presents the measured concentration of sample #190r1 (2.1 mol%).
Figure 11 presents the concentration determination results for sample #185r12 (30 mol%). Notably, sample #185r12 was obtained using the DEX-1Aa reactor with a water volume of 32 L, an operating temperature of 120oC, and a flow rate of 80 LPH across 485 continuous cycles (each cycle consisting of 40 minutes on and 60 minutes off). A high 17O concentration of 30 mol% was achieved. Furthermore, this sample was analyzed after being stored at room temperature for nearly a year (10 months), demonstrating the excellent long-term stability of the water sample.
3.7. Size Distribution Analysis of Bulk Nanobubbles in 17O-Enriched Water
The 17O-enriched water produced directly from the reactor is a liquid outflux that rapidly reaches a state of thermodynamic equilibrium with the bulk H216O water matrix. Notably, bubble evolution was observed during the LENR process. Nanoparticle tracking analysis (NanoSight) of sample #185r12 revealed a mean bubble diameter of 243 nm and a bubble density of 9.33 x 10⁶ particles/mL (Figure 12). Following distillation of sample #185r12, the mean bubble diameter shrank to 119 nm, whereas the bubble density increased to 2.83 x 10⁷ particles/mL (Figure 13). These nanobubbles are primarily composed of 17O-containing compounds of non-condensable gases, such as O2 and CO2 (Table 2). Due to their nanoscale dimensions (Table 5), these bubbles remain highly stable within the aquatic matrix and resist conventional removal, thereby contributing to the long-term preservation stability of a portion of the 17O isotopes. Consequently, 17O-NMR characterization captures the superimposed sum of the 17O signals from both the gaseous bubble and liquid phases, making it impossible to resolve their individual concentrations. This remarkable stabilization mechanism aligns with the framework proposed by Takahashi et al. [15], who reported that bulk nanobubbles (BNBs) achieve exceptional multi-month stability in aqueous solutions via a "condensed ionic cloud" that induces local precipitation, forming a topologically rigid solid nanobubble shell. Therefore, the gaseous 17O components encapsulated within these nanobubbles are effectively preserved over extended periods, as validated by the long-term stability data of sample #185r12 presented in Figure 11.
3.8. MTT Assay Using 17O-Enriched Water
Quantum biology studies suggest that 17O may interfere with cancer cell metabolism [16,17,18]; however, experimental validation has been constrained by the scarcity of 17O. In this study, an in vitro MTT assay was conducted on cancer cells using the mass-produced 17O-enriched water.
A preliminary result from a cancer cell experiment (MTT) using 6 cells which shows that even low-dose 17O-enriched water (0.35 %mol -Tube116) can alter metabolic activity in NG108 and B16F10 Cancer Cells as shown in Figure 14 [14]. NG108 cells consistently showed stable mild metabolic inhibition after treatment with 0.35% H217O. For B16F10, mild cell activation was consistently observed. This may be caused by overclocking phenomenon [16,17] whose possible reaction curve can be like Figure 15.
Based on the preliminary MTT assay results, this study demonstrates that the low-cost, low-concentration 17O-enriched water can interfere with the metabolic activity of cancer cells.
4. Discussions
In this study, experiments utilizing 11 independent reactor sets successfully demonstrated the reproducibility of water low-energy nuclear reactions (LENR) for the concurrent generation of excess energy and stable isotopes. By employing a multi-instrumental cross-verification strategy encompassing MS, NMR, and CRDS, the synthesized 17O was confirmed to be synchronously generated with excess energy, thereby mitigating the measurement artifacts inherent in previous single-MS methodologies [13].
To transition this phenomenon from laboratory discovery to scalable manufacturing, a closed batch-type internal circulation system equipped with a storage tank and circulation pump was successfully engineered. This system achieves flexible concentration control over the produced 17O-enriched water by modulating the circulation runtime. Specifically, the 32-L system benchmark established a high yield of 30 mol% 17O-enriched water within 290 hours. Furthermore, to address the profound analytical challenges of quantifying such highly concentrated isotope samples, an innovative NMR-based dilution method was implemented, delivering precise determination.
Physiochemically, the reactor-yielded liquid H217O spontaneously reaches a thermodynamic equilibrium state with regular H216O water. Intriguingly, the LENR process also generates ultra-stable, bulk nanobubbles with an average diameter of approximately 200 nm and a concentration profile of 9.33 x 10⁶ particles/mL. These nanoscale bubbles are predominantly composed of non-condensable gases (specifically 17O-labeled O2 and CO2 complexes). Owing to their miniature dimensions and colloidal stability, these persistent bubbles resist standard physical removal, significantly promoting the long-term structural and isotope preservation stability of the H217O system. Although 17O-NMR measurements evaluate the collective isotopic signals from both the liquid phase and encapsulated nanobubbles without individual distinction, the physiological efficacy remains pronounced. This 17O-enriched matrix, featuring dense 200-nm nanobubbles, experiences minimal resistance when traversing cellular aquaporins (AQPs). Such heightened permeability facilitates effortless intracellular migration into the cell nucleus, stimulating critical metabolic pathways, advanced hydration, and internal detoxification in normal cells. Concurrently, the unique nuclear spin (I = 5/2) magnetic moment of 17O is postulated to actuate the magnetic isotope effect (MIE) within key enzymatic cascades [16,17].
Utilizing the mass production of 17O-enriched water, a preliminary MTT assay was performed on malignant cell lines. The resulting profiles verified that 17O effectively interferes with cancer cell metabolism. This crucial milestone provides a foundational reference for downstream translational medicine, validating that our cost-effective, high-throughput LENR platform will drastically accelerate the implementation of 17O-enriched water in subsequent therapeutic, oncology, and advanced healthcare frameworks.
5. Conclusion
This research conclusively validated the reproducibility of water LENR for isotope and thermal energy generation across 11 reactors. Through rigorous cross-examination using MS, NMR, and CRDS, the synchronous synthesis of 17O alongside excess energy release was verified, resolving the single-MS analytical biases reported in historical literature [13]. The liquid effluent exists as a H217O matrix in thermodynamic equilibrium with standard H216O water, further characterized by persistent bulk nanobubbles containing non-condensable 17O gas compounds (O2 and CO2). These highly degradation-resistant nanobubbles ensure reliable long-term isotope preservation. Ultimately, as an exceptionally economical and scalable byproduct of LENR, this specialized 17O-enriched water opens up pioneering and highly accessible pathways for innovative medical applications, cellular metabolic regulation, and clinical oncological research.
Author Contributions
M.Y.L.: investigation, NMR data preparation, validation, data analysis. S.L.C.: project administration, resources, supervision. L.X.: conceptualization, methodology. Y.H.P.: investigation, data preparation, NMR validation, data analysis. X.Y.W.: investigation, data preparation, validation, data analysis. P.H.W: data preparation, validation, data analysis. J.F.Y.: conceptualization, methodology, investigation, project administration, supervision. Y.Y.H.: project administration, supervision. K.C.L.: supervision, validation. Y.T.C.: supervision, validation. T.R.T.: supervision, validation, MS data analysis. F.W.K.: supervision, validation, MS data analysis. T.F.T.: supervision , validation, MS data analysis. B.J.H.: conceptualization, methodology, investigation, project administration, supervision, resources, validation, data analysis, writing—original draft, funding acquisition. All authors have read and agreed to the published version of the manuscript.
Funding
This research work was supported by National Taiwan Normal University, National Taiwan University, National Tsing Hua University, ATD Inc., Mastek Technologies, Inc., Taiwan.
Data Availability Statement
Data will be made available on request.
Acknowledgments
The authors extend their appreciation to the researchers supporting this study.
Conflicts of Interest
The authors declare no conflicts of interest.
References
- Fleischmann, Martin; Pons, Stanley. Electrochemically induced nuclear fusion of deuterium, Journal of Electroanalytical Chemistry and Interfacial Electrochemistry 1989, 261(2), Part 1, 301-308. https://www.sciencedirect.com/science/article/pii/0022072889800063. [CrossRef]
- Jones, S.; Palmer, E.; Czirr, J. et al. Observation of cold nuclear fusion in condensed matter. Nature 1989, 338, 737–740 (1989). [CrossRef]
- Matsumoto, Takaaki. Cold Fusion Observed with Ordinary Water. Fusion Technology, 1990, 17(3), 490–492. [CrossRef]
- Notoya, R.; & Noninski, V. C. Excess heat during the electrolysis of a light water solution of K2CO3 with a nickel cathode. Fusion Technology 1992, 21(1), 163–167.
- Notoya, R. Cold Fusion by Electrolysis in a Light Water-Potassium Carbonate Solution with a Nickel Electrode. Fusion Technology 1993, 24, 202–204.
- Pinaev, A. V. (2005). The analyses of test data of cavitation heat-generator of TMK-25 type. In Proceedings of the 13th International Conference on Condensed Matter Nuclear Science (ICCF-13) (pp. 291–294). Sochi, Russia.
- Pavlovoch Torchigin. (2024). Nuclear Energy in Vortex Cavitation Generators. ResearchGate. https://www.researchgate.net/publication/383093910.
- Kanarev, Ph. M.; Mizuno, T. (2003). Cold fusion by plasma electrolysis of water. Retrieved from https://www.researchgate.net/publication/237276063.
- Ross, G.; Anwar, D.; Sedgwick, D.; Fustero, S. (2022). Experiments demonstrating the creation of elements via pulsed electric field in water and deuterated water: application to the production of fluorine. arXiv:2202.03744.
- Sundaresan R.; Bockris, J. O'm. Anomalous Reactions During Arcing Between Carbon Rods in Water. Fusion Technology 1994, 26, 261-265.
- Graneau, P.; Graneau, J.; Li, X. Renewable energy liberation by nonthermal intermolecular bond dissociation in water and ethanol. Journal of Applied Physics 2011, 109(3), 034908. [CrossRef]
- Huang, Bin-Juine et al. Excess energy from heat-exchange systems. J. Condens. Matter Nucl. Sci. 2022, 36, 247–265. [CrossRef]
- Huang, Bin-Juine et al. Water can trigger nuclear reaction to produce energy and isotope gases. Sci Rep. 2024, 14(1), 214. PMID: 38167629; PMCID: PMC10762109. [CrossRef]
- Huang, Bin-Juine; Liao, Mou-Yung; Pan, Yu-Hsiang et al. Replication of Low-Energy Nuclear Reaction in Water. The 26th International Conference on Condensed Matter Nuclear Science. 26-30 May, 2025, Morioka, Japan. https://www.researchgate.net/publication/392160175_Replication_of_Low-Energy_Nuclear_Reaction_in_Water.
- Takahashi, Masayoshi; Shirai, Yasuyuki; Sugawa, Shigetoshi. Free-Radical Generation from Bulk Nanobubbles in Aqueous Electrolyte Solutions: ESR Spin-Trap Observation of Microbubble-Treated Water. Langmuir 2021, 37, 5005−5011. [CrossRef]
- Buchachenko, Anatoly L.; Kuznetsov, Dmitry. Magnetic Control of the DNA Synthesis by Nuclear Magnetic Ions of Mg, Ca and Zn as a Powerful and Universal Means to Kill Cancer Cells. J Phys Chem Biophys 2018, 8(3): 1000272 (2018). [CrossRef]
- Koltover, Vitaly K. Magnetic isotope effects and nuclear spin catalysis in living cells and biomolecular motors: recent advances and future outlooks - Nuclear spin catalysis. Biophysical Reviews 2023, 15:999–1006. [CrossRef]
- Little, Reginald B. On the Atomic Carcinogenic Mechanism and Cure for Cancer: Ferrochemistry for Cause of Warburg Effect, 27 October 2022 , 1-185. [CrossRef]
Figure 1.
Schematic of the simplified LENR reactor.

Figure 2.
LENR system.
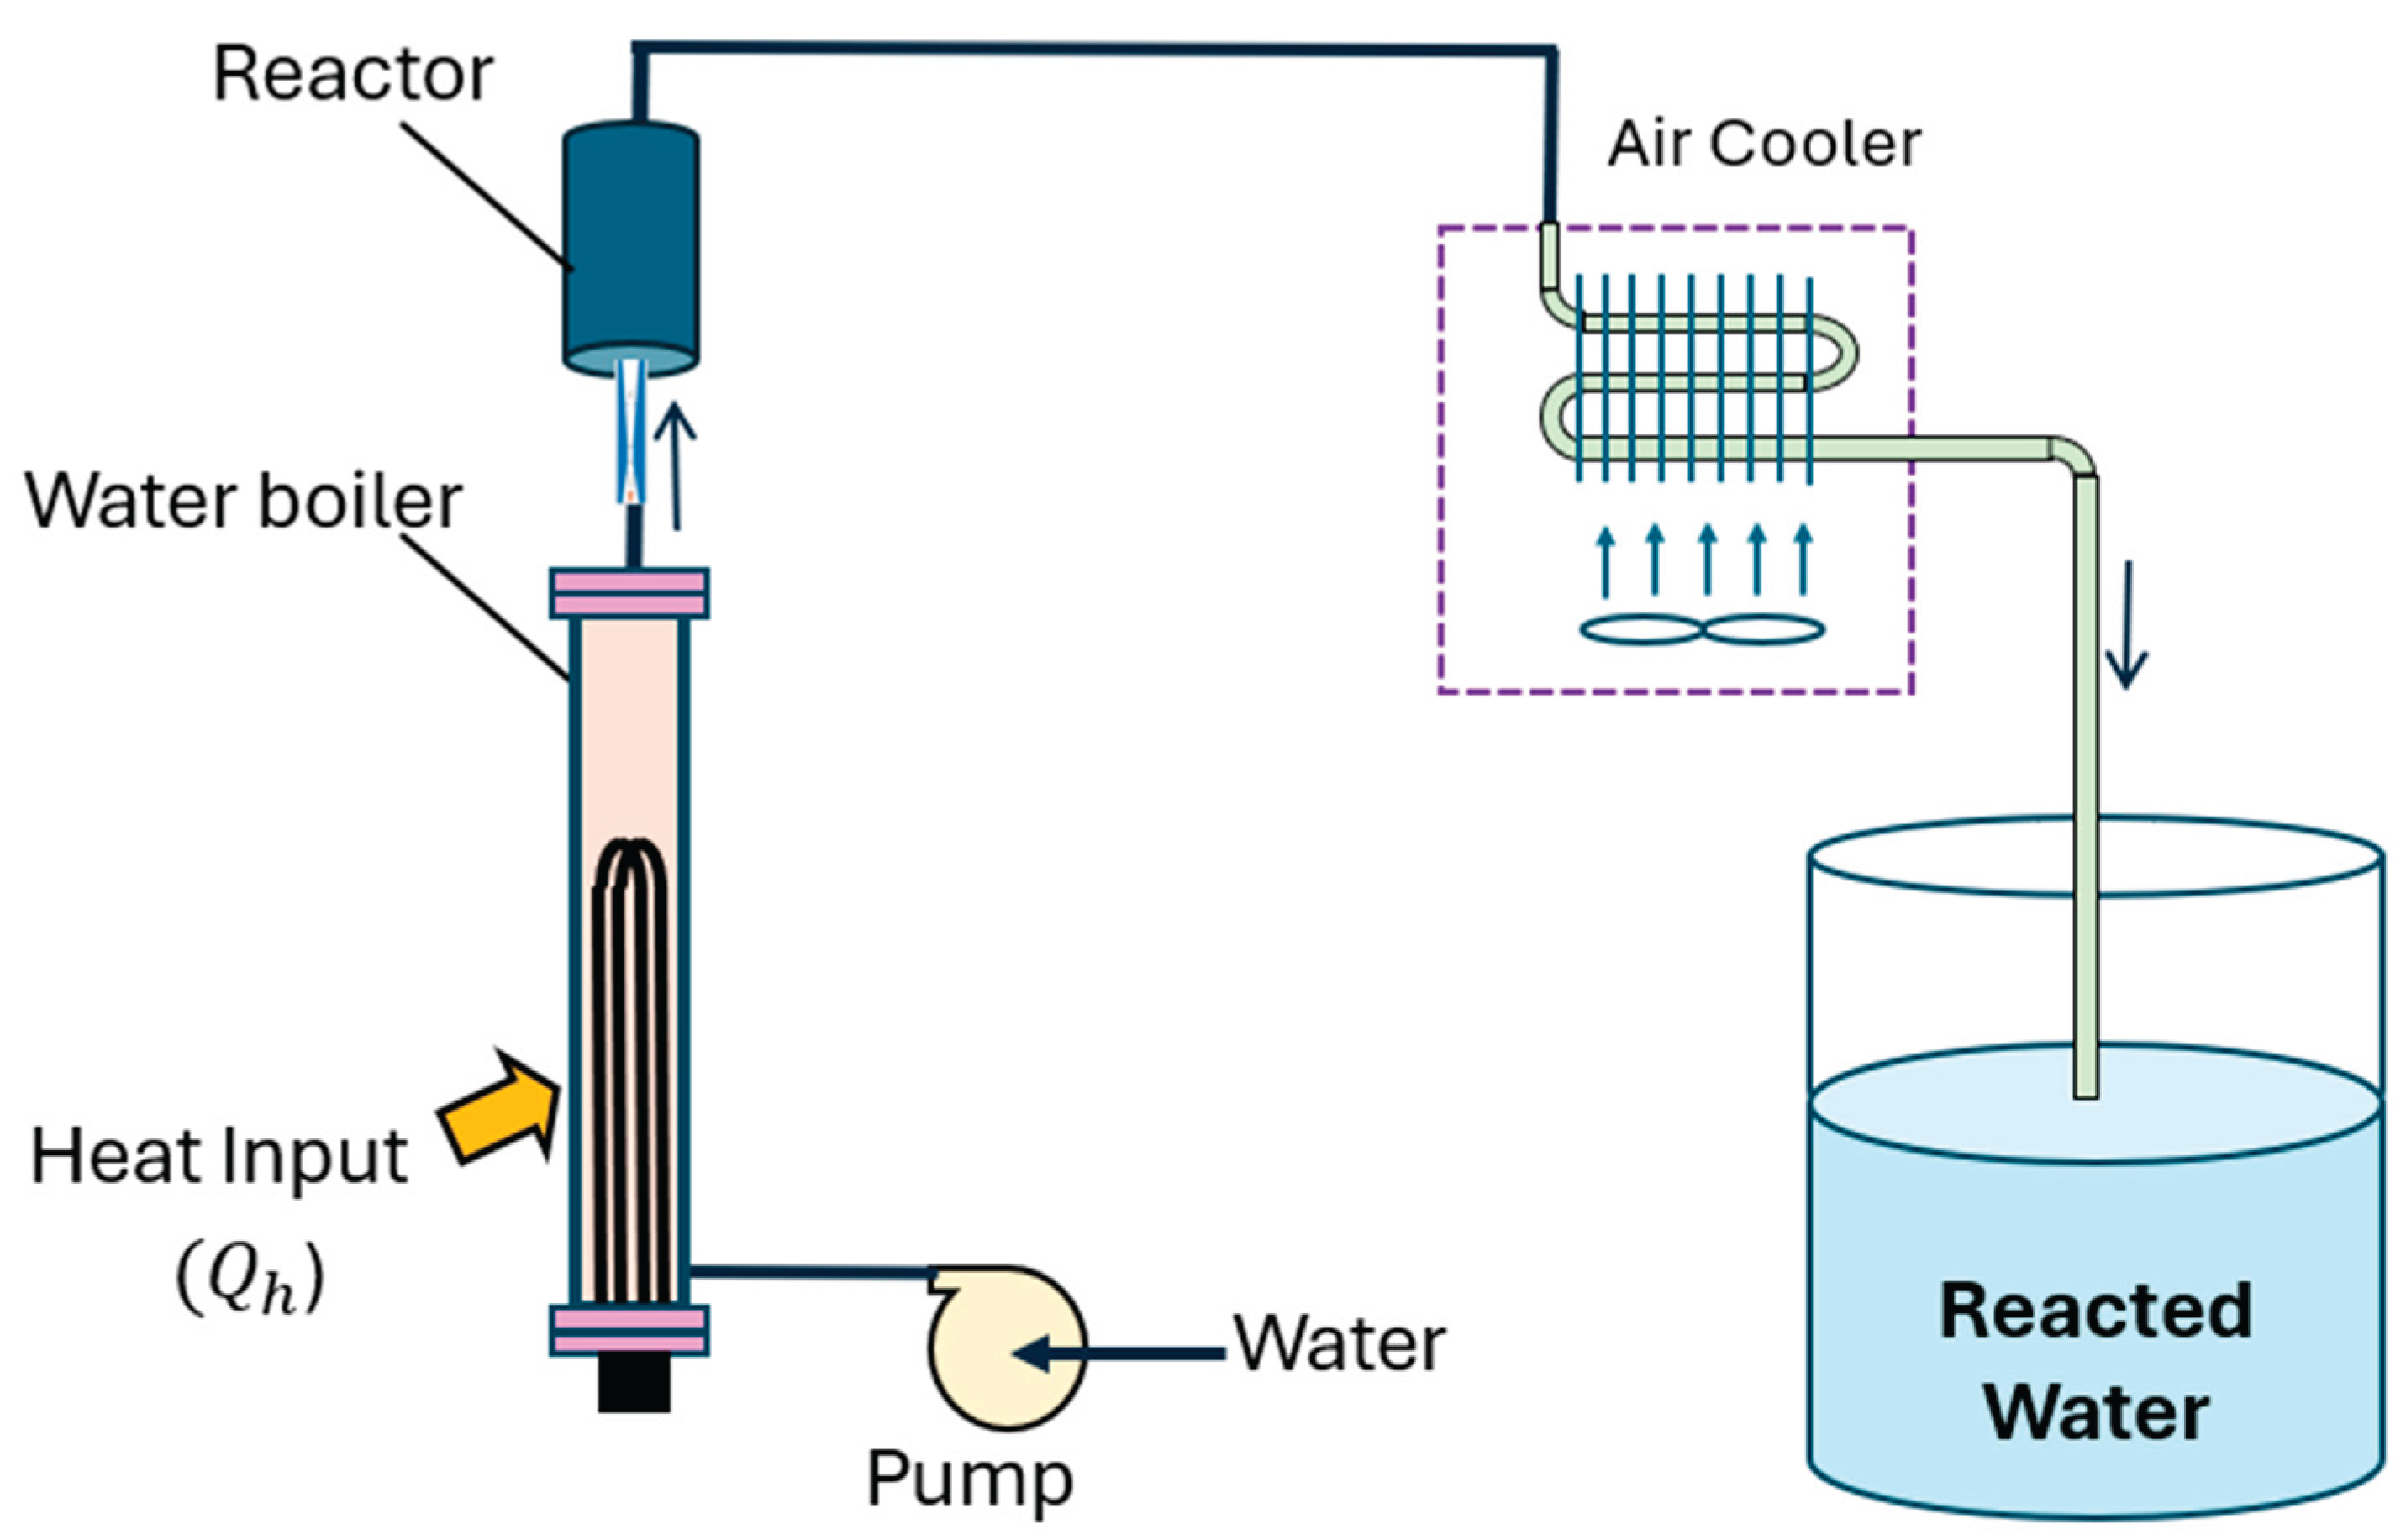
Figure 3.
Gas collection system configured for reaction water vapor analysis.
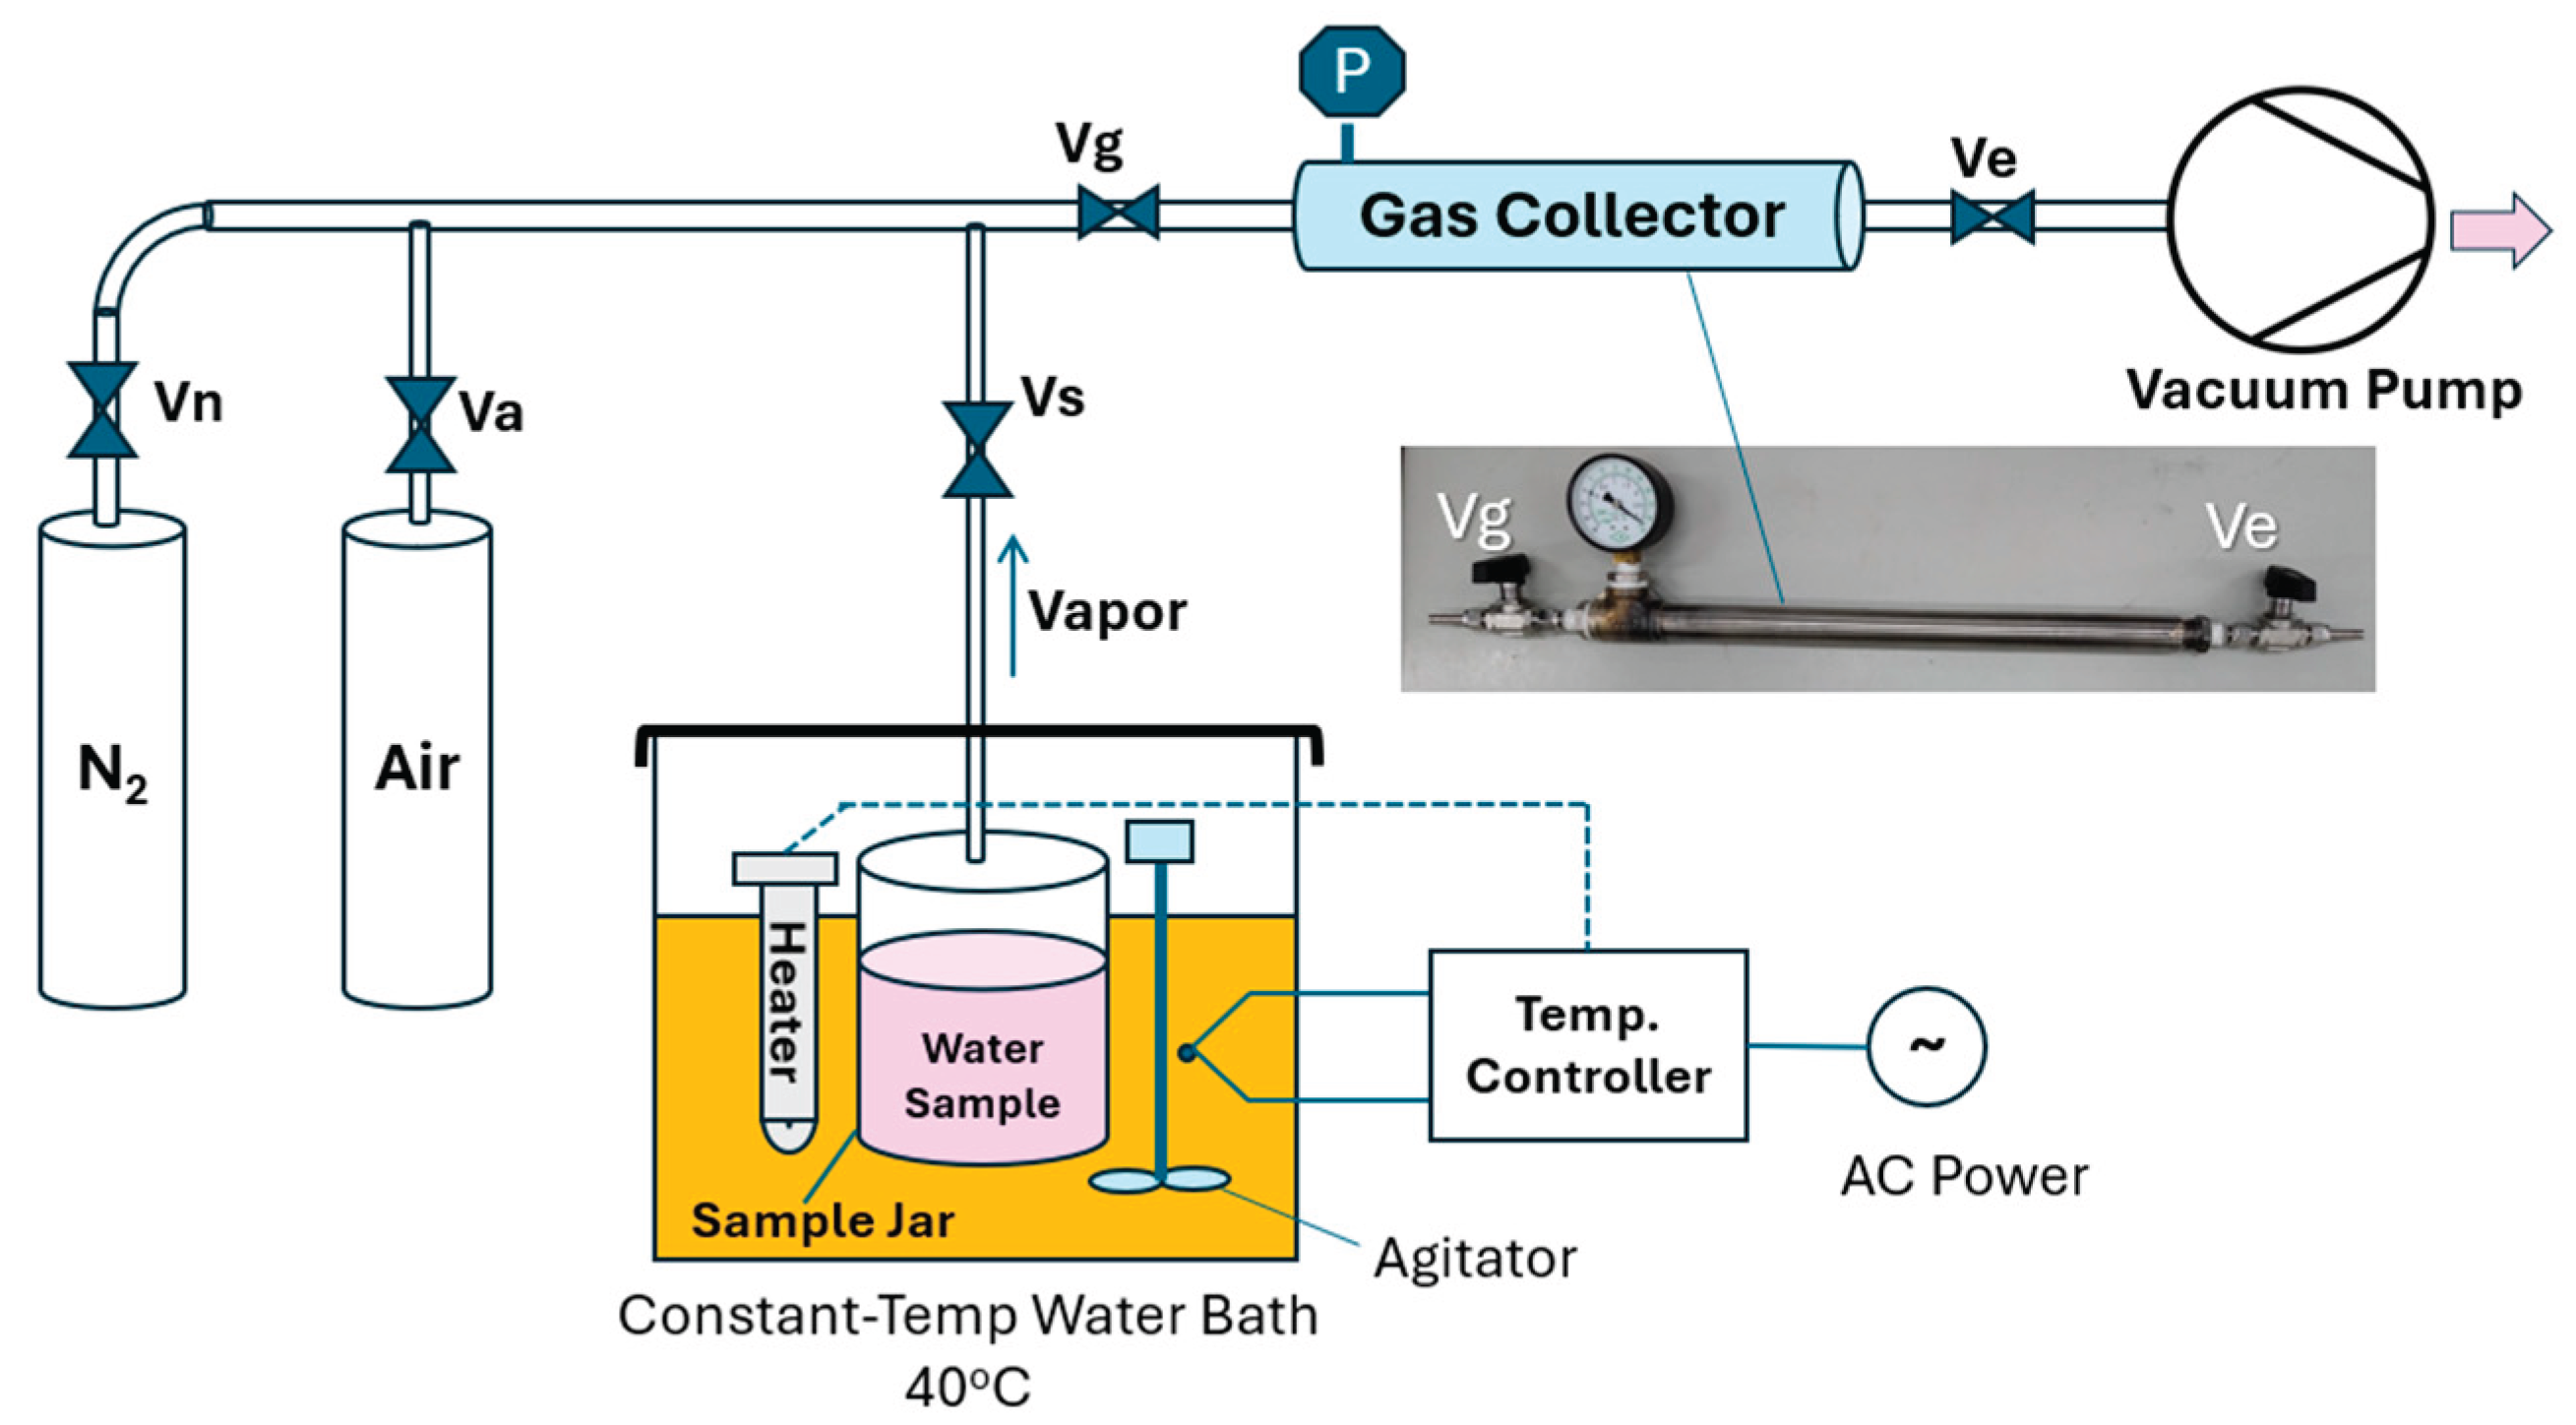
Figure 4.
Experimental setup showing the connection between the gas collector and the mass spectrometer (Extorr XT300M).
Figure 4.
Experimental setup showing the connection between the gas collector and the mass spectrometer (Extorr XT300M).
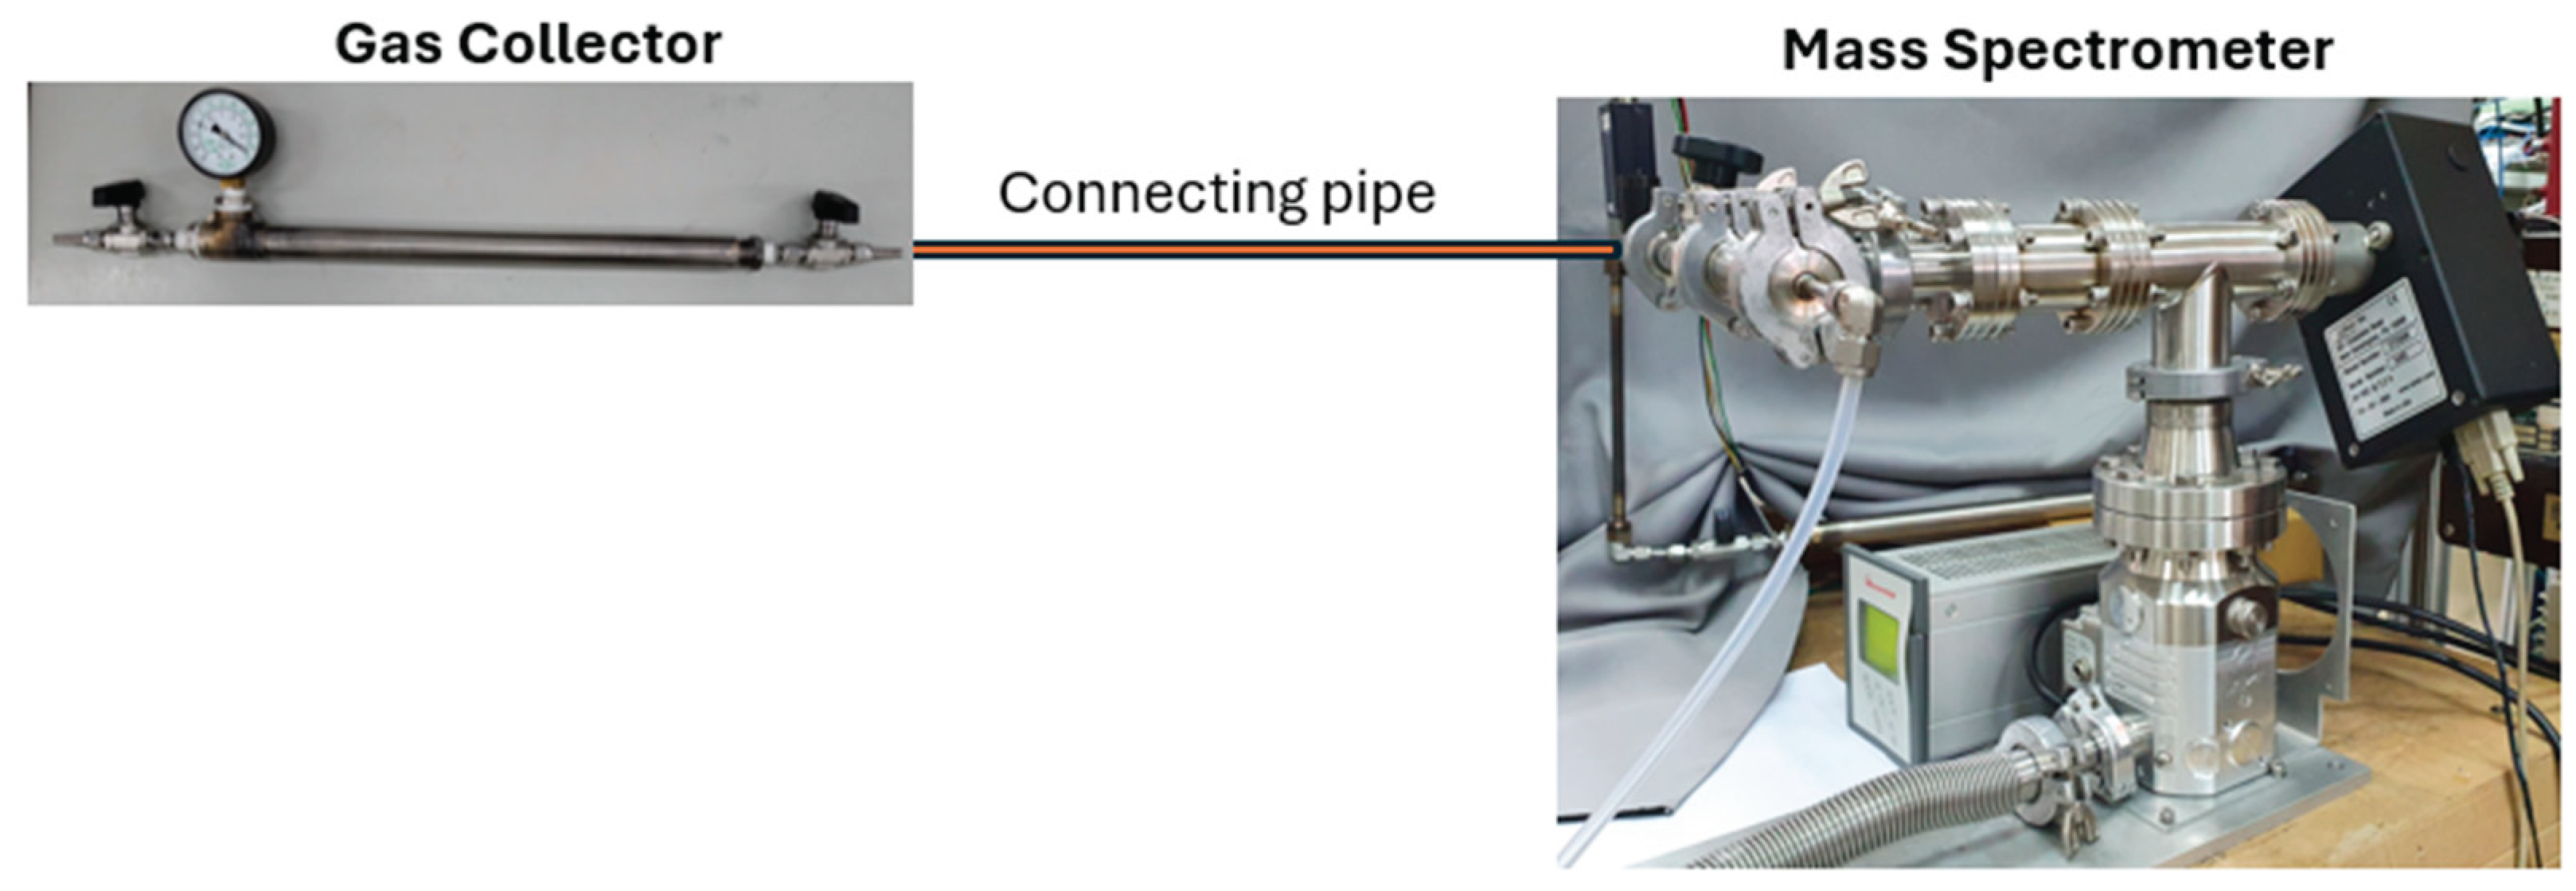
Figure 7.
Experimental setup for the continuous mass production of 17O-enriched water.
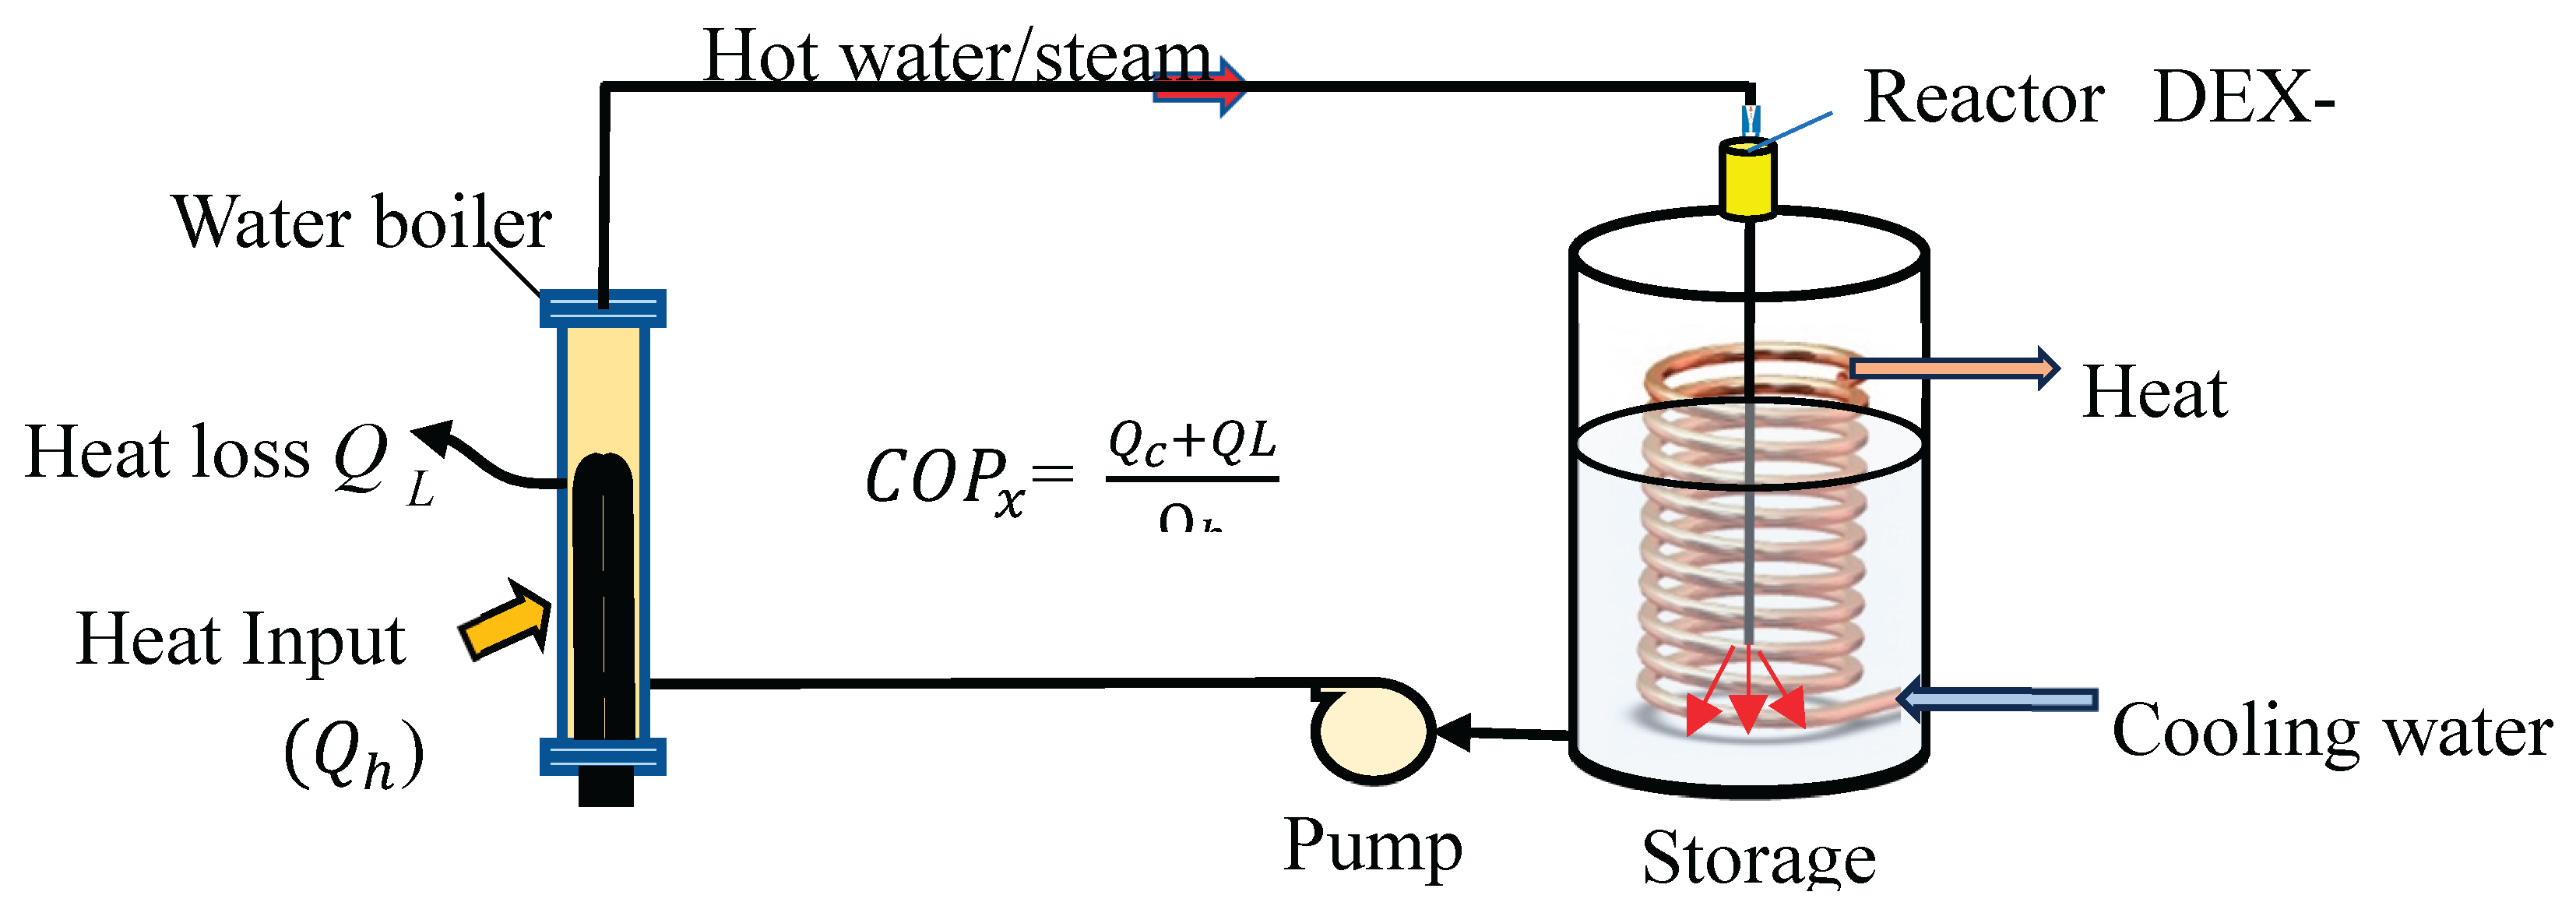
Figure 8.
Relationship between concentration and time in mass production.
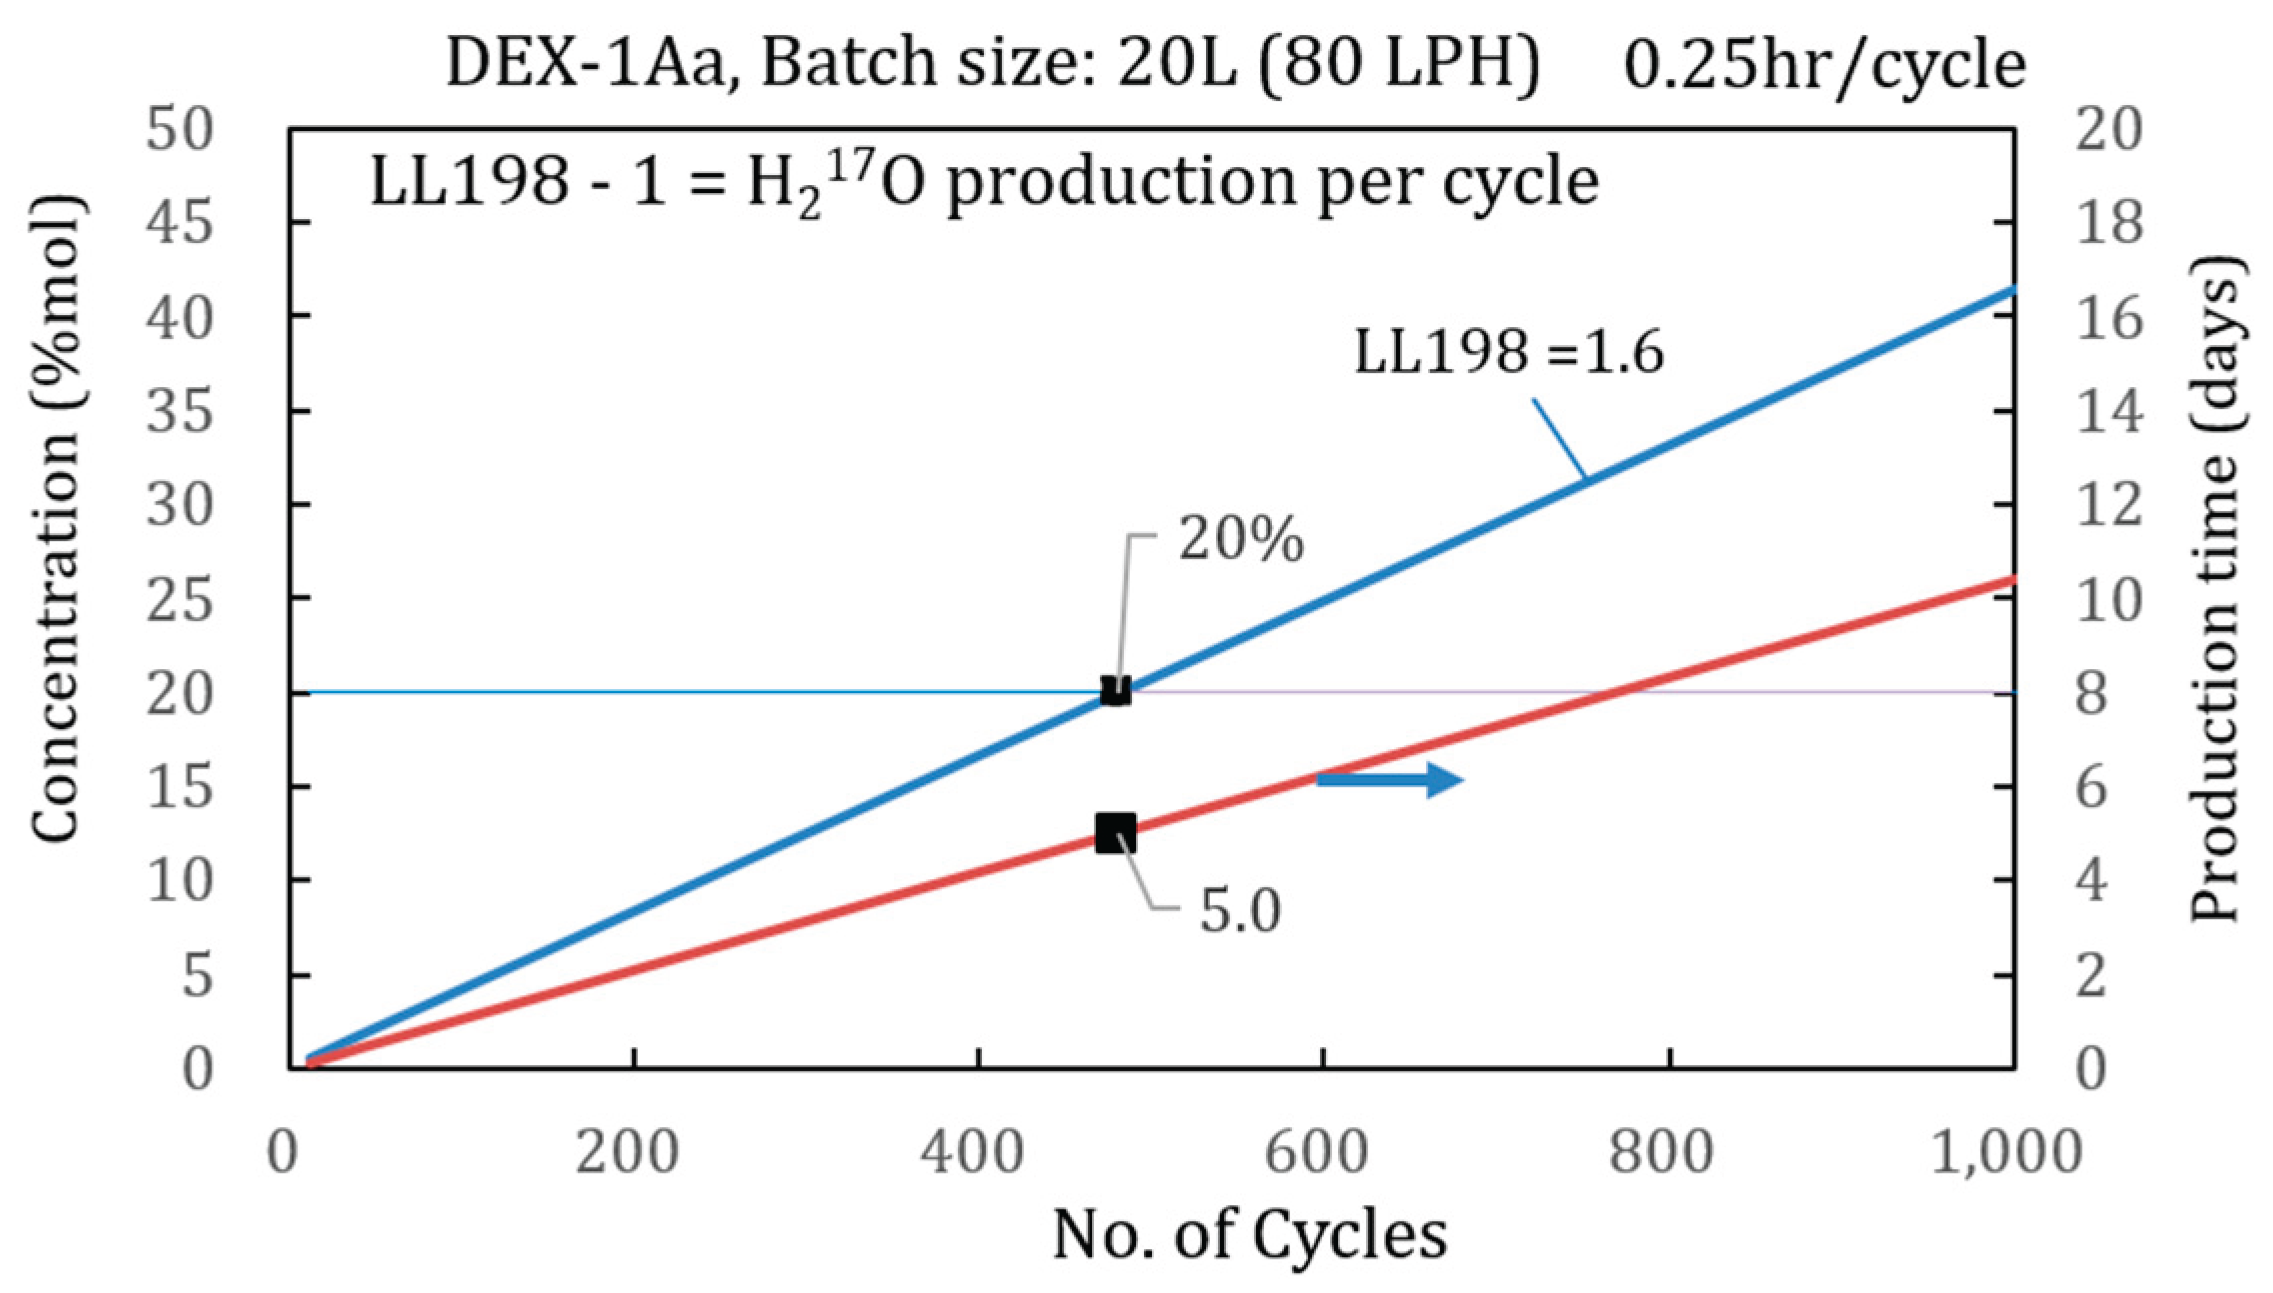
Figure 9.
Mass production curve of DEX-1G.
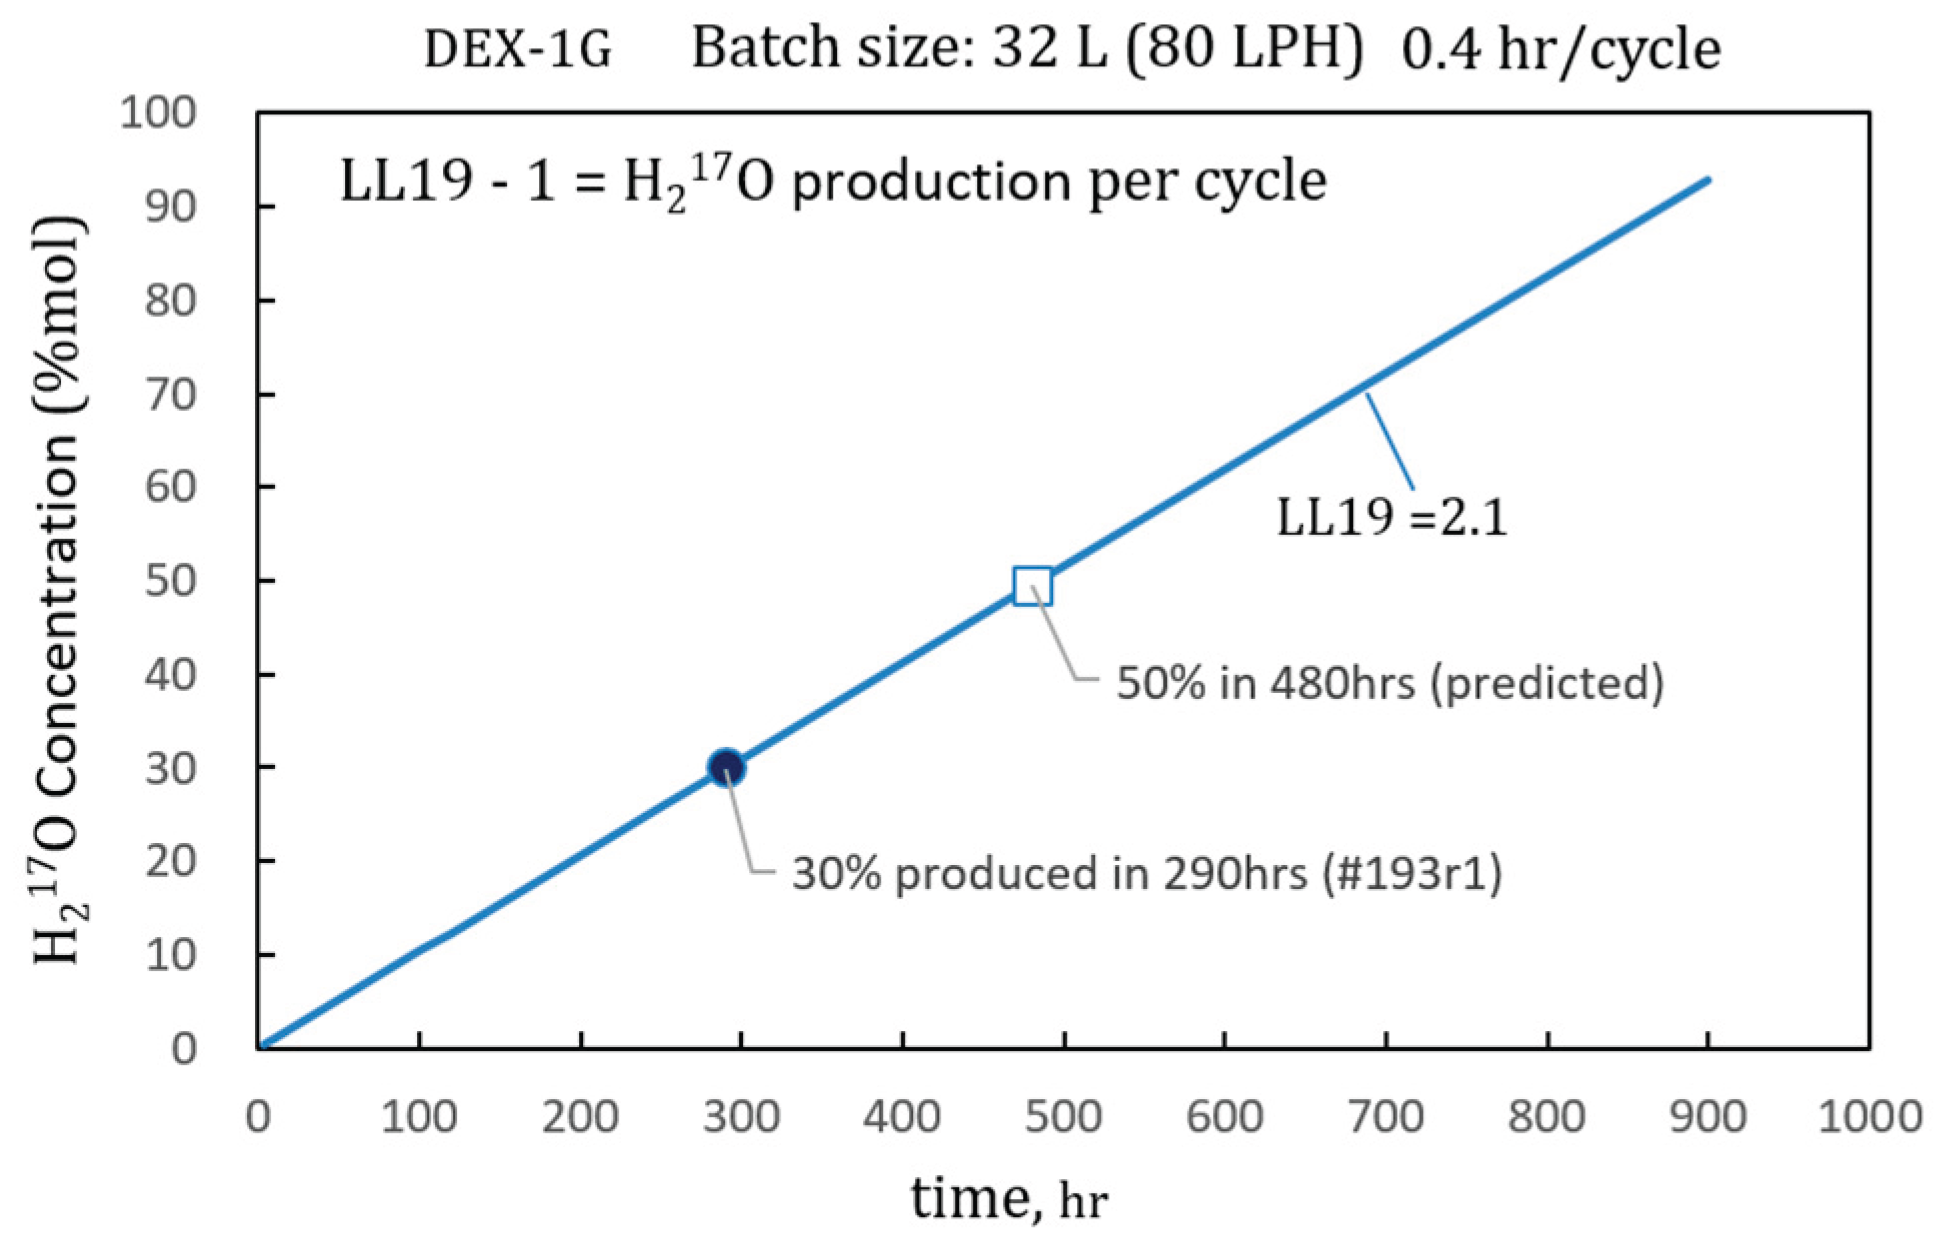
Figure 10.
17O concentration measurement of sample #190r1.
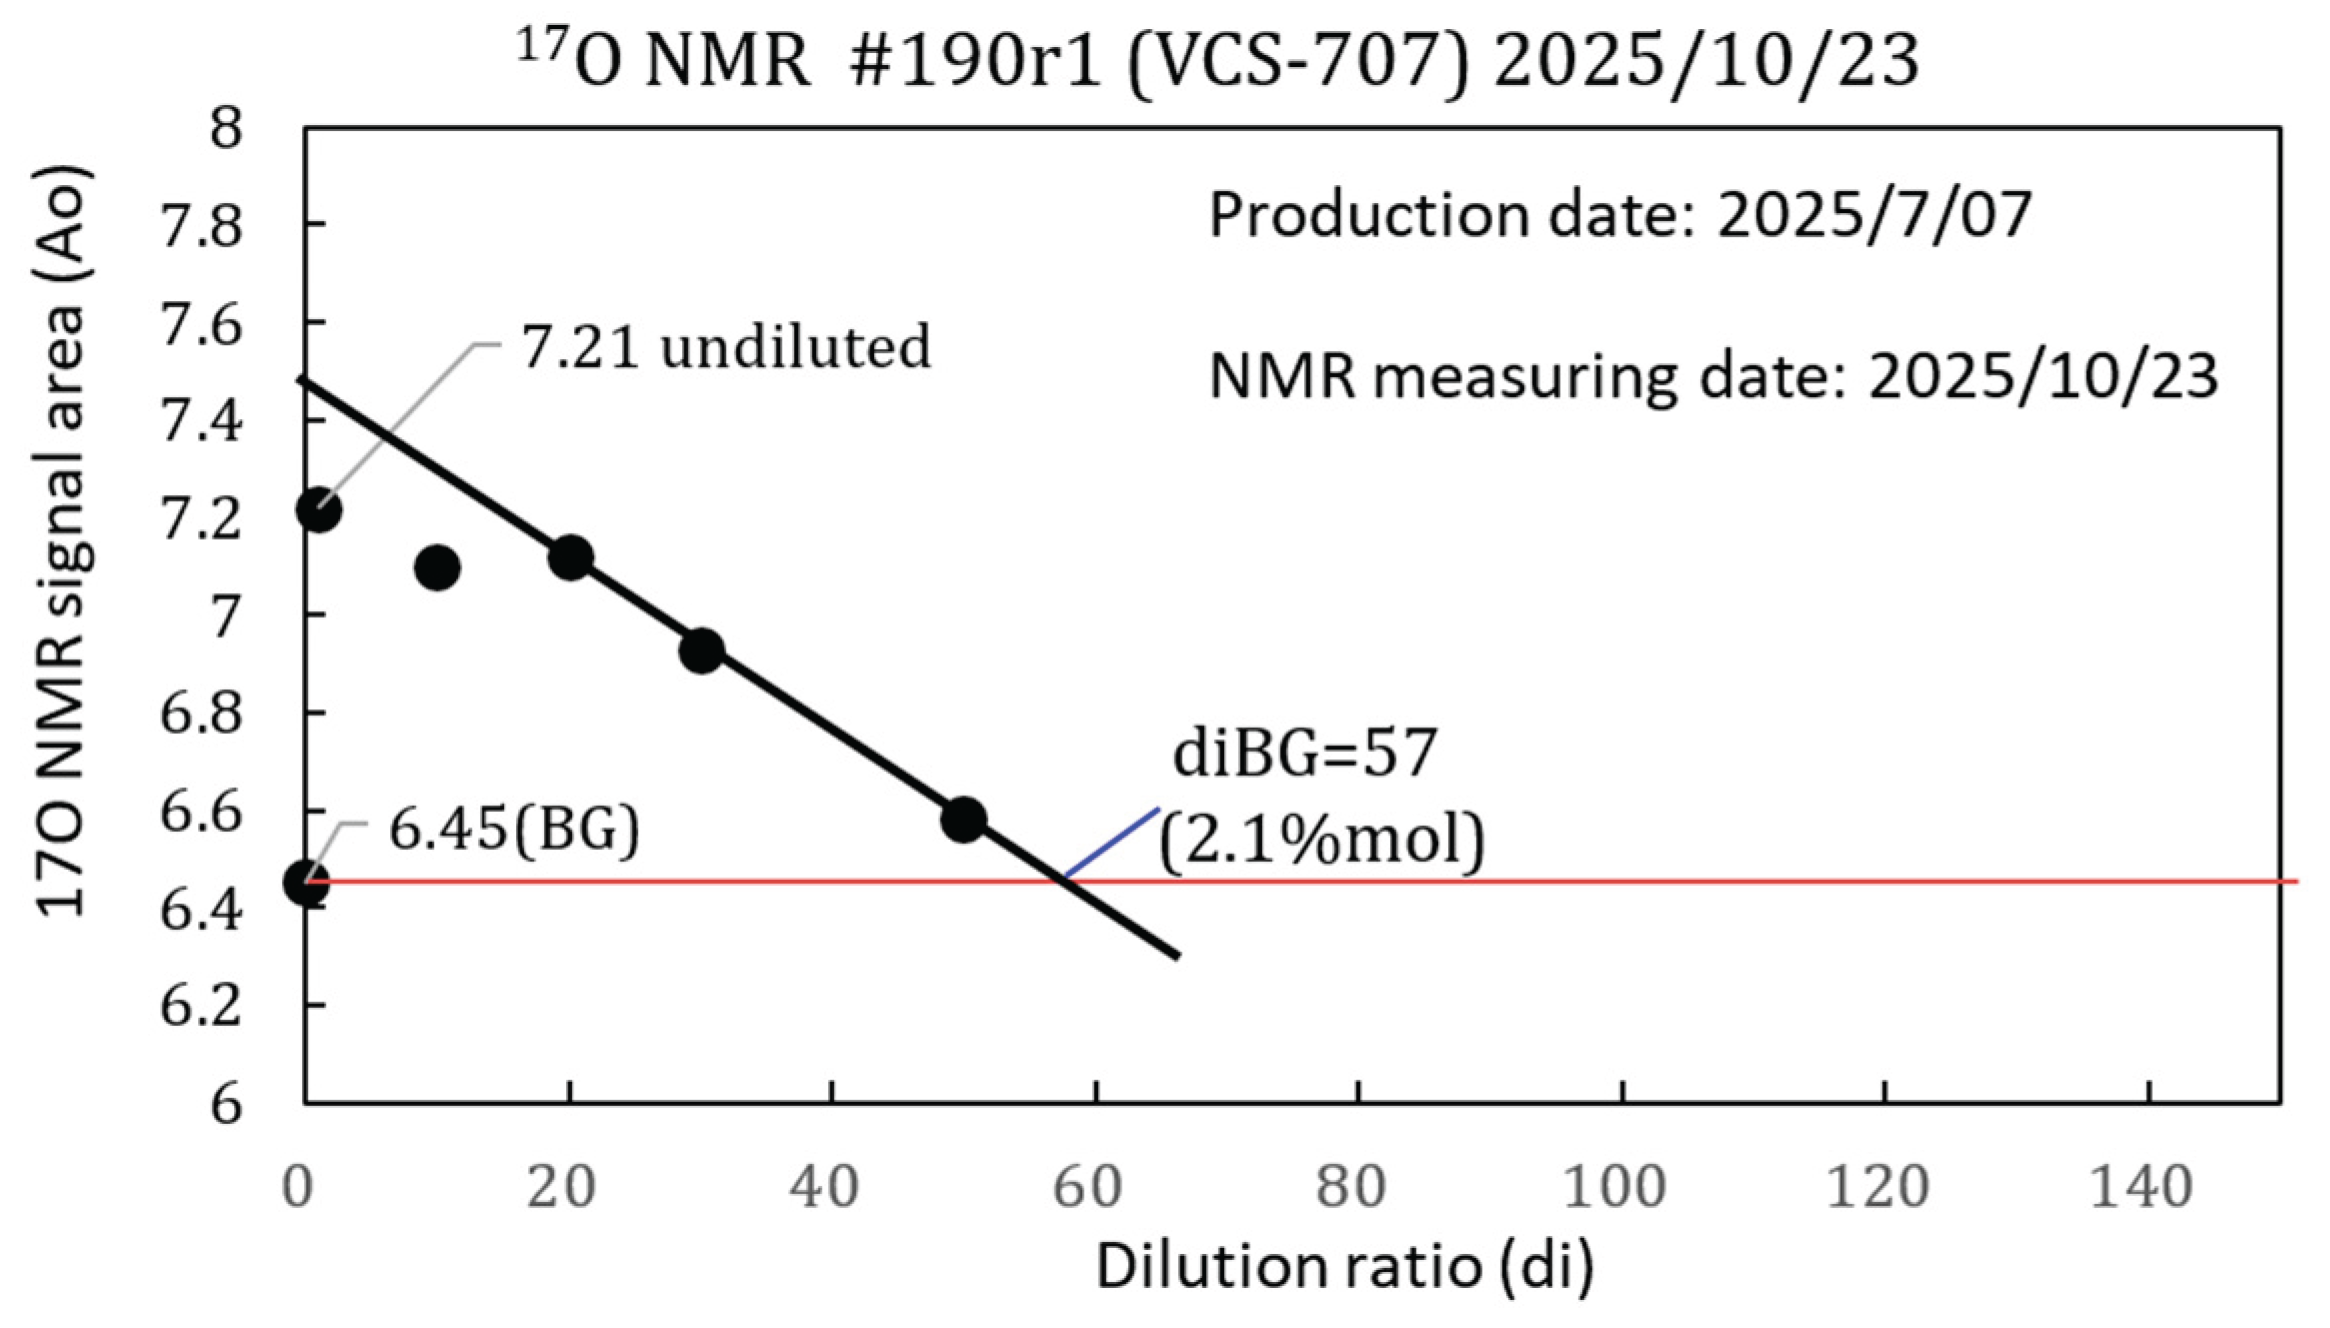
Figure 11.
17O concentration measurement of sample #185r12.
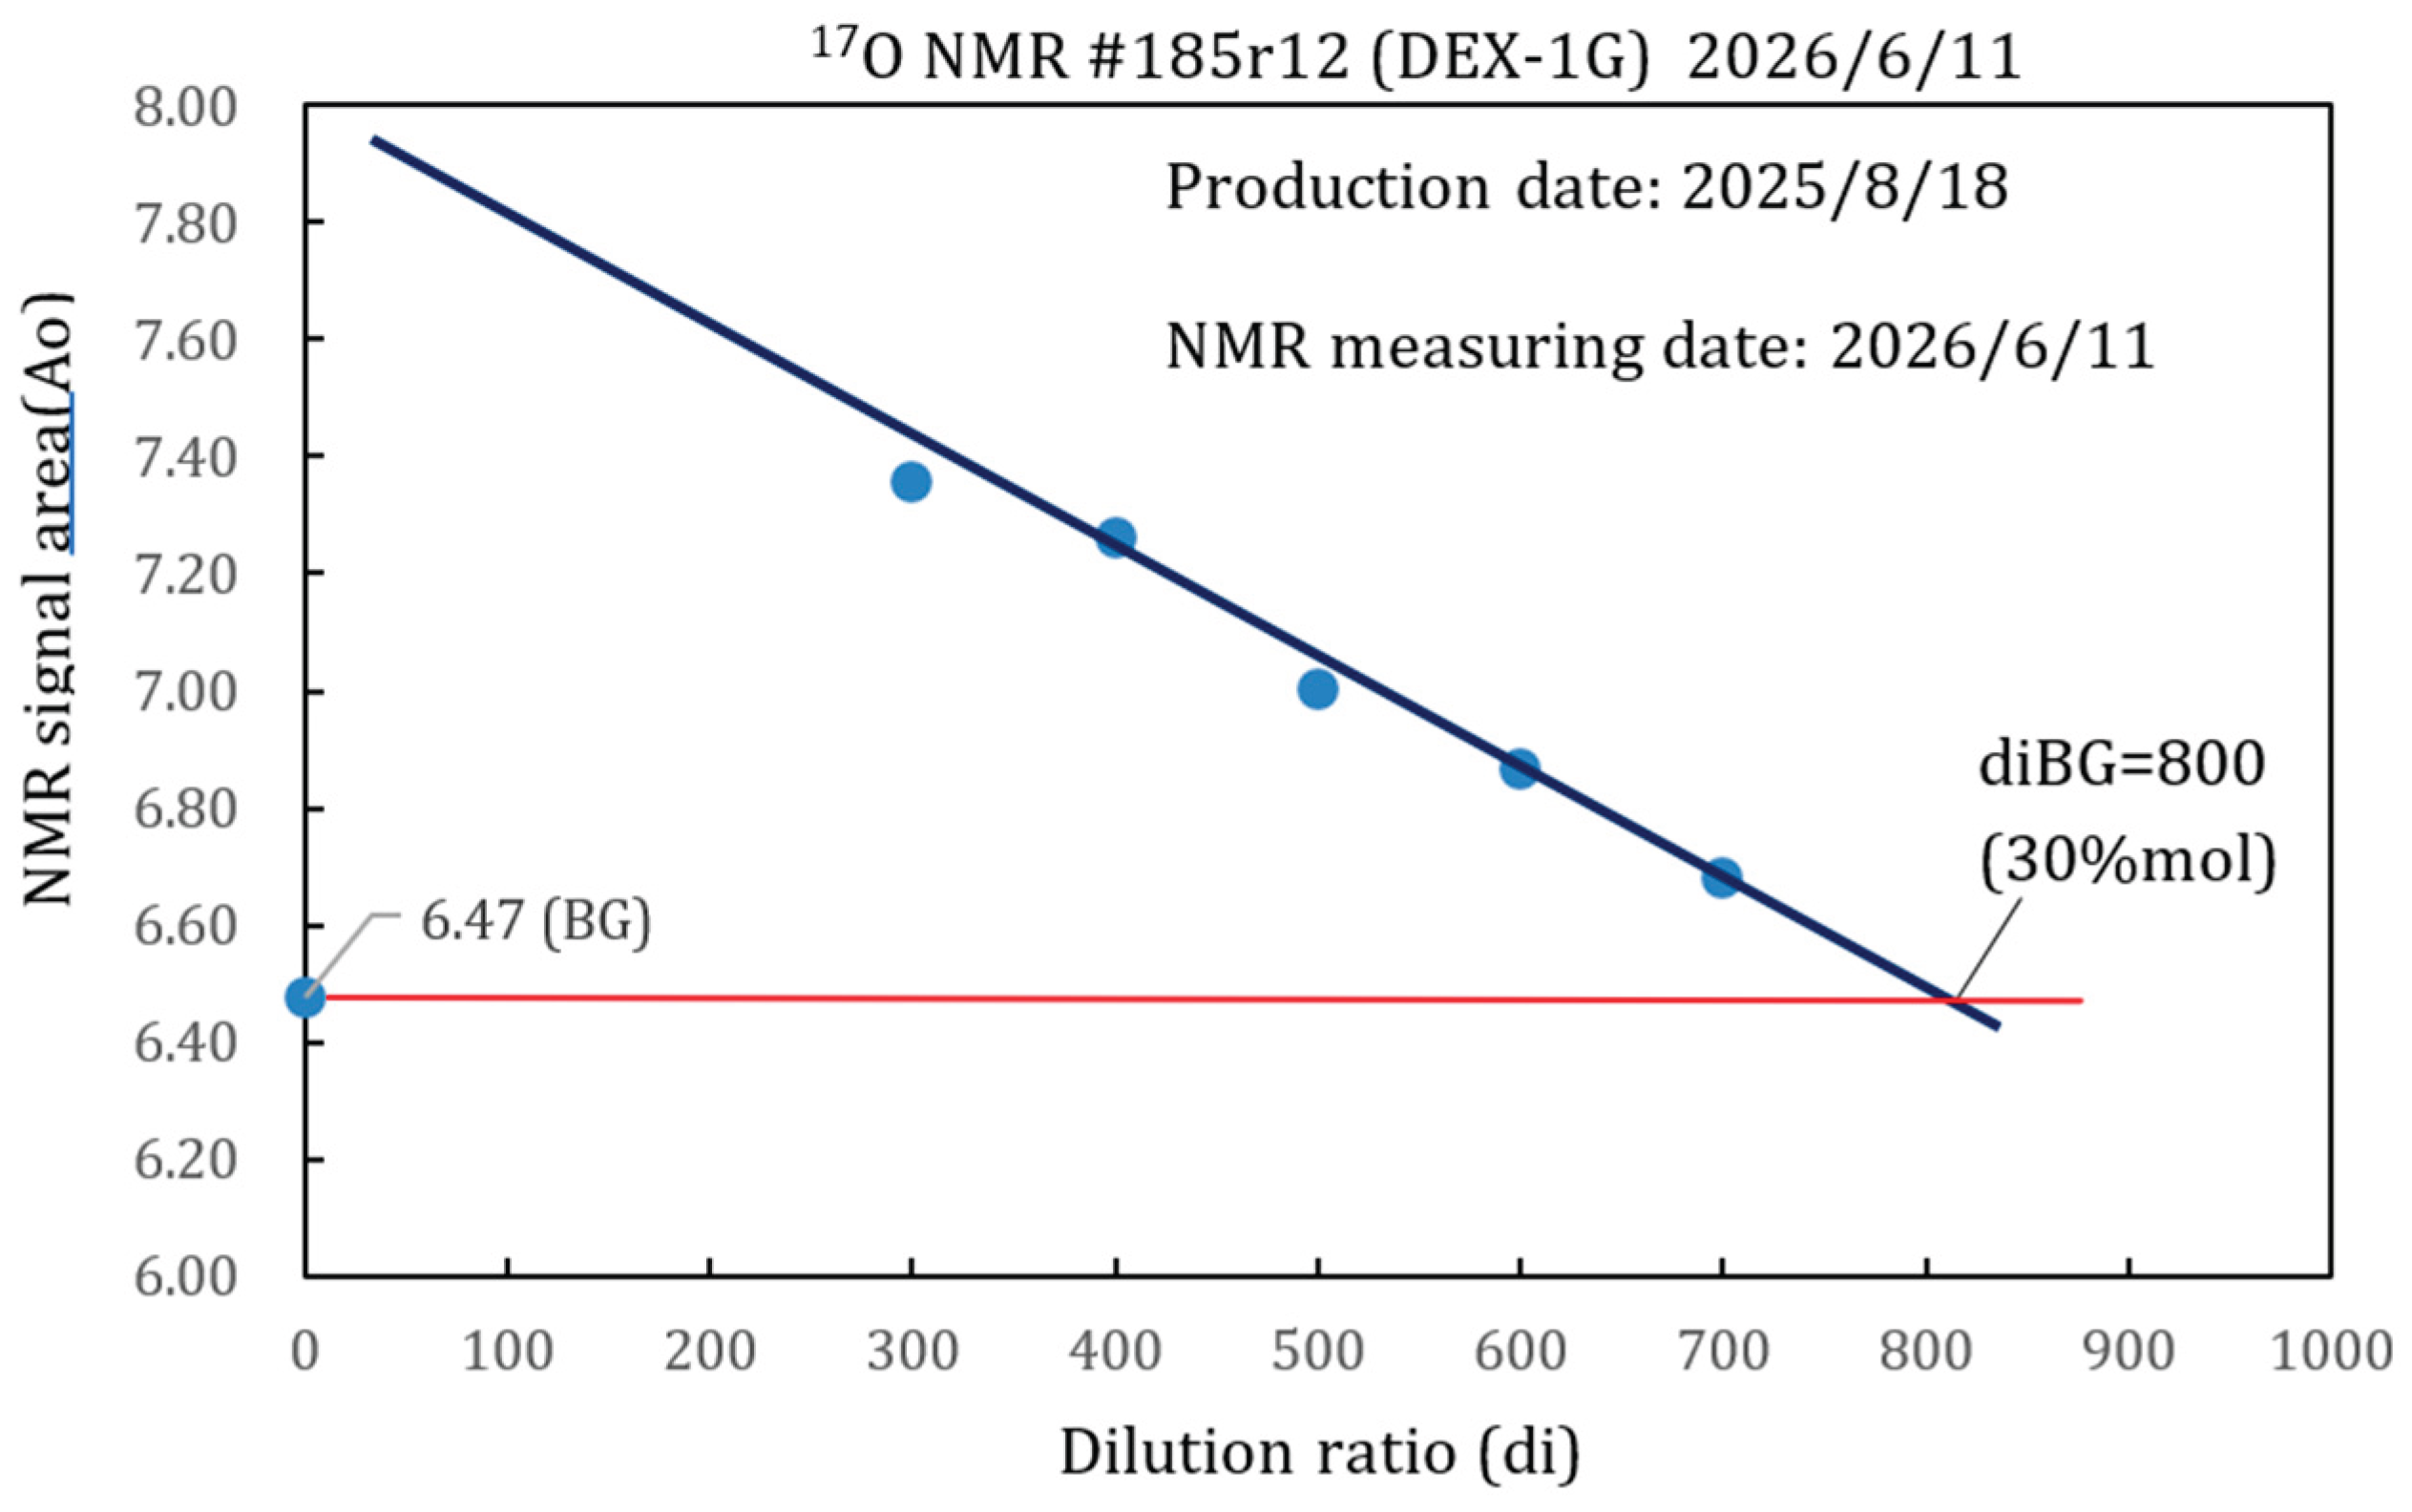
Figure 12.
Bubble size distribution of sample #185r12 (original liquid).
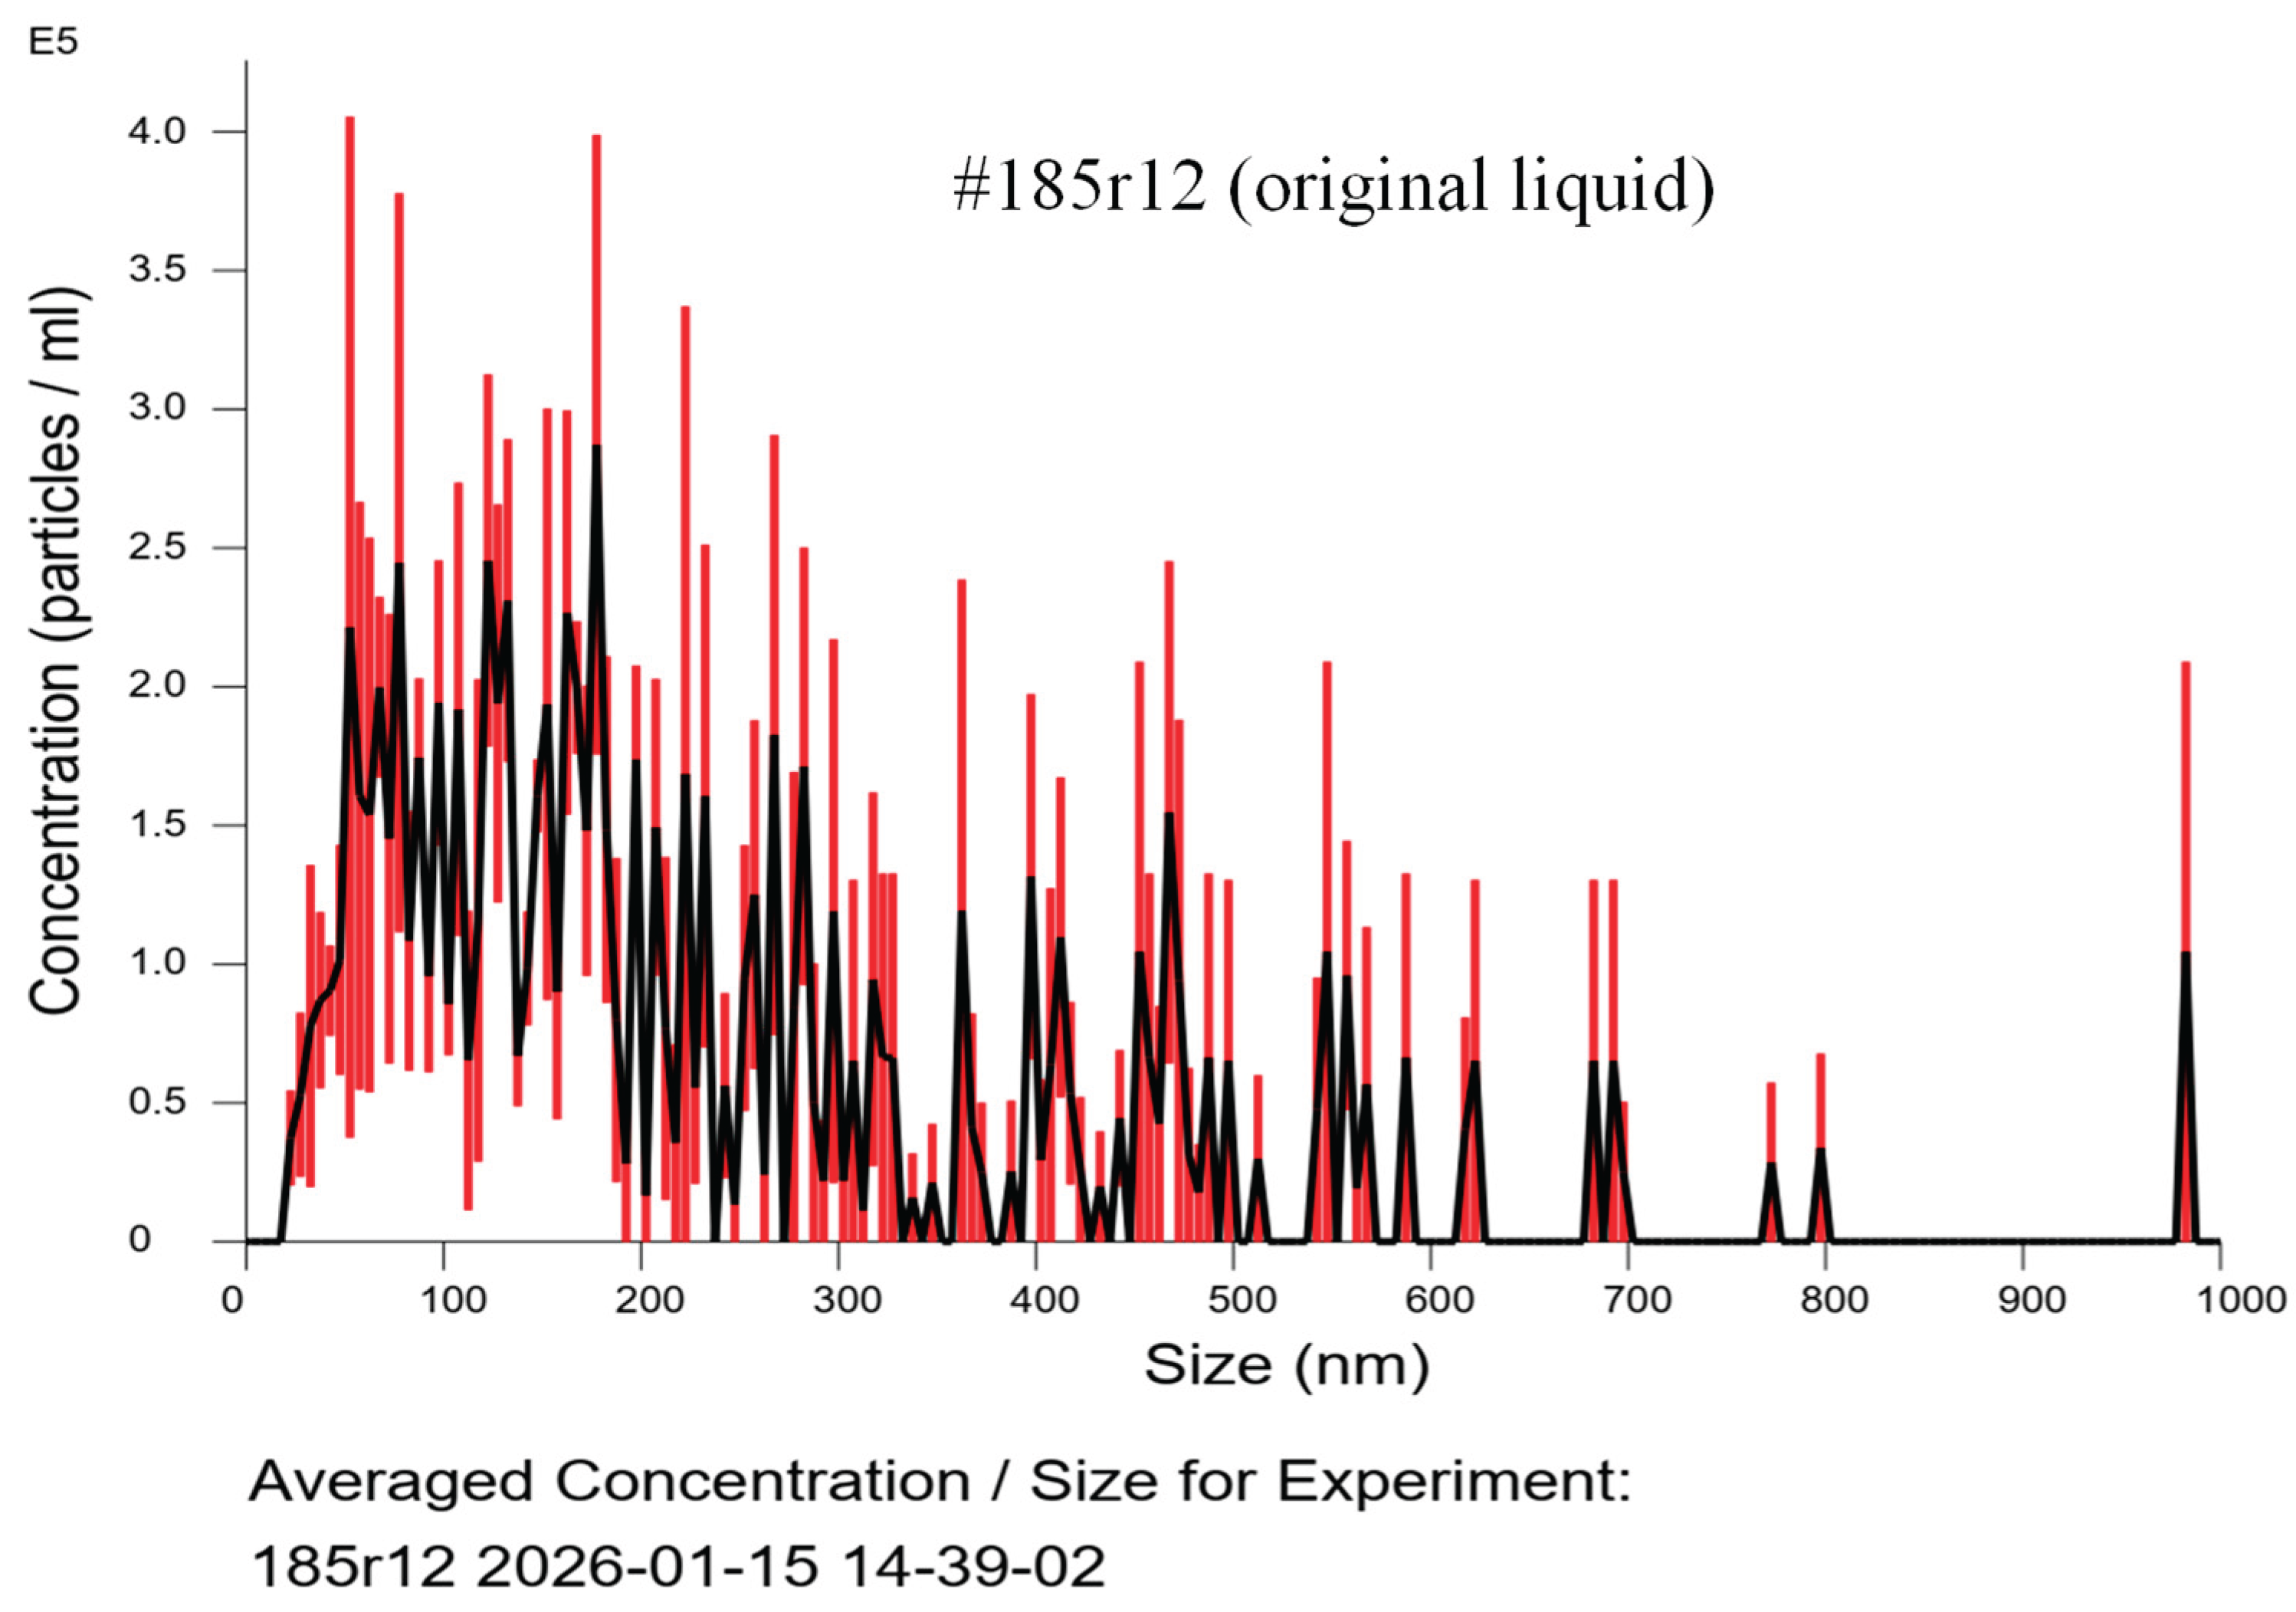
Figure 13.
Bubble size distribution of sample #185r12 (distilled liquid).
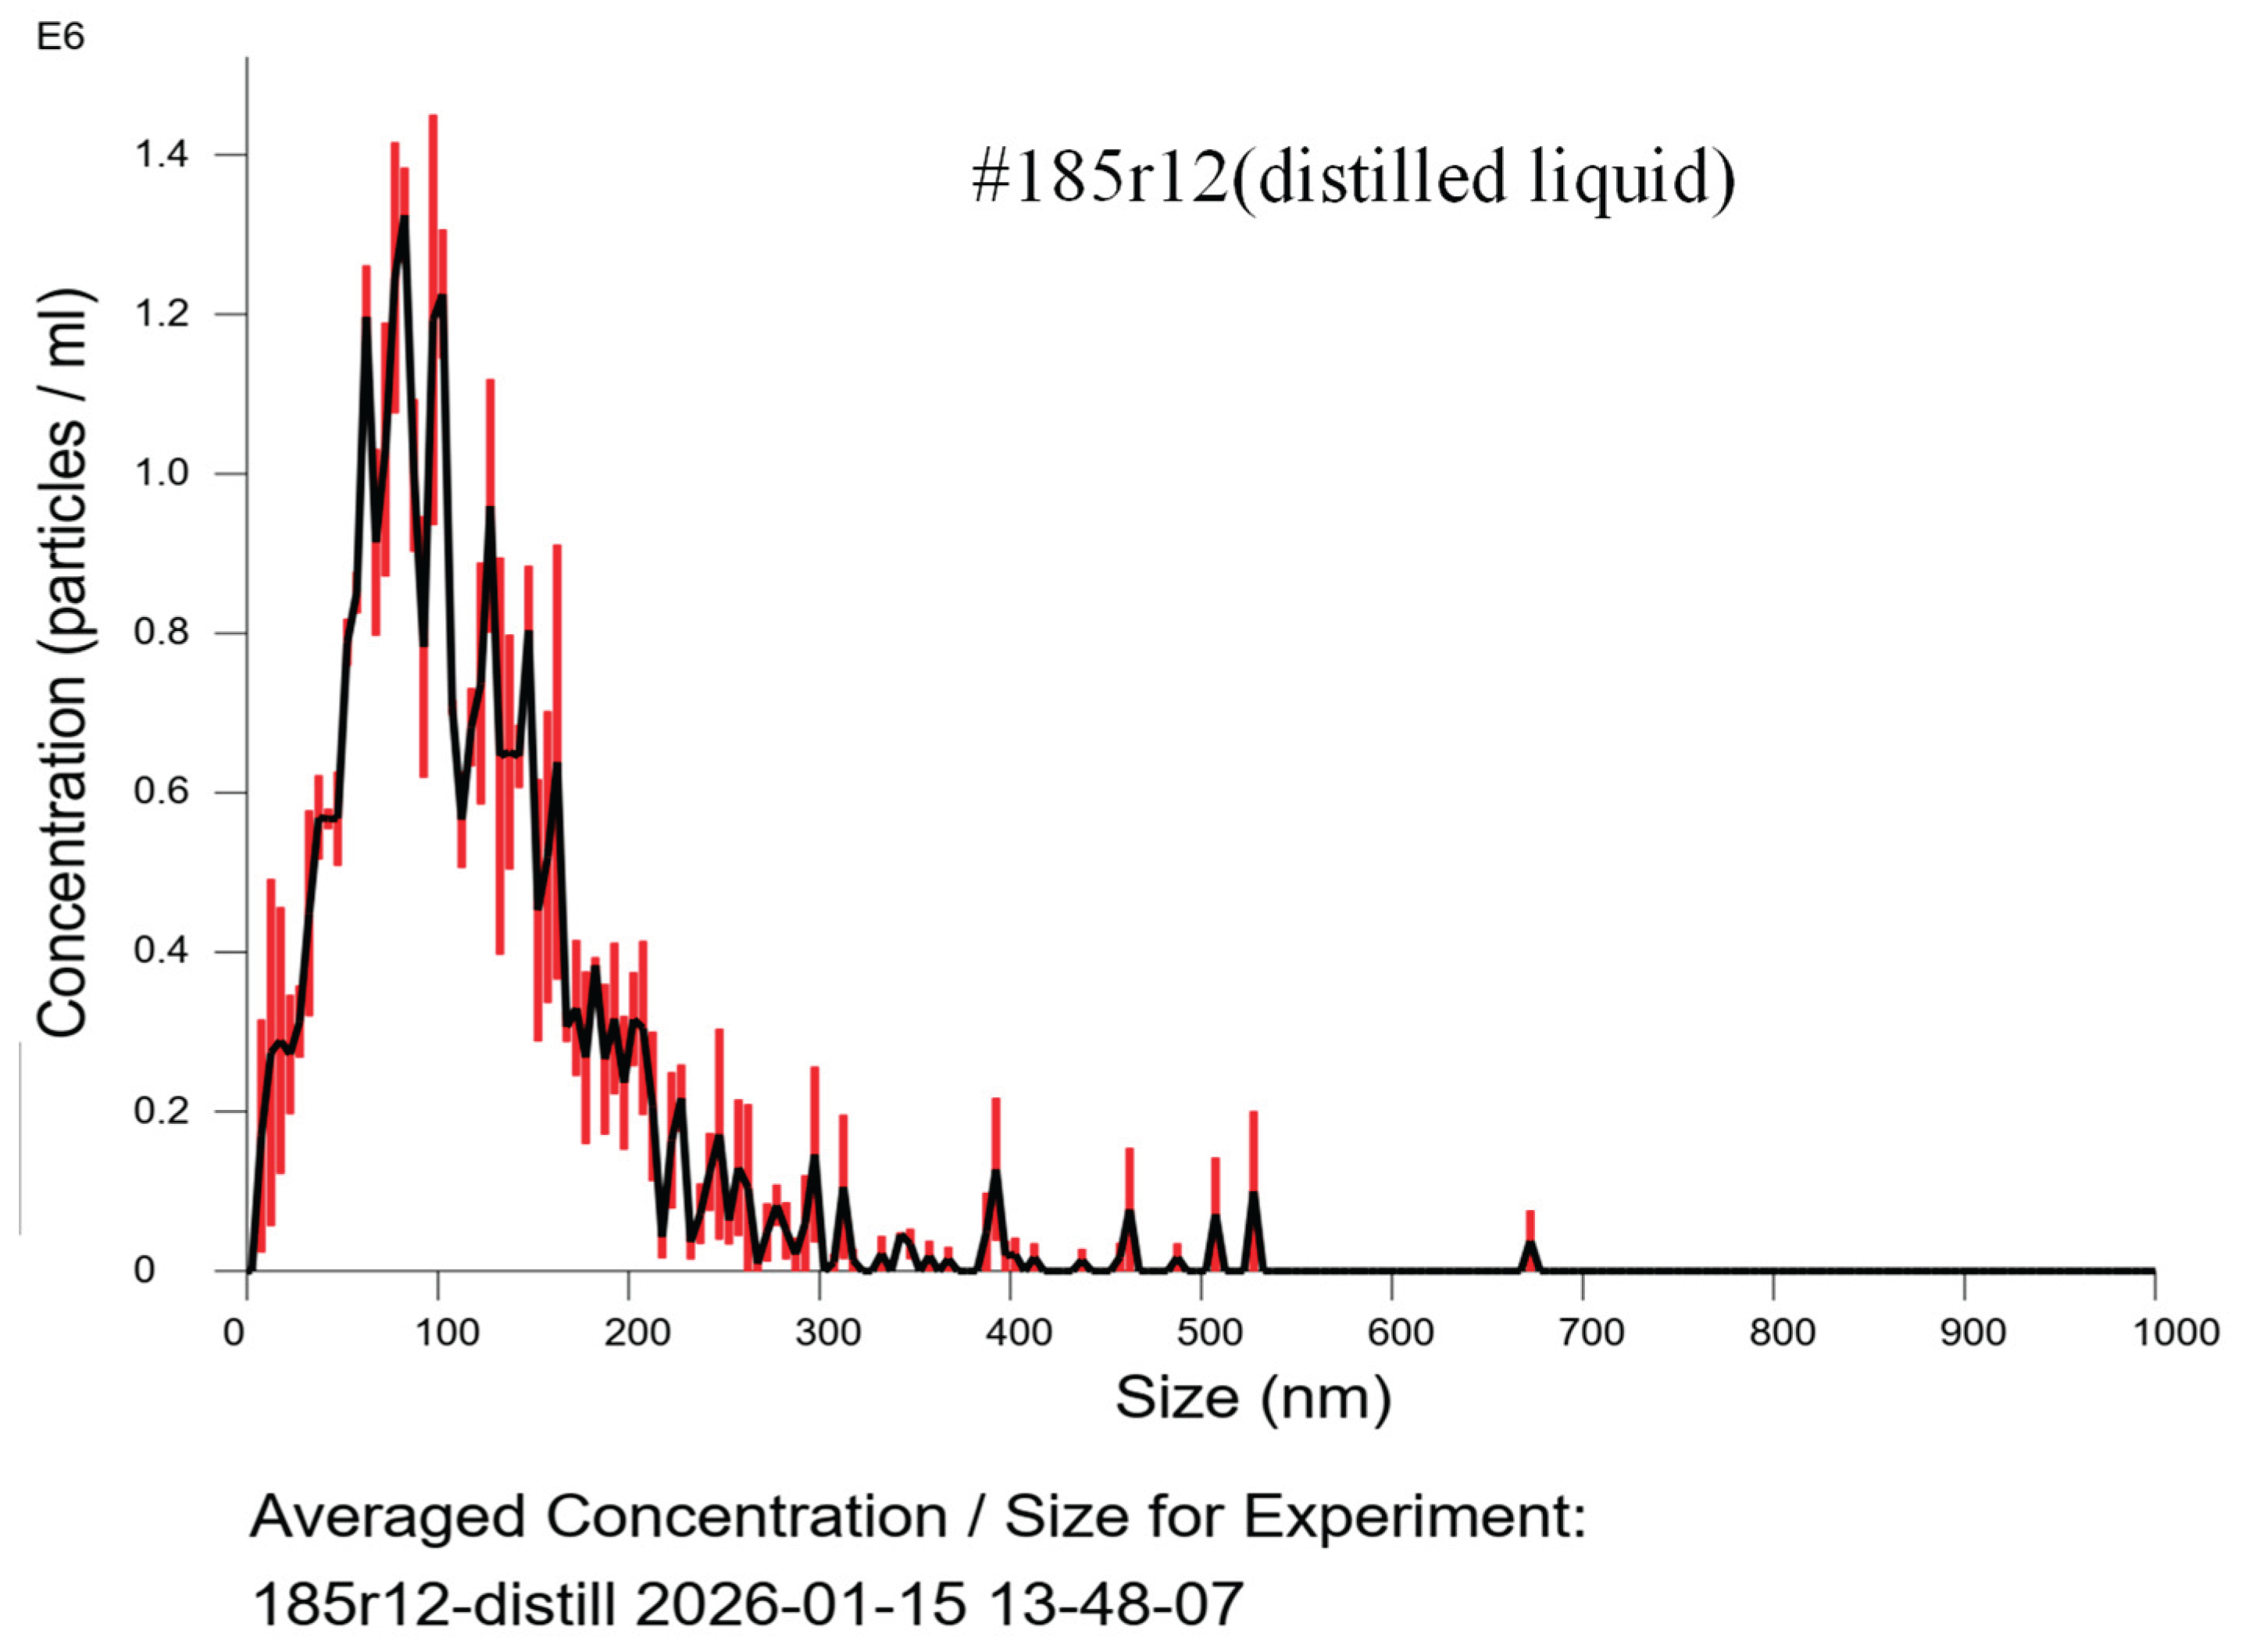
Figure 14.
MTT assay of cancer cells treated with 17O-enriched water.
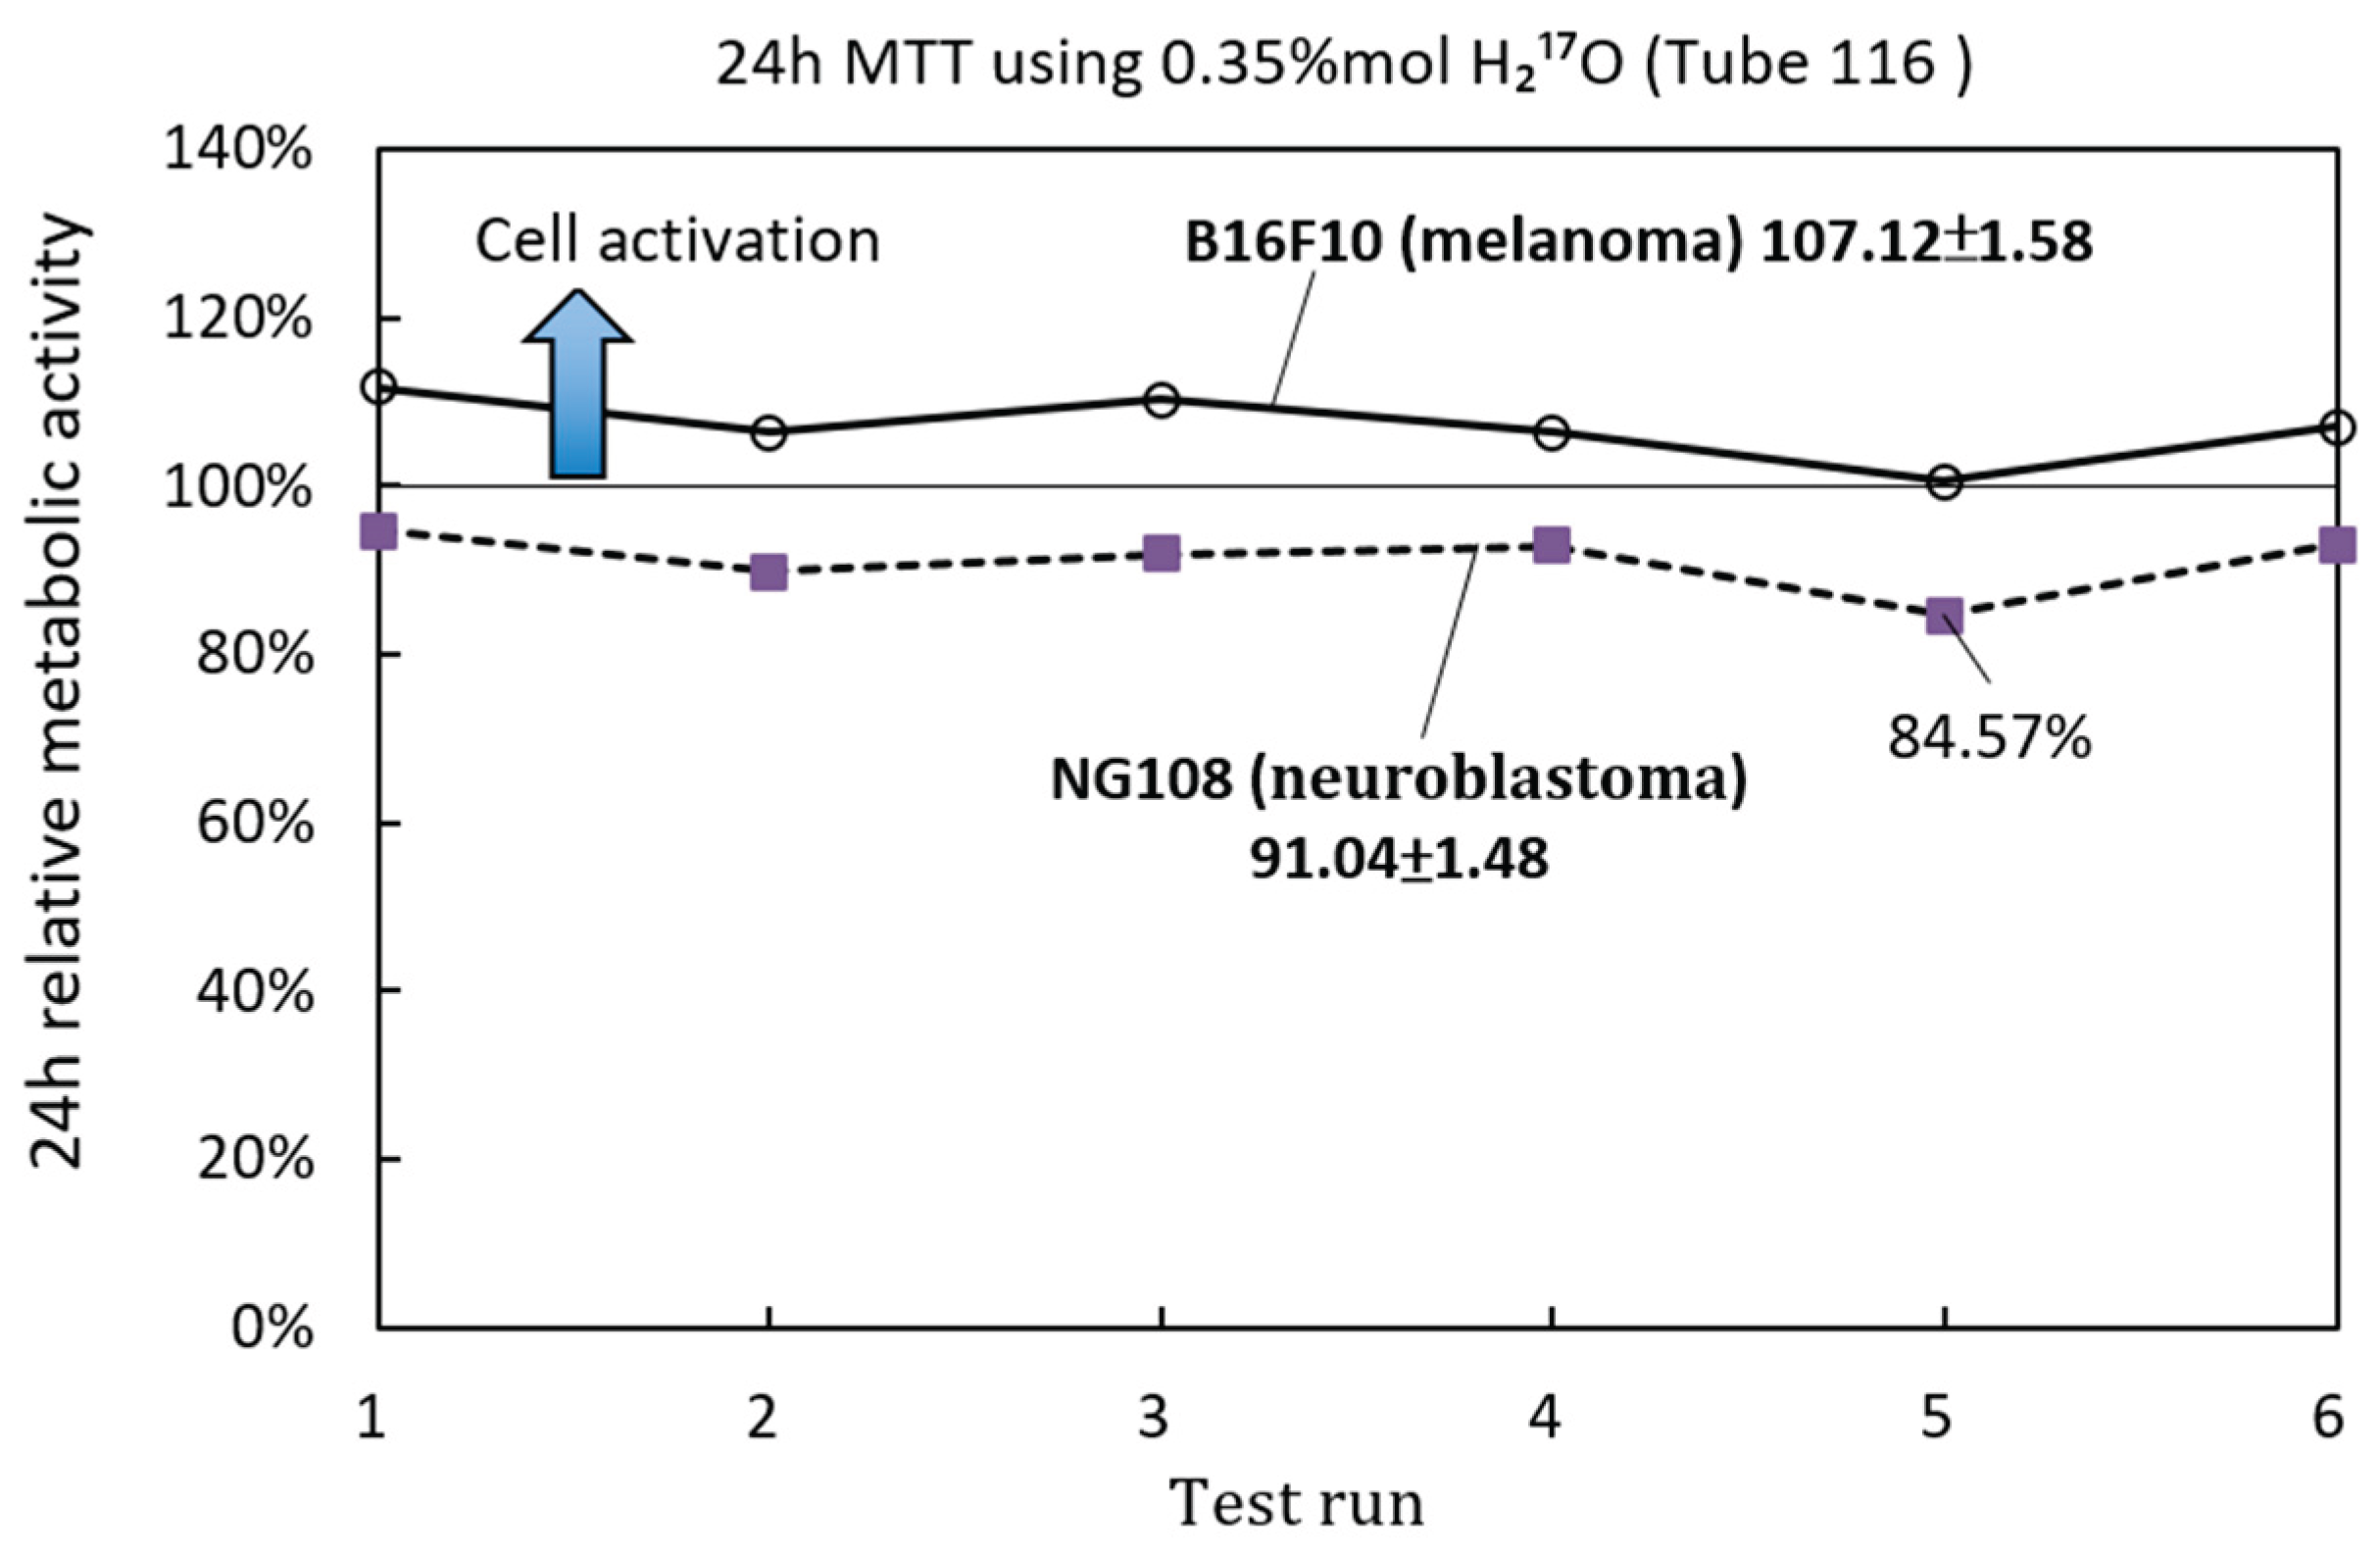
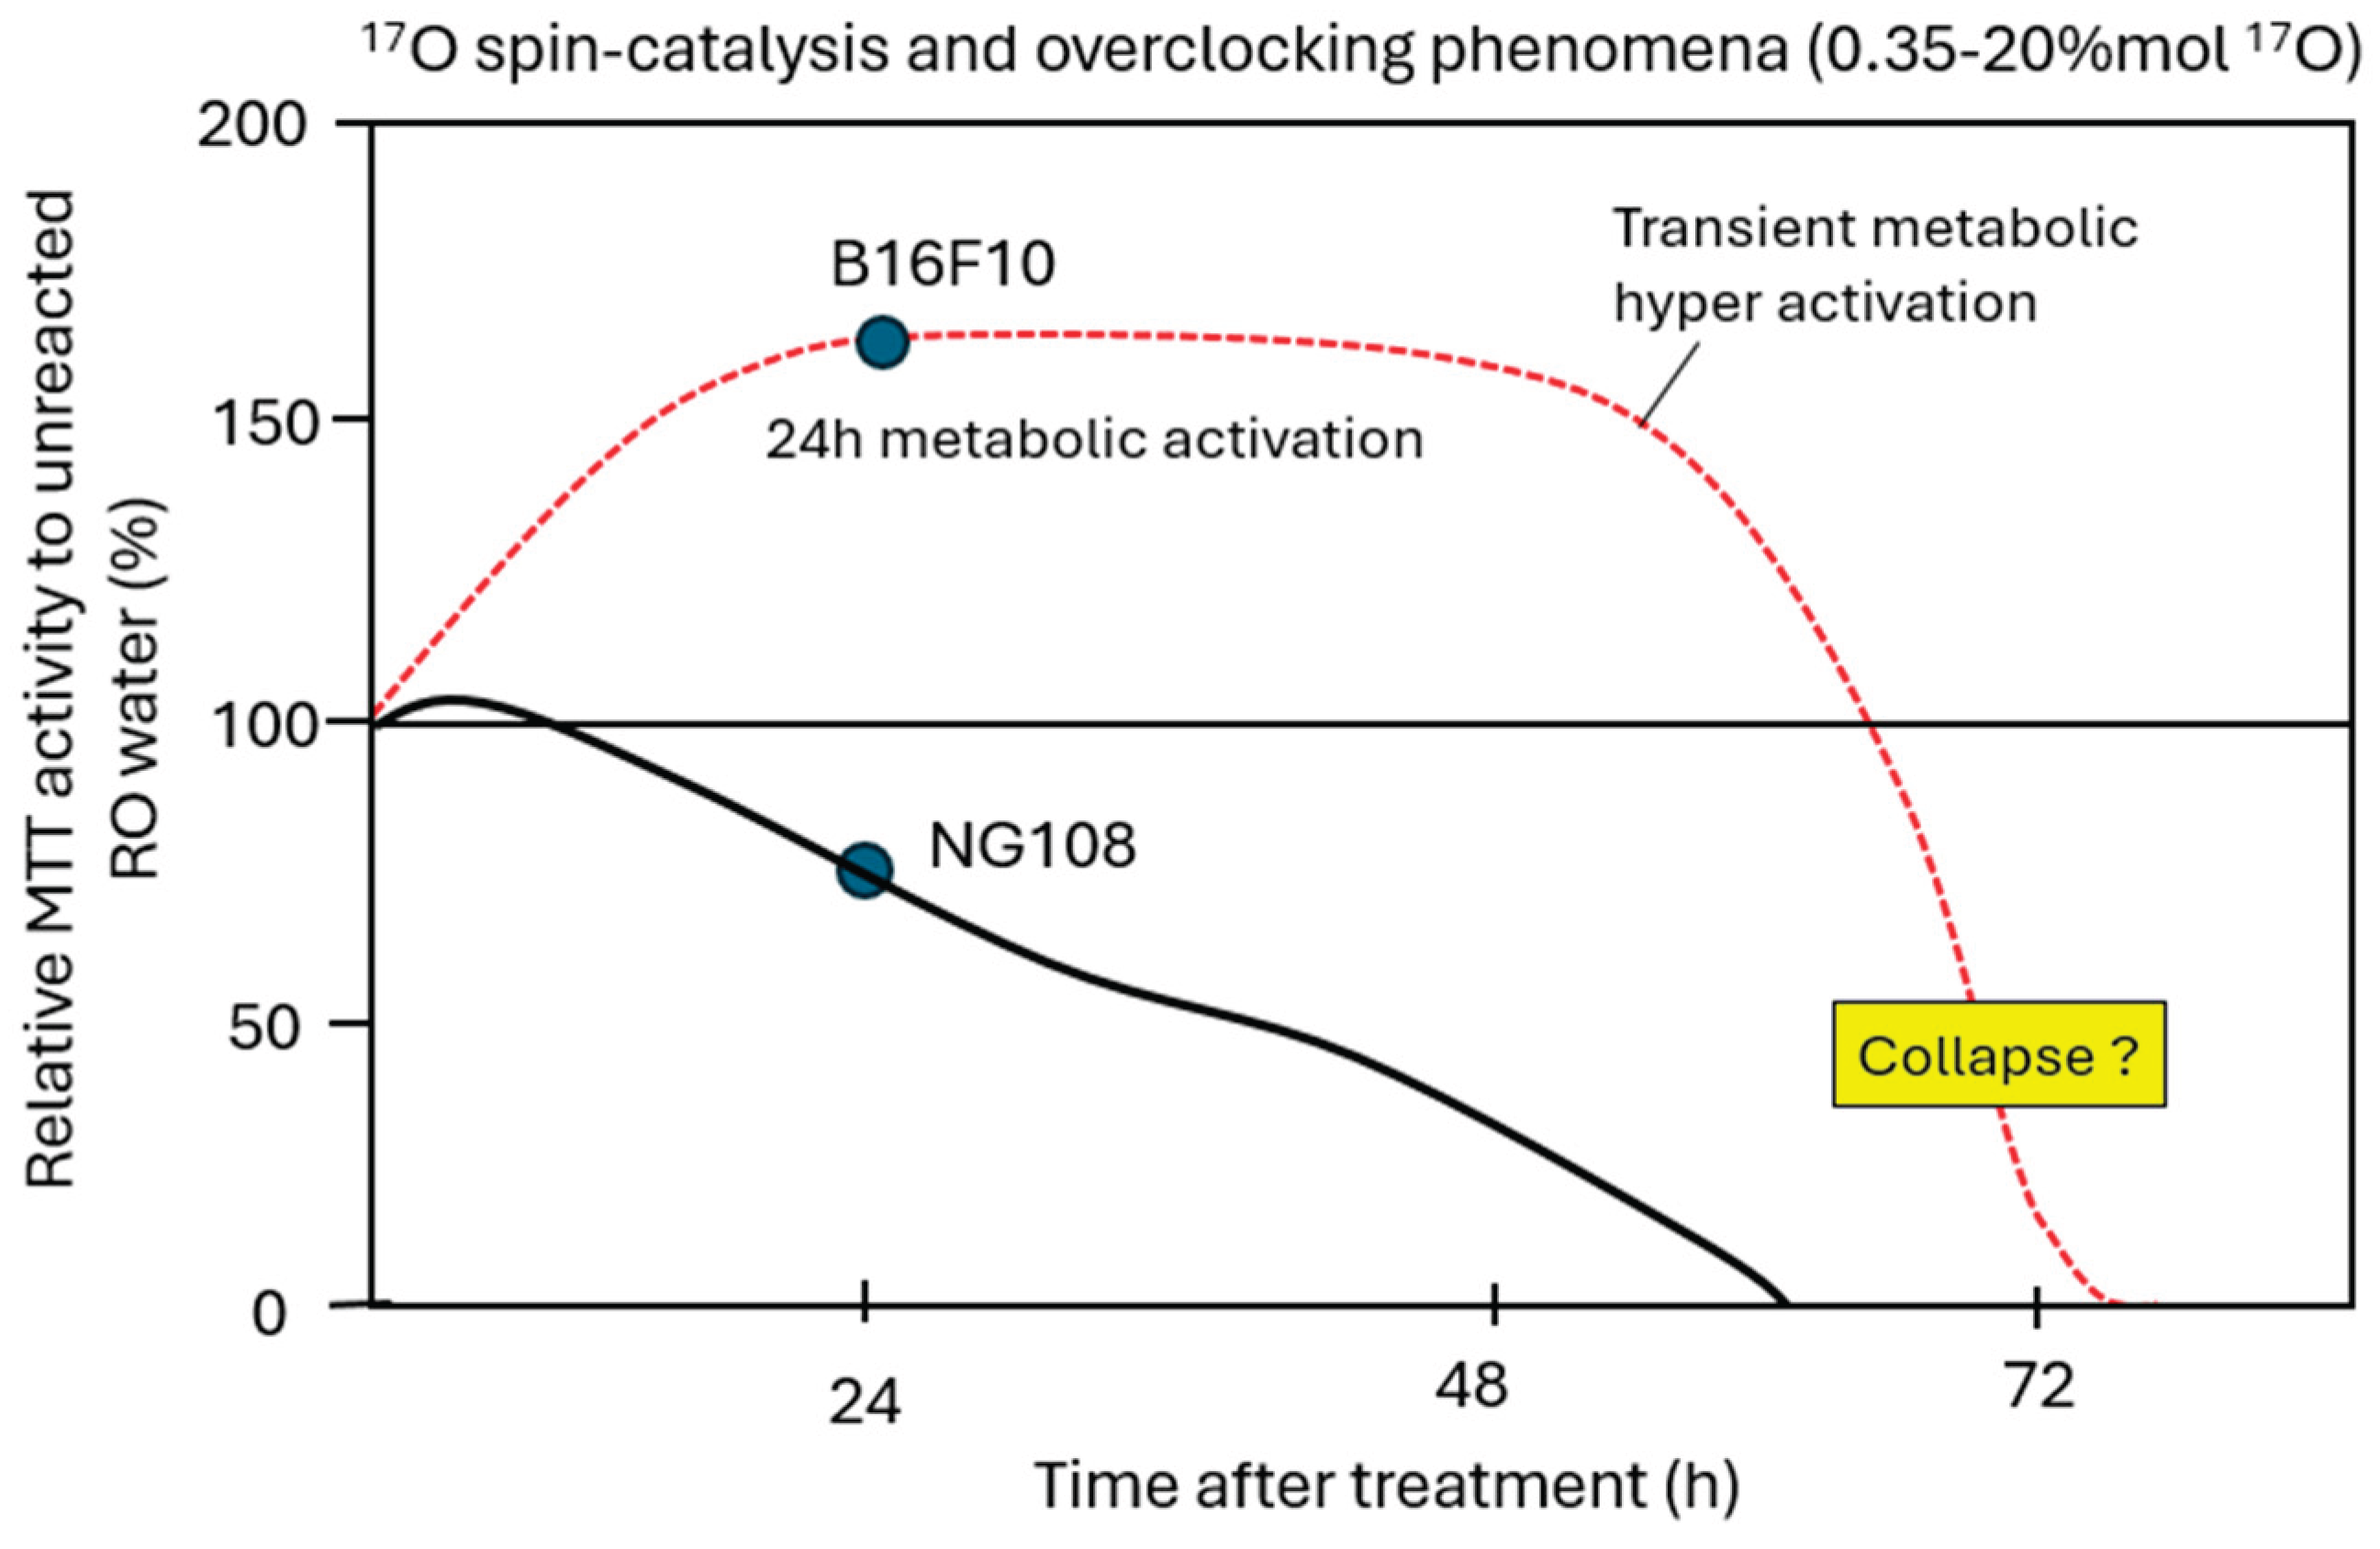

Table 1.
LENR replication results across eleven different reactors.
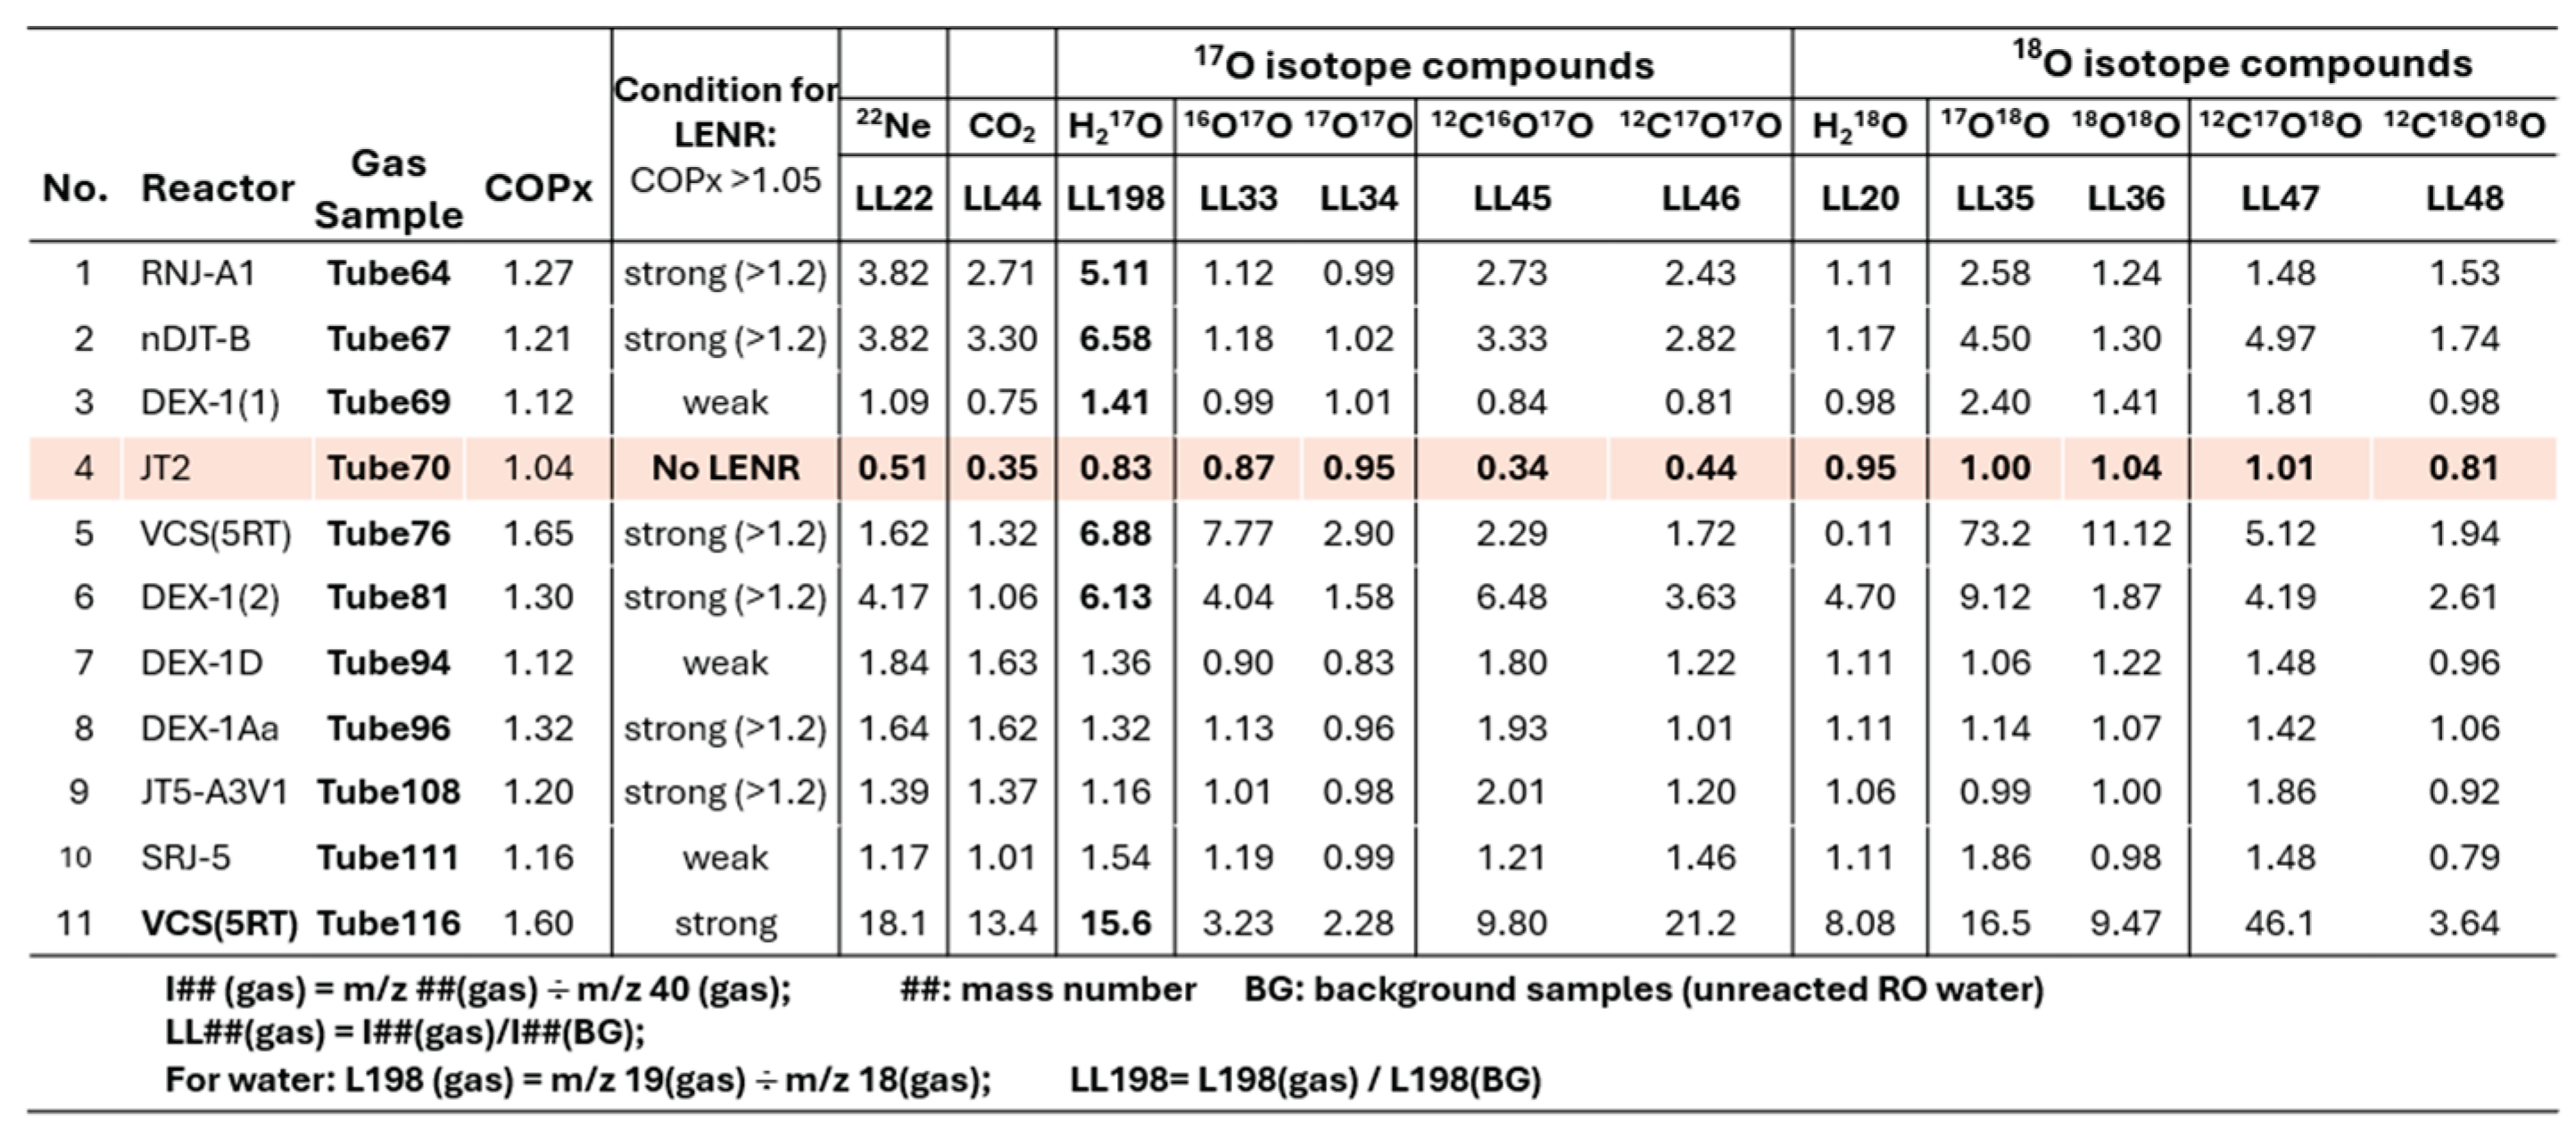 |
Table 2.
Concentrations of LENR products calculated from mass spectrometry data.
| LENR Reacted Water (#178r3 from DEX-1Aa) |
Contents | Concentration Cx (% mol) |
Concentration ratio compared to unreacted water |
|---|---|---|---|
| H217O water | H217O | 2.49 | 66.3 |
| H218O water | H218O | 0.96 | 47.3 |
| Noble gas | 22Ne | 2.14E-03 | 5.05 |
| Regular O2 | 16O2 | 3.67 | 1.22 |
| Regular CO2 | 12C16O2 | 0.170 | 5.54 |
| O2 isotope compounds | 16O17O | 7.00E-03 | 2.92 |
| 17O17O | 0.016 | 1.34 | |
| 17O18O | 2.64E-04 | 15.6 | |
| 18O18O | 1.13E-03 | 2.25 | |
| CO2 isotope compounds | 12C16O17O | 2.87E-03 | 7.95 |
| 12C17O17O | 1.30E-03 | 3.49 | |
| 12C17O18O | 1.17E-04 | 4.04 | |
| 12C18O18O | 3.29E-04 | 3.35 |
Table 3.
17O-NMR analysis of water samples.
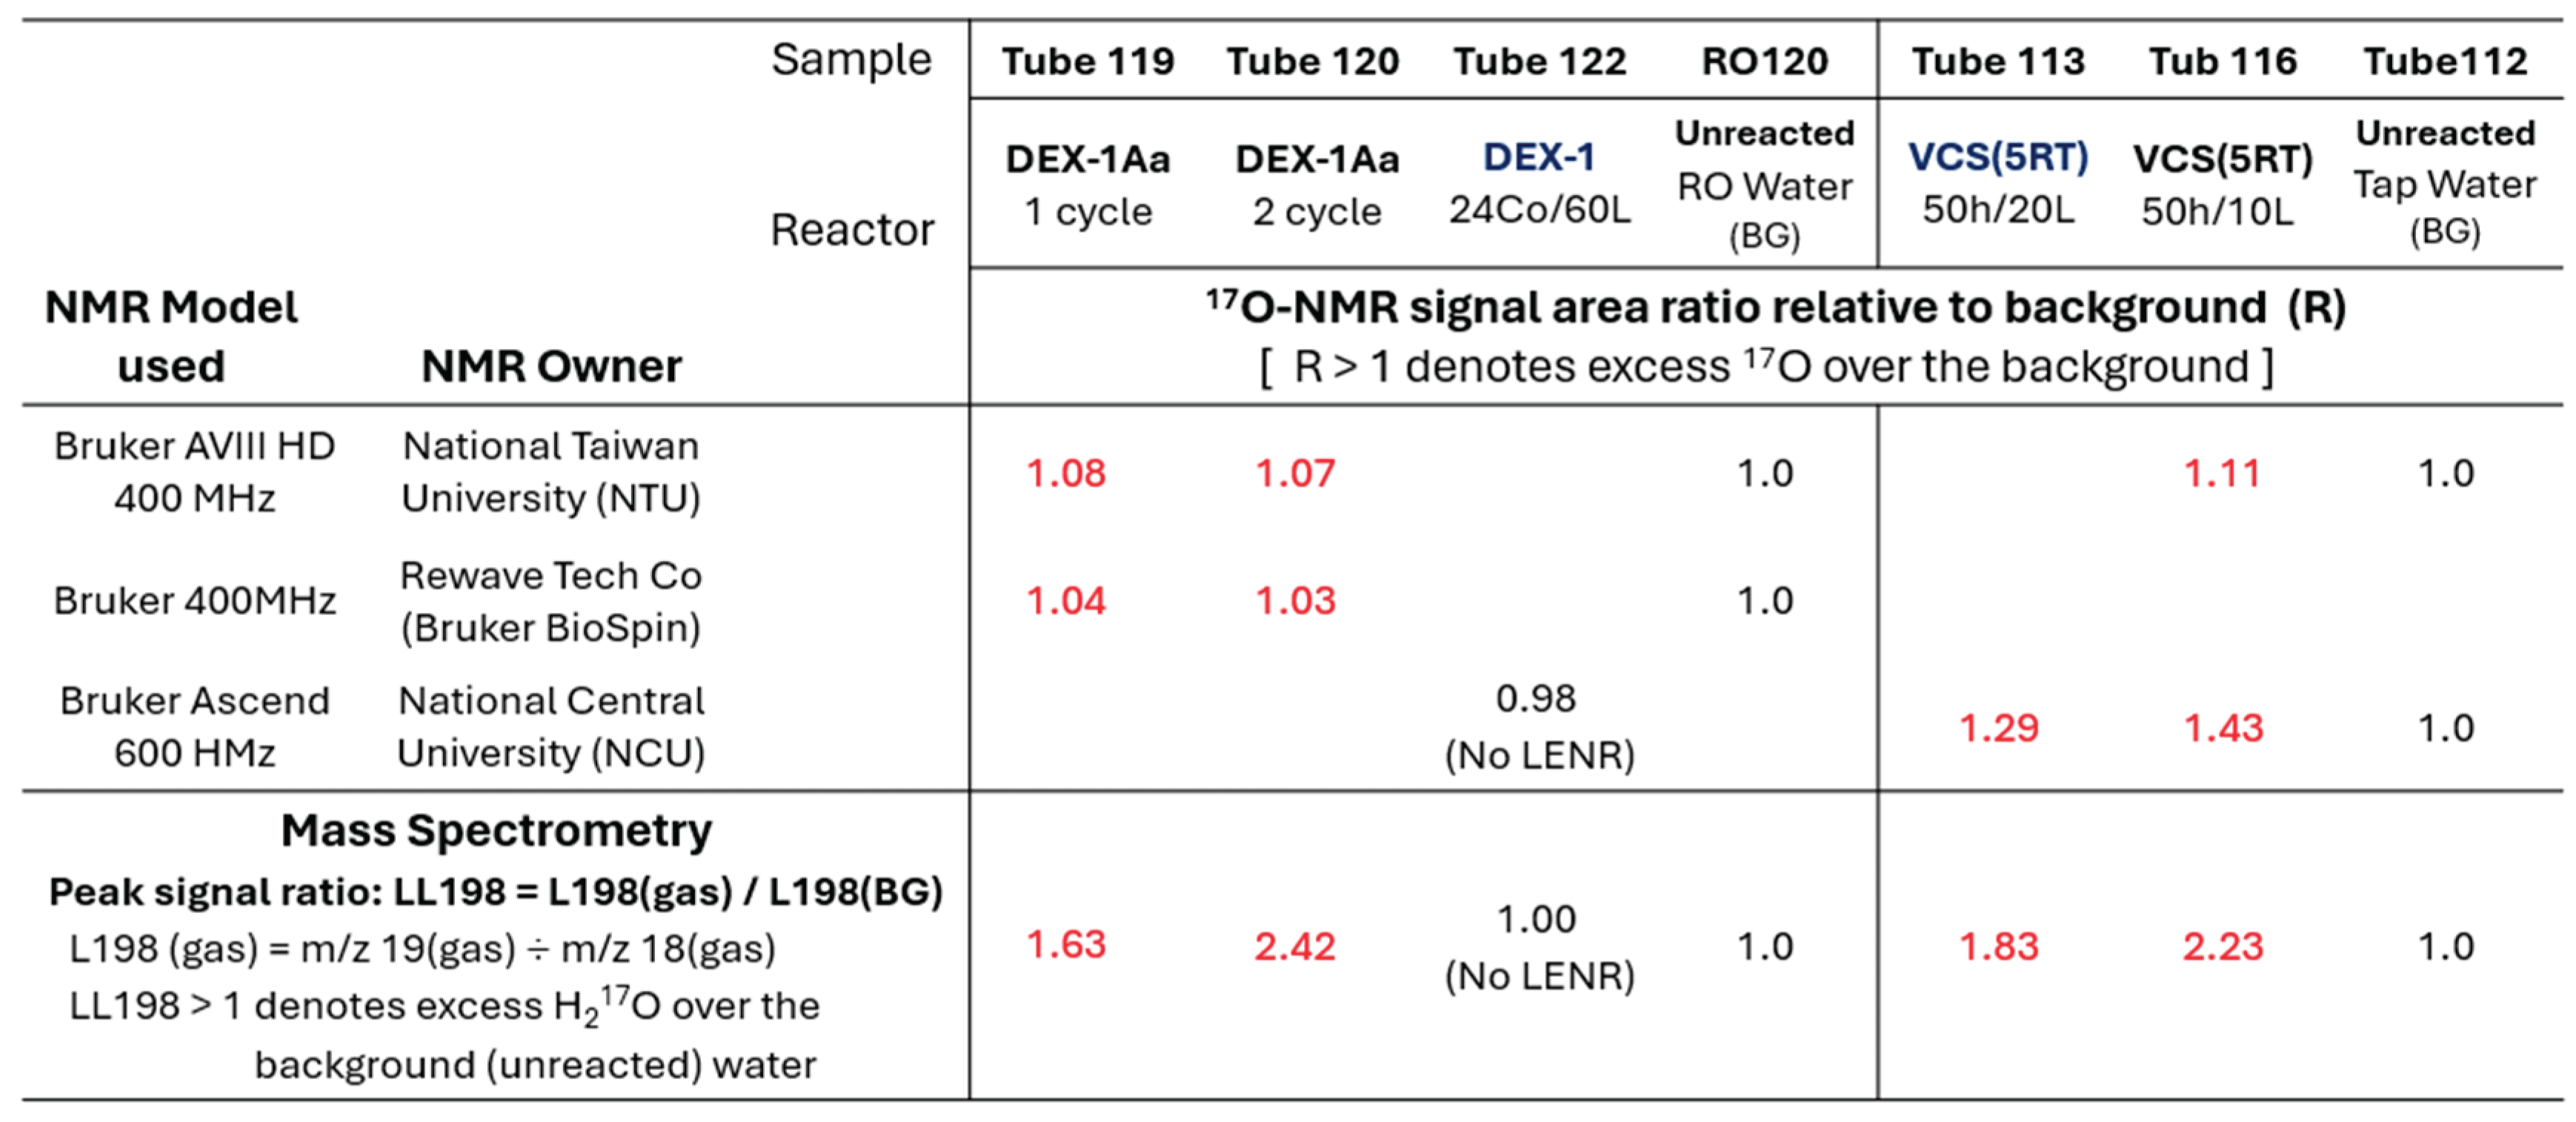 |
Table 4.
CRDS identification of 17O, 18O, 2H isotopes in water samples from different reactors.
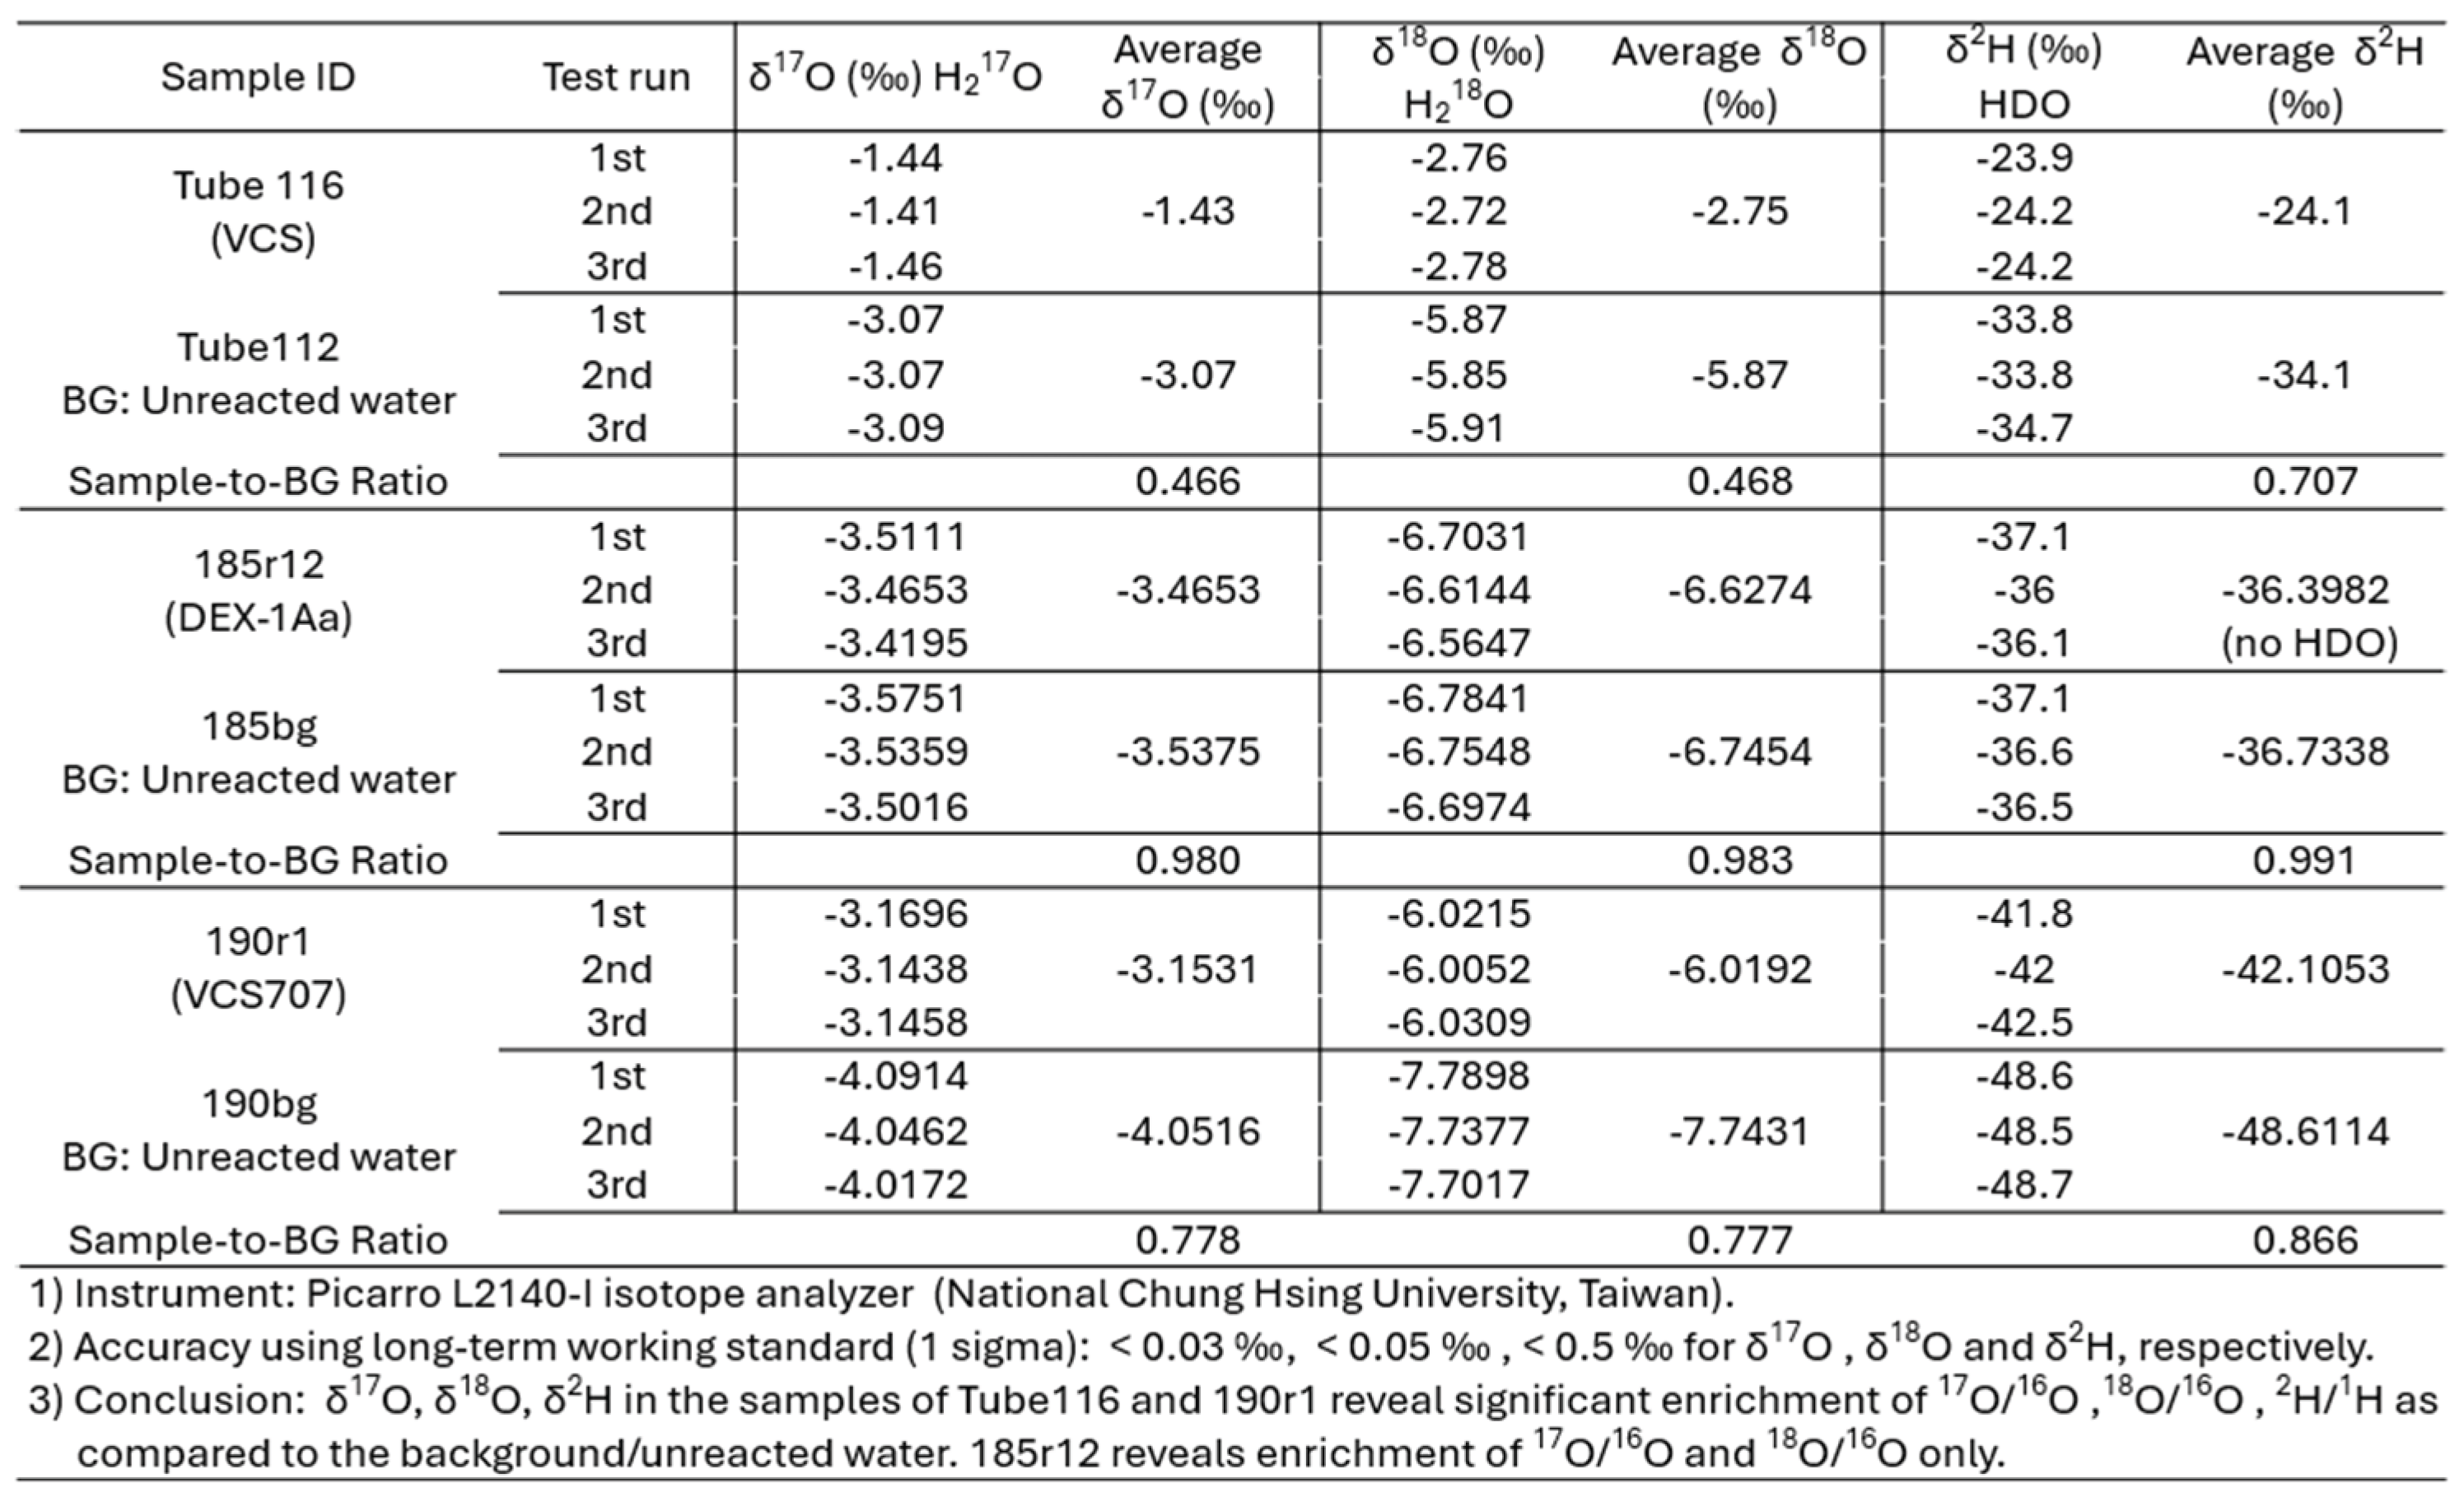 |
Table 5.
Particle size distribution of nanobubbles in sample #185r12.
| Items | #185r12 | #185r12 distilled |
|---|---|---|
| Mean (nm) | 242.6 +/- 18.5 | 119.4 +/- 3.4 |
| Mode (nm) | 151.0 +/- 50.6 | 79.6 +/- 10.4 |
| SD (nm) | 178.3 +/- 16.9 | 77.2 +/- 12.8 |
| D10 (nm) | 72.5 +/- 10.8 | 43.7 +/- 5.9 |
| D50 (nm) | 180.5 +/- 23.8 | 101.5 +/- 2.4 |
| D90 (nm) | 498.6 +/- 35.4 | 204.4 +/- 10.2 |
| Concentration (particles/mL) | 9.33e+06 +/- 4.94e+05 | 2.83e+07 +/- 1.19e+06 |
Disclaimer/Publisher’s Note: The statements, opinions and data contained in all publications are solely those of the individual author(s) and contributor(s) and not of MDPI and/or the editor(s). MDPI and/or the editor(s) disclaim responsibility for any injury to people or property resulting from any ideas, methods, instructions or products referred to in the content. |
© 2026 by the authors. Licensee MDPI, Basel, Switzerland. This article is an open access article distributed under the terms and conditions of the Creative Commons Attribution (CC BY) license (http://creativecommons.org/licenses/by/4.0/).
Copyright: This open access article is published under a Creative Commons CC BY 4.0 license, which permit the free download, distribution, and reuse, provided that the author and preprint are cited in any reuse.


