

Submitted:
30 June 2026
Posted:
01 July 2026
You are already at the latest version
Abstract
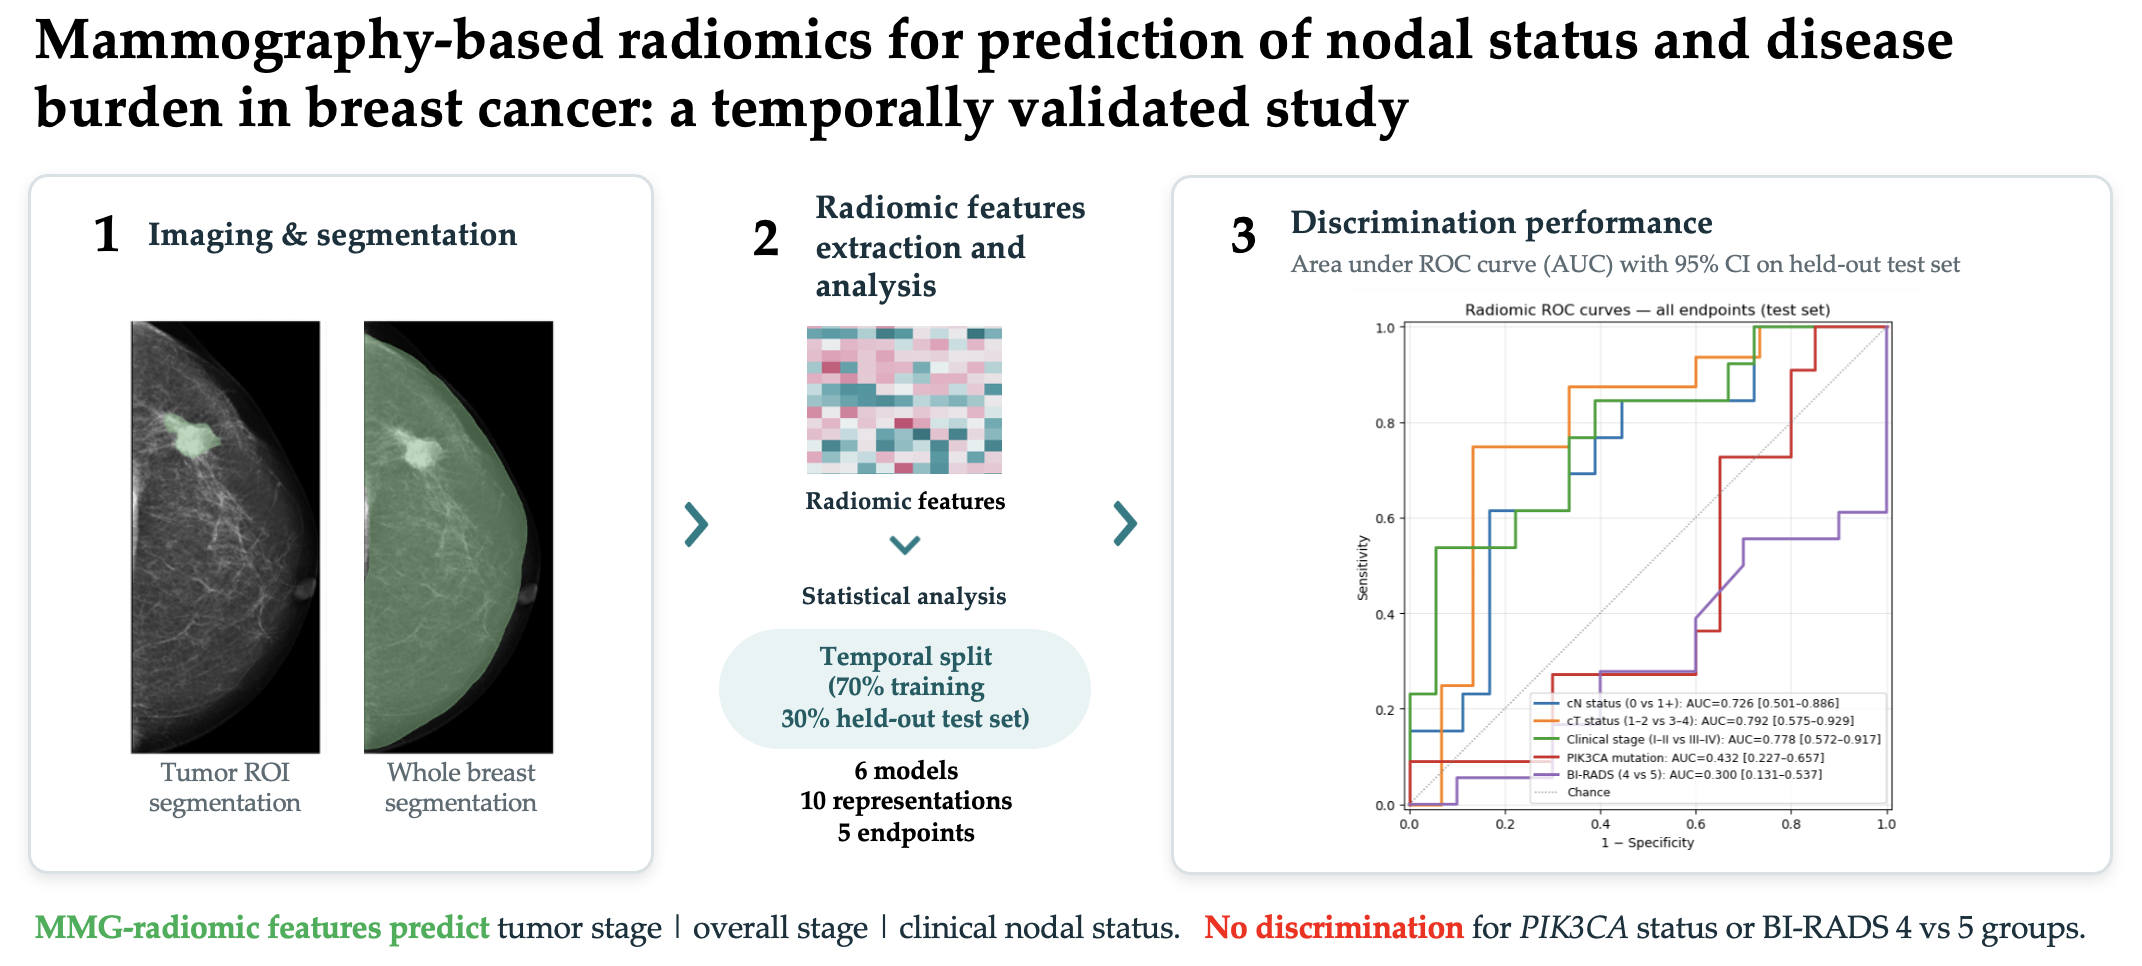
Objectives We evaluated the performance of mammography-based radiomics in prediction of clinical nodal status, clinical tumor stage, clinical disease stage, status of the PIK3CA mutation and concordance with the radiologist-assessed BI-RADS category. Mammography is often the first imaging modality performed in the screening or diagnostic workup of breast cancer. Materials & Methods In this single-center retrospective study, we included 102 histopathologically-confirmed cases of breast cancer from 100 patients. The tumor region and whole-breast parenchyma were contoured on 368 craniocaudal and mediolateral-oblique mammograms. Cases were temporally split into training and test sets by histopathological diagnosis date (training 70%, held-out test 30%). Six linear models were tuned by 5-fold x 3-repeat stratified cross-validation. The winning model per endpoint was applied once to the test set. We report AUC with 95% confidence intervals, permutation p-values and Benjamini-Hochberg false discovery rate (BH-FDR) correction across five endpoints. Results Three of the studied endpoints reached significance after BH-FDR correction: clinical nodal status (cN0 vs cN-positive; AUC 0.726 (95% CI: 0.501–0.886)), clinical tumor stage (cT1-2 vs cT3-4; AUC 0.792 (95% CI: 0.575–0.929)) and overall disease stage (I-II vs III-IV; AUC 0.778 (95% CI: 0.572–0.917)). Mammography-based radiomics failed to predict the presence of PIK3CA mutation and concordance with radiologist-assessed BI-RADS category. Conclusion Mammography-based radiomics can be used to discriminate between cN-negative and cN-positive disease, early from advanced clinical tumor stage and early from advanced overall disease stage in breast cancer. Mammography-based radiomics did not predict PIK3CA status and did not discriminate between radiologist-assessed BI-RADS 4 and 5 groups.
Keywords:
breast cancer
; radiomics
; mammography
; mammography-based radiomics
1. Introduction
Breast cancer (BC) is the most common cancer in women (excluding non-melanoma skin cancer), with 361,859 new cases and 92,749 deaths in the European Union in 2024 [1]. Mammography (MMG) is the most widely used breast imaging modality worldwide. In many countries, it is part of screening programs aimed at early detection of BC. In the United States, approximately 39 to 40 million MMG procedures are performed annually [2]. Given its reported sensitivity of approximately 72%, relatively low cost, and high availability, it remains the cornerstone of BC screening [3].
Radiomics focuses on extracting quantitative features from medical images. It is gaining momentum in oncology, as the field continually seeks novel and more robust predictive methods. The main promise of radiomics is that it captures what is imperceptible to the human eye, such as subtle variations in shape, texture, and signal intensity [4]. These features, when combined with clinical, histopathological, and genetic variables, can be used to develop predictive models.
Radiomics has been investigated in BC since the field’s inception. Initial reports appeared in 2015, followed by numerous studies [5]. Radiomics and multi-omics approaches have been successful in predicting multiple characteristics of BC, including hormone receptor and HER2 status, response to treatment, and risk of recurrence, among others [6,7,8]. However, the majority of BC radiomics and multi-omics studies use magnetic resonance imaging (MRI)-derived features. While MRI offers superior soft tissue contrast and three-dimensional evaluation of the breast, it is not routinely used as the primary diagnostic imaging modality in the general population.
In this study, we aimed to evaluate whether MMG-based radiomics, leveraging a more widely available modality, can predict the disease burden, concordance with radiologist-assessed BI-RADS category and the status of PIK3CA mutation in BC.
2. Materials and Methods
2.1. Patient Cohort
In this single-center retrospective study, we screened 136 BC cases from 134 female patients treated at Holy Cross Cancer Center, Kielce, Poland. Due to the retrospective nature of the study, with all data collected during the diagnostic and treatment process, the institutional review board approval was not required. The inclusion criteria were histopathological confirmation of BC and the presence of pre-treatment digital mammogram in the hospital’s archives. Exclusion criteria were lack of histopathological confirmation, lack of mammograms, unavailable radiologist’s report for the MMG, low quality of imaging or faulty genetic testing due to sample degradation. After the initial screening, 34 cases from 34 patients were excluded from the study. Utilized methods are reported per TRIPOD+AI guidelines [9]. Figure 1 demonstrates the inclusion process.
2.2. Endpoints
The primary endpoint was the evaluation of prognostic performance of MMG-derived radiomic features for prediction of the presence of nodal metastases in the pre-surgical diagnostic process (cN status). Secondary endpoints were the radiomics-based prediction of clinical tumor stage (cT), overall clinical disease stage, presence of PIK3CA mutation and concordance with radiologist-assessed BI-RADS 4 and 5 groups. The methodological workflow of this study is summarized in Figure 2.
2.3. Image Acquisition
Mammograms were taken using the following MMG hardware: Siemens Mammomat Inspiration, with kilovoltage peaks up to 35 kV, a tungsten anode and a 0.05 mm rhodium filter and Hologic Selenia Dimensions and Lorad Selenia systems with kilovoltage peaks up to 33 kV, molybdenum anodes and 0.03 mm rhodium filters. 76.7% of the mammograms were performed using the Siemens system, and the remaining 23.3% were taken using the Hologic systems. Open source, Image Biomarker Standardisation Initiative (IBSI)-compliant Z-Rad software (University Hospital Zurich, Switzerland) was used for image and mask preprocessing and radiomic features extraction [10]. All the images and masks were preprocessed, with resample resolution of 0.1 mm, linear image interpolation and nearest neighbor mask interpolation. The radiomic features were extracted from NIfTI files, with 2D averaged texture aggregation and fixed bin number discretization – 36 bins for mask1 and 22 for mask2 (based on IQR of pooled tumor and breast tissue intensities in the training subset, applied unchanged to test). 138 radiomic features were extracted for every segmentation. The full list of extracted radiomic features is provided in the Supplementary Materials.
- a.
- Image segmentation
Mammograms of ‘tumor-side’ and ‘healthy’ breasts in craniocaudal (CC) and mediolateral oblique (MLO) projections were collected. Segmentations were made for the tumor region (mask1) and for the whole breast, excluding skin and nipple (mask2) for the ‘tumor-side’ breast, and a whole-breast segmentation for the ‘healthy’ breast. The segmentations were performed using 3D Slicer software and saved as a binary labelmap in NIfTI format for later processing [11]. All segmentations were performed manually. Segmentation of the tumor region was performed according to a written radiologist’s report in all cases.
- a.
- Statistical analysis
For model validation, cases were divided into training (70%) and test (30%) sets with a temporal split based on the histopathological diagnosis date, with the most recent cases in the test set. This approach simulates a prospective deployment. The split was fixed throughout analyses. Random seed was fixed at 42 for reproducibility.
We evaluated 10 feature subsets to assess the extent to which they contribute to the predictive performance of MMG-based radiomics. The subsets included: tumor ROI-based features (all features and exclusively texture features, separately for CC, MLO views and combined), contralateral asymmetry features, a combination of tumor features and asymmetry features, whole breast mask features, as well as all features combined. For each of the described representations, we trained 6 linear models. The linear models included: L1-regularized logistic regression as selector with L2-regularized logistic regression or elastic net classifier; F-score univariate filter with L2-regularized logistic regression or elastic net classifier; mutual information univariate filter with L2-regularized logistic regression classifier, and an F-score univariate filter with a linear-kernel calibrated support vector machine classifier. The non-linear models (random forest, gradient boosting) were excluded during the initial analyses due to severe overfitting at the available sample size. For all the models, we employed median imputation for missing values, variance thresholding, feature standardization with the Z-score, and feature selection (limited to k = 2-5 features). Hyperparameter tuning was performed using a grid search within repeated stratified k-fold cross validation (CV; 5 folds x 3 repeats) on the training set. The winning model was the model with the highest mean CV area under the receiver operating characteristic curve (ROC AUC) for each endpoint. Both tumors from the same patient could appear in the same CV fold. Given the negligible number of bilateral cases (2/100), no patient-level grouping was applied.
The winning model was applied to the temporally split test set. The achieved discrimination was assessed using the AUC. Confidence intervals (CI) were calculated using bias-corrected, accelerated bootstrapping with 2000 resamples. Statistical significance was calculated using permutation testing (1000 permutations, yielding a minimum p-value of 0.001), and endpoints with permutation p-values of less than 0.05 were considered statistically significant. Benjamini-Hochberg correction with false discovery rate of 0.05 was applied across the five endpoints [12]. The winner model with its optimal hyperparameters was refitted on the entire dataset to obtain the final set of features and their coefficients.
In the paper, we report the generalization performance of the test set. We also assessed the calibration of the model by calculating the Brier score, intercept and slope. After that step, the model was compared to a clinical baseline model (consisting of age at diagnosis, tumor size and BI-RADS group, which were considered the baseline features available at the time of the MMG reporting). The clinical model was trained using L2-regularized logistic regression. The comparison was performed using the DeLong test for paired AUCs. BI-RADS group was excluded from the analysis for BI-RADS endpoint to prevent leakage. To address selection variability, the winning pipeline was refitted on each of the 15 CV folds for cN, cT and advanced stage endpoints, and feature selection frequency was reported. Features selected in ≥ 80% of folds are considered stable. To assess the stability of test set performance, the evaluation was repeated 200 times on random 80% subsamples of the test set. Median AUC and interquartile range were reported.
3. Results
3.1. Cohort Baseline Characteristics and Sample Size
After applying the inclusion and exclusion criteria, 102 cases from 100 patients were included in the analysis. The median patient age in the studied group was 63 years (interquartile range, IQR: 49–70 years), while the median age at diagnosis was 59 years (IQR: 47-67 years). 42% cases were positive for PIK3CA mutation, 49% had clinically suspicious lymph nodes assessed using ultrasound or MRI (cN positivity), 65.6% were classified as BI-RADS 4 and 34.4% as BI-RADS 5 (BI-RADS 6 excluded from analyses as it stands for pathologically confirmed cancer), 41.6% were stage I or II and 58.4% were stage III or IV at diagnosis. 40.2% were clinically staged as cT1 or cT2, while 59.8% as cT3 or cT4. Baseline characteristics of the cohort, including the remaining hormonal, molecular and clinical features, with the split into training and test subsets are presented in Table 1.
We calculated the events-per-variable (EPV) index using the smaller class as the event count. At prespecified 3 maximum features, EPV was 11.3 for cN status, 10.3 for PIK3CA status, 9.7 for clinical stage, 8.3 for cT, and 7.0 for BI-RADS group. It therefore fell below TRIPOD-recommended 10 for a part of the endpoints at k=3 and for all endpoints at k=5. This issue is further addressed in the limitations section.
3.2. Primary Endpoint: Prediction of cN Status
The primary results of the analysis are presented in Table 2. MMG-based radiomics were effective for prediction of the clinical nodal status, clinical tumor stage and overall disease stage in this cohort. The model failed to discriminate BI-RADS 4 vs 5 groups and the presence of PIK3CA mutation in the studied group. For the primary endpoint, clinical nodal status prediction (cN0 vs cN1+), the best feature subset was texture features from the MLO projection for the tumor ROI, and the best statistical model was model-based feature selection with L1-regularized logistic regression followed by classification with L2-regularized logistic regression. The CV AUC was 0.684, with the test AUC being 0.726 (95% CI: 0.50–0.89), representative of an acceptable performance level at this sample size. Statistical significance was confirmed by permutation testing, with a p-value of 0.01 and Benjamini-Hochberg adjusted q-value of 0.017. Features selected for prediction of cN status were: the GLCM Information Correlation 1 (cm_info_corr1, β=−0.052), the GLDZM grey level variance (dzm_gl_var, β=+0.049), the GLDZM zone distance entropy (dzm_zd_entr, β=+0.137), and the NGLDM low dependence low grey level emphasis (ngl_ldlge, β=−0.103).
3.3. Prediction of cT Status and Overall Disease Stage
We observed stronger results for two of the secondary endpoints: the differentiation of early vs advanced clinical tumor status (cT1-2 vs 3-4) and clinical stage (I-II vs III-IV). For the cT status, the CV AUC was 0.824 and the temporally split test set AUC was 0.792 (95% CI: 0.58–0.93). Similarly, for the advanced stage prediction, CV AUC was 0.763 and test set AUC was 0.778 (CI: 0.57–0.92). Both endpoints were stable through the BH FDR correction. Radiomic features selected for the positive endpoints are presented together with their coefficients and prevalence across folds are shown in Table 3. Interestingly, for clinical stage prediction, the refit features were not consistently selected during CV (<13%), but intensity-based energy (stat_energy) was selected in 14/15 folds. This likely results from L1 feature selection instability.
3.4. Prediction of BI-RADS Group Concordance and PIK3CA Mutation
Remaining two of the secondary endpoints were clearly negative: differentiation between BI-RADS 4 and 5 groups (test AUC: 0.300) and prediction of PIK3CA status (test AUC: 0.432). A detailed table of calibration metrics for all models is provided in Table 4. ROC curves for all the endpoints are shown in Figure 3.
3.5. Comparison with the Clinical Baseline
The results were compared to a clinical model, which included the quantifiable features available at the point of MMG acquisition and reporting (age + BI-RADS + tumor size). The model was evaluated for cN and clinical stage only – cT was excluded because it is itself a derivative of tumor size. For cT, the clinical model included only age and BI-RADS category. The radiomic model outperformed the clinical baseline in all three positive endpoints (Table 5), however the differences were not significant. The study was not powered to detect AUC differences between the radiomic models and a clinical baseline at the magnitudes observed.
4. Discussion
The majority of radiomics research in BC is based on features derived from MR imaging. MRI provides much superior, three-dimensional visualization of the breast and tumor tissue. MRI-based radiomics predict complex outcomes, such as response to chemotherapy, presence of the triple-negative subtype, assessing receptor status and Ki-67 expression, among others [5,17,18,19]. However, the modality is much less frequently used in clinical practice and rarely employed as screening or an initial diagnostic method. By contrast, MMG is widely and easily available around the world, and most likely to be the first imaging performed when a suspicious breast mass is reported by the patient or identified by the physician during physical examination. Therefore, reliably extracting useful clinical data from a widely available imaging modality would provide a much-needed solution for risk stratification and triage of patients, with the prioritization of further diagnosis in those with higher suspicion of advanced or metastatic disease, especially in the age of BC overdiagnosis and possible overtreatment [20,21]. The body of literature, while present, is more limited for MMG than for other modalities [22,23].
In this study, we focused on the prediction of disease burden and PIK3CA status based on MMG-based radiomics. Among the studied endpoints, three – prediction of cN status, cT status and overall disease stage – showed statistically significant temporally validated discrimination after BH-FDR correction. The temporal split, fixed throughout the analyses, with the most recently diagnosed 30% of cases assigned to the test subgroup simulated prospective deployment.
Prediction of the cN status using MMG-based radiomics was chosen as a primary endpoint for its clinical relevance to the disease risk stratification and choice between surgical intervention and neoadjuvant chemotherapy. Clinical status, based on either ultrasound or MRI, was chosen instead of the surgical staging because the majority of the patients included in the study underwent neoadjuvant chemotherapy, often achieving postoperative partial or complete remission. Therefore, the surgical staging does not represent the initial nodal status at the point of MMG acquisition. The radiomic model achieved a temporally validated test-set AUC of 0.726. Four leading features for the predictive power were related to tumor texture, derived from the MLO projection. They encode the intratumoral heterogeneity, and we hypothesize that this mammographic heterogeneity could reflect the underlying tumor biology associated with nodal involvement, potentially including stromal disorganization and microcalcification patterns previously linked to advanced disease [24,25]. Further work, optimally also encompassing radiopathomics, is needed to explore this theory. Previous research, including the work by Tan et al. and Yang et al., among others, confirms the ability of MMG-based radiomics to predict lymph node metastases [26,27]. Although our test set AUC is lower than several of the previously reported MMG-based nodal status prediction models, this likely results from the more conservative temporal-split validation we applied. An external cohort and a larger calibration set will be required before the model can be considered clinically useful.
Prediction of cT and the overall clinical stage by MMG-based radiomics is, by its definition, partly explained by tumor size: tumor diameter, which can be measured directly on a mammogram, defines the cT category and is a major component of clinical stage. GLDZM large distance high grey level emphasis, the dominant feature for the cT model, rewards tumor regions that have many high-intensity zones located deep inside the lesion. Therefore, this feature carries additional signal intensity and tumor texture components. The clinical stage prediction model retained a related set of intra-tumoral intensity and zone-distance descriptors (global intensity peak, GLDZM small distance emphasis), which carry additional signal intensity and texture information. This pattern can serve as evidence that MMG-based radiomics can capture the biological phenotype of the disease and that some features track tumor aggressiveness in the same sense that the pathologist's nuclear grade and mitotic index do.
Two of the endpoints – the prediction of PIK3CA mutation and radiologist-assigned BI-RADS group – failed, with large CV-test AUC differences typical of overfitting and low EPV. Nevertheless, the negative results are retained deliberately, not to overestimate the potential yield of MMG-based radiomics. Interestingly, recent work by Yao et al. focused on the prediction of PIK3CA mutation in BC and found positive results (AUC 0.718) for the prediction of this genetic alteration, and even stronger results for ultrasound-based radiomics and a combined model [28]. This contradicts our findings and could be either a result of a larger sample (186 patients) or different statistical methodology. Further development of PIK3CA mutation presence prediction is key for earlier qualification for treatment with alpelisib in patients with advanced BC (29). Nevertheless, the majority of the research on MMG-based radiomics still focuses on fundamental cancer risk stratification [30].
We acknowledge the limitations of our study. First, the sample size is small given the number of variables produced by the radiomics software; EPV fell below the TRIPOD-recommended threshold, and the study was not powered to separate between-model AUC differences of the magnitude observed. The study is single-center, with no external validation cohort; however, the temporal split partially addresses this issue. Further limitations are the single-reader segmentation and suboptimal calibration of two positive endpoints: cN prediction, with slope of 3.762 suggesting overconfident extreme predictions, and cT prediction, with a slope of 0.444, typical of compressed predictions. A recalibration on a larger, external cohort would benefit the clinical applicability of the results. The cohort included mammograms acquired on two systems (Siemens and Hologic). This heterogeneity arguably enhances the generalizability of our findings beyond a single-scanner setting; however, the inter-vendor radiomic variability was not formally addressed. Our IBSI-compliant pipeline applies standardized preprocessing and discretization to all images to partially mitigate this issue.
We treat the pre-specified pipeline, and the blinded, leakage-proof temporal test set as significant methodological strengths. IBSI-compliant feature extraction, multiple-testing correction across endpoints and retention of negative endpoints also strengthen the results. A larger, externally validated study is required to confirm our findings, in particular regarding the cN status prediction, and to properly compare them to the clinical baseline.
5. Conclusions
Our study provides evidence that radiomic data extracted from mammography can discriminate between cN0 and cN-positive disease; that tumor texture features change with an increasing clinical tumor stage, and that radiomic features correspond to overall disease burden in BC. Conversely, our study found no correlation between radiomic features and PIK3CA mutational status in BC patients and showed no concordance between radiomic features and radiologist-assessed BI-RADS group. However, further - larger and externally validated - studies are needed to establish clinical utility and possibly examine other domains that can be predicted by MMG-derived radiomics.
Supplementary Materials
The following supporting information can be downloaded at the website of this paper posted on Preprints.org. The dictionary of the radiomic features extracted by Z-Rad is available in the Supplementary Materials.
Author Contributions
GC: conceptualization, data curation, formal analysis, investigation, methodology, visualization, resources, writing – original draft preparation, writing – review and editing. RS: data curation, investigation, writing – review and editing. HSG: investigation, formal analysis, resources, writing – review and editing. MF: investigation, formal analysis, resources, writing – review and editing. STL: supervision, writing – review and editing. MG: supervision, writing – review and editing. SG: supervision, project administration.
Funding
This research received no external funding.
Institutional Review Board Statement
Not applicable. Patient consent and Institutional Review Board approval were not required as the study was conducted based on clinical data acquired during the diagnostic and treatment process.
Informed Consent Statement
Not applicable.
Data Availability Statement
The MMG datasets cannot be publicly shared per EU data protection regulations. Anonymized, extracted radiomic data is available at request.
Acknowledgments
During the preparation of this study, the authors used Claude Code for statistical analysis code debugging. The authors have reviewed and edited the output and take full responsibility for the content of this publication.
Conflicts of Interest
Department of Radiation Oncology, University Hospital Zurich has research and teaching agreements with Siemens Healthineers.
References
- Data Explorer | ECIS - European Cancer Information System [Internet]. Available from: https://ecis.jrc.ec.europa.eu/data-explorer#/estimates/estimated-incidence-mortality-by-country-summary?indicator=MO&sex=0&yearFrom=2024&yearTo=2024&ageFrom=0&ageTo=85%2B&cancerEntity=29&country=EU27 (cited 3 May 2026).
- Badal, K.; Staib, J.; Tice, J.A.; Kim, M.O.; Eklund, M.; Wilson, L.; et al. National yearly cost of breast cancer screening in the USA and projected cost of advocated guidelines: a simulation study with life table modelling. BMJ Open 2025, 15(2), e089428. [Google Scholar] [CrossRef] [PubMed] [PubMed Central]
- Lehman, C.D.; Arao, R.F.; Sprague, B.L.; Lee, J.M.; Buist, D.S.M.; Kerlikowske, K.; et al. National Performance Benchmarks for Modern Screening Digital Mammography: Update from the Breast Cancer Surveillance Consortium. Radiology 2017, 283(1), 49–58. [Google Scholar] [CrossRef] [PubMed]
- Lambin, P.; Rios-Velazquez, E.; Leijenaar, R.; Carvalho, S.; Van Stiphout, R.G.P.M.; Granton, P.; et al. Radiomics: Extracting more information from medical images using advanced feature analysis. Eur. J. Cancer 2012, 48(4), 441–6. [Google Scholar] [CrossRef] [PubMed]
- Wang, Q.; Lin, Y.; Ding, C.; Guan, W.; Zhang, X.; Jia, J.; et al. Multi-modality radiomics model predicts axillary lymph node metastasis of breast cancer using MRI and mammography. Eur. Radiol.;PubMed 2024, 34(9), 6121–31. [Google Scholar] [CrossRef] [PubMed]
- Huang, Y.; Shi, Z.; Zhu, T.; Zhou, T.; Li, Y.; Li, W.; et al. Longitudinal MRI-Driven Multi-Modality Approach for Predicting Pathological Complete Response and B Cell Infiltration in Breast Cancer. Adv. Sci. 2025, 12(12), 2413702. [Google Scholar] [CrossRef] [PubMed]
- Lin, J.Y.; Ye, J.Y.; Chen, J.G.; Lin, S.T.; Lin, S.; Cai, S.Q. Prediction of Receptor Status in Radiomics: Recent Advances in Breast Cancer Research. Acad. Radiol. 2024, 31(7), 3004–14. [Google Scholar] [CrossRef] [PubMed]
- Xie, H.; Tan, T.; Li, Q.; Li, T. Revolutionizing HER-2 assessment: multidimensional radiomics in breast cancer diagnosis. BMC Cancer 2025, 25(1), 265. [Google Scholar] [CrossRef] [PubMed]
- Collins, G.S.; Moons, K.G.M.; Dhiman, P.; Riley, R.D.; Beam, A.L.; Van Calster, B.; et al. TRIPOD+AI statement: updated guidance for reporting clinical prediction models that use regression or machine learning methods. BMJ 2024, 385, e078378. [Google Scholar] [CrossRef] [PubMed]
- Zwanenburg, A.; Vallières, M.; Abdalah, M.A.; Aerts, H.J.W.L.; Andrearczyk, V.; Apte, A.; et al. The Image Biomarker Standardization Initiative: Standardized Quantitative Radiomics for High-Throughput Image-based Phenotyping. Radiology 2020, 295(2), 328–38. [Google Scholar] [CrossRef] [PubMed]
- Kikinis, R.; Pieper, S.D.; Vosburgh, K.G. 3D Slicer: A Platform for Subject-Specific Image Analysis, Visualization, and Clinical Support. In Intraoperative Imaging and Image-Guided Therapy; Jolesz, F.A., Ed.; Springer: New York, NY, 2014; pp. 277–89. [Google Scholar] [CrossRef]
- Benjamini, Y.; Hochberg, Y. Controlling the False Discovery Rate: A Practical and Powerful Approach to Multiple Testing. J. R Stat. Soc. Ser. B Methodol. 1995, 57(1), 289–300. [Google Scholar] [CrossRef]
- Pedregosa, F.; Varoquaux, G.; Gramfort, A.; Michel, V.; Thirion, B.; Grisel, O.; et al. Scikit-learn: Machine Learning in Python. J. Mach. Learn Res. 2011, 12(null), 2825–30. [Google Scholar]
- Seabold, S.; Perktold, J. Statsmodels: Econometric and Statistical Modeling with Python. 9th Python in Science Conference, 2010. [Google Scholar] [CrossRef]
- Virtanen, P.; Gommers, R.; Oliphant, T.E.; Haberland, M.; Reddy, T.; Cournapeau, D.; et al. SciPy 1.0: fundamental algorithms for scientific computing in Python. Nat. Methods 2020, 17(3), 261–72. [Google Scholar] [CrossRef] [PubMed]
- Hunter, J.D. Matplotlib: A 2D Graphics Environment. Comput Sci. Eng. 2007, 9(3), 90–5. [Google Scholar] [CrossRef]
- Tabnak, P.; HajiEsmailPoor, Z.; Baradaran, B.; Pashazadeh, F.; Aghebati Maleki, L. MRI-Based Radiomics Methods for Predicting Ki-67 Expression in Breast Cancer: A Systematic Review and Meta-analysis. Acad. Radiol. 2024, 31(3), 763–87. [Google Scholar] [CrossRef] [PubMed]
- Braman, N.M.; Etesami, M.; Prasanna, P.; Dubchuk, C.; Gilmore, H.; Tiwari, P.; et al. Intratumoral and peritumoral radiomics for the pretreatment prediction of pathological complete response to neoadjuvant chemotherapy based on breast DCE-MRI. Breast Cancer Res. 2017, 19(1), 57. [Google Scholar] [CrossRef] [PubMed]
- Leithner, D.; Horvat, J.V.; Marino, M.A.; Bernard-Davila, B.; Jochelson, M.S.; Ochoa-Albiztegui, R.E.; et al. Radiomic signatures with contrast-enhanced magnetic resonance imaging for the assessment of breast cancer receptor status and molecular subtypes: initial results. Breast Cancer Res. 2019, 21(1), 106. [Google Scholar] [CrossRef] [PubMed]
- Pak, L.M.; Morrow, M. Addressing the problem of overtreatment in breast cancer. Expert Rev Anticancer Ther 2022, 22(5), 535–48. [Google Scholar] [CrossRef] [PubMed] [PubMed Central]
- Flemban, A.F. Overdiagnosis Due to Screening Mammography for Breast Cancer among Women Aged 40 Years and Over: A Systematic Review and Meta-Analysis. J Pers Med. 2023, 13(3), 523. [Google Scholar] [CrossRef] [PubMed] [PubMed Central]
- Siviengphanom, S.; Gandomkar, Z.; Lewis, S.J.; Brennan, P.C. Mammography-based Radiomics in Breast Cancer: A Scoping Review of Current Knowledge and Future Needs. Acad. Radiol.;PubMed 2022, 29(8), 1228–47. [Google Scholar] [CrossRef] [PubMed]
- Letchumanan, N.; Wong, J.H.D.; Tan, L.K.; Ab Mumin, N.; Ng, W.L.; Chan, W.Y.; et al. A Radiomics Study: Classification of Breast Lesions by Textural Features from Mammography Images. J. Digit Imaging 2023, 36(4), 1533–40. [Google Scholar] [CrossRef] [PubMed] [PubMed Central]
- Giorello, M.B.; Borzone, F.R.; Padin, M.; del, R.; Mora, M.F.; Wernicke, A.; Labovsky, V.; et al. Breast microcalcifications as indicators of bone metastasis risk in early-stage breast cancer. Sci. Rep. 2025, 15(1), 35311. [Google Scholar] [CrossRef] [PubMed]
- Dekker, T.J.A.; Charehbili, A.; Smit, V.T.H.B.M.; ten Dijke, P.; Meershoek-Klein Kranenbarg, E.; van de Velde, C.J.H.; et al. Disorganised stroma determined on pre-treatment breast cancer biopsies is associated with poor response to neoadjuvant chemotherapy: Results from the NEOZOTAC trial. Mol. Oncol. 2015, 9(6), 1120–8. [Google Scholar] [CrossRef] [PubMed] [PubMed Central]
- Tan, H.; Wu, Y.; Bao, F.; Zhou, J.; Wan, J.; Tian, J.; et al. Mammography-based radiomics nomogram: a potential biomarker to predict axillary lymph node metastasis in breast cancer. Br. J. Radiol. 2020, 93(1111), 20191019. [Google Scholar] [CrossRef] [PubMed]
- Yang, J.; Wang, T.; Yang, L.; Wang, Y.; Li, H.; Zhou, X.; et al. Preoperative Prediction of Axillary Lymph Node Metastasis in Breast Cancer Using Mammography-Based Radiomics Method. Sci. Rep. 2019, 9(1), 4429. [Google Scholar] [CrossRef] [PubMed]
- Yao, J.; Li, X.; Chai, W.; Li, A.; Chen, X.; Zhou, W.; et al. Predicting PIK3CA mutation in breast cancer with machine learning based multimodal image radiomics. Eur. J. Med. Res. 2025, 30(1), 1161. [Google Scholar] [CrossRef] [PubMed] [PubMed Central]
- André, F.; Ciruelos, E.M.; Juric, D.; Loibl, S.; Campone, M.; Mayer, I.A.; et al. Alpelisib plus fulvestrant for PIK3CA-mutated, hormone receptor-positive, human epidermal growth factor receptor-2–negative advanced breast cancer: final overall survival results from SOLAR-1. Ann. Oncol.;PubMed 2021, 32(2), 208–17. [Google Scholar] [CrossRef] [PubMed]
- Suzuki, Y.; Hanaoka, S.; Tanabe, M.; Yoshikawa, T.; Seto, Y. Predicting Breast Cancer Risk Using Radiomics Features of Mammography Images. J Pers Med. 2023, 13(11), 1528. [Google Scholar] [CrossRef] [PubMed] [PubMed Central]
Figure 1.
CONSORT-style cases flow diagram for inclusion in the study. 136 breast cancer cases from 134 female patients were screened from the institutional archive. The exclusion criteria included lack of histopathological confirmation of breast cancer, lack of digital mammogram in the hospital’s archives, lack of written radiologist’s report, insufficient quality of imaging and faulty genetic testing. 102 cases from 100 patients were eventually included in the study.
Figure 1.
CONSORT-style cases flow diagram for inclusion in the study. 136 breast cancer cases from 134 female patients were screened from the institutional archive. The exclusion criteria included lack of histopathological confirmation of breast cancer, lack of digital mammogram in the hospital’s archives, lack of written radiologist’s report, insufficient quality of imaging and faulty genetic testing. 102 cases from 100 patients were eventually included in the study.
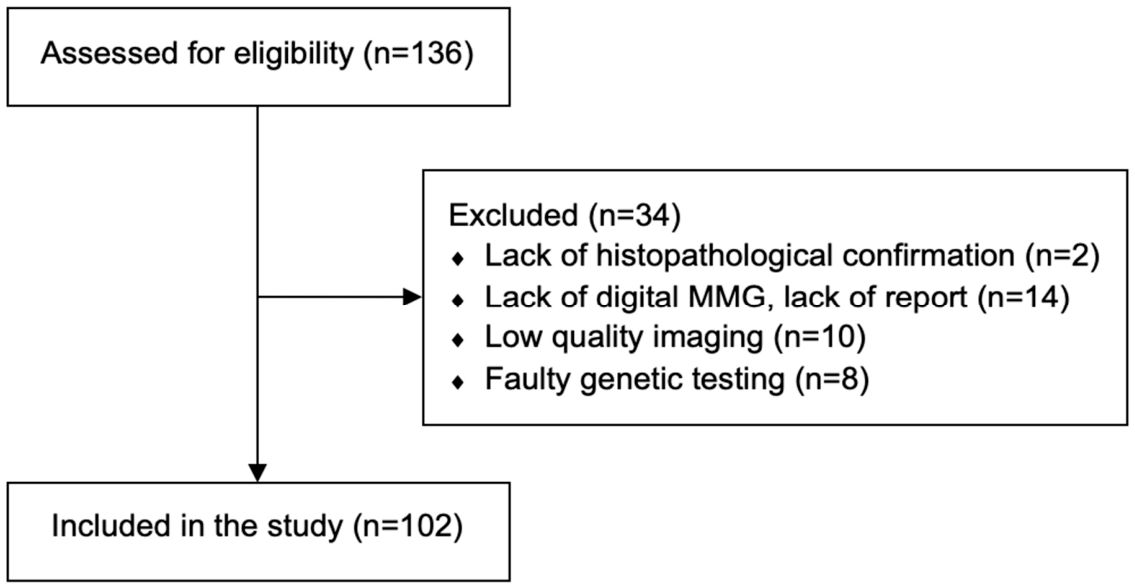
Figure 2.
Methodological workflow of the study. Abbreviations: CC, craniocaudal; MLO, mediolateral oblique; L1-LR, L1-regularized regression; ANOVA, Analysis of Variance; ROC-AUC, area under the receiver operating characteristic curve; CI, confidence interval BCa, Bias-Corrected and Accelerated; BH-FDR, Benjamini-Hochberg false discovery rate; cN, clinical nodal status; cT, clinical tumor status; BI-RADS, Breast Imaging Reporting and Data System.
Figure 2.
Methodological workflow of the study. Abbreviations: CC, craniocaudal; MLO, mediolateral oblique; L1-LR, L1-regularized regression; ANOVA, Analysis of Variance; ROC-AUC, area under the receiver operating characteristic curve; CI, confidence interval BCa, Bias-Corrected and Accelerated; BH-FDR, Benjamini-Hochberg false discovery rate; cN, clinical nodal status; cT, clinical tumor status; BI-RADS, Breast Imaging Reporting and Data System.
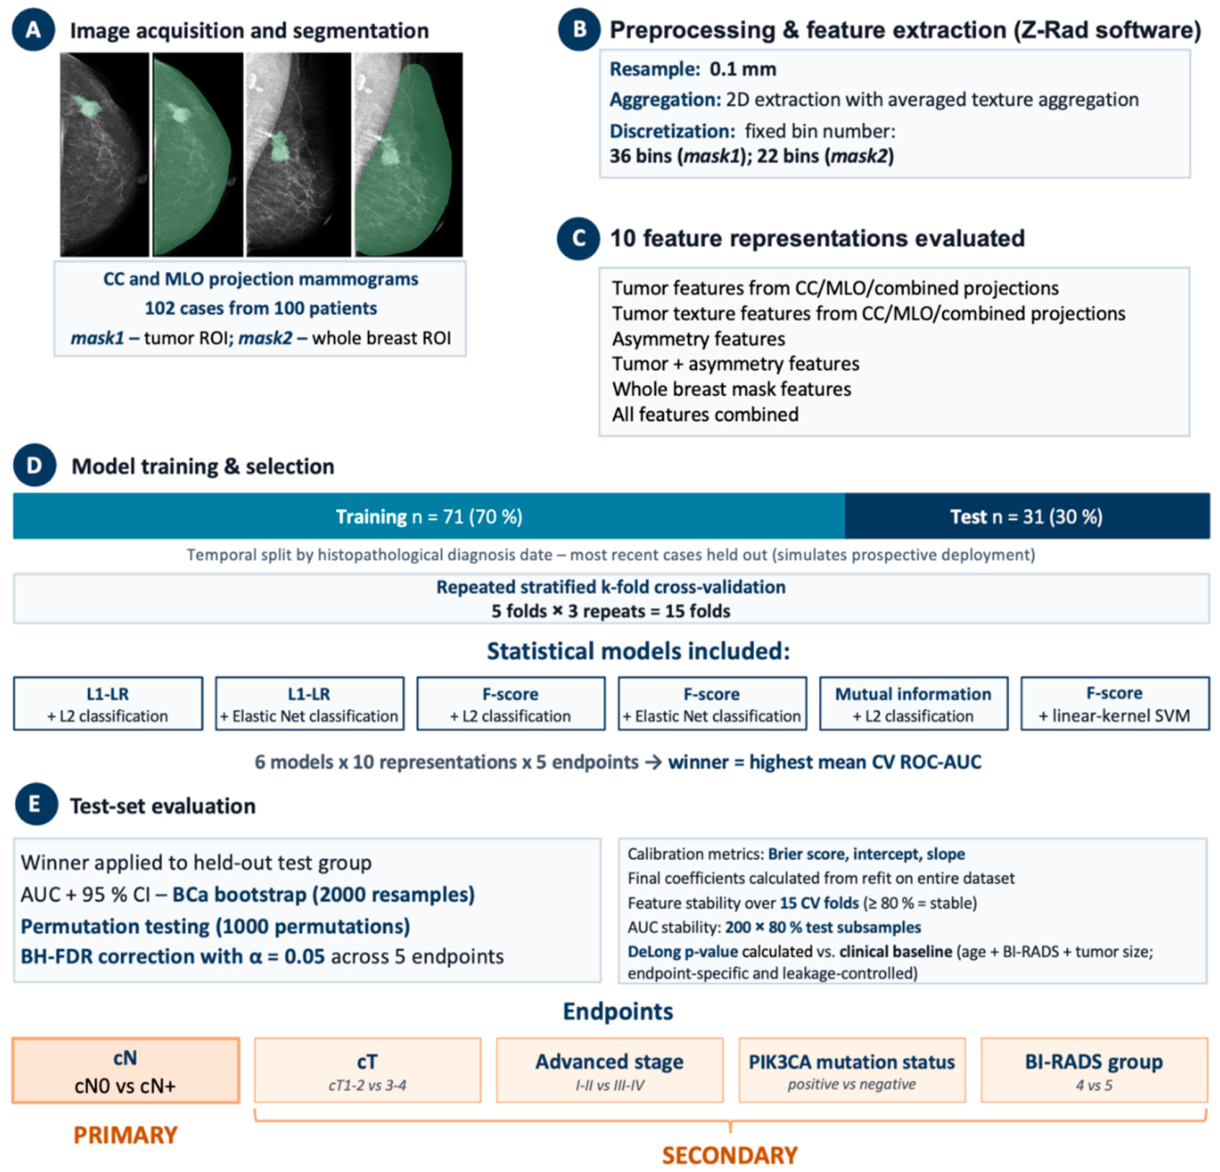
Figure 3.
ROC curves for the temporally held-out test set for all five studied endpoints with the AUC values and 95% confidence intervals. The positive endpoints include prediction of clinical nodal status (cN0 vs cN-positive), clinical tumor status (cT1-2 vs 3-4) and overall clinical disease stage (stage I-II vs III-IV). Negative endpoints include prediction of the PIK3CA mutation and differentiation between radiologist-assessed BI-RADS groups 4 and 5. Abbreviations: AUC ROC, area under the receiver operating characteristic curve; cN, clinical nodal status; cT, clinical tumor status; BI-RADS, Breast Imaging Reporting and Data System.
Figure 3.
ROC curves for the temporally held-out test set for all five studied endpoints with the AUC values and 95% confidence intervals. The positive endpoints include prediction of clinical nodal status (cN0 vs cN-positive), clinical tumor status (cT1-2 vs 3-4) and overall clinical disease stage (stage I-II vs III-IV). Negative endpoints include prediction of the PIK3CA mutation and differentiation between radiologist-assessed BI-RADS groups 4 and 5. Abbreviations: AUC ROC, area under the receiver operating characteristic curve; cN, clinical nodal status; cT, clinical tumor status; BI-RADS, Breast Imaging Reporting and Data System.
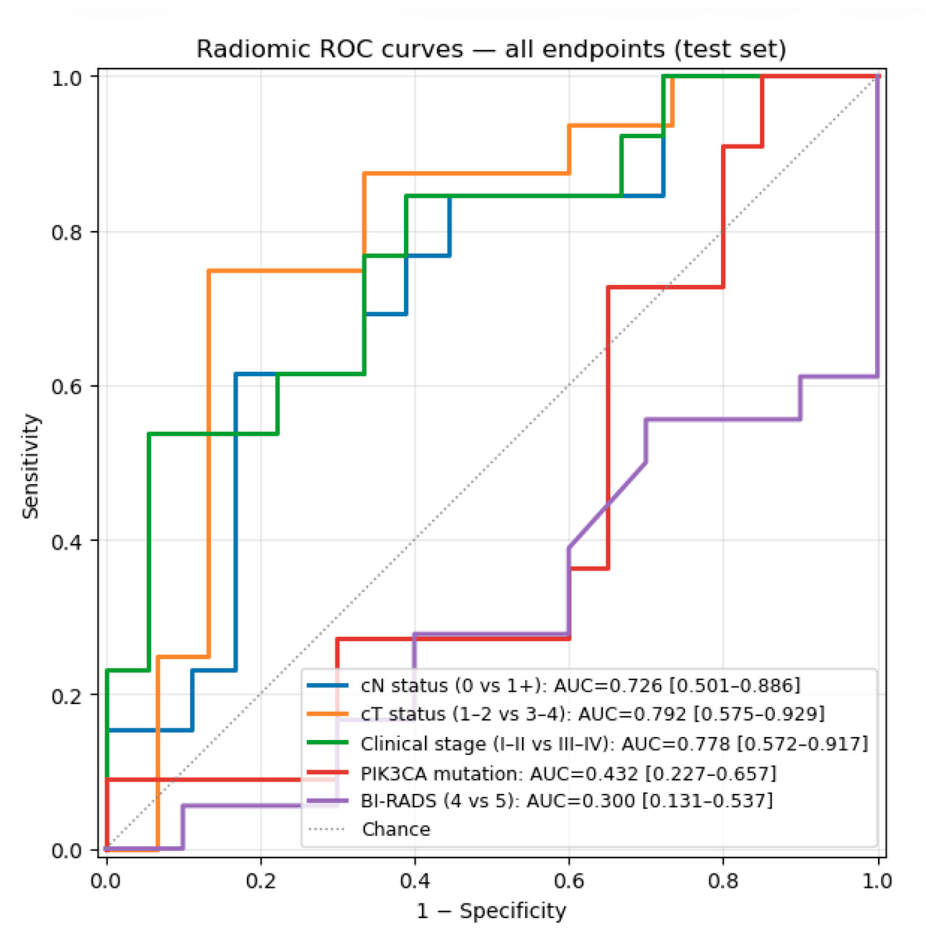

Table 1.
Baseline characteristics of the study cohort (n=102 cases from 100 patients).
| Variable | Overall (n=102) | Training (n=71) | Test (n=31) |
|---|---|---|---|
| Age, years | 63 [49–70]; 60.5 ± 13.4; 35–92 | 63 [51–70]; 60.6 ± 12.8 | 61 [49–73]; 60.2 ± 14.9 |
| Age at diagnosis, years | 59 [47–67]; 57.4 ± 13.7; 25–91 | 59 [48–65]; 56.7 ± 13.3 | 59 [48–72]; 58.8 ± 14.7 |
| Tumor size from pathology report, mm (n=73) | 27 [20–35]; 33.0 ± 27.3; 5–200 | 29 [20–35]; 30.7 ± 19.1 | 27 [19–40]; 37.8 ± 39.1 |
| Ki67, % (n=97) | 20 [10–60]; 32.3 ± 29.1 | 20 [6–38]; 26.0 ± 25.1 | 40 [15–70]; 45.8 ± 32.7 |
| ER positive (ER1–3), n (%) | 85 (83.3) | 61 (85.9) | 24 (77.4) |
| ER negative (ER0), n (%) | 15 (14.7) | 8 (11.3) | 7 (22.6) |
| PR positive (PR1–3), n (%) | 76 (74.5) | 51 (71.8) | 25 (80.6) |
| PR negative (PR0), n (%) | 24 (23.5) | 18 (25.4) | 6 (19.4) |
| HER2-positive, n (%) | 35 (34.3) | 26 (36.6) | 9 (29.0) |
| HER2-equivocal, n (%) | 36 (35.3) | 25 (35.2) | 11 (35.5) |
| HER2-negative, n (%) | 29 (28.4) | 18 (25.4) | 11 (35.5) |
| Luminal B, n (%) | 51 (50.0) | 35 (49.3) | 16 (51.6) |
| Luminal A, n (%) | 31 (30.4) | 23 (32.4) | 8 (25.8) |
| Triple-negative, n (%) | 10 (9.8) | 5 (7.0) | 5 (16.1) |
| HER2-enriched, n (%) | 4 (3.9) | 3 (4.2) | 1 (3.2) |
| NOS histology, n (%) | 83 (81.4) | 54 (76.1) | 29 (93.5) |
| Lobular histology, n (%) | 14 (13.7) | 13 (18.3) | 1 (3.2) |
| Grade G1, n (%) | 37 (36.3) | 29 (40.8) | 8 (25.8) |
| Grade G2, n (%) | 48 (47.1) | 35 (49.3) | 13 (41.9) |
| Grade G3, n (%) | 16 (15.7) | 7 (9.9) | 9 (29.0) |
| BI-RADS 4, n (%) | 31 (30.4) | 21 (29.6) | 10 (32.3) |
| BI-RADS 5, n (%) | 59 (57.8) | 42 (59.2) | 17 (54.8) |
| BI-RADS 6, n (%) | 5 (4.9) | 4 (5.6) | 1 (3.2) |
| cT1, n (%) | 13 (12.7) | 8 (11.3) | 5 (16.1) |
| cT2, n (%) | 47 (46.1) | 37 (52.1) | 10 (32.3) |
| cT3, n (%) | 23 (22.5) | 15 (21.1) | 8 (25.8) |
| cT4, n (%) | 18 (17.6) | 10 (14.1) | 8 (25.8) |
| cN0, n (%) | 52 (51.0) | 34 (47.9) | 18 (58.1) |
| cN1, n (%) | 41 (40.2) | 32 (45.1) | 9 (29.0) |
| cN2/cN3, n (%) | 9 (8.8) | 5 (7.0) | 4 (12.9) |
| Stage I, n (%) | 10 (9.8) | 5 (7.0) | 5 (16.1) |
| Stage II, n (%) | 49 (48.0) | 36 (50.7) | 13 (41.9) |
| Stage III, n (%) | 27 (26.5) | 15 (21.1) | 12 (38.7) |
| Stage IV, n (%) | 15 (14.7) | 14 (19.7) | 1 (3.2) |
| PIK3CA mutated, n (%) | 42 (41.2) | 31 (43.7) | 11 (35.5) |
| Local recurrence, n (%) | 9 (8.8) | 5 (7.0) | 4 (12.9) |
| Distant metastasis, n (%) | 49 (48.0) | 41 (57.7) | 8 (25.8) |
| Follow-up time/OS (mo) (n=101) | 52 [40–65] | 59 [49–78] | 46 [28–50] |
Continuous variables: median [interquartile range, IQR]; mean ± standard deviation (SD); range. Categorical variables: n (%). Tumor size (from pathology report) missing in 29 cases (median-imputed whenever used in analyses). Abbreviations: ER, estrogen receptor; PR, progesterone receptor; HER2, human epidermal growth factor receptor 2; NOS, not otherwise specified; G, grade; cN, clinical nodal status; cT, clinical tumor stage; BI-RADS, Breast Imaging Reporting and Data System; OS, overall survival.
Table 2.
Primary results of the analysis.
| Endpoint | n | Prevalence | Representation | Model | CV AUC | Test AUC (95% CI) | Permutation p-value | B-H q-value |
|---|---|---|---|---|---|---|---|---|
| cN status (0 vs 1+) | 102 | 49.0% | Tumor texture, MLO | L1 + L2 | 0.684 | 0.726 (0.501–0.886) | 0.010 | 0.017 |
| Clinical stage (I–II vs III–IV) | 101 | 41.6% | All tumor features, MLO | L1 + elastic net | 0.763 | 0.778 (0.572–0.917) | 0.003 | 0.010 |
| cT (1–2 vs 3–4) | 102 | 40.2% | Tumor texture (combined projections) | ANOVA + elastic- net | 0.824 | 0.792 (0.575–0.929) | 0.004 | 0.010 |
| PIK3CA mutation status (positive vs negative) | 100 | 42.0% | All tumor features | L1 + L2 | 0.721 | 0.432 (0.227–0.657) | 0.733 | 0.917 |
| BI-RADS group (4 vs 5) | 90 | 65.6% | Tumor + asymmetry | L1 + elastic net | 0.816 | 0.300 (0.131–0.537) | 0.962 | 0.962 |
CV: 5 x 3 repeated stratified k-fold cross-validation on training set. Test AUC: temporally held-out 30% subset. 95% CI: bias-corrected bootstrap (2000 resamples). Permutation p-value: 1000-permutation test on the test set. B-H q-value: Benjamini–Hochberg false discovery rate adjustment (α = 0.05). Abbreviations: cN, clinical nodal status; cT, clinical tumor stage; BI-RADS, Breast Imaging Reporting and Data System, CV, cross-validation; AUC, area under the receiver operating characteristic curve; CI, confidence interval; CC, craniocaudal; MLO, mediolateral oblique.
Table 3.
Selected features for the positive endpoints after model refit on all available cases.
| Endpoint | Feature | Coefficient | Folds selected (out of 15) |
|---|---|---|---|
| cN status | cm_info_corr1_2D_avg (Tumor MLO) | −0.05 | 4 (27%) |
| dzm_gl_var_2D (Tumor MLO) | +0.05 | <2 (<13%) | |
| dzm_zd_entr_2D (Tumor MLO) | +0.14 | 10 (67%) | |
| ngl_ldlge_2D (Tumor MLO) | −0.10 | 3 (20%) | |
| Clinical stage | dzm_sde_2D (Tumor MLO) | −0.19 | <2 (<13%) |
| dzm_sdlge_2D (Tumor MLO) | 0 | <2 (<13%) | |
| loc_peak_glob (Tumor MLO) | +0.36 | <2 (<13%) | |
| cT status | dzm_ldhge_2D (Tumor CC) | +0.90 | 15 (100%) |
| dzm_zd_var_2D (Tumor CC) | 0 | 7 (47%) | |
| ngt_complexity (Tumor CC) | +0.60 | 8 (53%) | |
| rlm_rlnu_2D_avg (Tumor CC) | −0.05 | 2 (13%) |
Coefficient of 0 implies that L1 eliminated the feature in the final model despite its inclusion in the feature subset. The stability column shows selection frequency across the 15 cross-validation folds (5 x 3 repeats). Abbreviations: cN, clinical nodal status; cT, clinical tumor stage; CC, craniocaudal; MLO, mediolateral oblique. Definitions of the selected radiomic features are available in the Supplementary Materials.
Table 4.
Calibration and stability metrics.
| Endpoint | Brier score | Calibration intercept | Calibration slope |
|---|---|---|---|
| cN status | 0.229 | −0.431 | 3.762 |
| Clinical stage | 0.211 | −0.409 | 2.542 |
| cT status | 0.202 | +0.052 | 0.444 |
| PIK3CA status | 0.337 | −0.657 | −0.063 |
| BI-RADS group | 0.342 | +0.881 | −0.828 |
Abbreviations: cN, clinical nodal status; cT, clinical tumor stage; BI-RADS, Breast Imaging Reporting and Data System, CV, cross-validation; AUC, area under the receiver operating characteristic curve.
Table 5.
Performance of the radiomic and combined models in comparison with the clinical baseline (age ± BI-RADS group ± tumor size).
Table 5.
Performance of the radiomic and combined models in comparison with the clinical baseline (age ± BI-RADS group ± tumor size).
| Endpoint | Clinical AUC | Radiomic AUC | Clinical + Radiomic AUC | DeLong (Radiomic vs Clinical) | DeLong (Combined vs Clinical) |
|---|---|---|---|---|---|
| cN status | 0.697 | 0.726 | 0.821 | 0.819 | 0.201 |
| Clinical stage | 0.726 | 0.778 | 0.825 | 0.687 | 0.107 |
| cT status | 0.537* | 0.792 | 0.792 | 0.108 | 0.108 |
| PIK3CA status | 0.605 | 0.432 | 0.464 | 0.285 | 0.336 |
| BI-RADS group | 0.592* | 0.300 | 0.275 | 0.034 | <0.001 |
* For cT prediction, a clinical model included only age at diagnosis and BI-RADS group. For BI-RADS prediction, the clinical model included only age at diagnosis and tumor size. Abbreviations: cN, clinical nodal status; cT, clinical tumor stage; BI-RADS, Breast Imaging Reporting and Data System, CV, cross-validation; AUC, area under the receiver operating characteristic curve.
Disclaimer/Publisher’s Note: The statements, opinions and data contained in all publications are solely those of the individual author(s) and contributor(s) and not of MDPI and/or the editor(s). MDPI and/or the editor(s) disclaim responsibility for any injury to people or property resulting from any ideas, methods, instructions or products referred to in the content. |
© 2026 by the authors. Licensee MDPI, Basel, Switzerland. This article is an open access article distributed under the terms and conditions of the Creative Commons Attribution (CC BY) license (http://creativecommons.org/licenses/by/4.0/).
Copyright: This open access article is published under a Creative Commons CC BY 4.0 license, which permit the free download, distribution, and reuse, provided that the author and preprint are cited in any reuse.


