

Submitted:
30 June 2026
Posted:
01 July 2026
You are already at the latest version
Abstract
Urban heat islands (UHI) represent one of the most consequential manifestations of anthropogenic land-surface modification, yet their behavior in arid and semi-arid environments remains insufficiently characterized over long temporal horizons. This study presents a comprehensive, multi-decadal (1995–2024) analysis of surface UHI dynamics across five Moroccan cities—Laayoune, Béni Mellal, Taza, Tangier, and Ifrane—selected to span the country’s pronounced climatic gradient from hyper-arid to humid mountainous settings. Using a reproducible Google Earth Engine workflow, monthly land surface temperature (LST) and normalized difference vegetation index (NDVI) were derived from multi-mission Landsat Collection 2 Level-2 products, complemented by ERA5-Land air temperature and humidity reanalysis data and Copernicus C3S annual land cover classifications. A standardized eight-direction radial transect sampling design (0–7 km at 1 km intervals) was employed to compute UHI intensity as the thermal contrast between urban cores and peripheral zones. The analytical framework encompasses six successive phases: exploratory spatial-temporal characterization, seasonal decomposition, environmental driver assessment, robust trend detection using Mann–Kendall and Sen’s slope estimators, predictive modeling through SARIMA, Random Forest, XGBoost, and LSTM architectures, and urbanization-impact evaluation through land-cover stratification. Results reveal strongly city-specific thermal regimes: Tangier exhibits a persistent classical UHI pattern, while Ifrane, Béni Mellal, Laayoune, and Taza display recurrent Urban Heat Sink (UHS) episodes. No statistically significant long-term monotonic trend in UHI intensity was detected in any city. Predictive model comparison demonstrates that SARIMA excels in cities with regular seasonal LST structures (R² up to 0.94 in Ifrane), while machine-learning approaches outperform in contexts with irregular thermal signals (R² = 0.90 for Random Forest in Taza). Urbanization amplifies UHI selectively: a clear positive relationship between urban land-cover fraction and UHI intensity emerges in Tangier and Laayoune, whereas local cooling factors dominate in Ifrane, Béni Mellal, and Taza. These findings underscore the primacy of local climatic context and surrounding land-cover characteristics over urbanization level per se in governing UHI behavior, and they support the deployment of multi-model forecasting frameworks for anticipating urban thermal stress under diverse environmental conditions.
Keywords:
urban heat island
; urban heat sink
; land surface temperature
; remote sensing
; machine learning
; SARIMA
; Random Forest
; XGBoost
; LSTM
; Morocco
; arid climate
; Google Earth Engine
1. Introduction
Urban heat islands constitute a well-documented consequence of urbanization, arising from the replacement of natural surfaces with impervious materials that alter radiative, thermal, and hydrological properties of the land surface [1]. In contemporary urban climate science, it is essential to distinguish between the canopy-layer UHI, which reflects near-surface air temperature anomalies experienced by residents, and the surface UHI (SUHI), typically inferred from satellite-derived land surface temperature (LST) measurements [2]. Although LST does not equate to air temperature, it serves as a powerful integrator of surface cover, moisture availability, shading, and anthropogenic modification, and it remains central to satellite-based UHI assessment across scales.
In arid and semi-arid regions, UHI behavior departs substantially from the classical positive-anomaly paradigm established in temperate cities. When peri-urban landscapes consist of bare, dry, and intensely heated surfaces, the city—particularly if it contains irrigated vegetation—may appear relatively cooler by day, producing what has been termed an urban heat sink (UHS) or urban cool island. Conversely, thermal mass and reduced longwave radiative loss in built-up areas can generate pronounced nighttime heat retention [3]. A key recent contribution demonstrates that SUHI estimates in arid cities are highly sensitive to the operational definition of urban and rural reference zones, with sign reversals occurring in nearly half of cases depending on the delineation method employed. This sensitivity motivates analytical designs that emphasize continuous center-to-periphery thermal gradients rather than binary urban–rural comparisons.
Morocco provides an exceptionally valuable setting for investigating these dynamics, as the country spans a sharp climatic gradient from temperate coastal regimes through continental interior conditions to semi-arid and arid landscapes toward the Sahara. National-scale and multi-city satellite assessments have already demonstrated that Moroccan cities can exhibit both UHI and UHS behavior depending on ecological context—particularly whether the surrounding rural environment is vegetated and cool or barren and hot [4]. City-focused studies on Casablanca, Marrakesh, and other urban centers consistently find LST–land cover coupling while emphasizing vegetation and green space as key SUHI modulators [5,6]. A comparative analysis of thermal variations across Moroccan cities (1990–2020) highlighted that urban areas can function as heat sinks in coastal settings, while noting the critical limitation of sparse-year sampling and the consequent inability to resolve seasonal and interannual variability [7].
This temporal limitation motivates the present study’s core methodological contribution: the systematic reconstruction of monthly urban–periphery thermal gradients from 1995 onward using a standardized radial transect sampling geometry. Unlike previous snapshot-based approaches, this design is simple to interpret, comparable across cities and decades, and compatible with land-cover stratification and climate covariates. The approach extends and operationalizes earlier Moroccan transect work by El Ghazouani et al. [8], who employed axis-based profiles and buffer rings at finer spacing for selected summer periods but not as a continuous long-term monthly time series.
Beyond descriptive characterization, this study integrates a multi-model predictive framework combining statistical time-series analysis (SARIMA), ensemble machine learning (Random Forest, XGBoost), and deep learning (LSTM) to evaluate the predictability of urban thermal dynamics and generate short-term forecasts. This comparative modeling strategy addresses a recognized gap in urban climate research, where the relative performance of statistical versus machine-learning approaches for LST forecasting across contrasting climatic contexts remains insufficiently documented. The study further examines the role of urbanization through land-cover stratification analysis, linking changes in urban land-cover fraction to UHI intensity modulation.
The five selected cities—Laayoune (hyper-arid), Béni Mellal (arid inland), Taza (semi-arid corridor), Tangier (sub-humid coastal), and Ifrane (humid mountainous)—constitute a purposeful sampling of Morocco’s climatic diversity, enabling direct testing of the hypothesis that UHI amplitude and sign depend fundamentally on the thermal character of the reference landscape and on directionally varying features such as sea influence, forest adjacency, and barren soil exposure. This paper thus aims to provide an integrated, process-oriented perspective on how climatic context, environmental controls, and urban expansion jointly shape urban thermal behavior across contrasting settings in a rapidly urbanizing North African country.
2. Materials and Methods
2.1. Literature Review
2.1.1 Theoretical Foundations of Urban Heat Islands
The physical basis of the urban heat island effect was established through foundational work in boundary-layer meteorology, demonstrating that the UHI is fundamentally an energy-balance consequence of altered radiative, thermal, and hydrological surface properties [1]. Thermal remote sensing subsequently emerged as the primary tool for diagnosing surface urban climate anomalies, connecting observed thermal patterns to land cover and urban form while acknowledging persistent challenges in emissivity estimation, atmospheric correction, and scale-dependent interpretation [2,9]. The relationship between vegetation greenness and surface temperature has been extensively documented: NDVI, popularized through early Landsat-era work [10], is frequently negatively correlated with LST in urban environments due to the cooling effects of shading and evapotranspiration.
2.1.2. UHI in Arid and Semi-Arid Climates
Arid and semi-arid cities are not guaranteed to exhibit a classical positive daytime SUHI. When the peri-urban landscape consists of bare, dry, and strongly heated surfaces, the city may appear relatively cooler by day, producing an urban cool island or urban heat sink, while still retaining heat at night through thermal mass and reduced longwave radiative loss. Recent multi-satellite studies in Tehran demonstrated that nighttime UHI can be pronounced (up to approximately 5°C), while daytime patterns are more complex, with outlying desert areas matching or exceeding urban temperatures [11]. Research in Kerman and Zahedan (Iran) documented that expanding urban areas led to lower daytime LST relative to the surrounding barren desert, confirming the urban cool island phenomenon. A critical recent contribution by Liu et al. [3] demonstrates that arid-city SUHI estimates are highly sensitive to the operational definition of urban and rural zones, with sign reversals in nearly half of cases, motivating designs that emphasize gradients rather than binary comparisons.
2.1.3. Moroccan and North African Evidence Base
Morocco possesses an unusually strong multi-city remote-sensing literature compared to many countries in the region. A national satellite assessment combining Landsat and MODIS mapped urbanization and analyzed UHI across 24 Moroccan urban areas, reporting that desert-like southern cities can exhibit UHS behavior and that UHI/UHS amplitude is strongly modulated by surrounding vegetation and land-cover context [4]. El Ghazouani et al. [8] compared Tangier, Casablanca, Ifrane, Marrakesh, and Smara using Landsat 8 summer 2016 surface temperature and transects, reporting substantial contrasts in UHI/UHS behavior by city and direction. Bahi et al. [5] examined urbanization and seasonal effects on SUHI patterns in Casablanca, while Gourfi et al. [6] investigated mitigation factors in Marrakesh’s arid climate context. Lachir et al. [12] modeled urban impacts on semiarid surface climate in Marrakesh, demonstrating that urban surface thermal behavior is strongly modulated by vegetation activity, evaporation, and local hydro-climatic context.
2.1.4. Remote Sensing Platforms and Machine Learning for UHI Prediction
Recent studies overwhelmingly utilize satellite thermal infrared data to derive LST as a proxy for surface UHI intensity. Landsat satellites, especially Landsat 8/9 with approximately 100 m thermal resolution, are widely used for multi-year analyses, while MODIS LST products have been employed for broader spatial or diurnal studies. Google Earth Engine has emerged as a transformative platform for large-scale, reproducible urban climate analysis, providing planetary-scale data archives and cloud computation [13]. Machine learning approaches, including Random Forest, XGBoost, and deep learning architectures such as LSTM, have been increasingly applied to LST forecasting and UHI scenario modeling, demonstrating capacity to capture nonlinear relationships in environmental data [14,15,16].
2.1.5. Research Gaps and Study Rationale
Despite the growing body of evidence, several critical gaps persist. First, most existing Moroccan UHI studies rely on sparse temporal sampling that precludes resolution of seasonal and interannual variability. Second, the comparative performance of statistical versus machine-learning forecasting approaches across contrasting climatic contexts remains insufficiently documented. Third, the interaction between urbanization dynamics and local climatic controls has rarely been examined systematically across multiple cities spanning a pronounced climatic gradient. The present study addresses these gaps through a monthly monitoring framework from 1995 to 2024, a multi-model predictive comparison, and a land-cover-based urbanization assessment across five climatically contrasting Moroccan cities.
2.2. Study Area
The five cities selected for this study span Morocco’s pronounced climatic gradient, providing a purposeful living laboratory across distinct environmental settings. City centers are defined as fixed geographic coordinates (WGS 84) taken from GeoNames records, ensuring reproducibility across the multi-decadal analysis period.

Table 1.
Study cities, coordinates, and contextual setting.
| City | Lon. | Lat. | Climate | Context |
|---|---|---|---|---|
| Laayoune | -13.188 | 27.142 | Hyper-arid | Southern semi-arid to arid zone; arid surroundings favor daytime UHS behavior |
| Béni Mellal | -6.350 | 32.337 | Arid | Inland setting; barren context exhibits stronger LST increases with urbanization |
| Taza | -4.010 | 34.210 | Semi-arid | Inland corridor; gradients integrate multiple land cover regimes within 7 km |
| Tangier | -5.800 | 35.767 | Sub-humid | Coastal influence; sea breezes produce moderated or asymmetric thermal gradients |
| Ifrane | -5.110 | 33.527 | Humid | Mountainous context; UHI relative to nearby forests and agricultural mosaics |
2.3. Methodology
2.3.1. Overall Methodological Framework
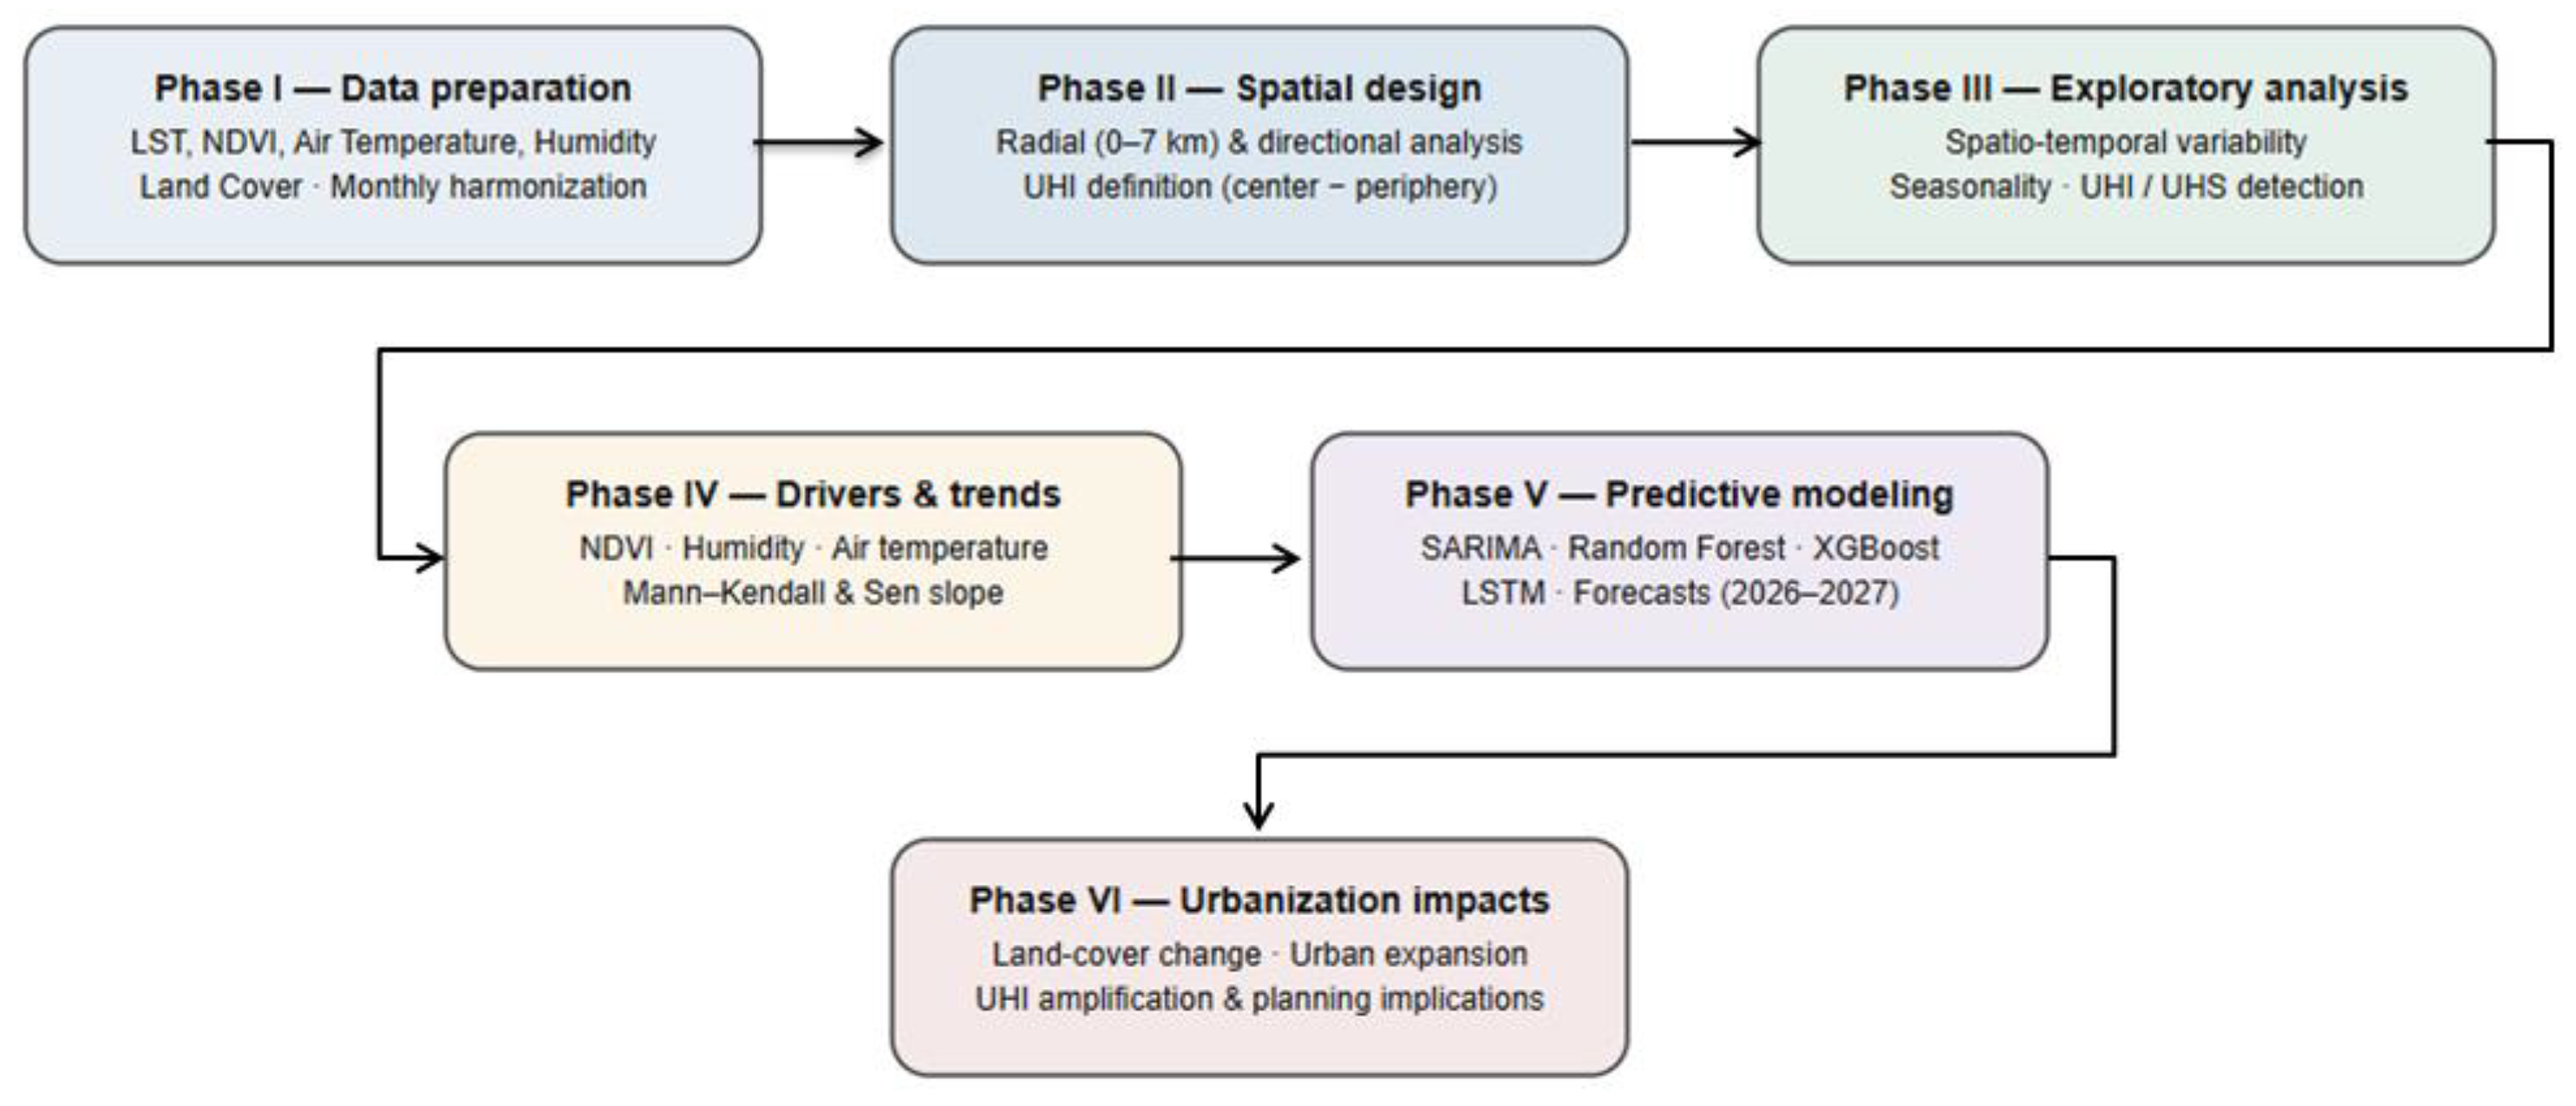
This study adopts an integrated, multi-phase methodological framework to investigate the spatial-temporal dynamics, drivers, and predictability of Urban Heat Island intensity across the five Moroccan cities. The framework is structured into six successive and interdependent phases, designed to ensure a logical progression from data preparation to applied urban interpretation. Phase I addresses data harmonization and quality control. Phase II implements the radial and directional analytical design. Phase III focuses on exploratory and structural analyses. Phase IV assesses environmental drivers and trends. Phase V introduces the predictive modeling framework. Phase VI integrates land-cover change analysis to quantify the role of urbanization.
Figure 1.
Methodological workflow illustrating the six-phase analytical framework.
2.3.2. Data Sources and Preprocessing
Land surface temperature and surface reflectance were derived from USGS Landsat Collection 2 Level-2 products (Tier 1) spanning Landsat 5 TM, Landsat 7 ETM+, Landsat 8 OLI/TIRS, and Landsat 9 OLI/TIRS. Surface temperature scaling follows USGS guidance (multiply by 0.00341802 and add 149.0 to obtain Kelvin, then convert to degrees Celsius). NDVI was computed from red and near-infrared surface reflectance bands using mission-specific band mappings. Monthly near-surface climate covariates were extracted from ERA5-Land Monthly Aggregated fields (2 m temperature, 2 m dew point), with relative humidity computed via a Magnus-type saturation vapor pressure formulation [17]. Annual land-cover context was supplied by Copernicus C3S land-cover classification gridded maps (LCCS classes, 1992–present). Cloud and shadow masking was performed using the QA_PIXEL bitmask approach, and monthly compositing from 1995 to 2024 was applied to all valid clear-sky Landsat observations.
2.3.4. Radial Sampling Design and UHI Computation
A radial multi-directional sampling strategy was employed to explicitly capture spatial heterogeneity in urban thermal structure. For each city, LST observations were extracted along eight cardinal and inter-cardinal directions (N, NE, E, SE, S, SW, W, NW), extending up to 7 km from the urban core with a spatial resolution of 1 km. UHI intensity was defined as the difference between mean LST in the urban core (0–1 km) and mean LST in the peripheral reference zone (6–7 km) for each city and month: UHI_m = LST(0–1 km) − LST(6–7 km).
2.3.5. Exploratory and Structural Analysis
Monthly time series were analyzed to assess interannual variability, long-term fluctuations, and seasonal cycles. Radial thermal profiles were constructed by relating LST values to distance from the city center. The distribution of monthly UHI intensity values was analyzed to quantify central tendency, variability, and the frequency of extreme conditions, with particular attention to the occurrence of negative UHI values corresponding to UHS episodes. The seasonal structure was examined through Seasonal-Trend decomposition using LOESS (STL), separating each city’s monthly UHI time series into trend, seasonal, and residual components.
2.3.6. Environmental Controls and Trend Detection
The influence of environmental drivers was examined using city-specific correlation matrices between LST, NDVI, and near-surface atmospheric humidity. Long-term trends were assessed using the Mann–Kendall non-parametric test, with trend magnitude quantified using Sen’s slope estimator. Linear regression was applied as a complementary approach.
2.3.7. Predictive Modeling Framework
Monthly mean LST time series served as the primary predictive target, with a chronological 80/20 split for training and testing. SARIMA models captured linear temporal dependence and seasonality. Machine learning (Random Forest, XGBoost) and deep learning (LSTM) models used a 12-month lag window with recursive forecasting for multi-step projections. Model performance was evaluated using RMSE, MAE, and R².
2.3.8. Urbanization Effects Analysis
UHI intensity was stratified by land-use/land-cover class using the MODIS MCD12Q1 IGBP classification scheme. The temporal evolution of land use was tracked to quantify rates of urban expansion. The relationship between urban land-cover fraction and UHI intensity was assessed through correlation and regression analyses.
3. Results
3.1. Radial and Directional Thermal Profiles
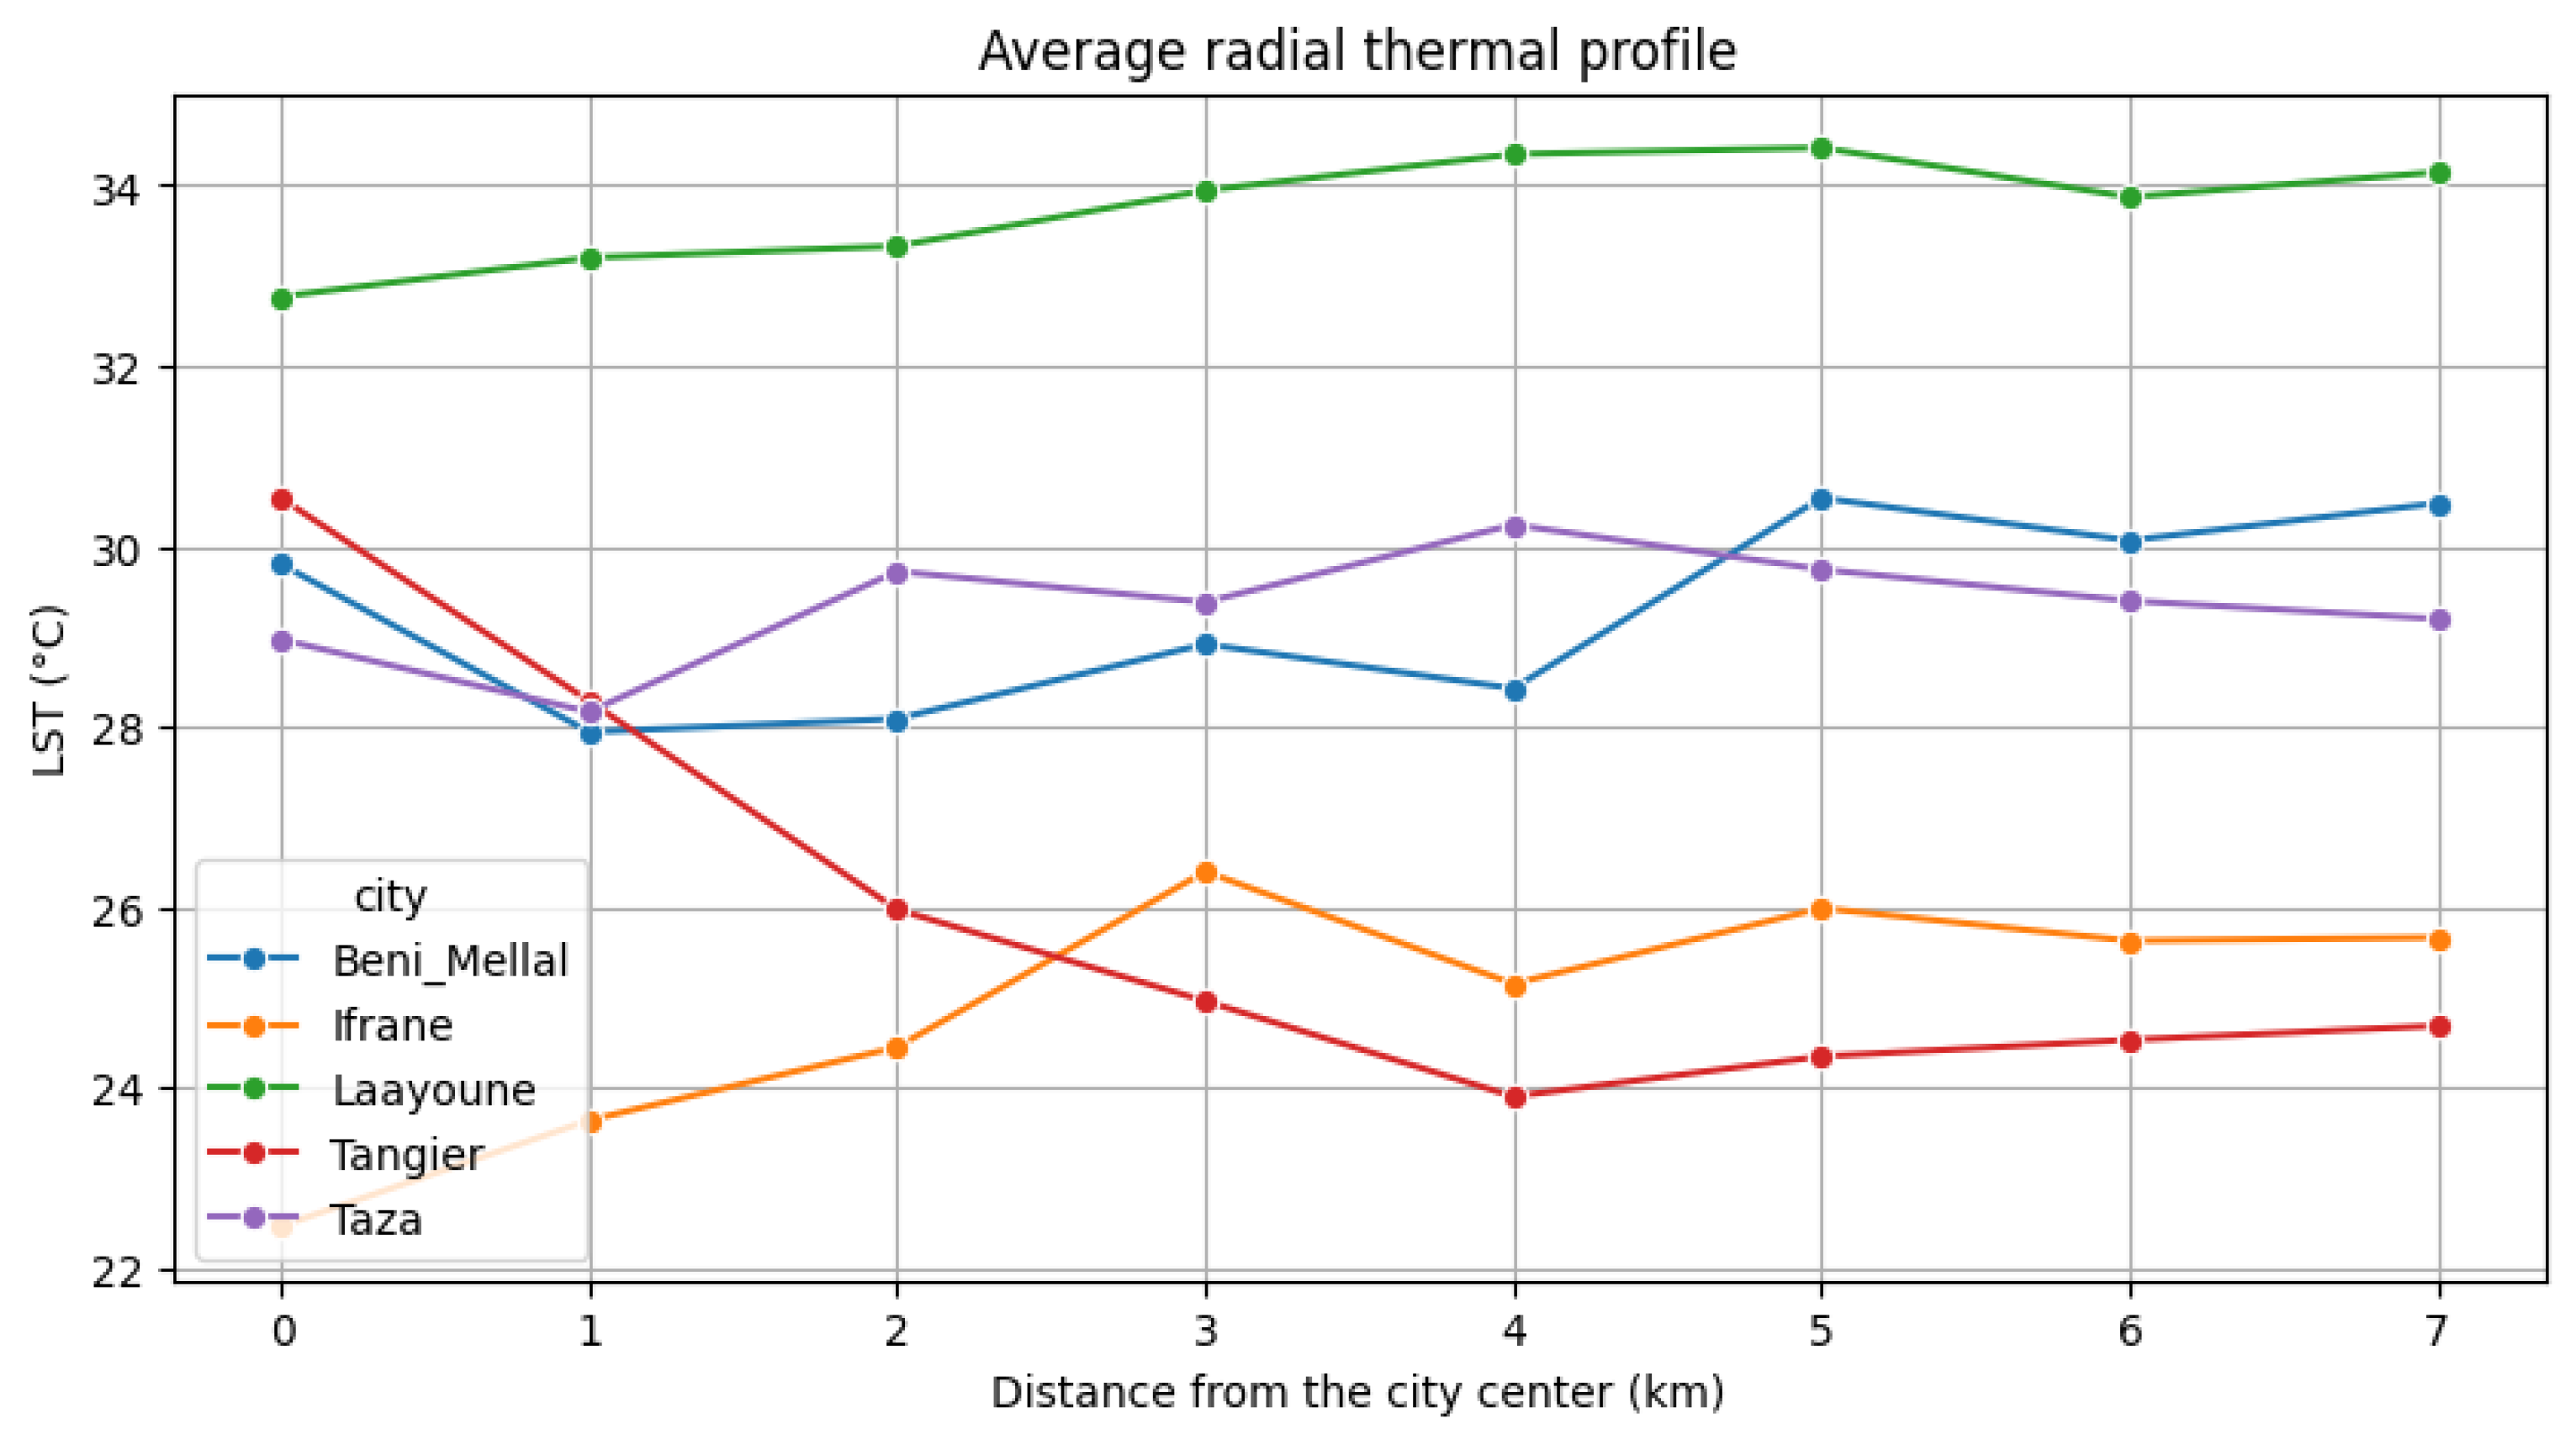
The analysis of radial LST gradients highlights marked differences in thermal organization among the five cities. Tangier shows the clearest decline in temperature with increasing distance from the urban core, reflecting a classical UHI configuration. Conversely, Laayoune remains consistently warm along the entire transect, indicating limited peripheral cooling and suggesting that arid-environment conditions may outweigh the urban-core effect. Béni Mellal, Ifrane, and Taza exhibit more complex radial signatures with localized increases and fluctuations in temperature at intermediate and outer distances. This interpretation is consistent with previous Moroccan UHI studies showing that SUHI structures vary according to local climate, land-cover composition, urban typology, and surrounding rural conditions; in particular, Fathi et al. [4] identify clear UHI patterns in cities embedded in vegetated surroundings and Urban Heat Sink tendencies in arid environments, while El Ghazouani et al. [8] demonstrate that Moroccan cities present differentiated UHI/UHS structures depending on climate, size, typology, and land-cover configuration.
Figure 2.
Average radial thermal profiles across the five studied cities
To further investigate this issue, the analysis was extended to the annual dynamics of both land surface temperature (LST) and urban heat island intensity (UHI) over a 19-year period, as illustrated in Figure 3 and Figure 4. This temporal perspective enables a more robust characterization of interannual variability and supports a deeper understanding of whether urban thermal in long-term patterns.5.2. Exploratory Spatial-Temporal Analysis: LST and UHI.
The monthly LST time series from 1995 to 2024 reveals a strong and persistent seasonal signal across all five cities, marked by recurring annual maxima and minima.
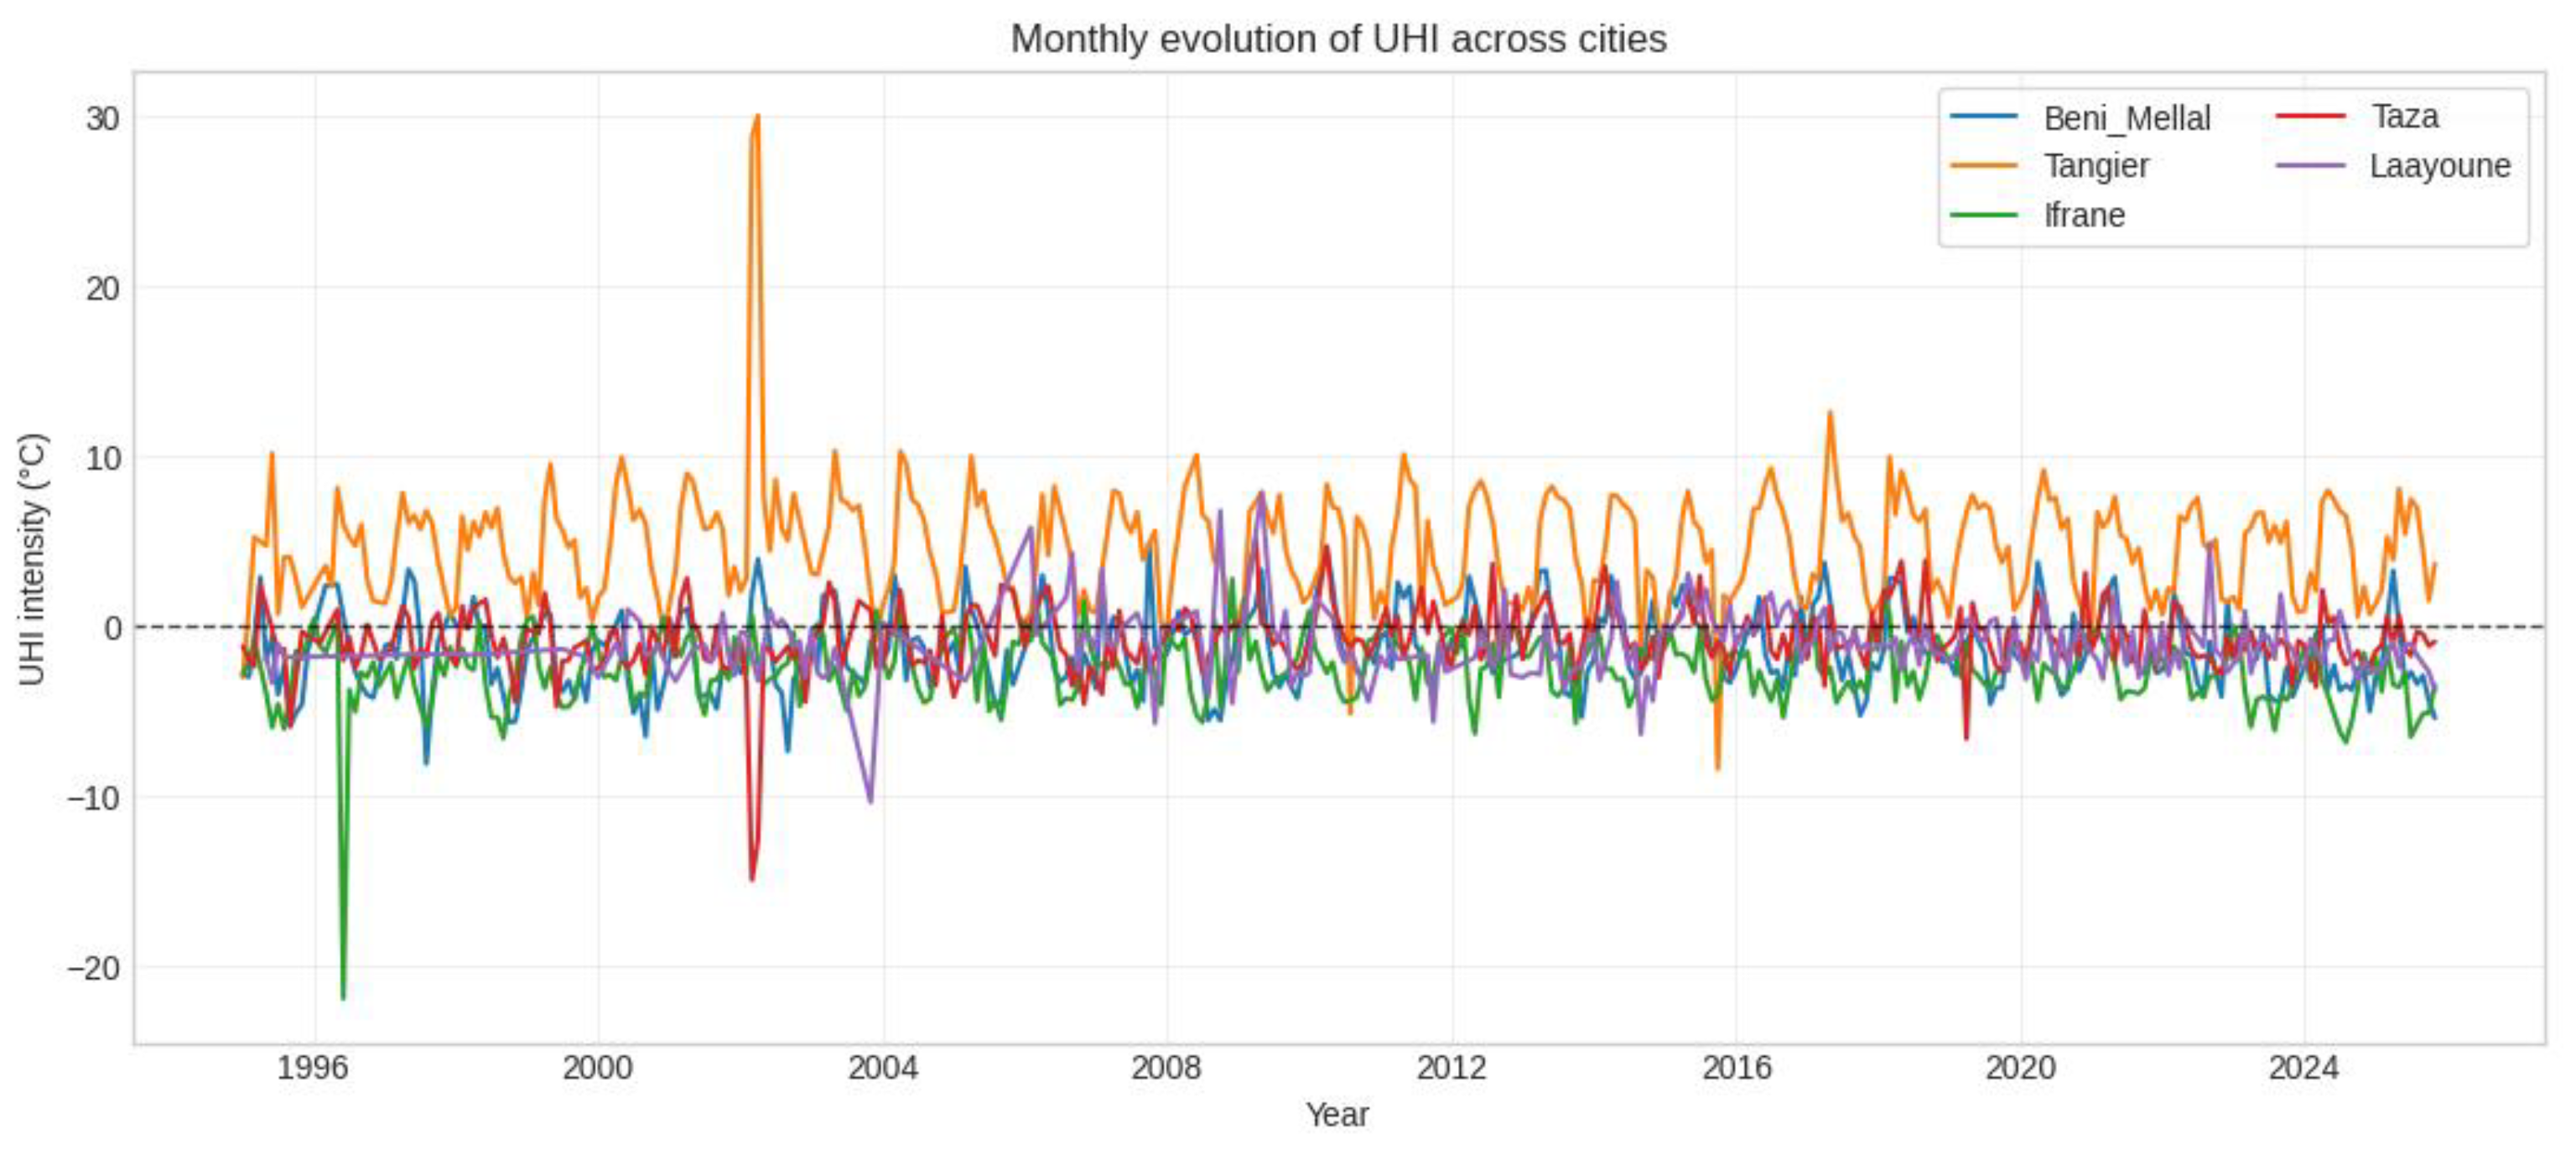
Figure 4.
Monthly UHI intensity time series (1996–2024) across the five studied cities.
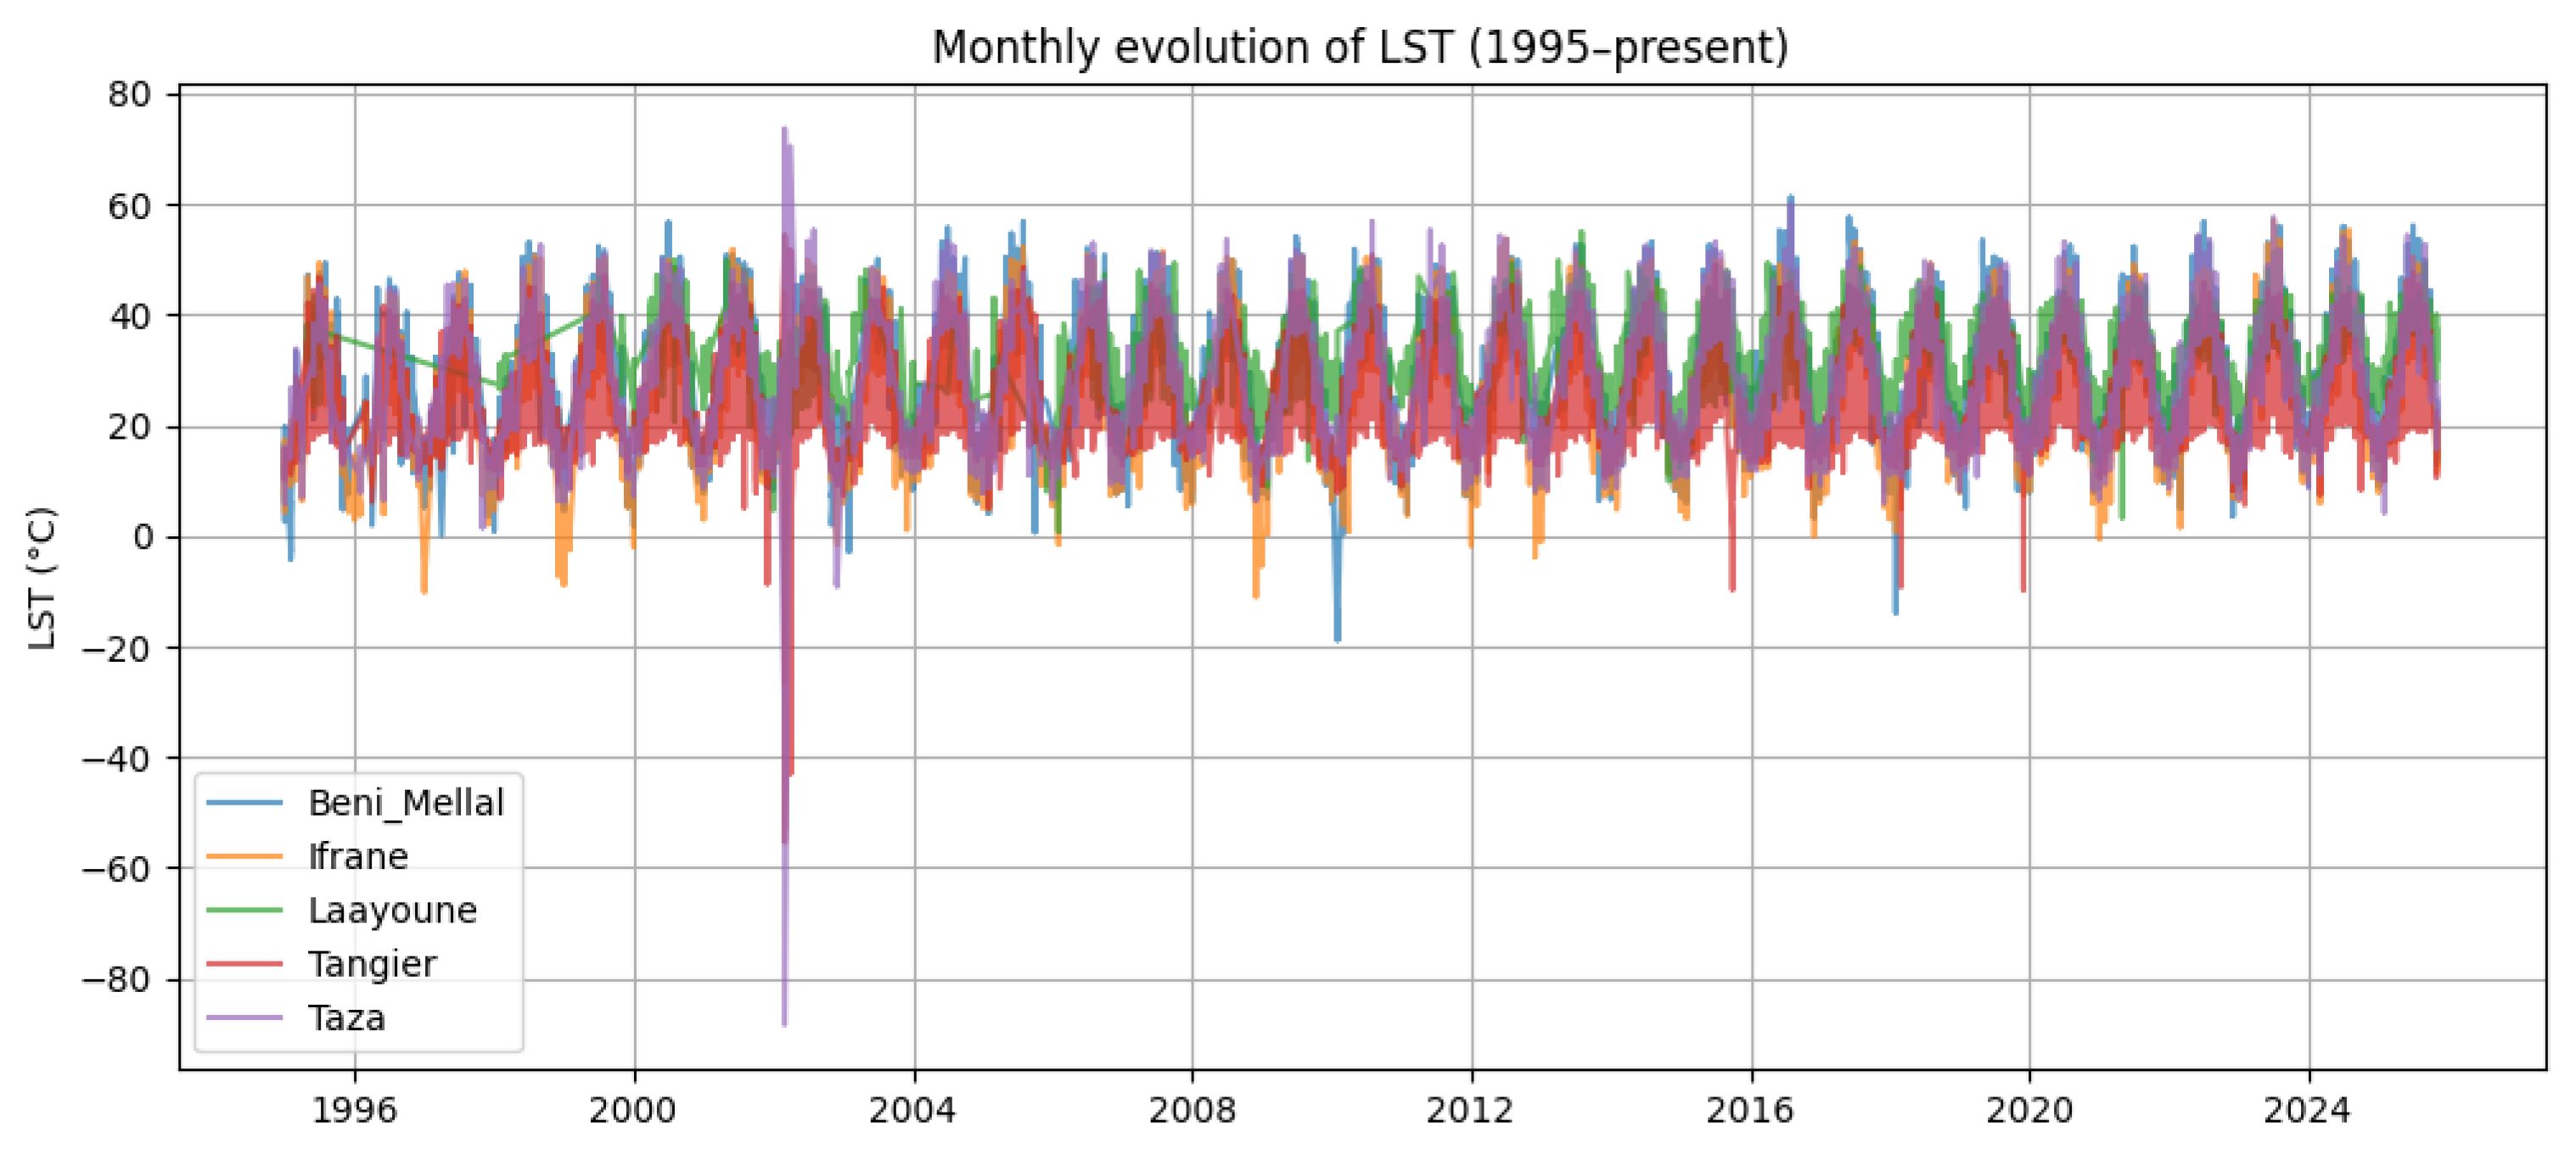
Figure 4, in turn, presents how the monthly UHI series from 1996 to 2024 displays substantial interannual variability, but no clear evidence of generalized long-term intensification across the five cities. Tangier stands out as the city with the highest and most persistent positive UHI intensity throughout the period, with recurrent warm peaks from the late 1990s to the 2020s, indicating a consistently stronger urban–peripheral thermal contrast than in the other cities. By contrast, Béni Mellal, Ifrane, Taza, and Laayoune show alternating positive and negative anomalies and only moderate variations in amplitude over time. Ifrane records the most pronounced negative anomalies, particularly during the earlier years, reflecting occasional strong urban heat sink episodes Taken together, the comparison between the late 1990s and the 2020s reveals the temporal persistence of city-specific UHI regimes rather than a generalized intensification over the study period.
To further refine the analytical scale, the assessment was extended to the monthly mean values of UHI intensity for a more detailed characterization of seasonal thermal variability and helps identify the months during which urban–peripheral temperature contrasts are most pronounced.
Figure 5.
Mean monthly UHI cycle across the five studied cities.
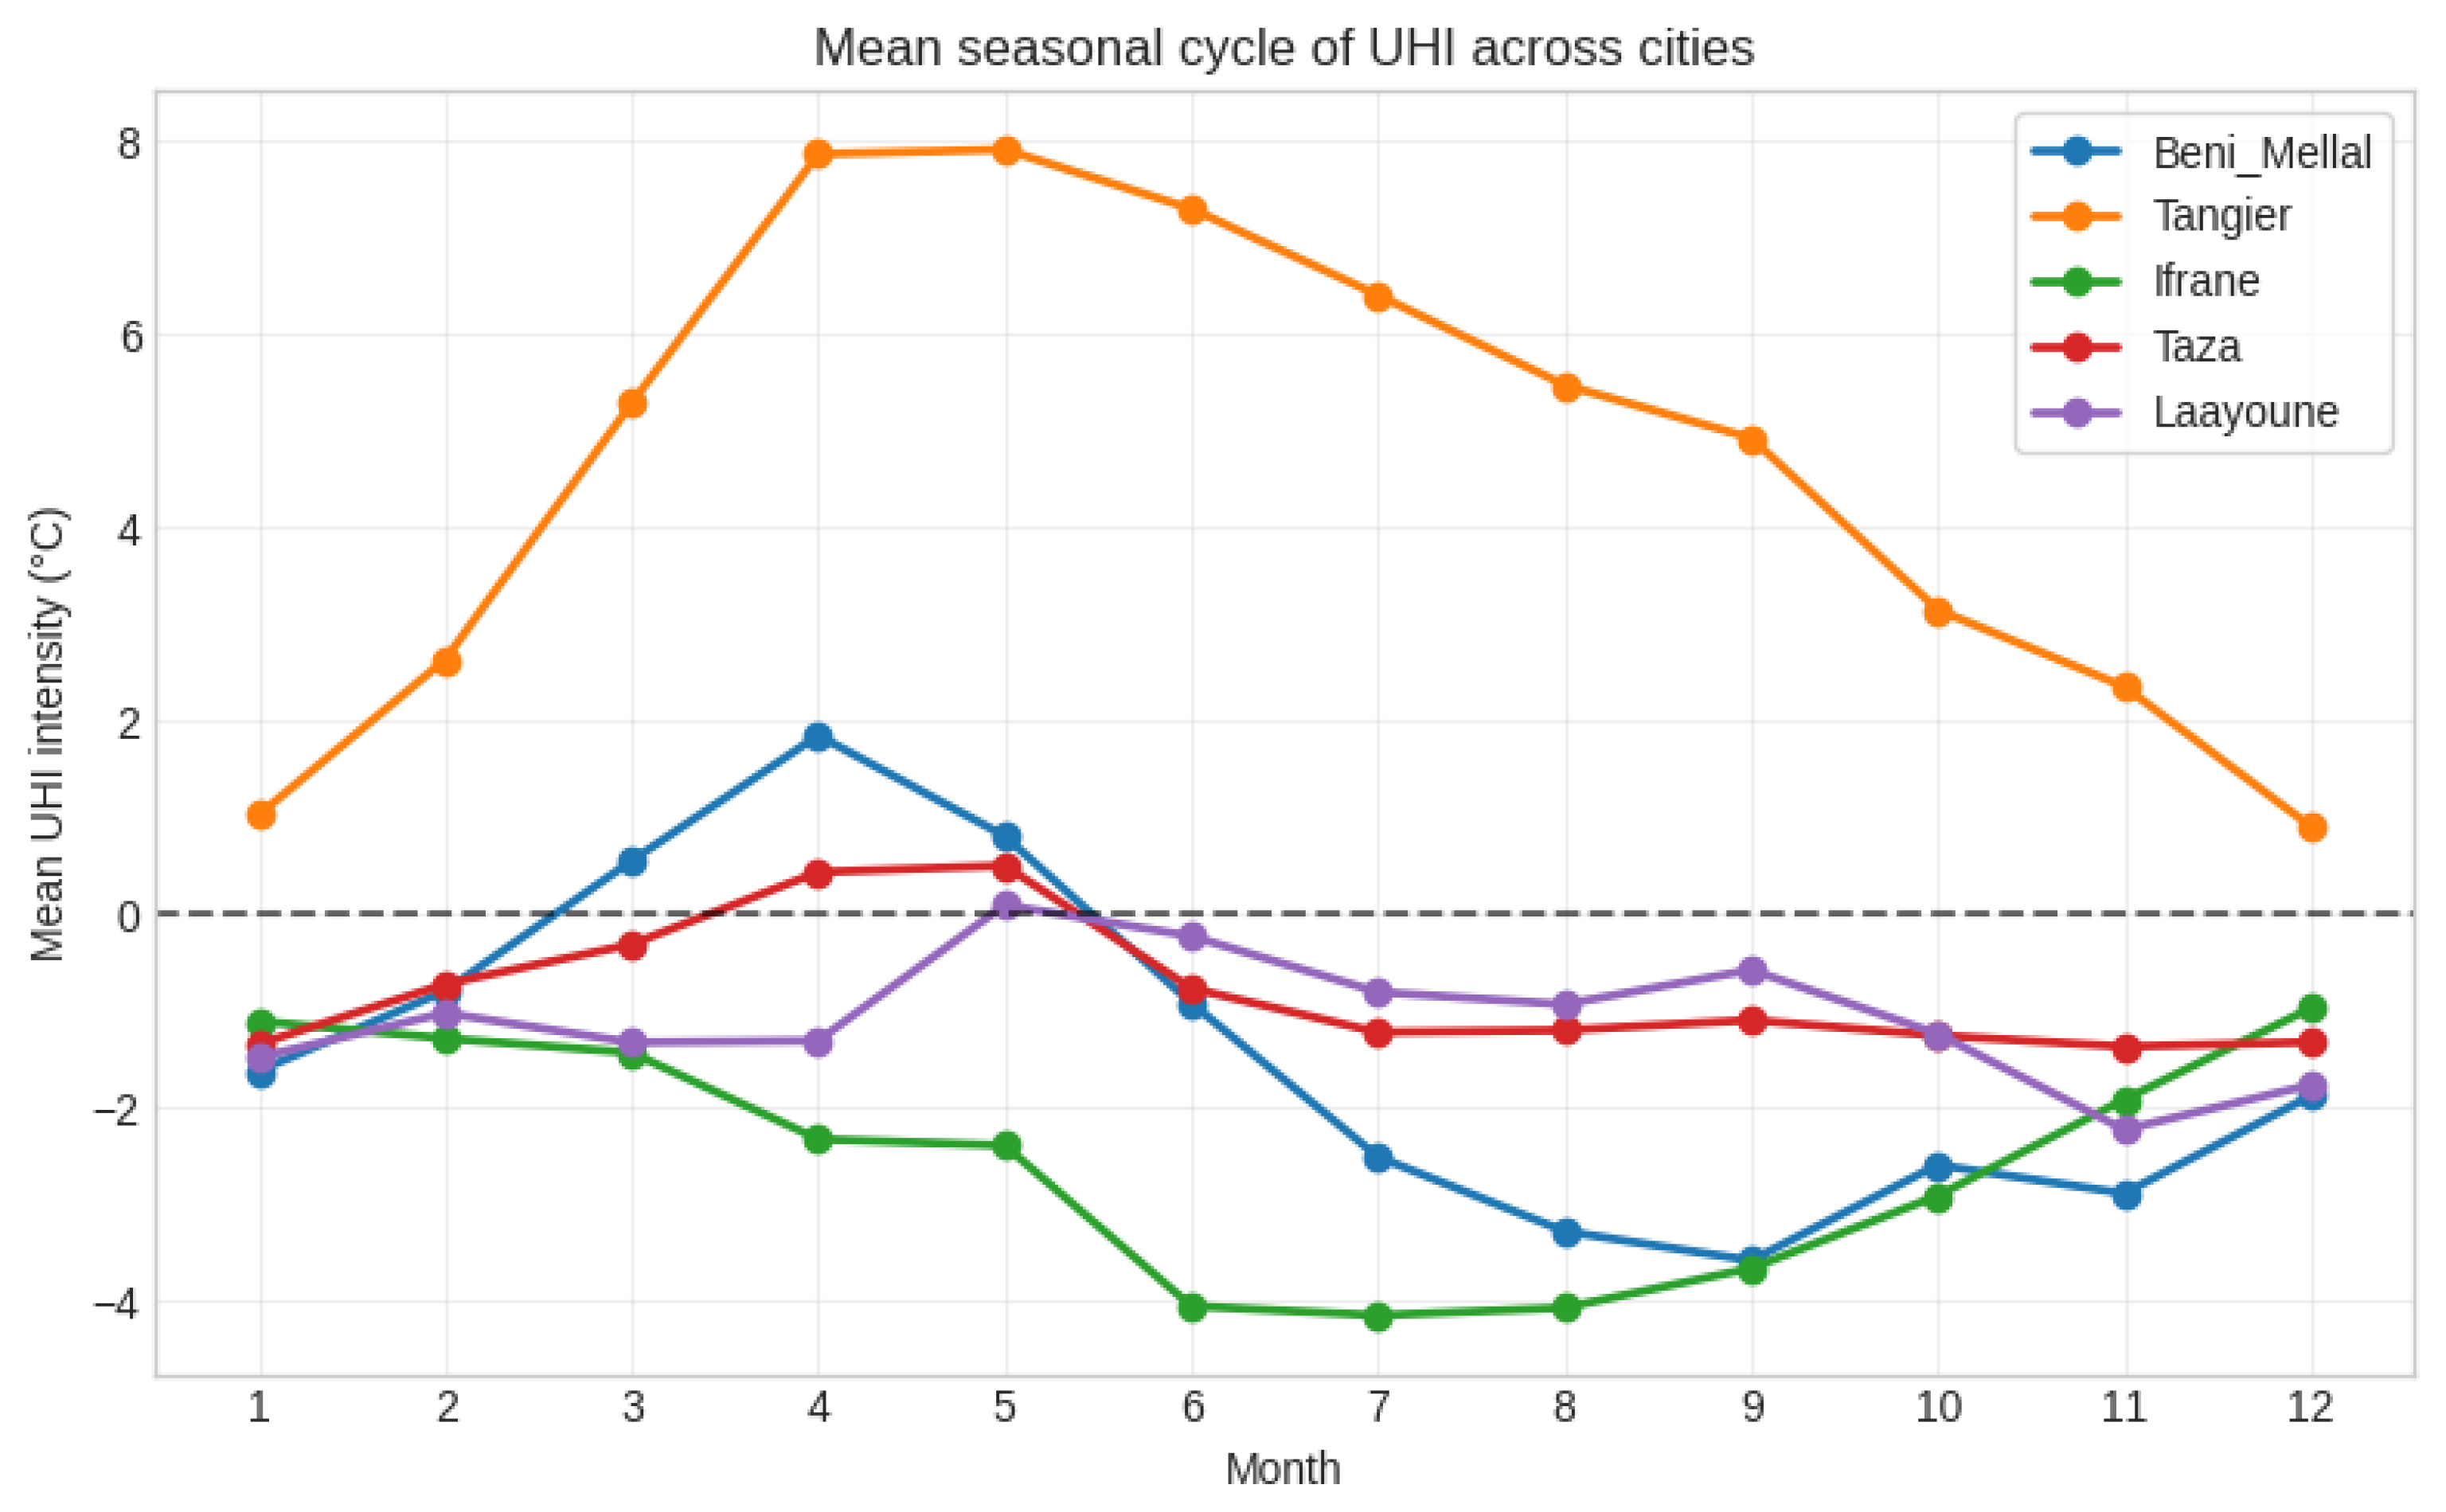
The results reveal marked seasonal and inter-city variability in the mean monthly UHI cycle. Tangier records the highest UHI intensity throughout the year, with a pronounced peak in April–May. Béni Mellal exhibits positive UHI values in spring, followed by negative values indicating a seasonal reversal in the urban–peripheral thermal contrast, whereas Taza and Laayoune display relatively limited seasonal amplitudes and remain close to the zero baseline. Overall, these findings demonstrate that UHI seasonality is strongly city-specific, ranging from persistent positive UHI regimes to recurrent urban heat sink conditions.
3.2. Characterization of UHI Intensity and Urban Heat Sink Occurrence
Figure 6.
Statistical summary of UHI intensity distribution and UHS occurrence frequency across the five cities.
Figure 6.
Statistical summary of UHI intensity distribution and UHS occurrence frequency across the five cities.
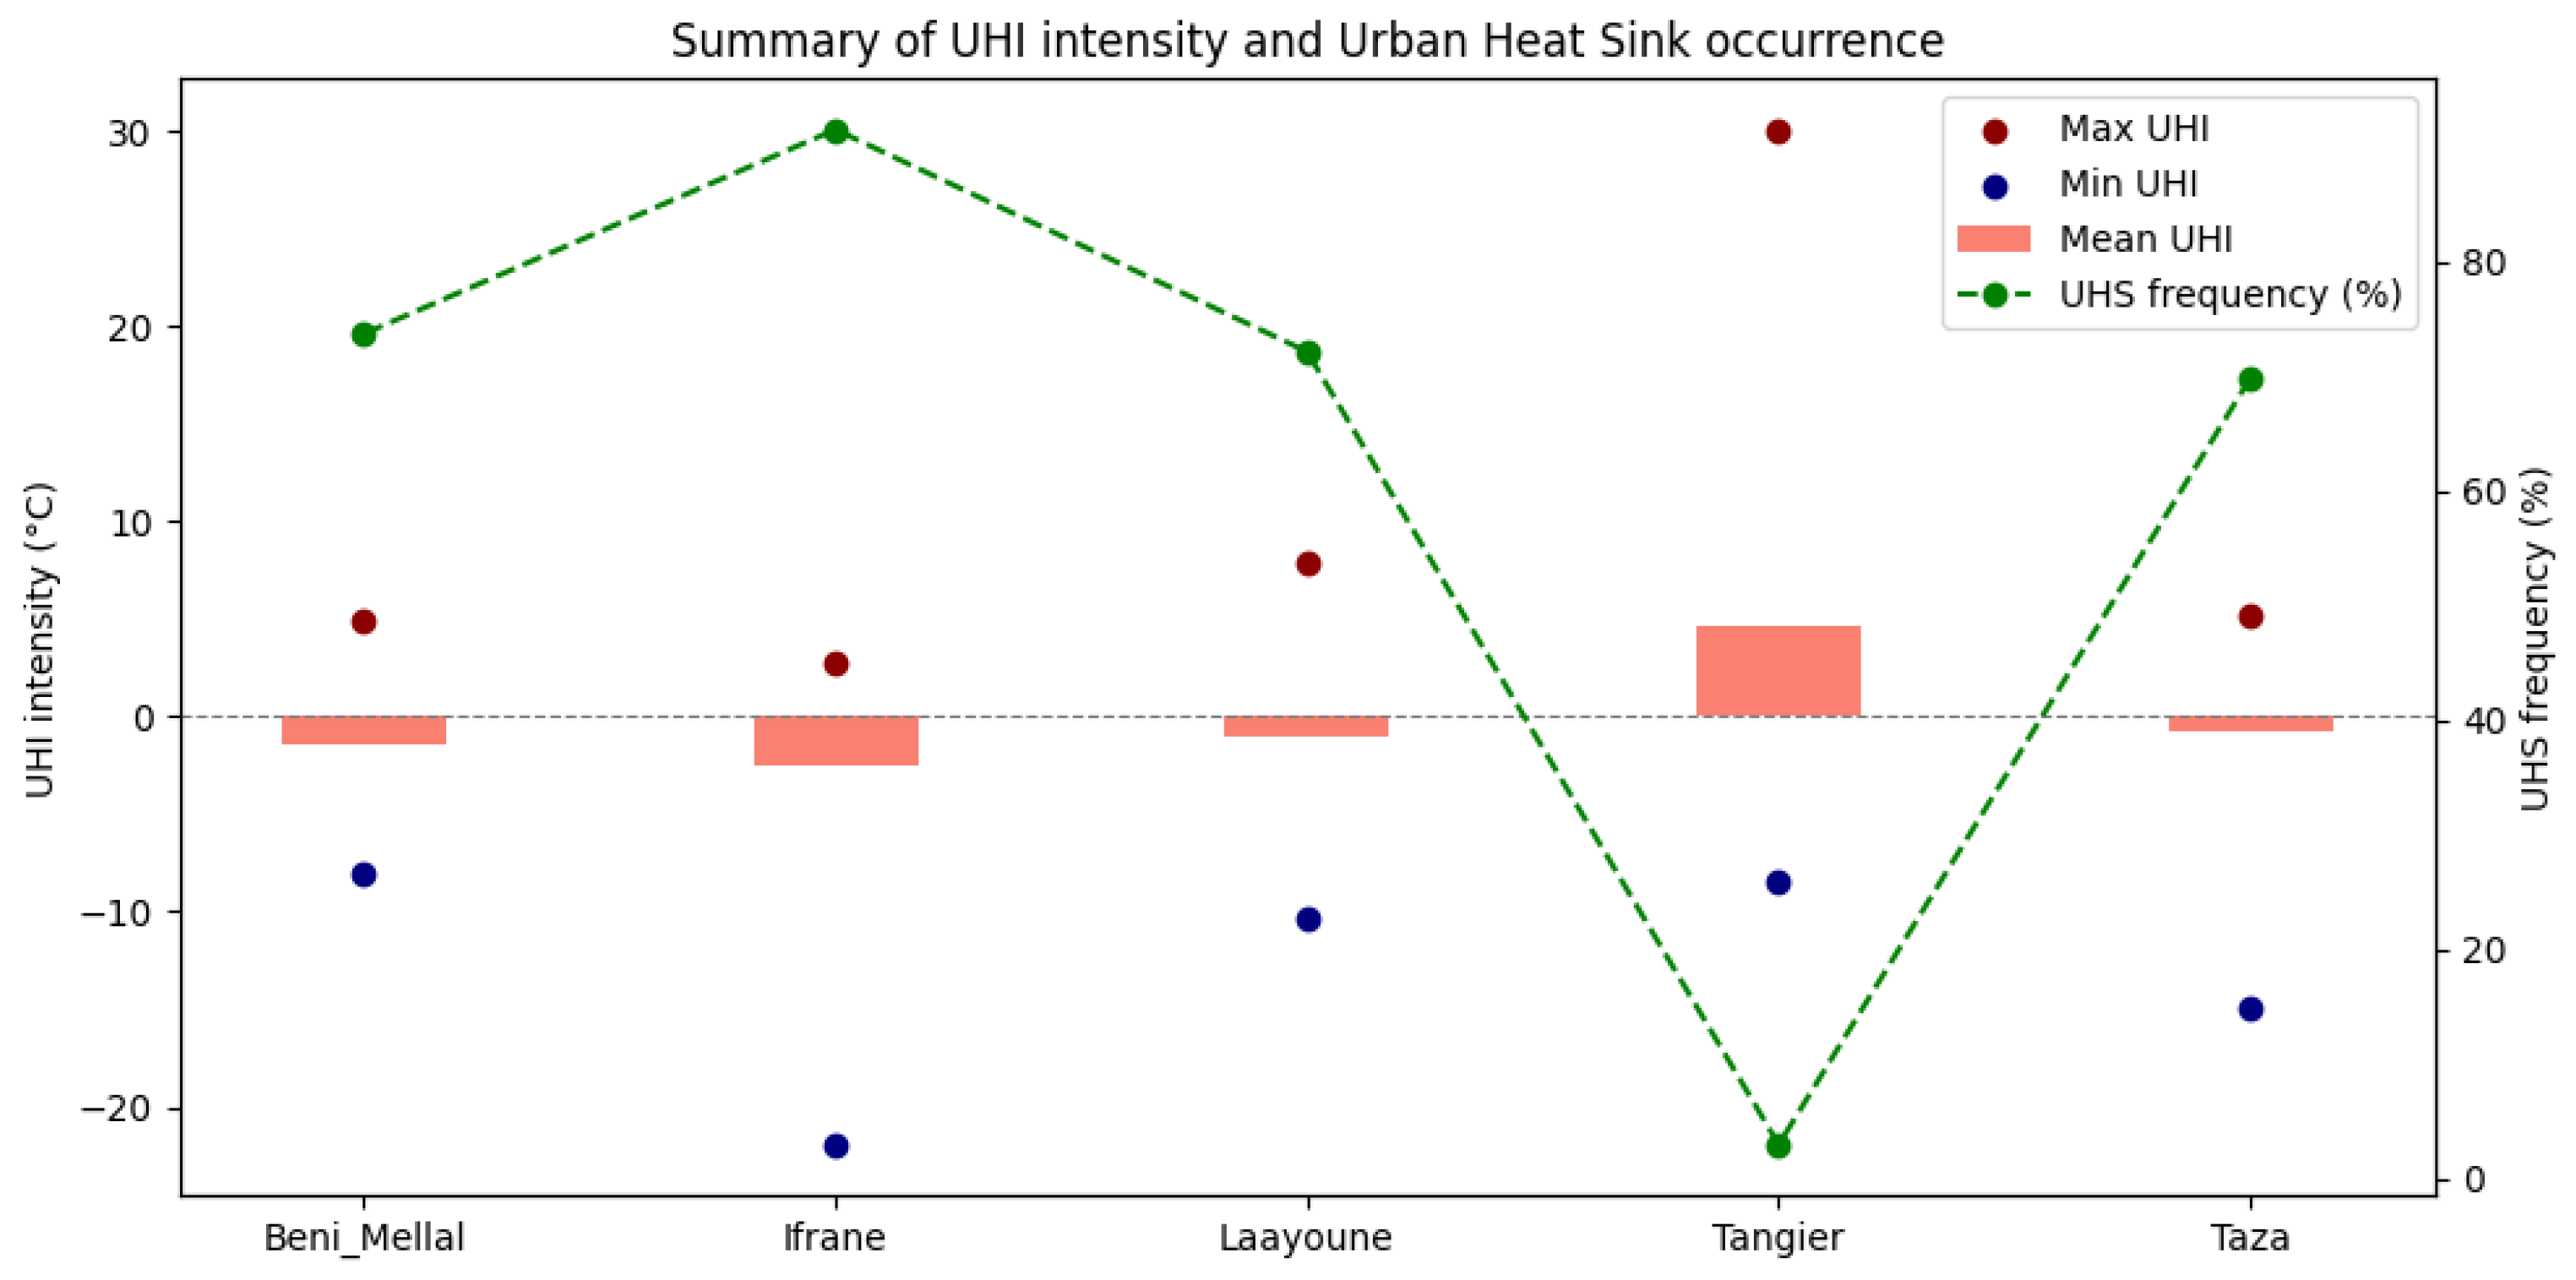
The statistical characterization of urban thermal contrast, including maximum, minimum, and mean UHI intensity together with the frequency of UHS occurrence, reveals marked inter-city differences in both the magnitude and direction of urban–peripheral thermal contrasts. Tangier is the only city with a clearly positive mean UHI intensity and the highest maximum value, while also exhibiting the lowest UHS frequency, confirming the predominance of a persistent classical UHI regime. By contrast, Béni Mellal, Ifrane, Laayoune, and Taza display slightly negative mean UHI values, reflecting weak average contrasts or recurrent shifts toward UHS conditions. Among them, Ifrane stands out with the most negative minimum UHI value and the highest UHS frequency, indicating a thermal regime strongly dominated by urban cooling episodes.
These findings further substantiate the existence of two contrasted urban thermal regimes among the study cities. In Tangier, the results confirm the predominance of a classical Urban Heat Island pattern, characterized by persistently positive urban–peripheral thermal contrasts. In Ifrane, the analysis identifies a regime distinguished by recurrent Urban Heat Sink conditions. These results are consistent with the patterns previously identified by El Ghazouani et al. [8] and Fathi et al. [4], thereby reinforcing the temporal robustness of these city-specific thermal behaviors.
3.3. Environmental Controls on UHI Intensity
Figure 7.
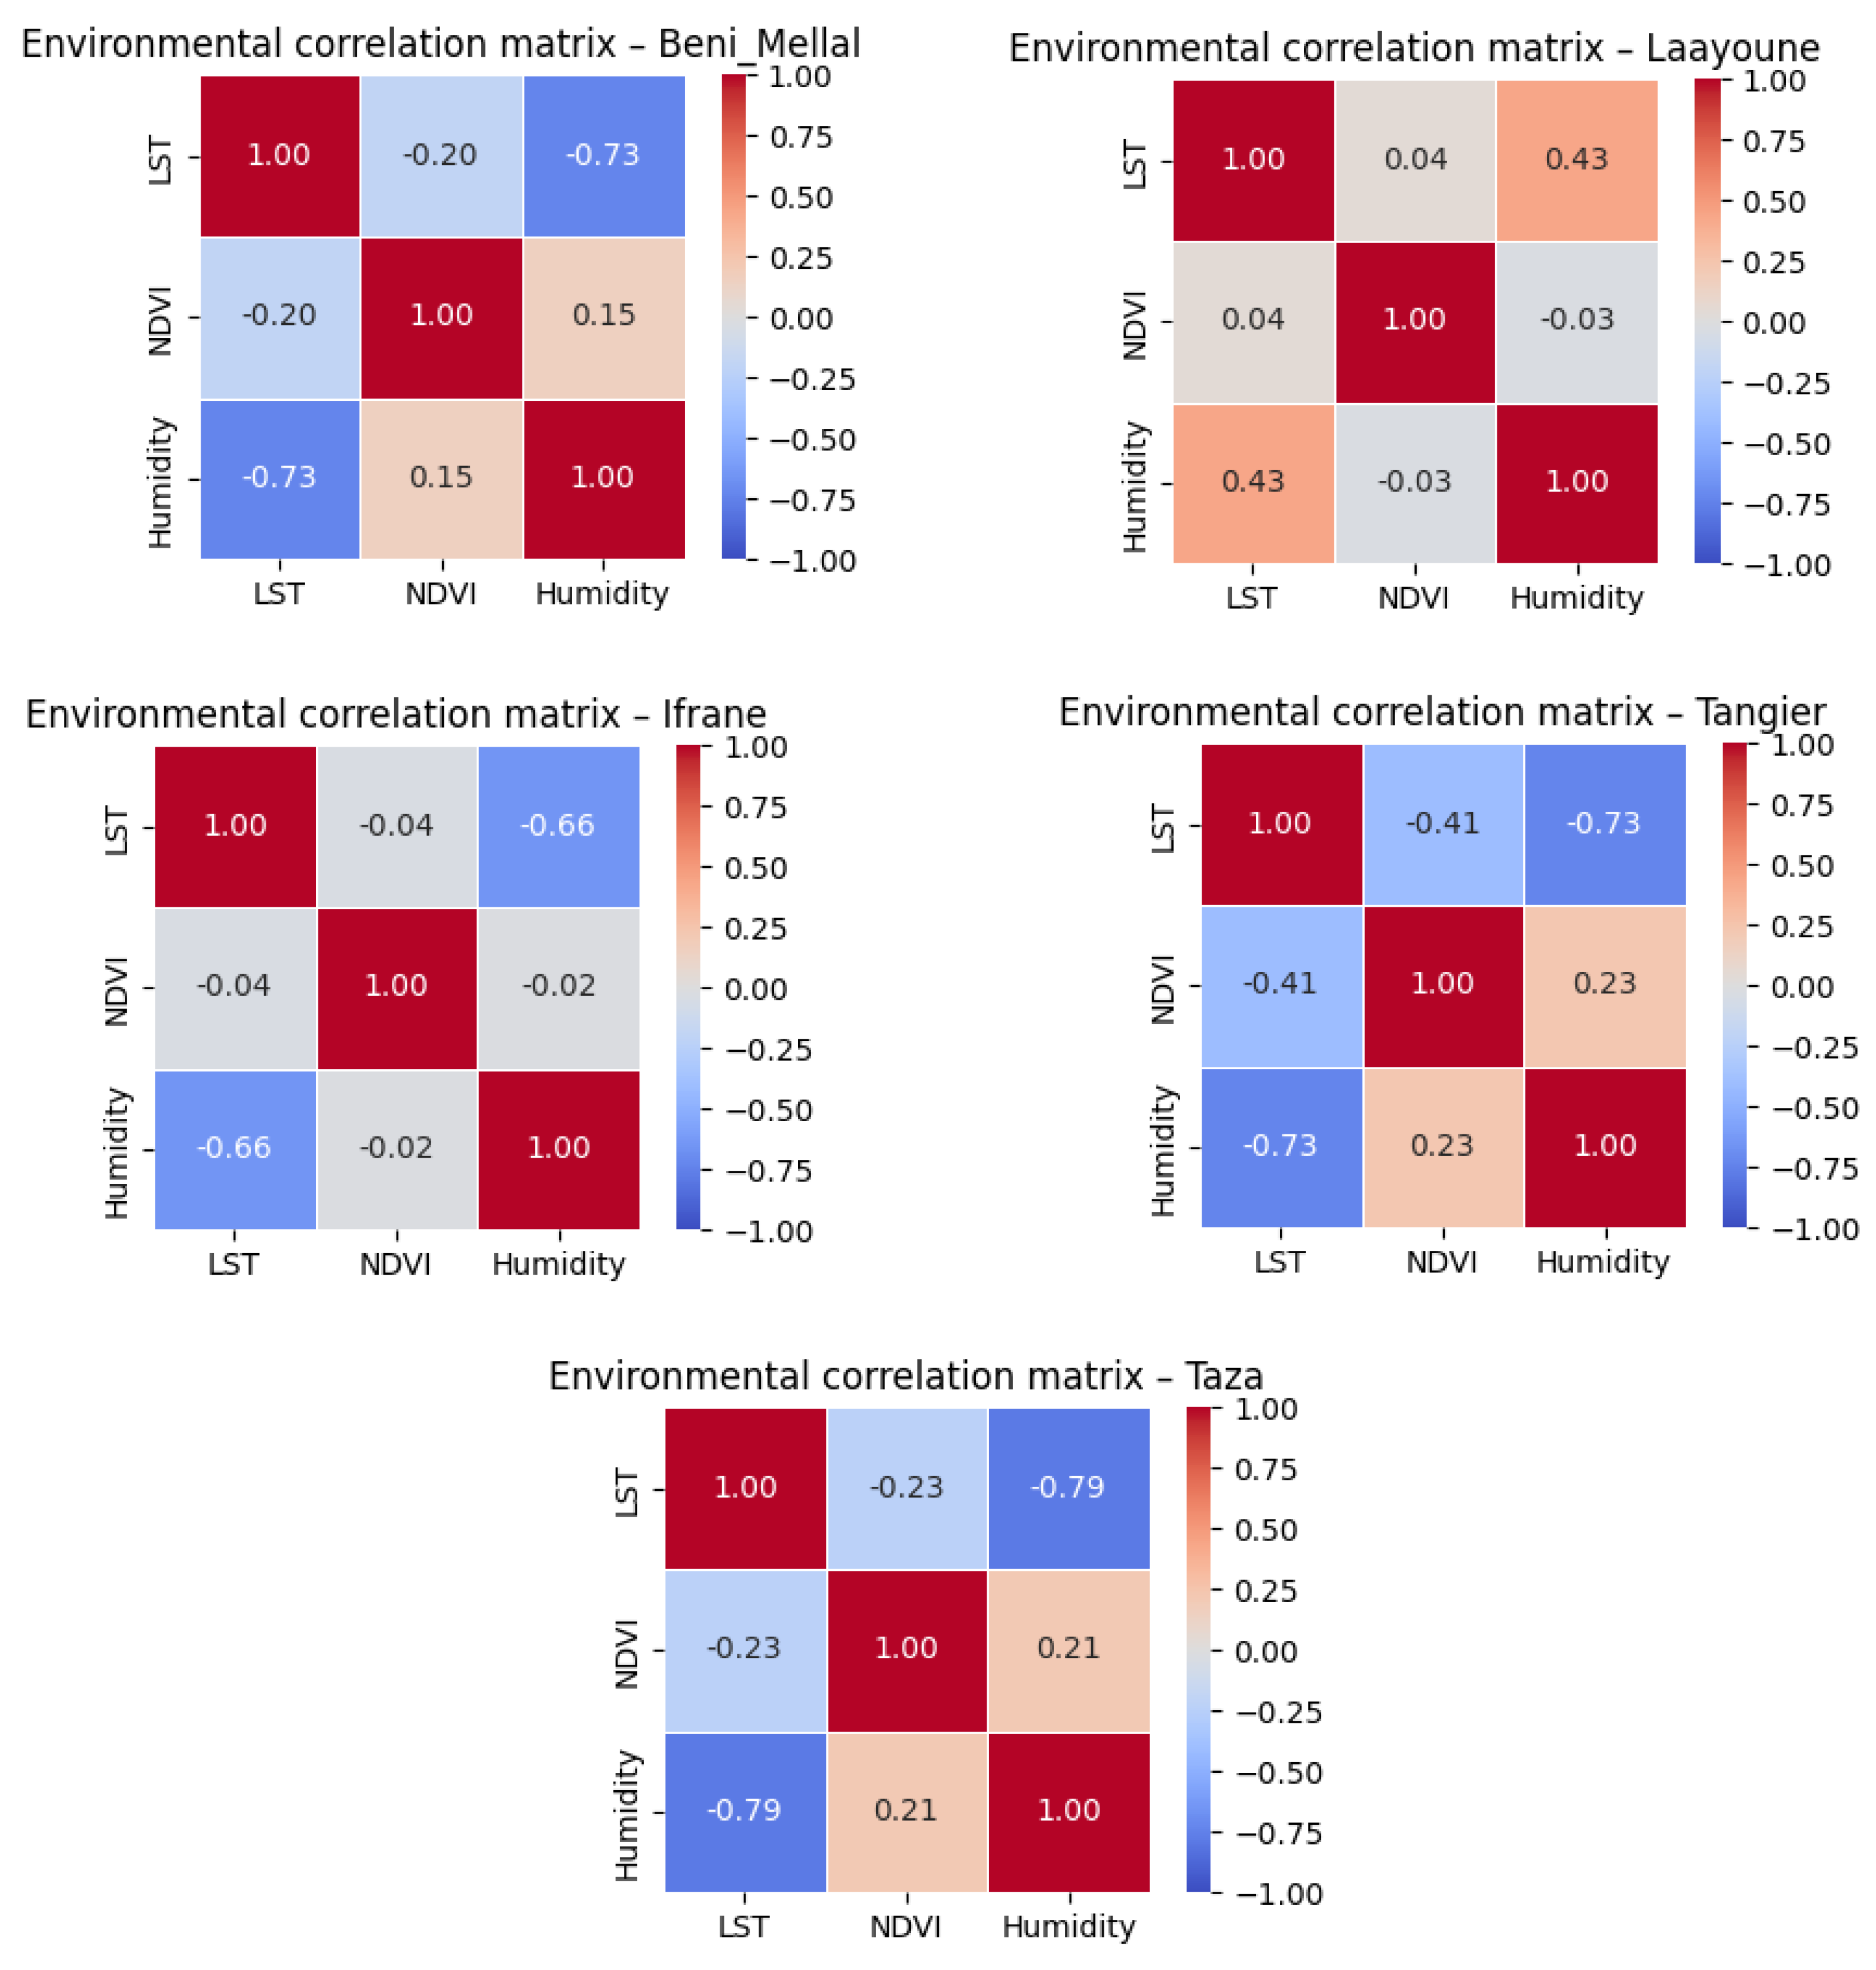
Environmental correlation matrix covering LST–NDVI and LST–Humidity relationships across the five cities.
Figure 7.
Environmental correlation matrix covering LST–NDVI and LST–Humidity relationships across the five cities.
To further investigate the environmental controls shaping UHI and UHS dynamics, three key variables were analyzed:
• Land surface temperature as an indicator of surface thermal conditions,
• NDVI as a proxy for vegetation cover,
• Humidity as a measure of atmospheric moisture.
This approach is consistent with remote-sensing UHI studies, where LST is widely used to characterize surface thermal conditions, while NDVI is commonly used to capture vegetation-related cooling effects and land-cover controls on urban temperature [18].
LST and humidity: Across most cities, the relationship between LST and humidity is strongly negative, indicating that higher humidity levels are generally associated with lower surface temperatures, pointing to a significant cooling influence of moist atmospheric conditions. The strongest inverse relationship is observed in Taza, suggesting that humidity may constitute a regulator of surface heat in this city. This interpretation is theoretically supported by urban-climate literature emphasizing the role of surface energy balance, evapotranspiration, latent heat flux, and moisture availability in regulating urban thermal conditions [1].
LST and NDVI: The relationship between LST and NDVI is overall weak to moderate and predominantly negative, suggesting a weaker moderating role of vegetation. The correlation is nearly absent in Ifrane (−0.04) and Laayoune (+0.04), implying that vegetation cover alone does not strongly account for temperature variation in these cities. This suggests that the thermal influence of greenness is highly dependent on local urban form, vegetation density, and broader climatic conditions. Moreover, greener areas are not systematically associated with more humid conditions, coherent with broader SUHI literature showing that the effects of vegetation and moisture are context-dependent [19].
Overall, these results highlight pronounced spatial heterogeneity in the environmental controls of urban temperature. Humidity appears to be the dominant regulating factor in most cities, whereas vegetation plays a secondary yet locally significant role, particularly in Tangier. Laayoune stands out as an exception, displaying a distinct environmental behavior. These findings are consistent with those reported by Lachir et al. [12] and with wider Moroccan UHI studies showing that surface thermal regimes differ substantially between humid/coastal, inland, mountainous, and arid environments.
3.4. Trend Detection
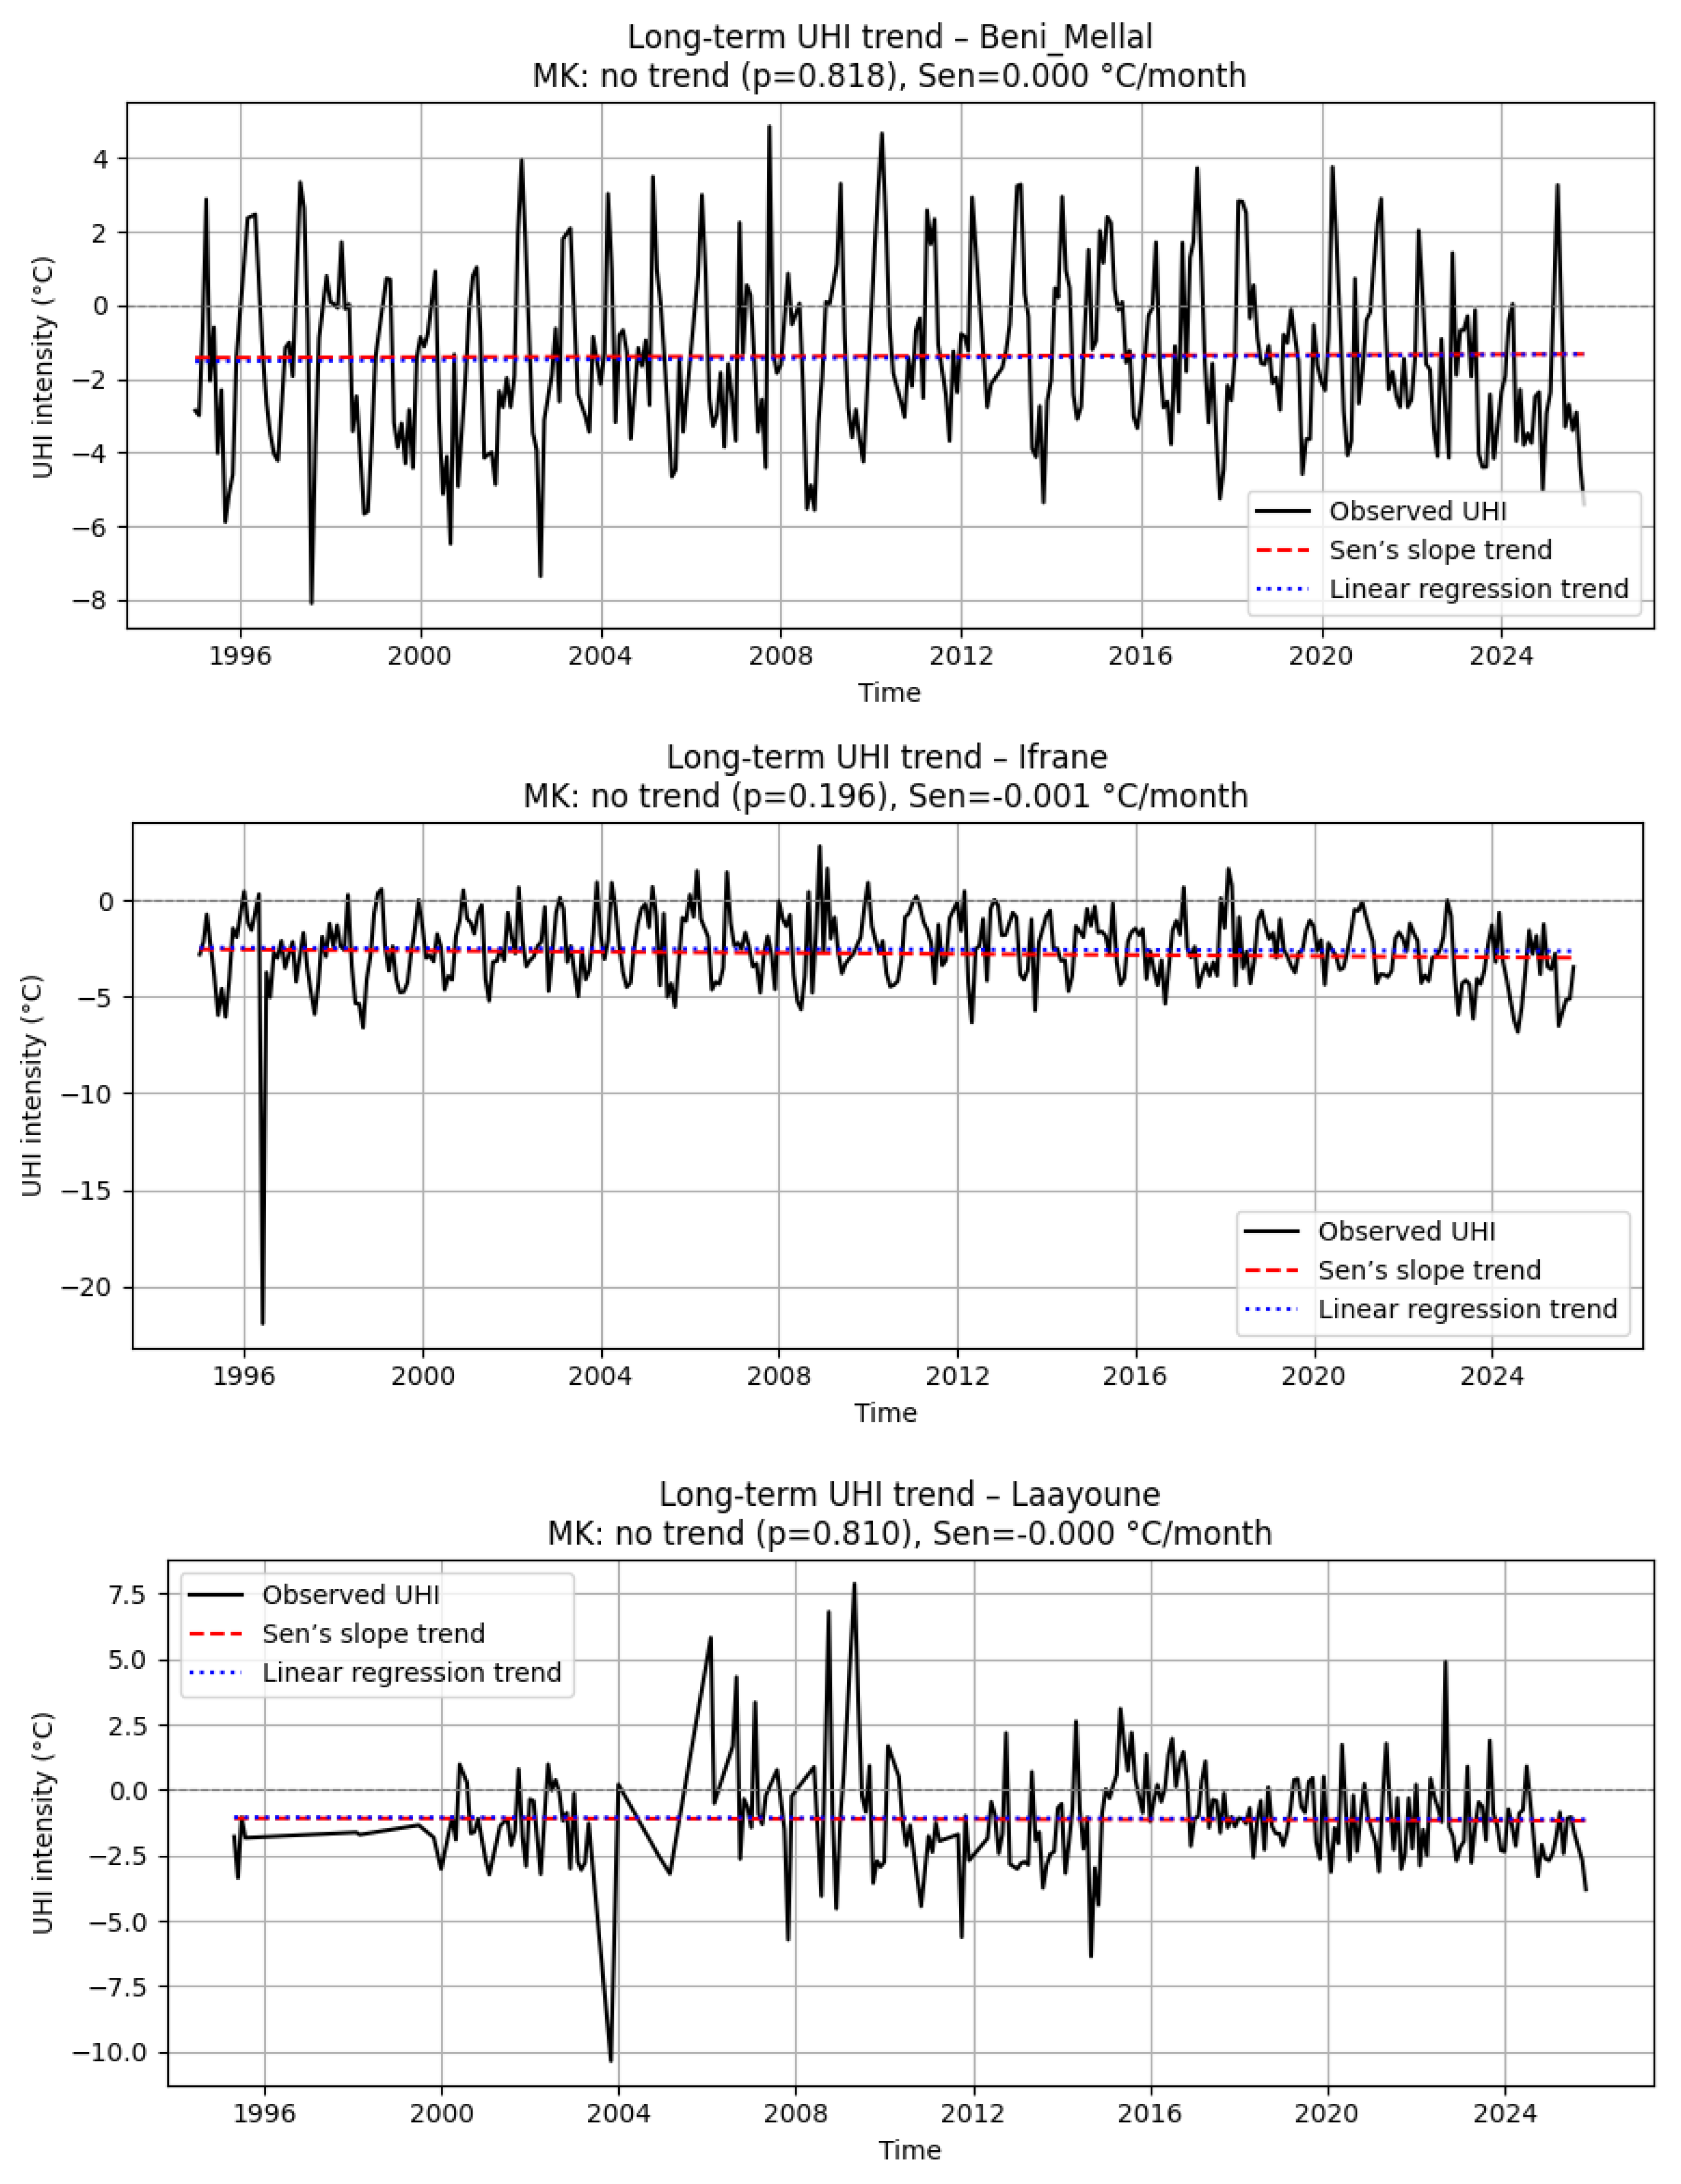
The Mann–Kendall test revealed no statistically significant monotonic trend in UHI intensity across the five studied cities over the observation period, as all p-values exceeded the 0.05 significance threshold. Sen’s slope estimates were consistently close to zero, ranging from −0.0012°C/month in Ifrane to +0.0009°C/month in Taza, indicating the absence of any persistent long-term increase or decrease in urban–rural thermal contrast. Although the time series show pronounced seasonal and interannual variability, these fluctuations reflect short-term environmental and climatic controls rather than a directional long-term trend. Overall, the results suggest that UHI dynamics in these cities are primarily governed by seasonal behavior and local environmental conditions, rather than by monotonic climatic evolution.
Figure 8.
Mann–Kendall trend analysis and Sen’s slope estimates for UHI intensity across the five cities.
Figure 8.
Mann–Kendall trend analysis and Sen’s slope estimates for UHI intensity across the five cities.
3.5. Predictive Modeling Framework
3.5.1. SARIMA-Based Forecasting of Land Surface Temperature
The Seasonal Autoregressive Integrated Moving Average model (SARIMA) are widely used for environmental and climatic time series, as they combine non-seasonal autoregressive components with seasonal differencing and seasonal lag structures [20,21]. Within this perspective, the SARIMA approach contributes a temporal forecasting dimension, allowing the study to move beyond the description of past LST variability toward an assessment of near-future thermal behavior.
Figure 9.
SARIMA-based prediction of LST dynamics across the five studied cities (Laayoune, Taza, Ifrane, Béni Mellal, Tangier).
Figure 9.
SARIMA-based prediction of LST dynamics across the five studied cities (Laayoune, Taza, Ifrane, Béni Mellal, Tangier).
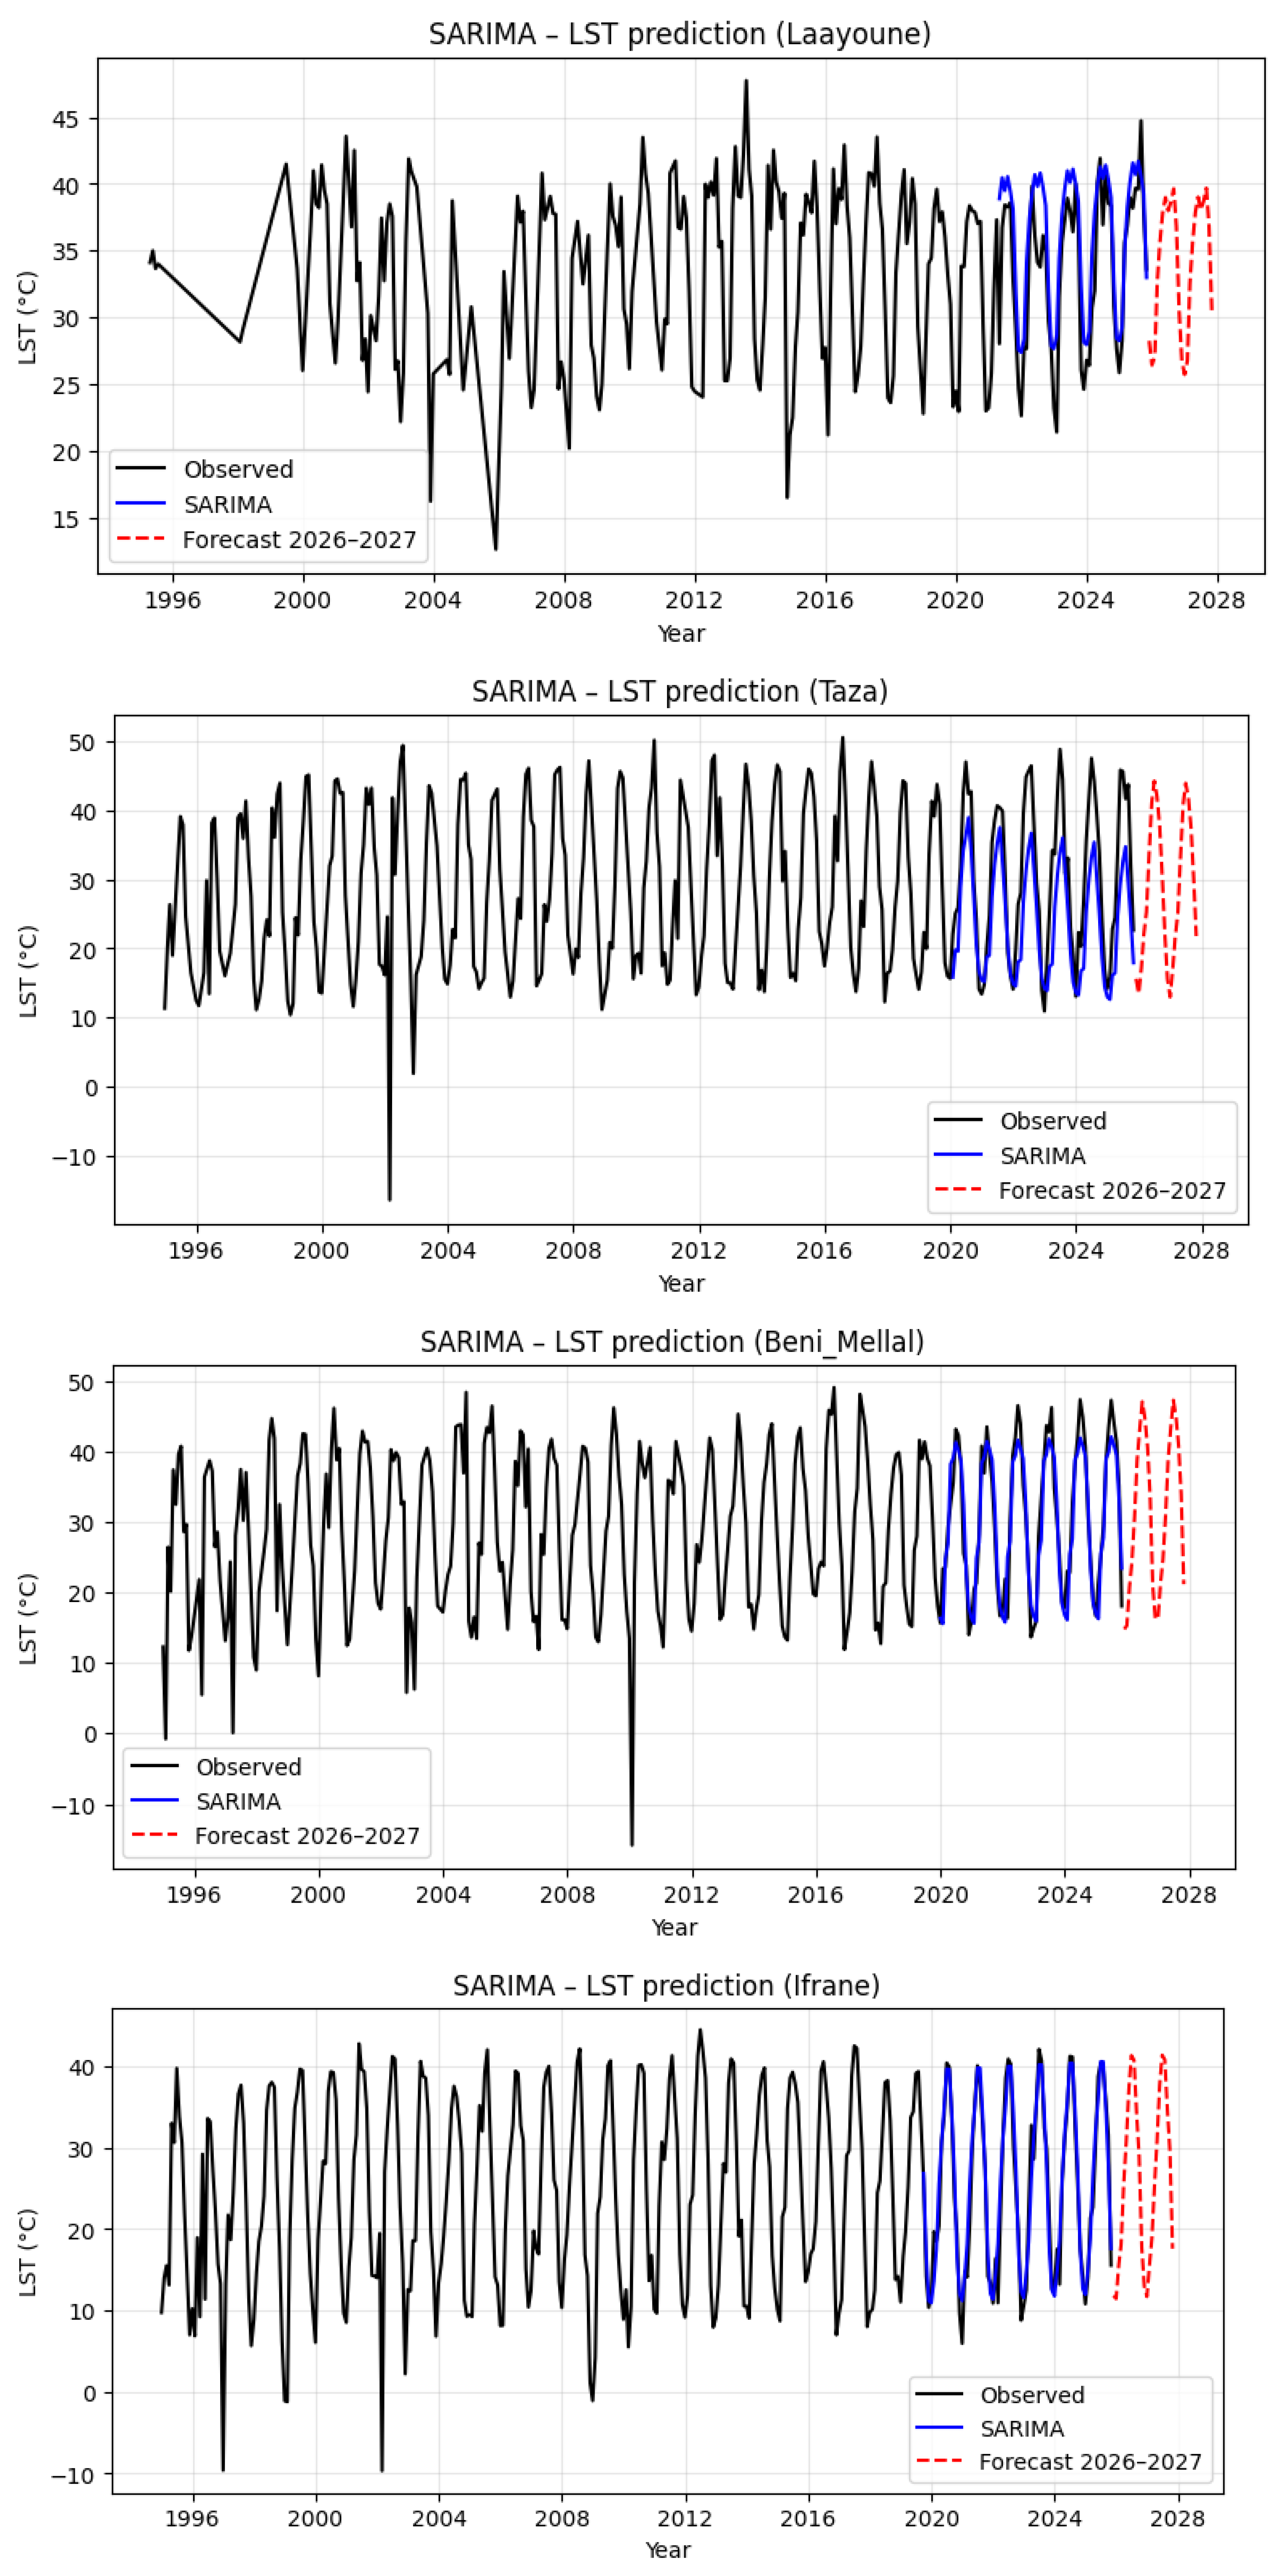
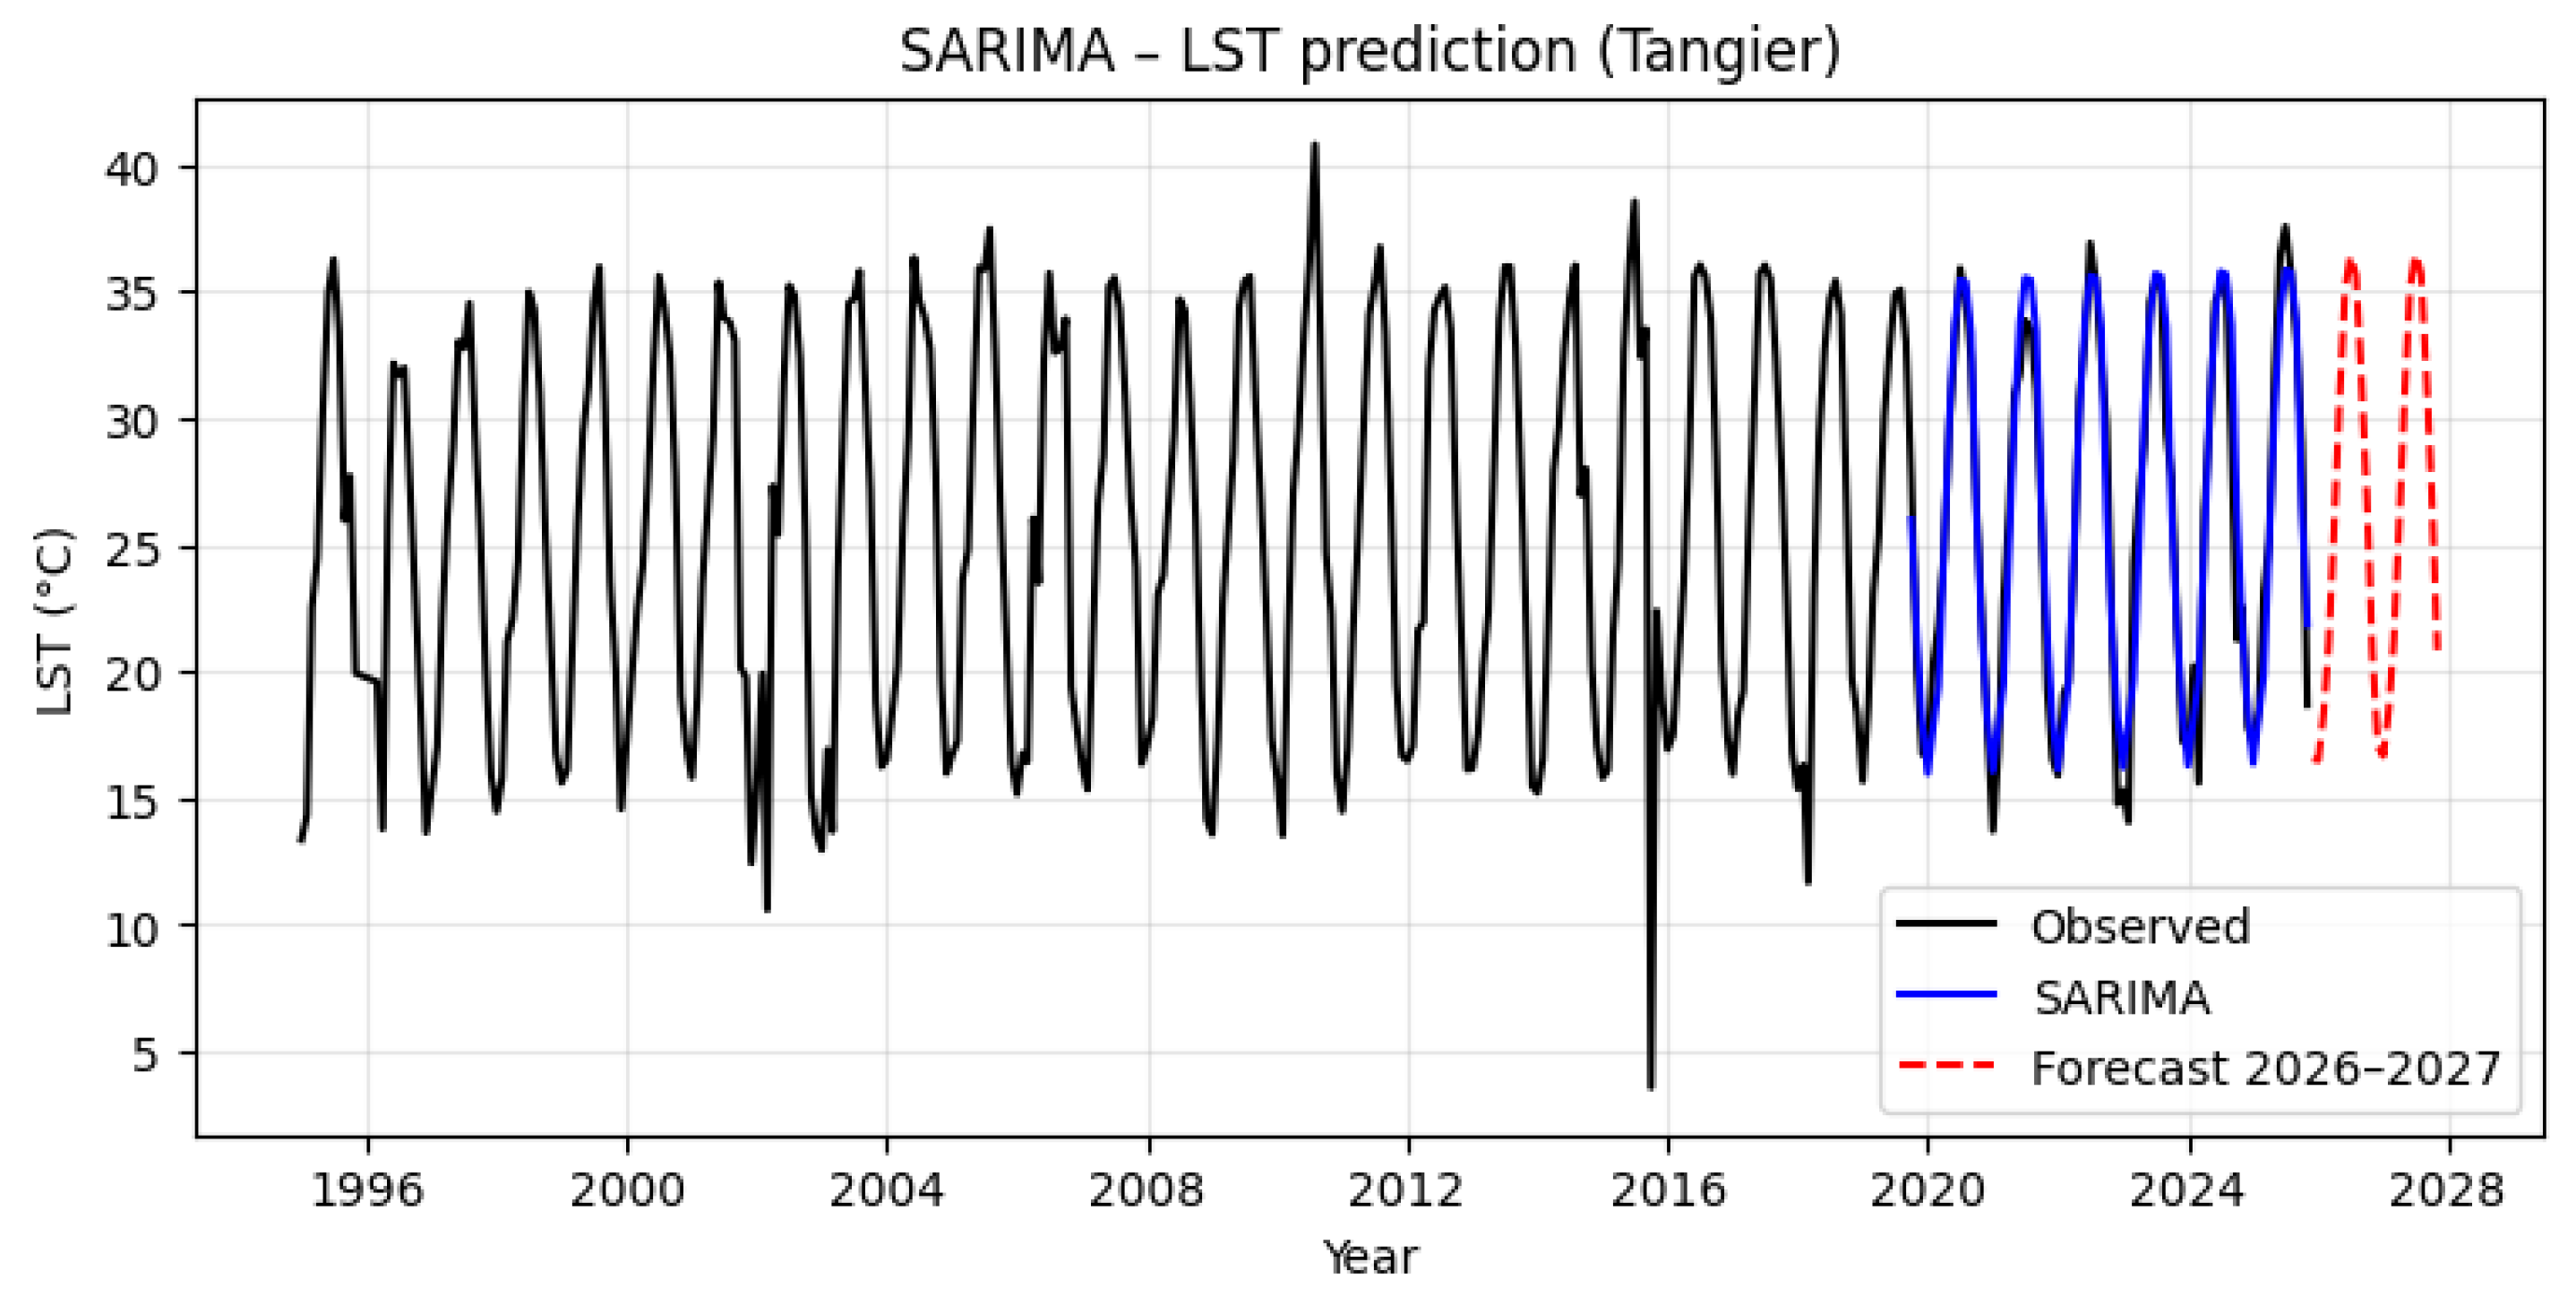
The results indicate that LST variability across the five cities is primarily governed by seasonal recurrence. The fitted SARIMA values reproduce the main temporal structure of the observed series with reasonable accuracy, especially the timing of seasonal maxima and minima. In Laayoune, the model identifies a clear seasonal thermal regime; forecasts for 2026–2027 indicate the continuation of this cyclical behavior within the historical range. Taza also presents a strongly seasonal LST regime, with the forecast indicating continuity rather than disruption. For Ifrane, the model reveals a marked seasonal structure consistent with the city’s mountainous setting. In Béni Mellal, SARIMA results similarly reveal a highly seasonal LST regime, with persistence of seasonal peaks suggesting that planning responses should prioritize heat-sensitive urban design. In Tangier, even though the SARIMA model identifies a clear annual structure, the amplitude of LST oscillations appears lower than in inland or mountainous cities, possibly reflecting the regulating influence of the coastal environment.
Overall, the SARIMA-based forecasting framework demonstrates that LST variability is dominated by seasonal recurrence and short-term fluctuations rather than by abrupt regime shifts. The forecasts consistently indicate that predicted LST values remain broadly within historical ranges, suggesting continuity of existing thermal regimes. This should not be interpreted as the absence of climate risk; rather, it highlights that near-future heat exposure is likely to remain organized around recurrent seasonal peaks. From an urban climate and planning perspective, this finding reinforces the need for adaptation strategies [2,9].
3.5.2. Random Forest-Based Forecasting of Land Surface Temperature
To complement the statistical time-series analysis, a Random Forest forecasting framework was applied. Random Forest is an ensemble machine-learning algorithm that combines multiple decision trees to improve predictive accuracy and reduce the risk of overfitting through bootstrap aggregation and random feature selection [14]. Its ability to model nonlinear relationships makes it particularly relevant for environmental and remote-sensing applications [22].
Figure 10.
Random Forest-based LST forecasting across the five studied cities.
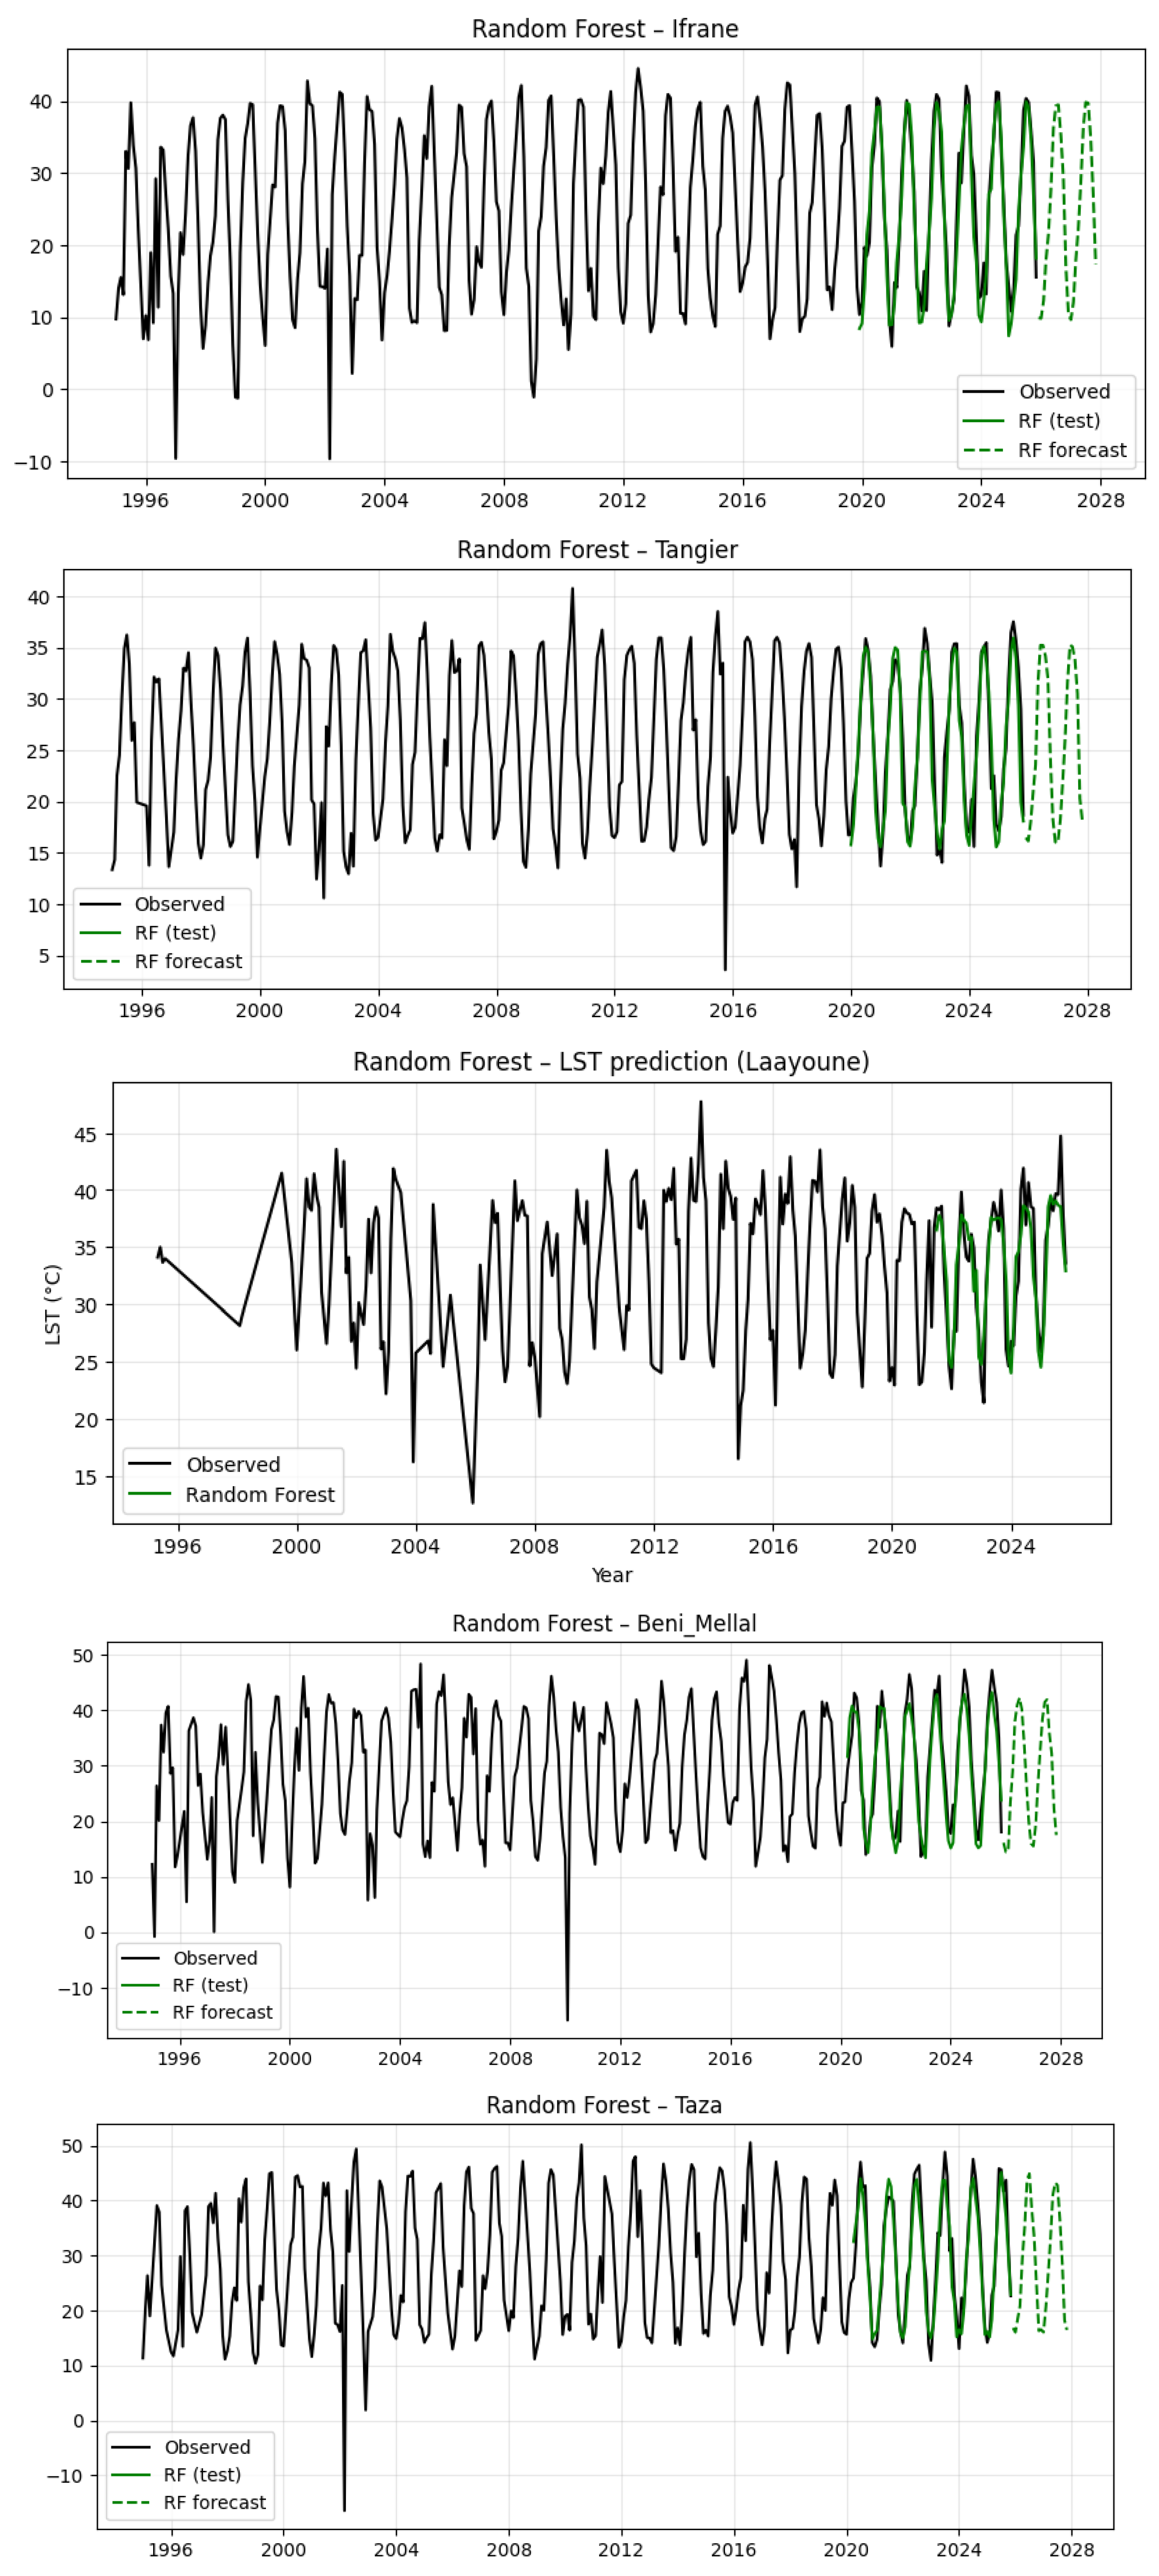
Across the five cities, the Random Forest results confirm that LST variability is strongly structured by seasonality. In Ifrane, the model demonstrates strong performance in reproducing seasonal oscillations consistent with the mountainous context. In Tangier, the model captures moderate thermal amplitude influenced by coastal conditions. For Laayoune, the model captures the principal temporal dynamics including irregular interannual fluctuations, demonstrating that machine-learning methods can effectively represent nonlinear thermal variability even in complex climatic settings. In Béni Mellal, the model accurately reproduces the strong seasonal structure with recurrent annual oscillations. In Taza, the model performs well in representing the strong seasonality of the LST series. Future extensions could integrate predictors such as NDVI, NDBI, humidity, land-cover change, soil moisture, and urban morphology to improve both predictive performance and interpretability.
3.5.3. XGBoost-Based Forecasting of Land Surface Temperature
Extreme Gradient Boosting (XGBoost) is an optimized gradient-boosting algorithm that builds an ensemble of decision trees sequentially, where each new tree corrects the residual errors of the previous ones. Its regularization mechanisms, scalability, and ability to capture nonlinear patterns have made it one of the most widely used algorithms for high-performance predictive modeling [15].
Figure 11.
XGBoost-based LST forecasting across four studied cities (Ifrane, Tangier, Taza, Laayoune).
Figure 11.
XGBoost-based LST forecasting across four studied cities (Ifrane, Tangier, Taza, Laayoune).
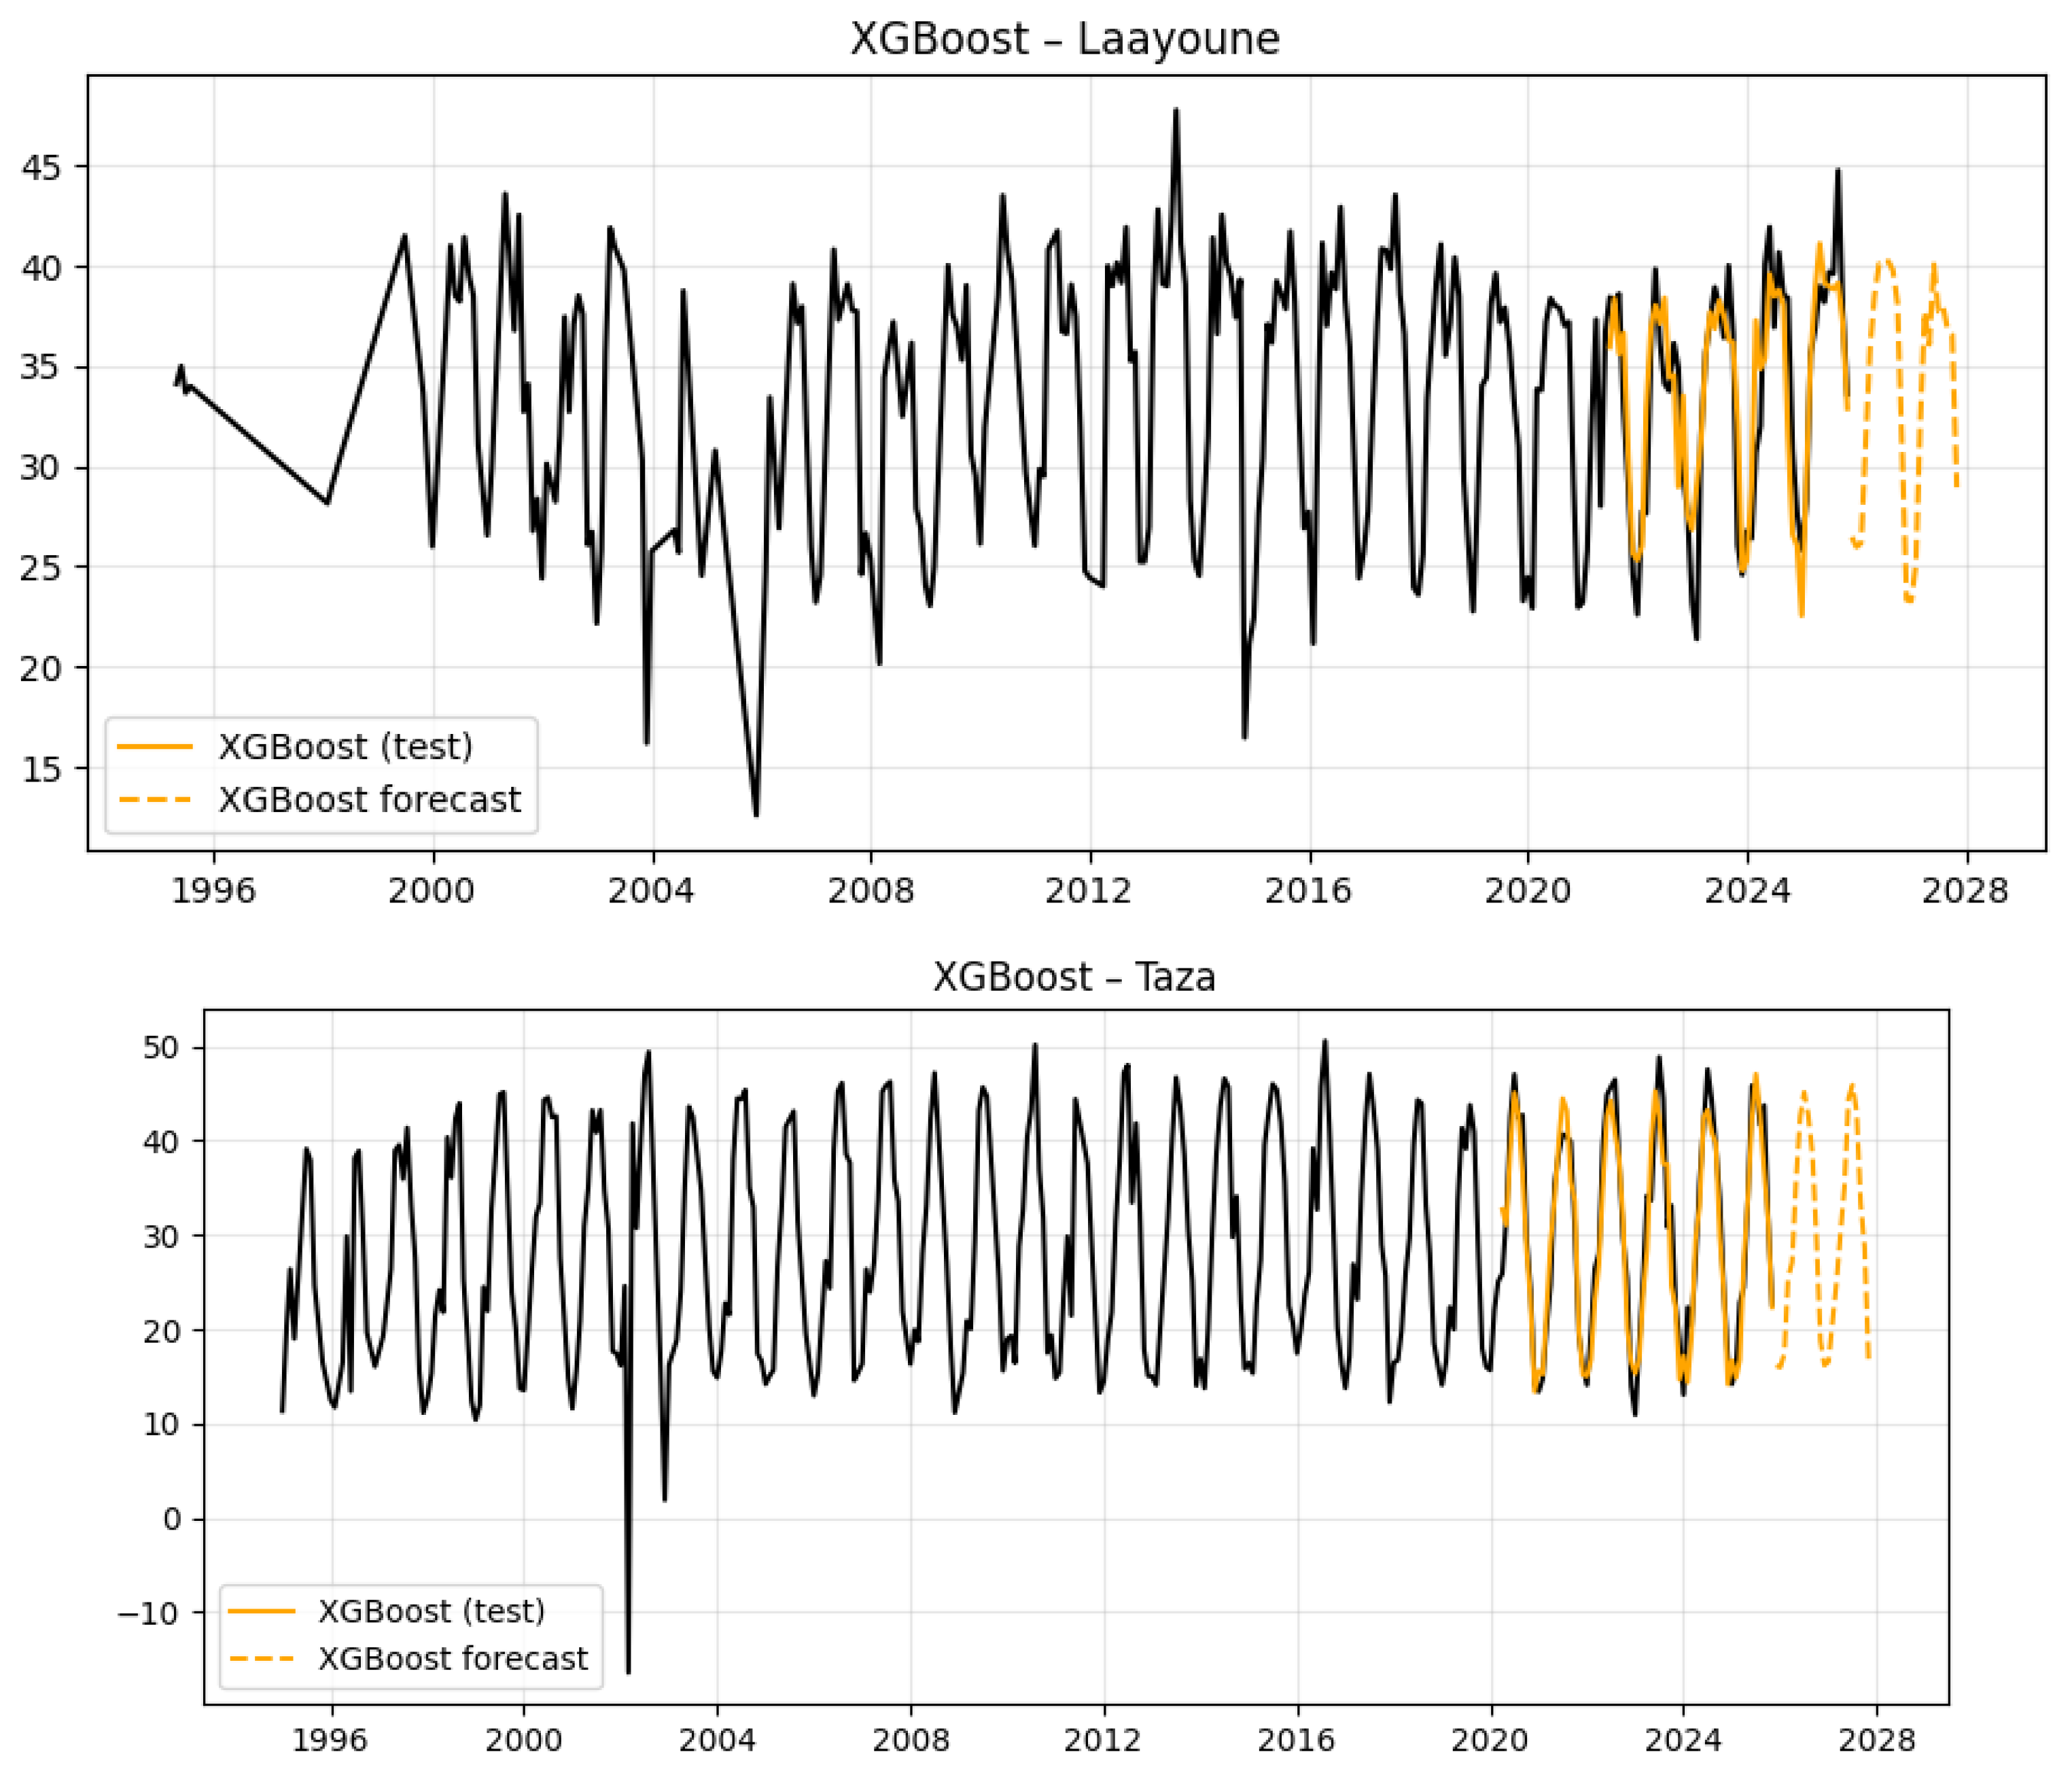
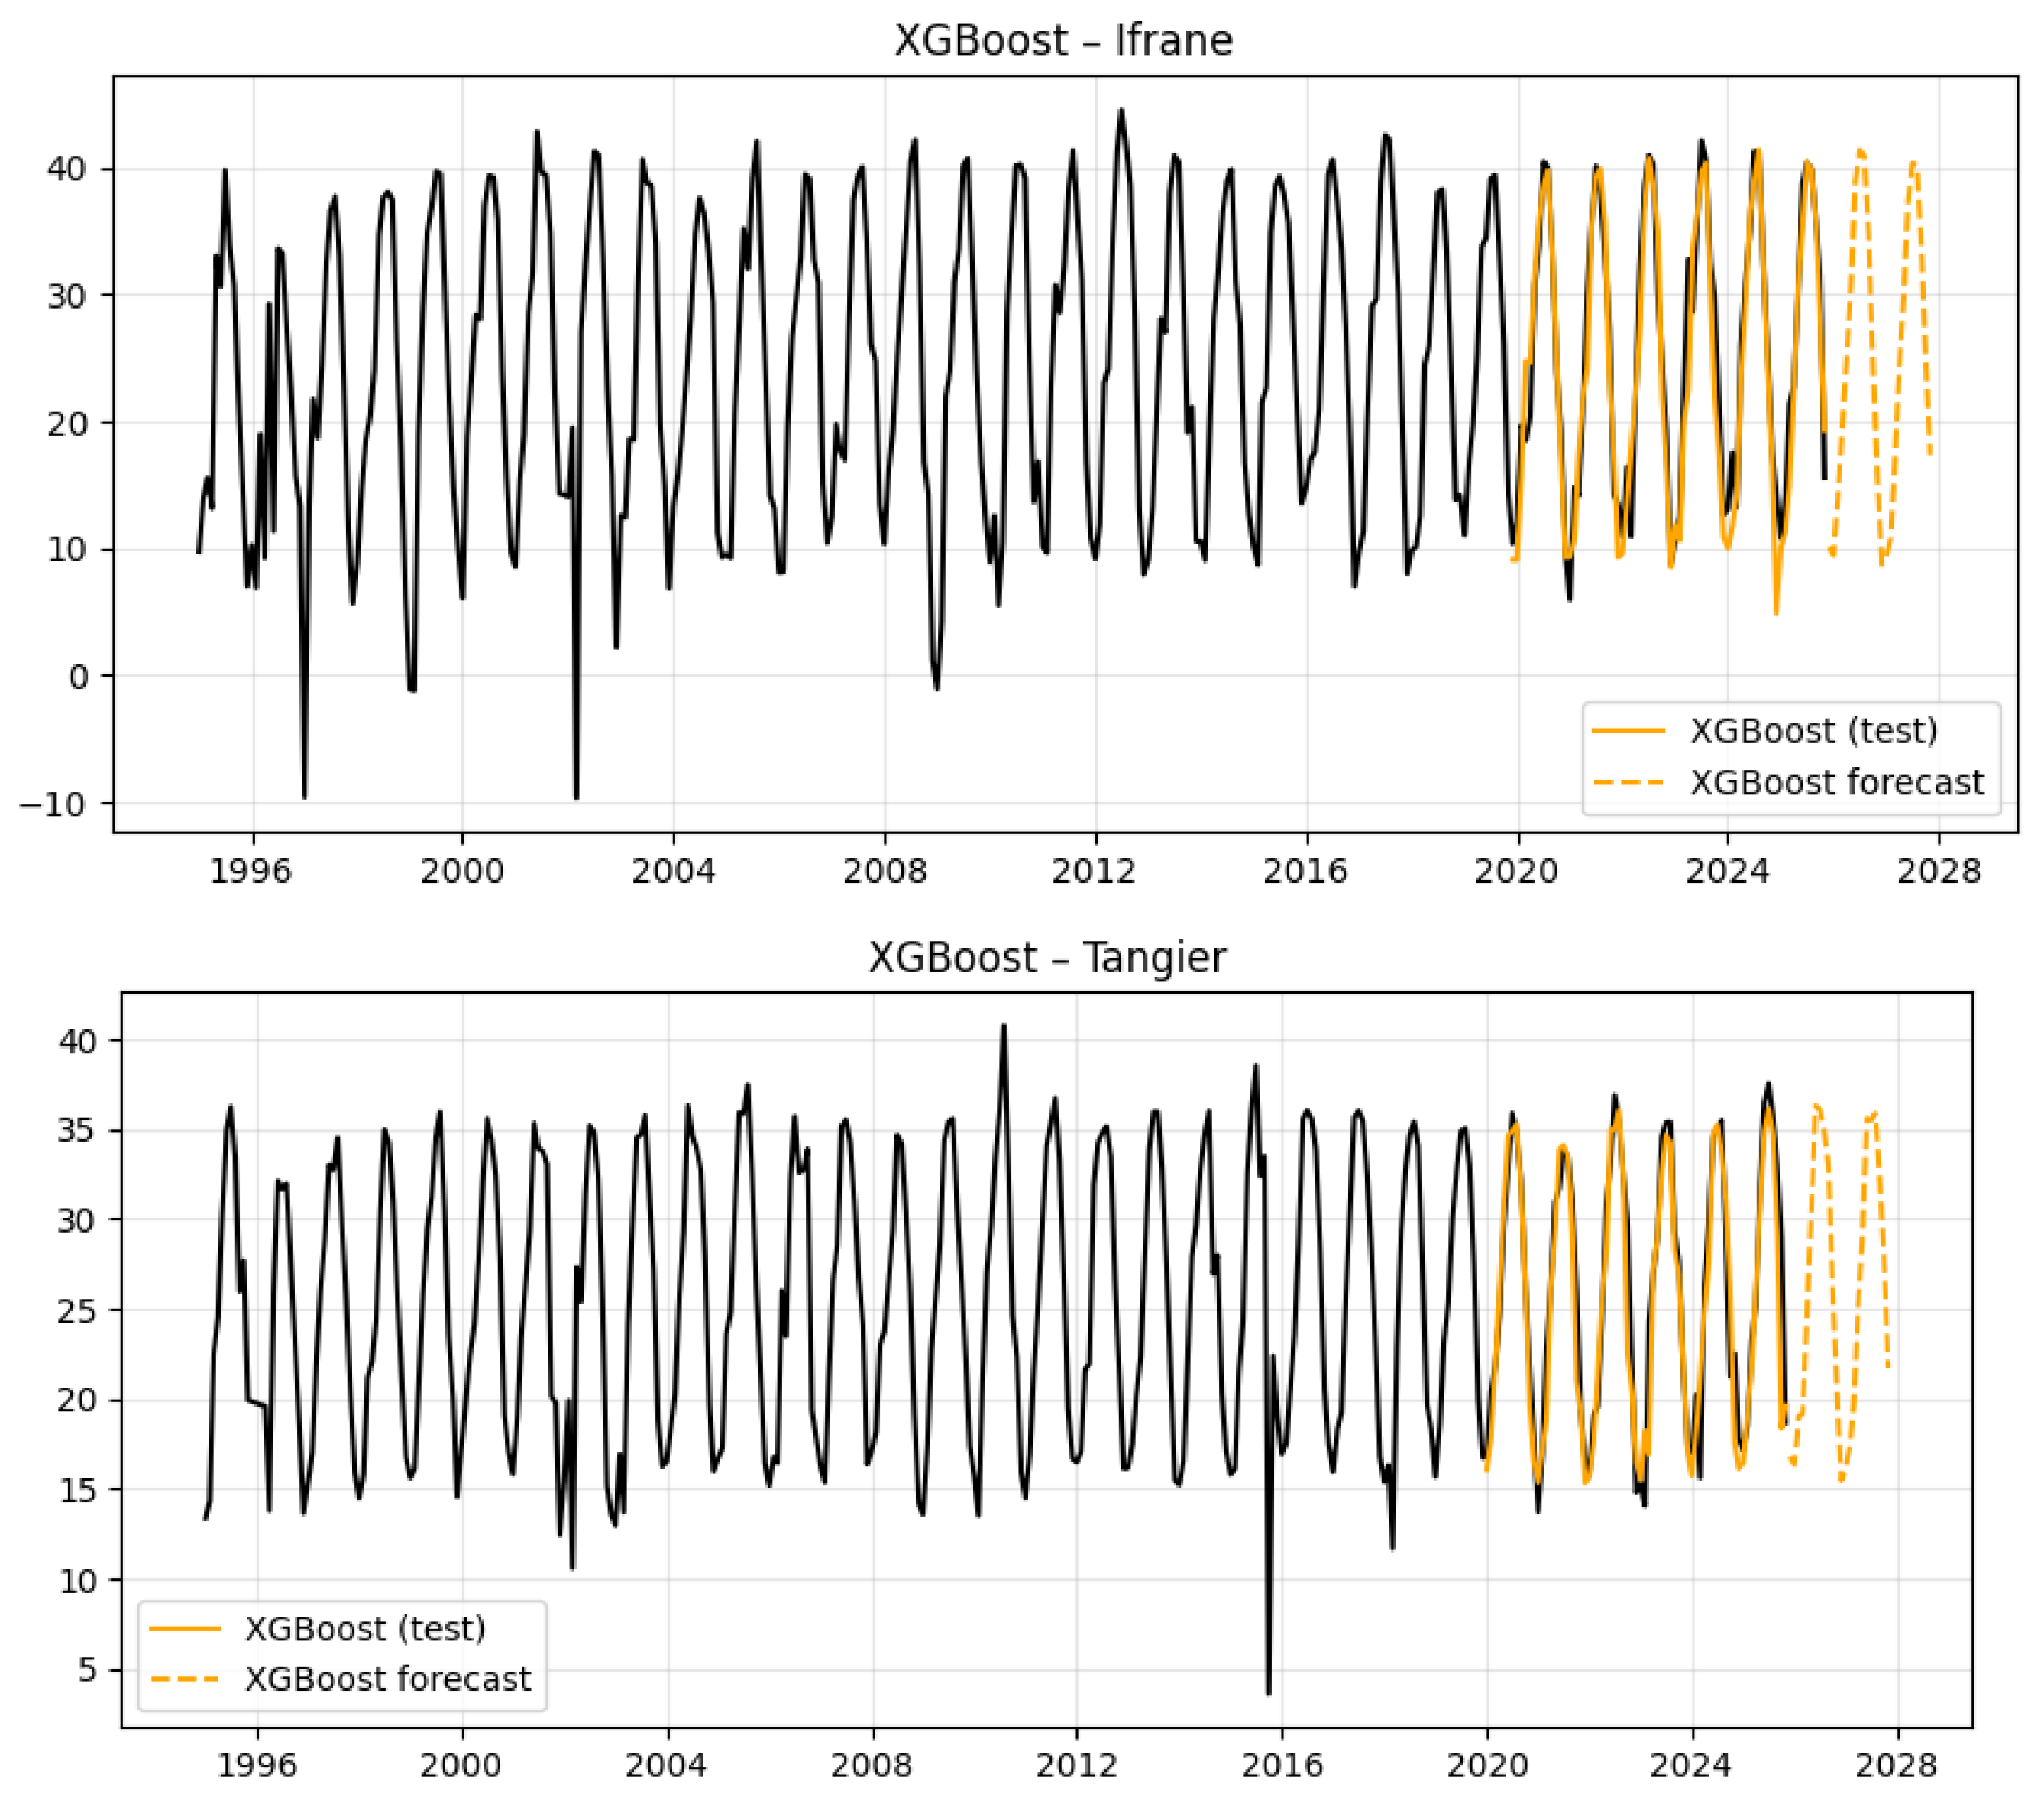
The results indicate that XGBoost effectively captures the dominant seasonal structure of LST, particularly in Taza, Ifrane, and Tangier, where annual oscillations are more regular and clearly defined. In Laayoune, despite a more irregular observed LST series, the XGBoost model reproduces the general thermal signal and projects continuity of the existing thermal regime. Compared with the other predictive approaches, XGBoost confirms two major findings: LST variability across the studied cities remains strongly seasonal, and the short-term forecasts do not suggest abrupt regime change. This convergence between machine-learning outputs and statistical time-series results strengthens the reliability of the predictive framework.
3.5.4. LSTM-Based Forecasting of Land Surface Temperature
A Long Short-Term Memory (LSTM) model was applied to further strengthen the predictive analysis. LSTM is particularly relevant for time-series forecasting when data exhibit temporal dependence, nonlinear dynamics, and recurrent seasonal behavior. Its capacity to learn dependencies between past and future observations without requiring a strictly linear specification makes it a powerful complement to SARIMA and tree-based methods [16].
Figure 12.
LSTM-based LST forecasting across the five studied cities.
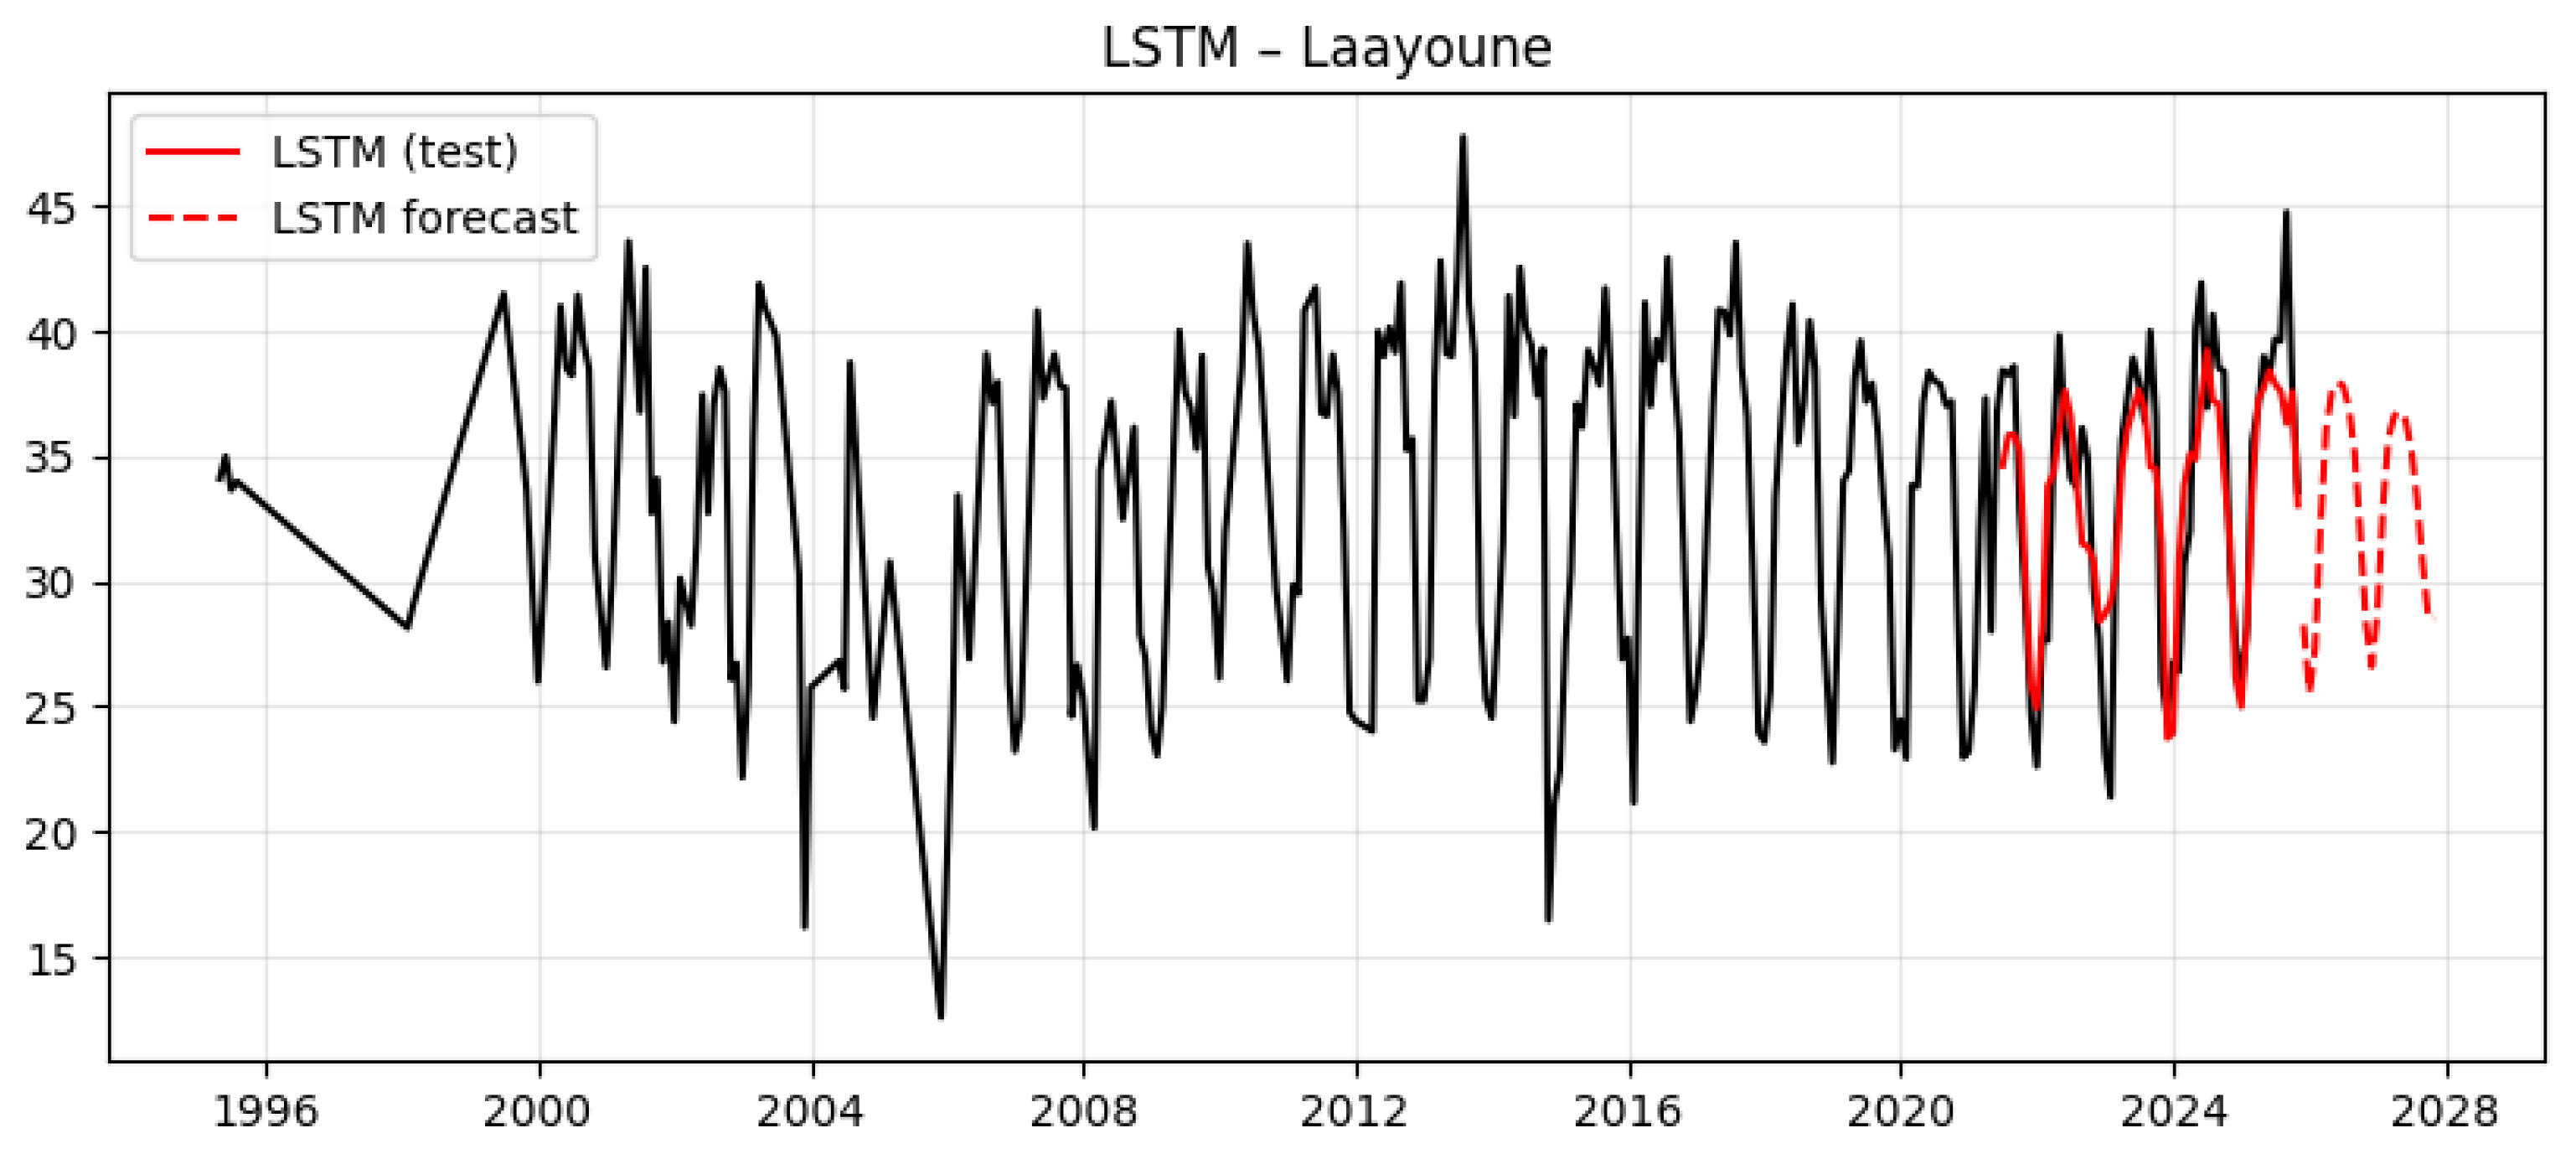
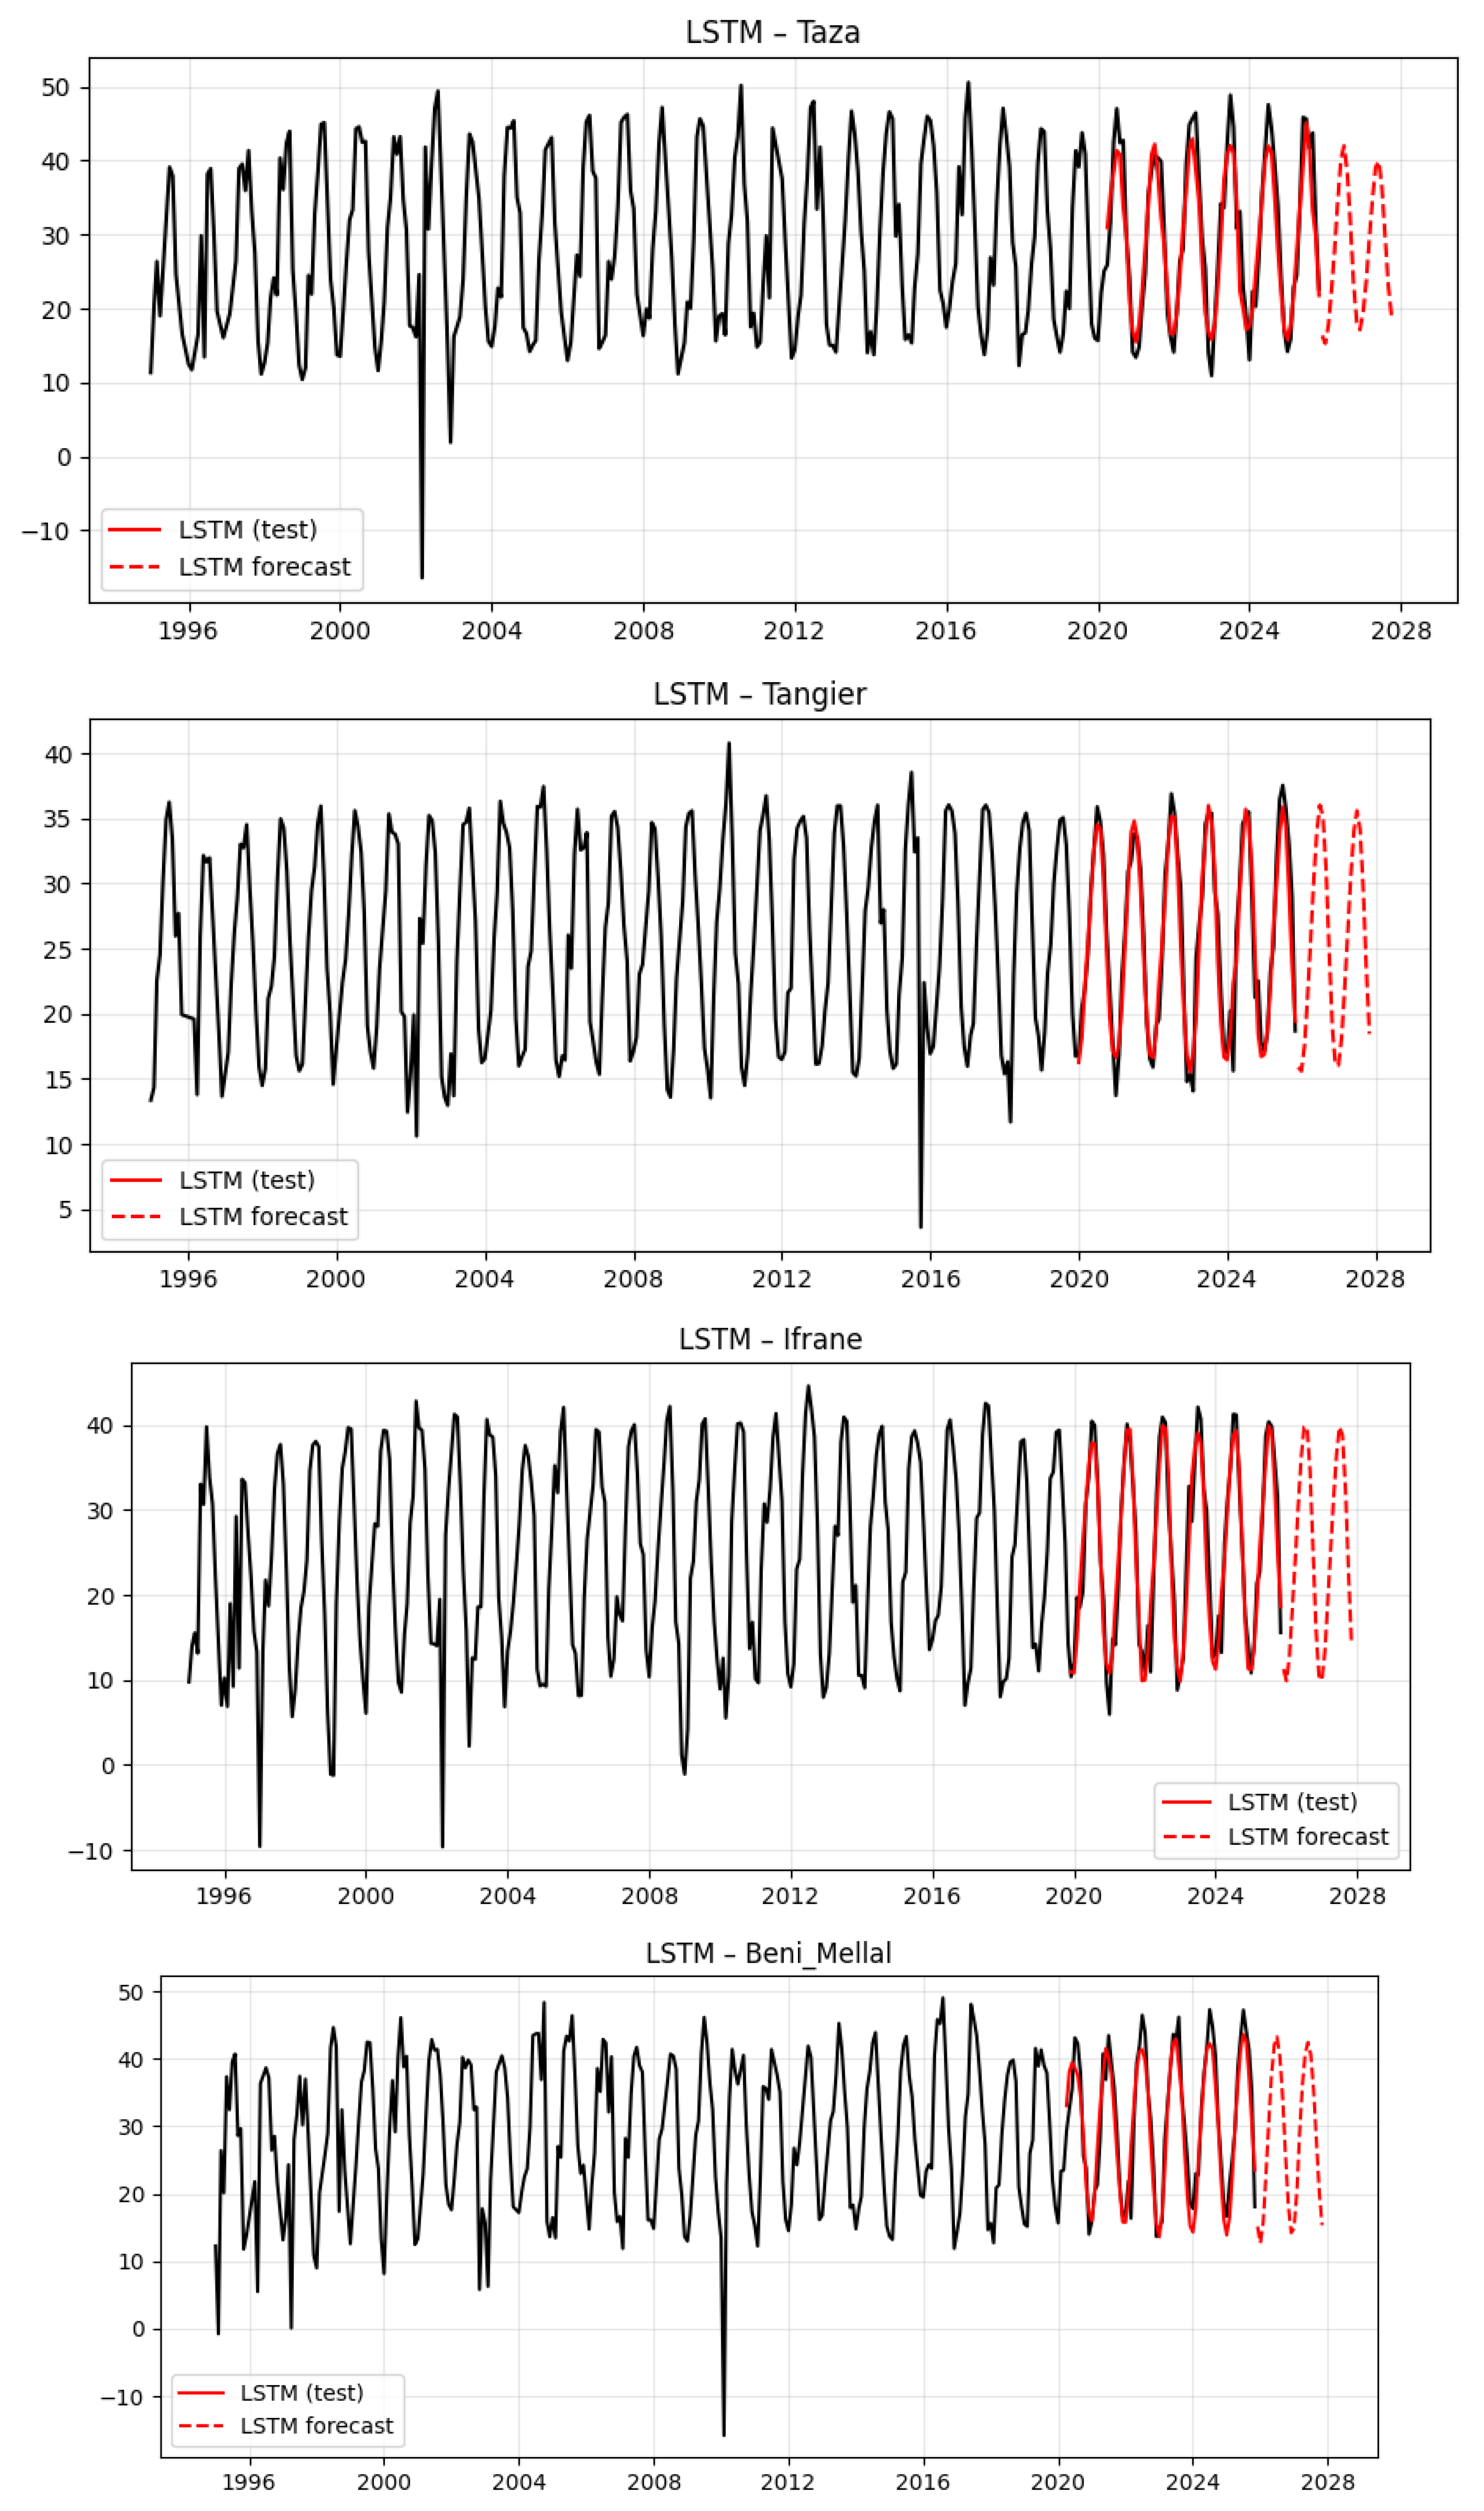
The results show that the LSTM model demonstrates a strong ability to reproduce the seasonal dynamics of LST across all five cities. The 2026–2027 forecasts remain broadly within the historical thermal range, suggesting continuity of the existing thermal regimes rather than abrupt regime shifts. In Taza, the model reproduces high-amplitude annual oscillations. In Ifrane, regular seasonal patterns consistent with mountainous context are captured. In Béni Mellal, strong cyclical behavior is reproduced. In Tangier, the LSTM captures the main temporal pattern with lower amplitude than inland cities. Laayoune presents a more irregular LST signal, yet the model still captures the general thermal structure and projects continuity within the historical range.
The convergence between LSTM, SARIMA, Random Forest, and XGBoost strengthens the robustness of the predictive interpretation. Across the different modeling approaches, the forecasts consistently indicate persistence of the existing seasonal regimes over the 2026–2027 horizon. This does not mean that urban heat risk is insignificant; rather, it suggests that heat exposure is likely to remain organized around recurrent seasonal peaks. From an urban climate perspective, this finding reinforces the importance of adaptation strategies.
3.5.5. Model Evaluation and Comparative Analysis
Table 2.
Comparative performance of SARIMA, Random Forest, XGBoost, and LSTM models for LST forecasting across the five studied cities.
Table 2.
Comparative performance of SARIMA, Random Forest, XGBoost, and LSTM models for LST forecasting across the five studied cities.
| City | Model | RMSE | MAE | R² |
|---|---|---|---|---|
| Béni Mellal | SARIMA | 3.47 | 2.82 | 0.88 |
| Béni Mellal | LSTM | 3.54 | 2.94 | 0.88 |
| Béni Mellal | Random Forest | 3.75 | 3.17 | 0.86 |
| Béni Mellal | XGBoost | 4.08 | 3.35 | 0.84 |
| Ifrane | SARIMA | 2.65 | 2.05 | 0.94 |
| Ifrane | LSTM | 3.07 | 2.43 | 0.92 |
| Ifrane | Random Forest | 3.24 | 2.61 | 0.91 |
| Ifrane | XGBoost | 3.36 | 2.54 | 0.90 |
| Laayoune | Random Forest | 2.61 | 2.06 | 0.79 |
| Laayoune | XGBoost | 3.05 | 2.33 | 0.72 |
| Laayoune | LSTM | 3.14 | 2.46 | 0.70 |
| Laayoune | SARIMA | 3.54 | 2.79 | 0.61 |
| Tangier | SARIMA | 1.93 | 1.45 | 0.93 |
| Tangier | LSTM | 2.04 | 1.58 | 0.92 |
| Tangier | Random Forest | 2.55 | 1.84 | 0.87 |
| Tangier | XGBoost | 2.59 | 1.74 | 0.87 |
| Taza | Random Forest | 3.44 | 2.83 | 0.90 |
| Taza | XGBoost | 3.63 | 2.91 | 0.89 |
| Taza | LSTM | 3.97 | 3.23 | 0.87 |
| Taza | SARIMA | 7.90 | 6.72 | 0.48 |
The comparative evaluation reveals contrasted predictive performances across the five studied cities. Overall, SARIMA provides the best results in cities where the land surface temperature series follows a regular and stable seasonal structure. This is particularly evident in Ifrane and Tangier, where SARIMA records the lowest RMSE and MAE values and the highest coefficients of determination, with R² values of 0.94 and 0.93, respectively. In Béni Mellal, SARIMA and LSTM show comparable performance, both reaching an R² of 0.88, although SARIMA slightly outperforms LSTM in terms of RMSE and MAE. These results are consistent with the methodological strengths of seasonal autoregressive models, which are particularly suitable for time series governed by recurrent periodicity [20,21].
By contrast, machine-learning and deep-learning models perform better in contexts where the thermal signal is more irregular, nonlinear, or affected by complex short-term fluctuations. This is especially visible in Laayoune and Taza. In Laayoune, Random Forest achieves the best performance with the lowest RMSE of 2.61, the lowest MAE of 2.06, and the highest R² of 0.79, indicating its capacity to capture complex temporal variability. In Taza, SARIMA performs poorly with an R² of only 0.48, while Random Forest, XGBoost, and LSTM achieve substantially higher explanatory power with R² values of 0.90, 0.89, and 0.87, respectively. These results reflect the ability of ensemble-learning and deep-learning models to capture nonlinear relationships and complex temporal structures in environmental data [14,15,16].
Overall, the comparison demonstrates that no single model systematically outperforms the others across all cities; rather, model performance depends on the temporal structure, seasonal regularity, and climatic specificity of each urban context. This supports the use of multi-model forecasting frameworks in urban climate studies, particularly because LST is influenced by interacting climatic, surface, and urban morphological factors [2,9].
3.6. Urbanization Effects on UHI Dynamics
Urbanization is widely recognized as a major driver of the Urban Heat Island effect, as the transformation of natural surfaces into built-up areas alters the surface energy balance and thermal properties of cities. In this section, we analyze both the magnitude and the direction of this effect across the five studied cities, with the aim of assessing how land-cover and urbanization dynamics influence UHI intensity under different local environmental conditions.
Figure 13.
Distribution of UHI intensity across land-cover classes (MODIS MCD12Q1 IGBP classification).
Figure 13.
Distribution of UHI intensity across land-cover classes (MODIS MCD12Q1 IGBP classification).
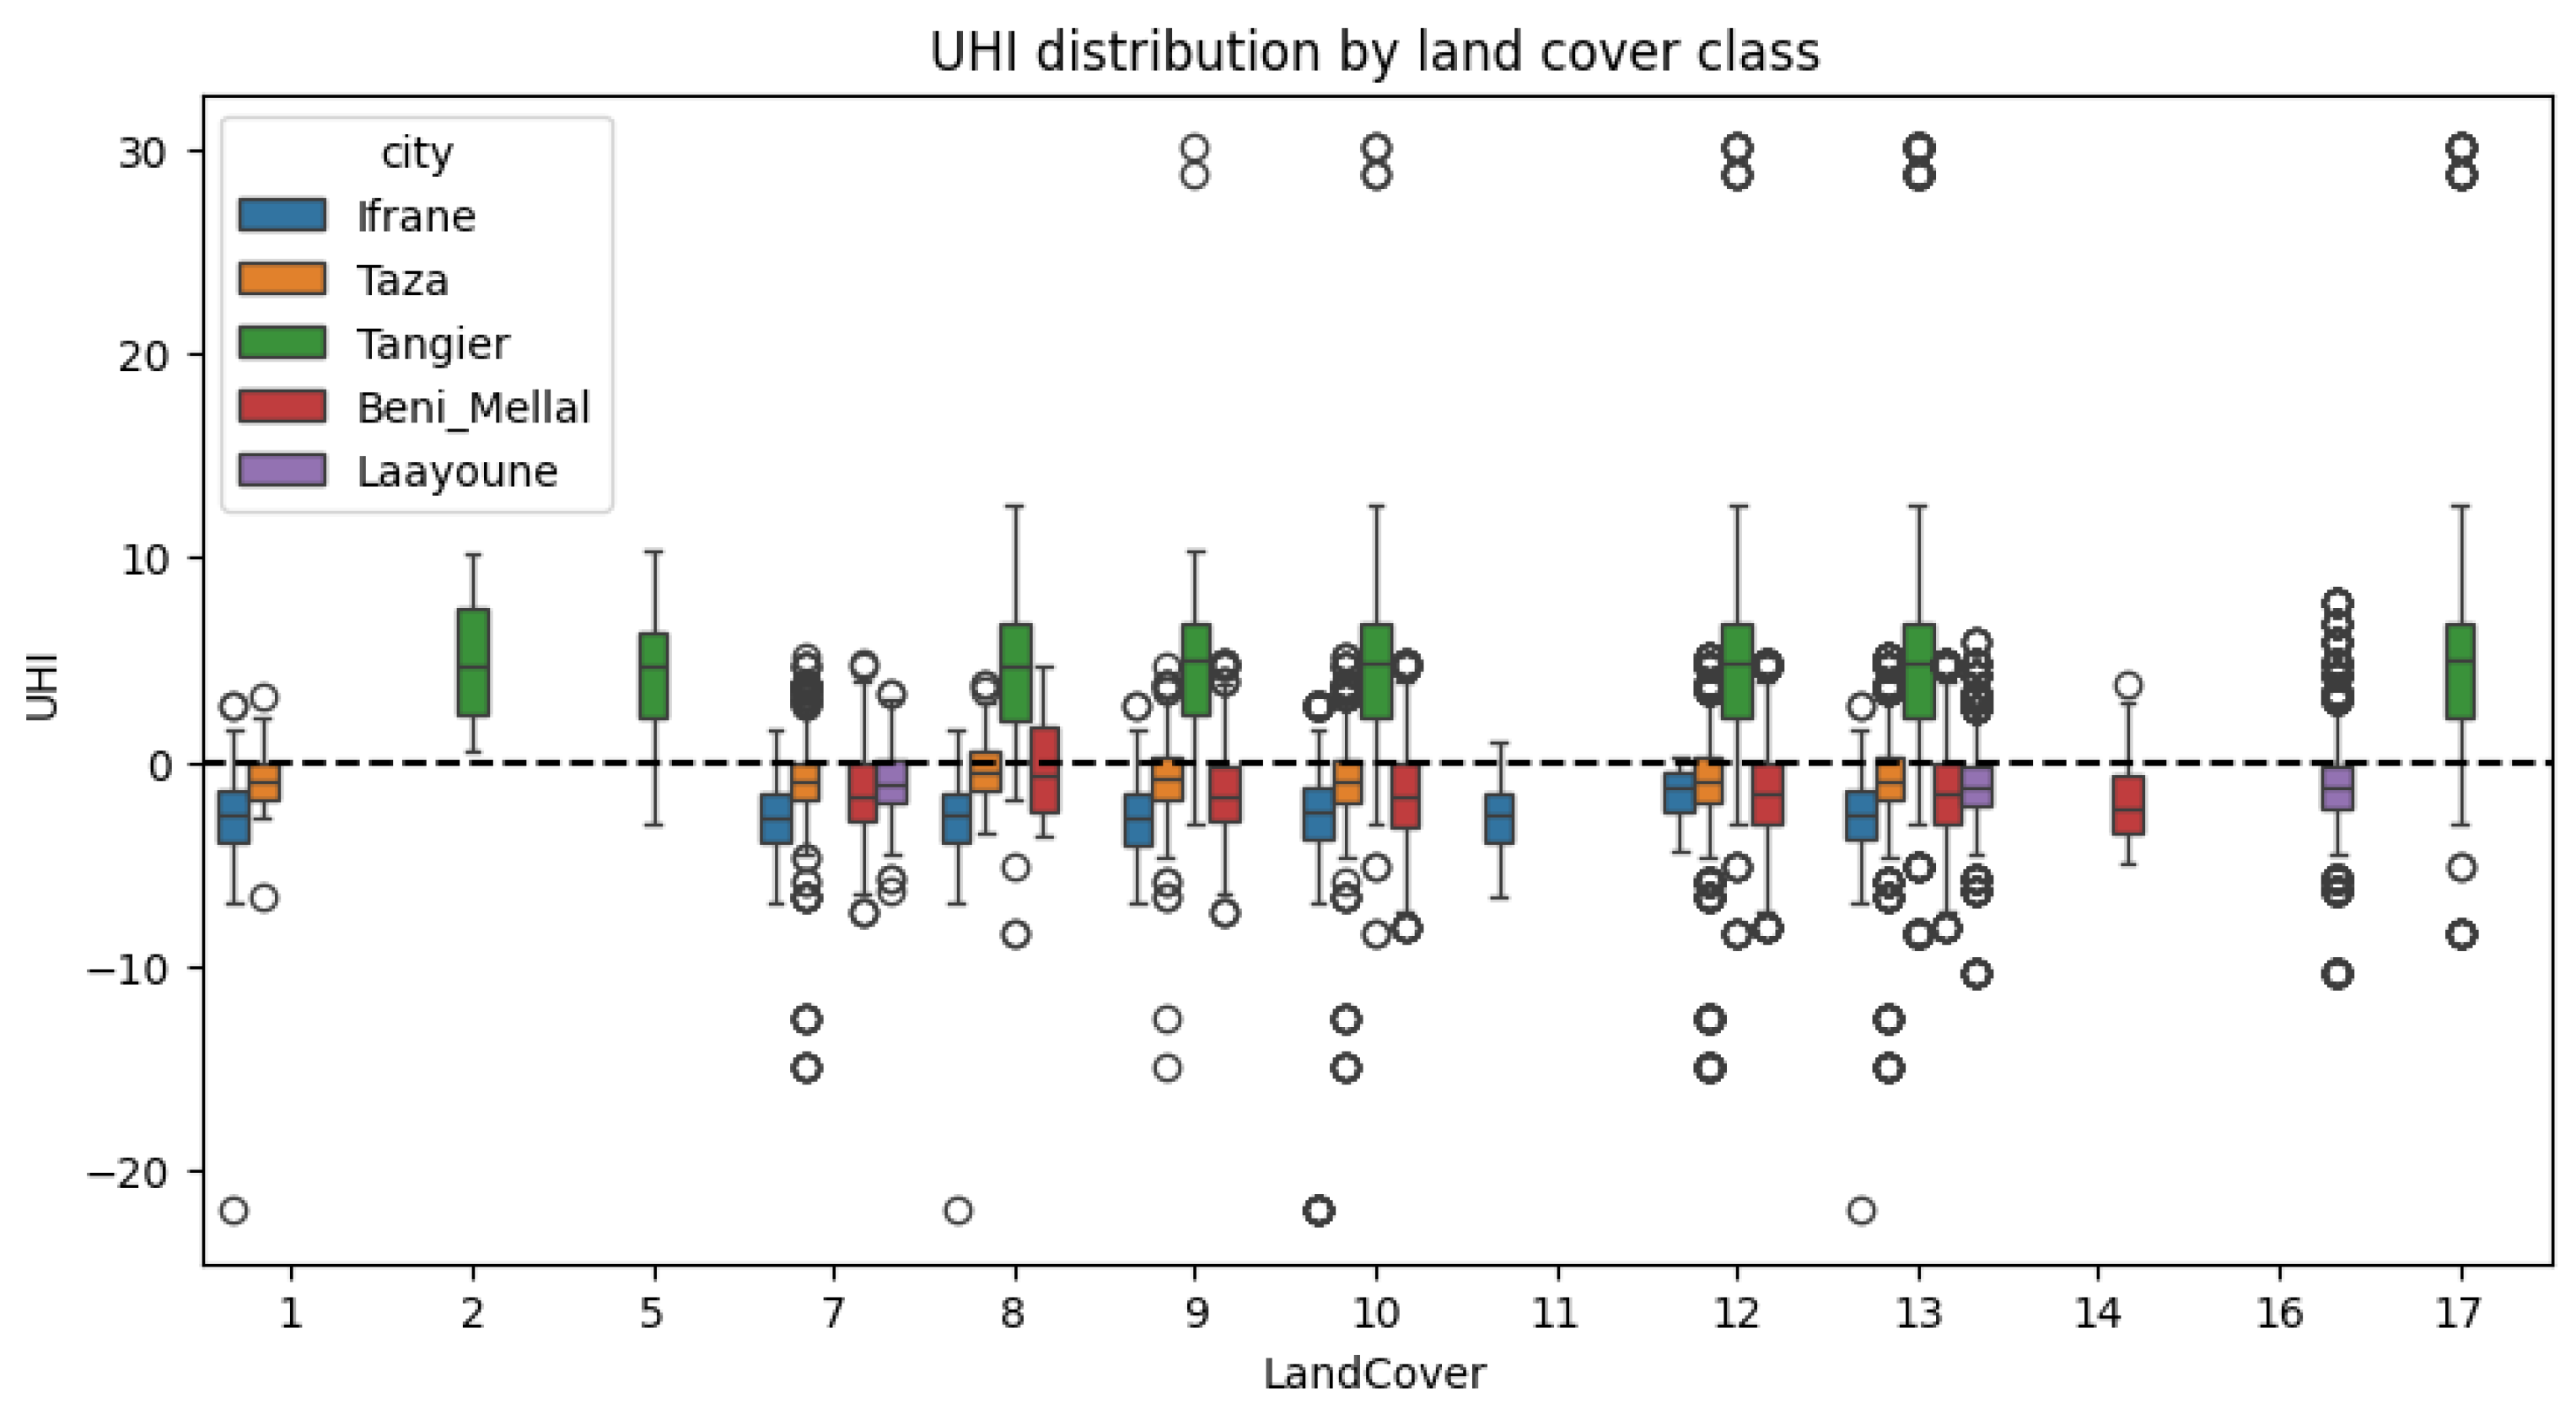
The distribution of UHI intensity across land-cover classes was analyzed using the MODIS MCD12Q1 IGBP classification scheme. Each box represents the interquartile range, with the median shown as a central line, whiskers extending to 1.5 × IQR, and outliers indicating extreme values. The dashed horizontal line at zero distinguishes positive UHI (urban areas warmer than surroundings) from negative values indicating UHS conditions. These results indicate that, even when considering the same land-cover class, pixels located in the urban core tend to be warmer than those in the periphery. This departure highlights the influence of urban context—such as higher building density, anthropogenic heat emissions, and reduced airflow—on LST, beyond the effect of land cover alone, particularly in the case of Tangier. Conversely, classes with median values close to zero follow the expected pattern, suggesting limited spatial influence.
Figure 14.
Relationship between urban land-cover fraction and mean UHI intensity.
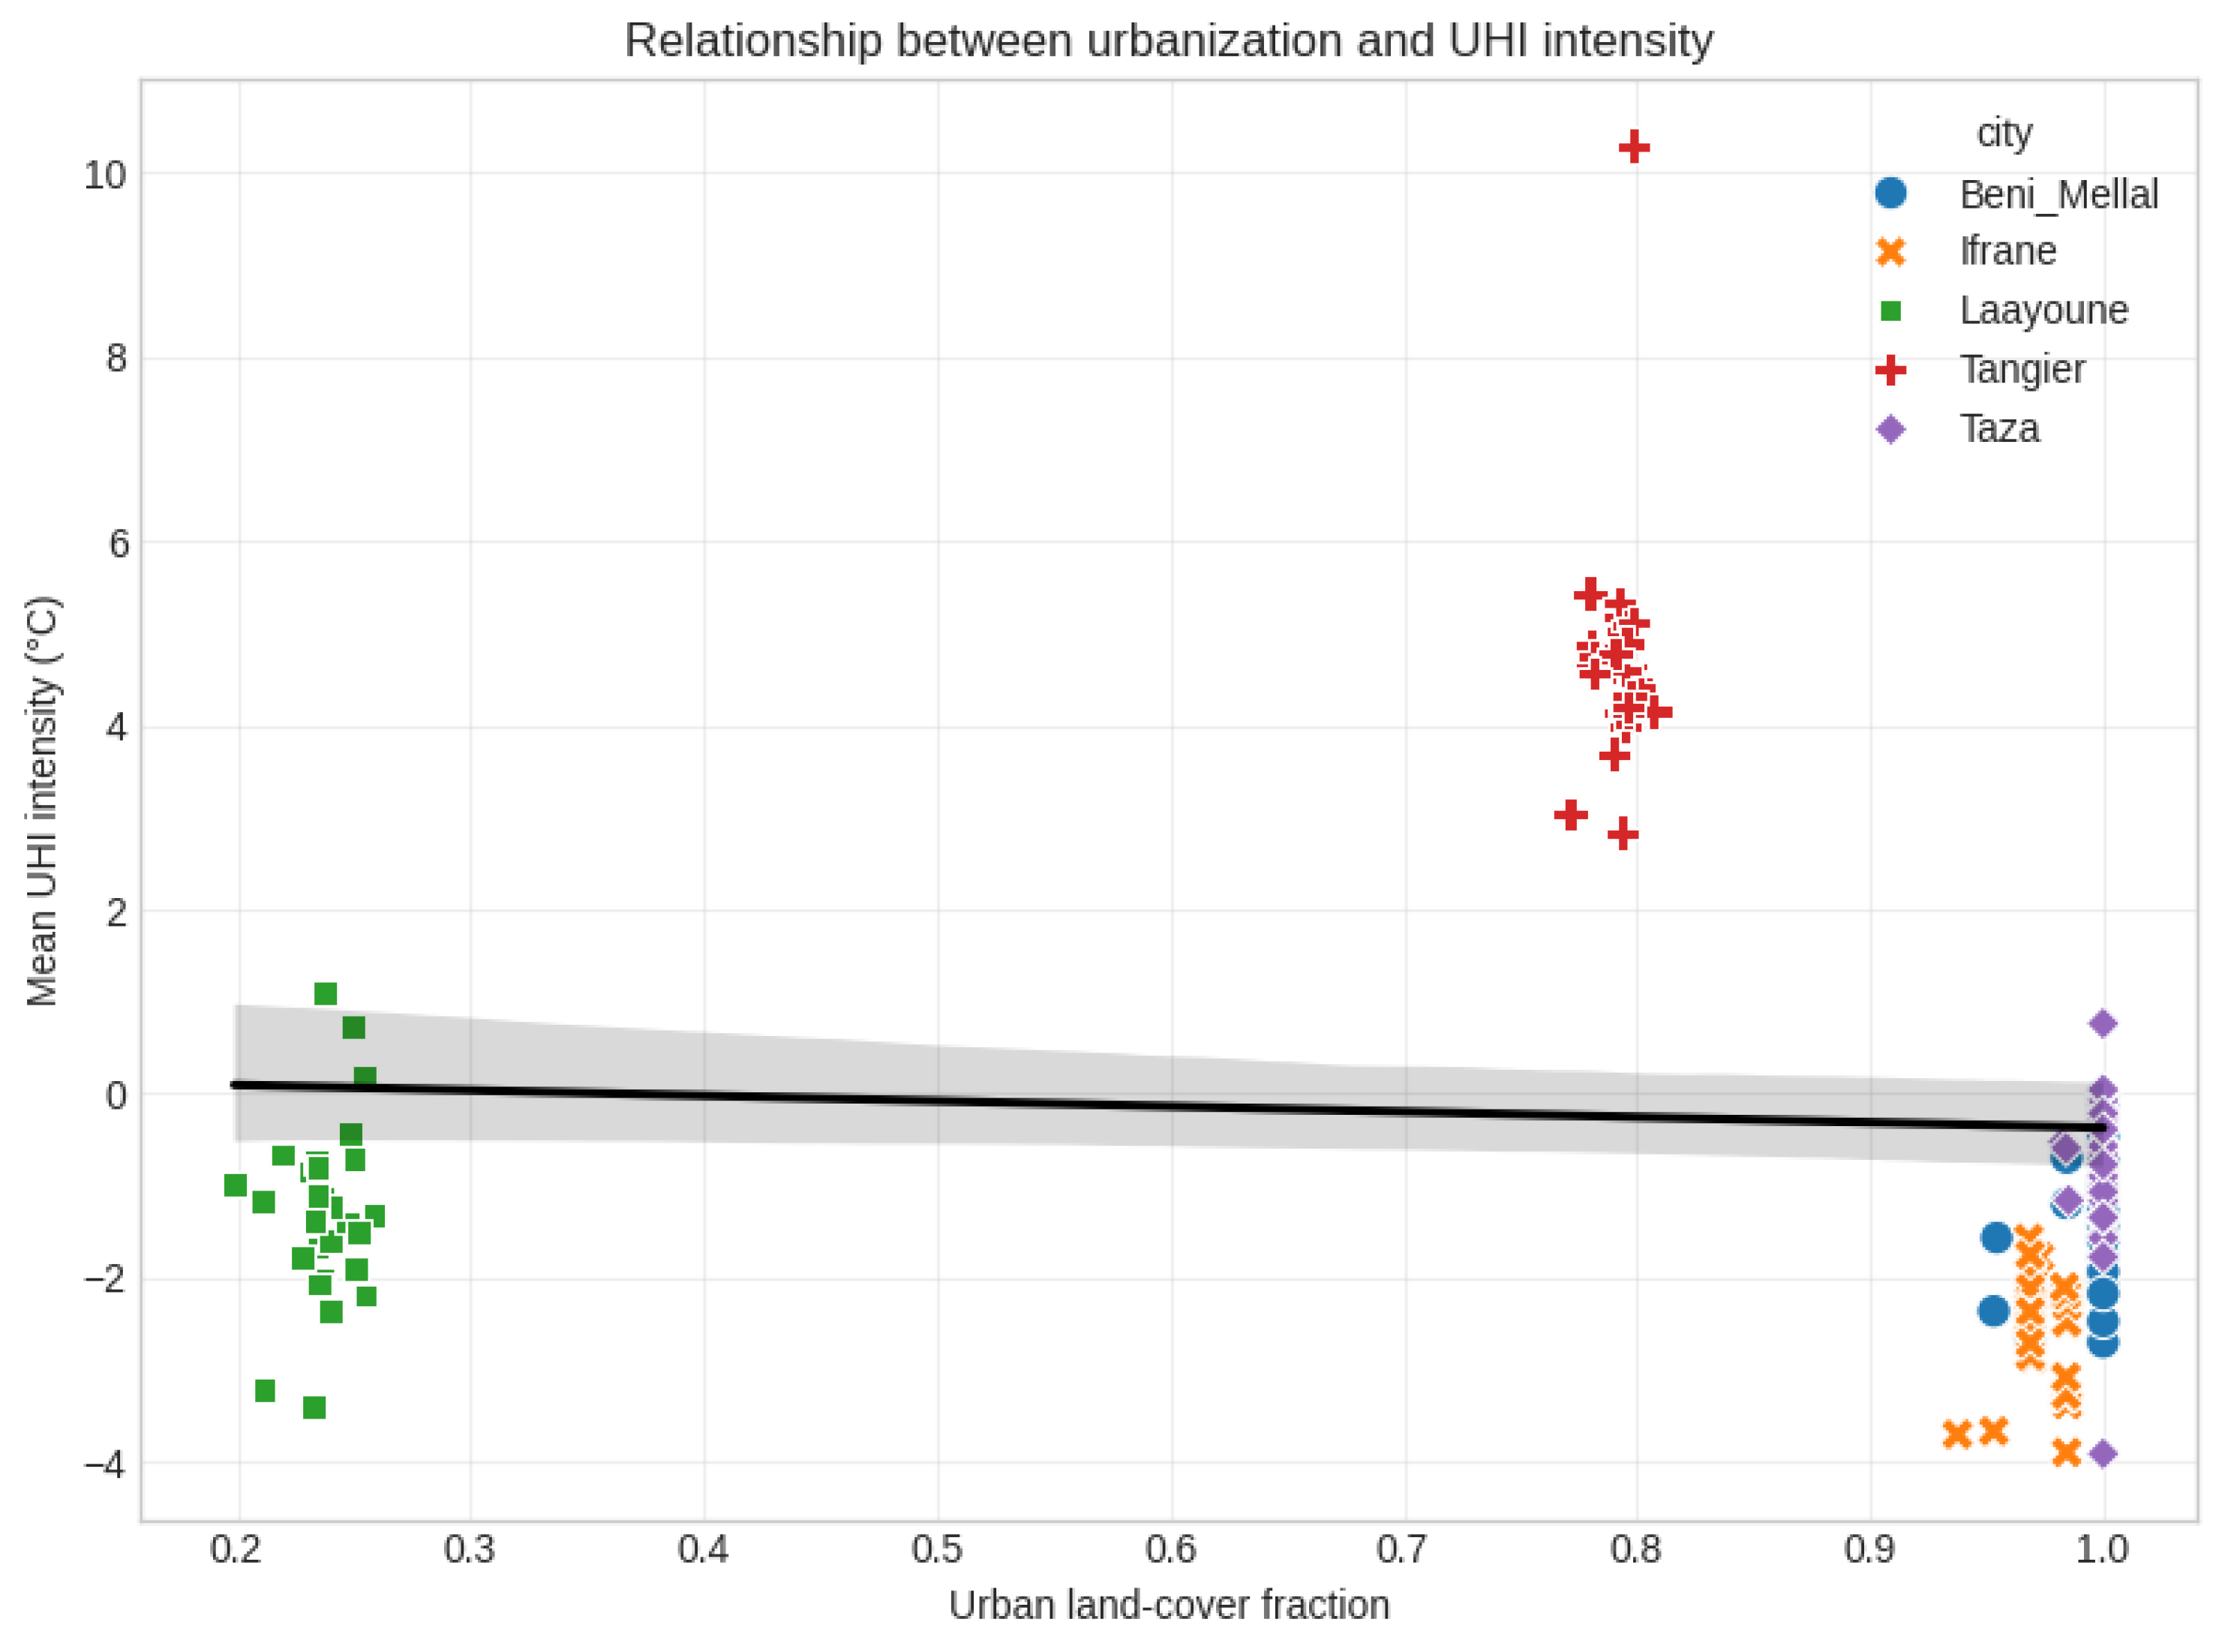
The analysis of the relationship between urban land-cover fraction and mean UHI intensity reveals a weak and slightly negative relationship overall, as indicated by the nearly flat regression line. This suggests that increasing urbanization alone does not systematically lead to stronger UHI effects across the studied cities. Instead, UHI intensity appears to be more strongly influenced by local conditions than by the proportion of urban land cover itself.
Figure 15.
City-scale relationship between urban land-cover fraction and UHI intensity.
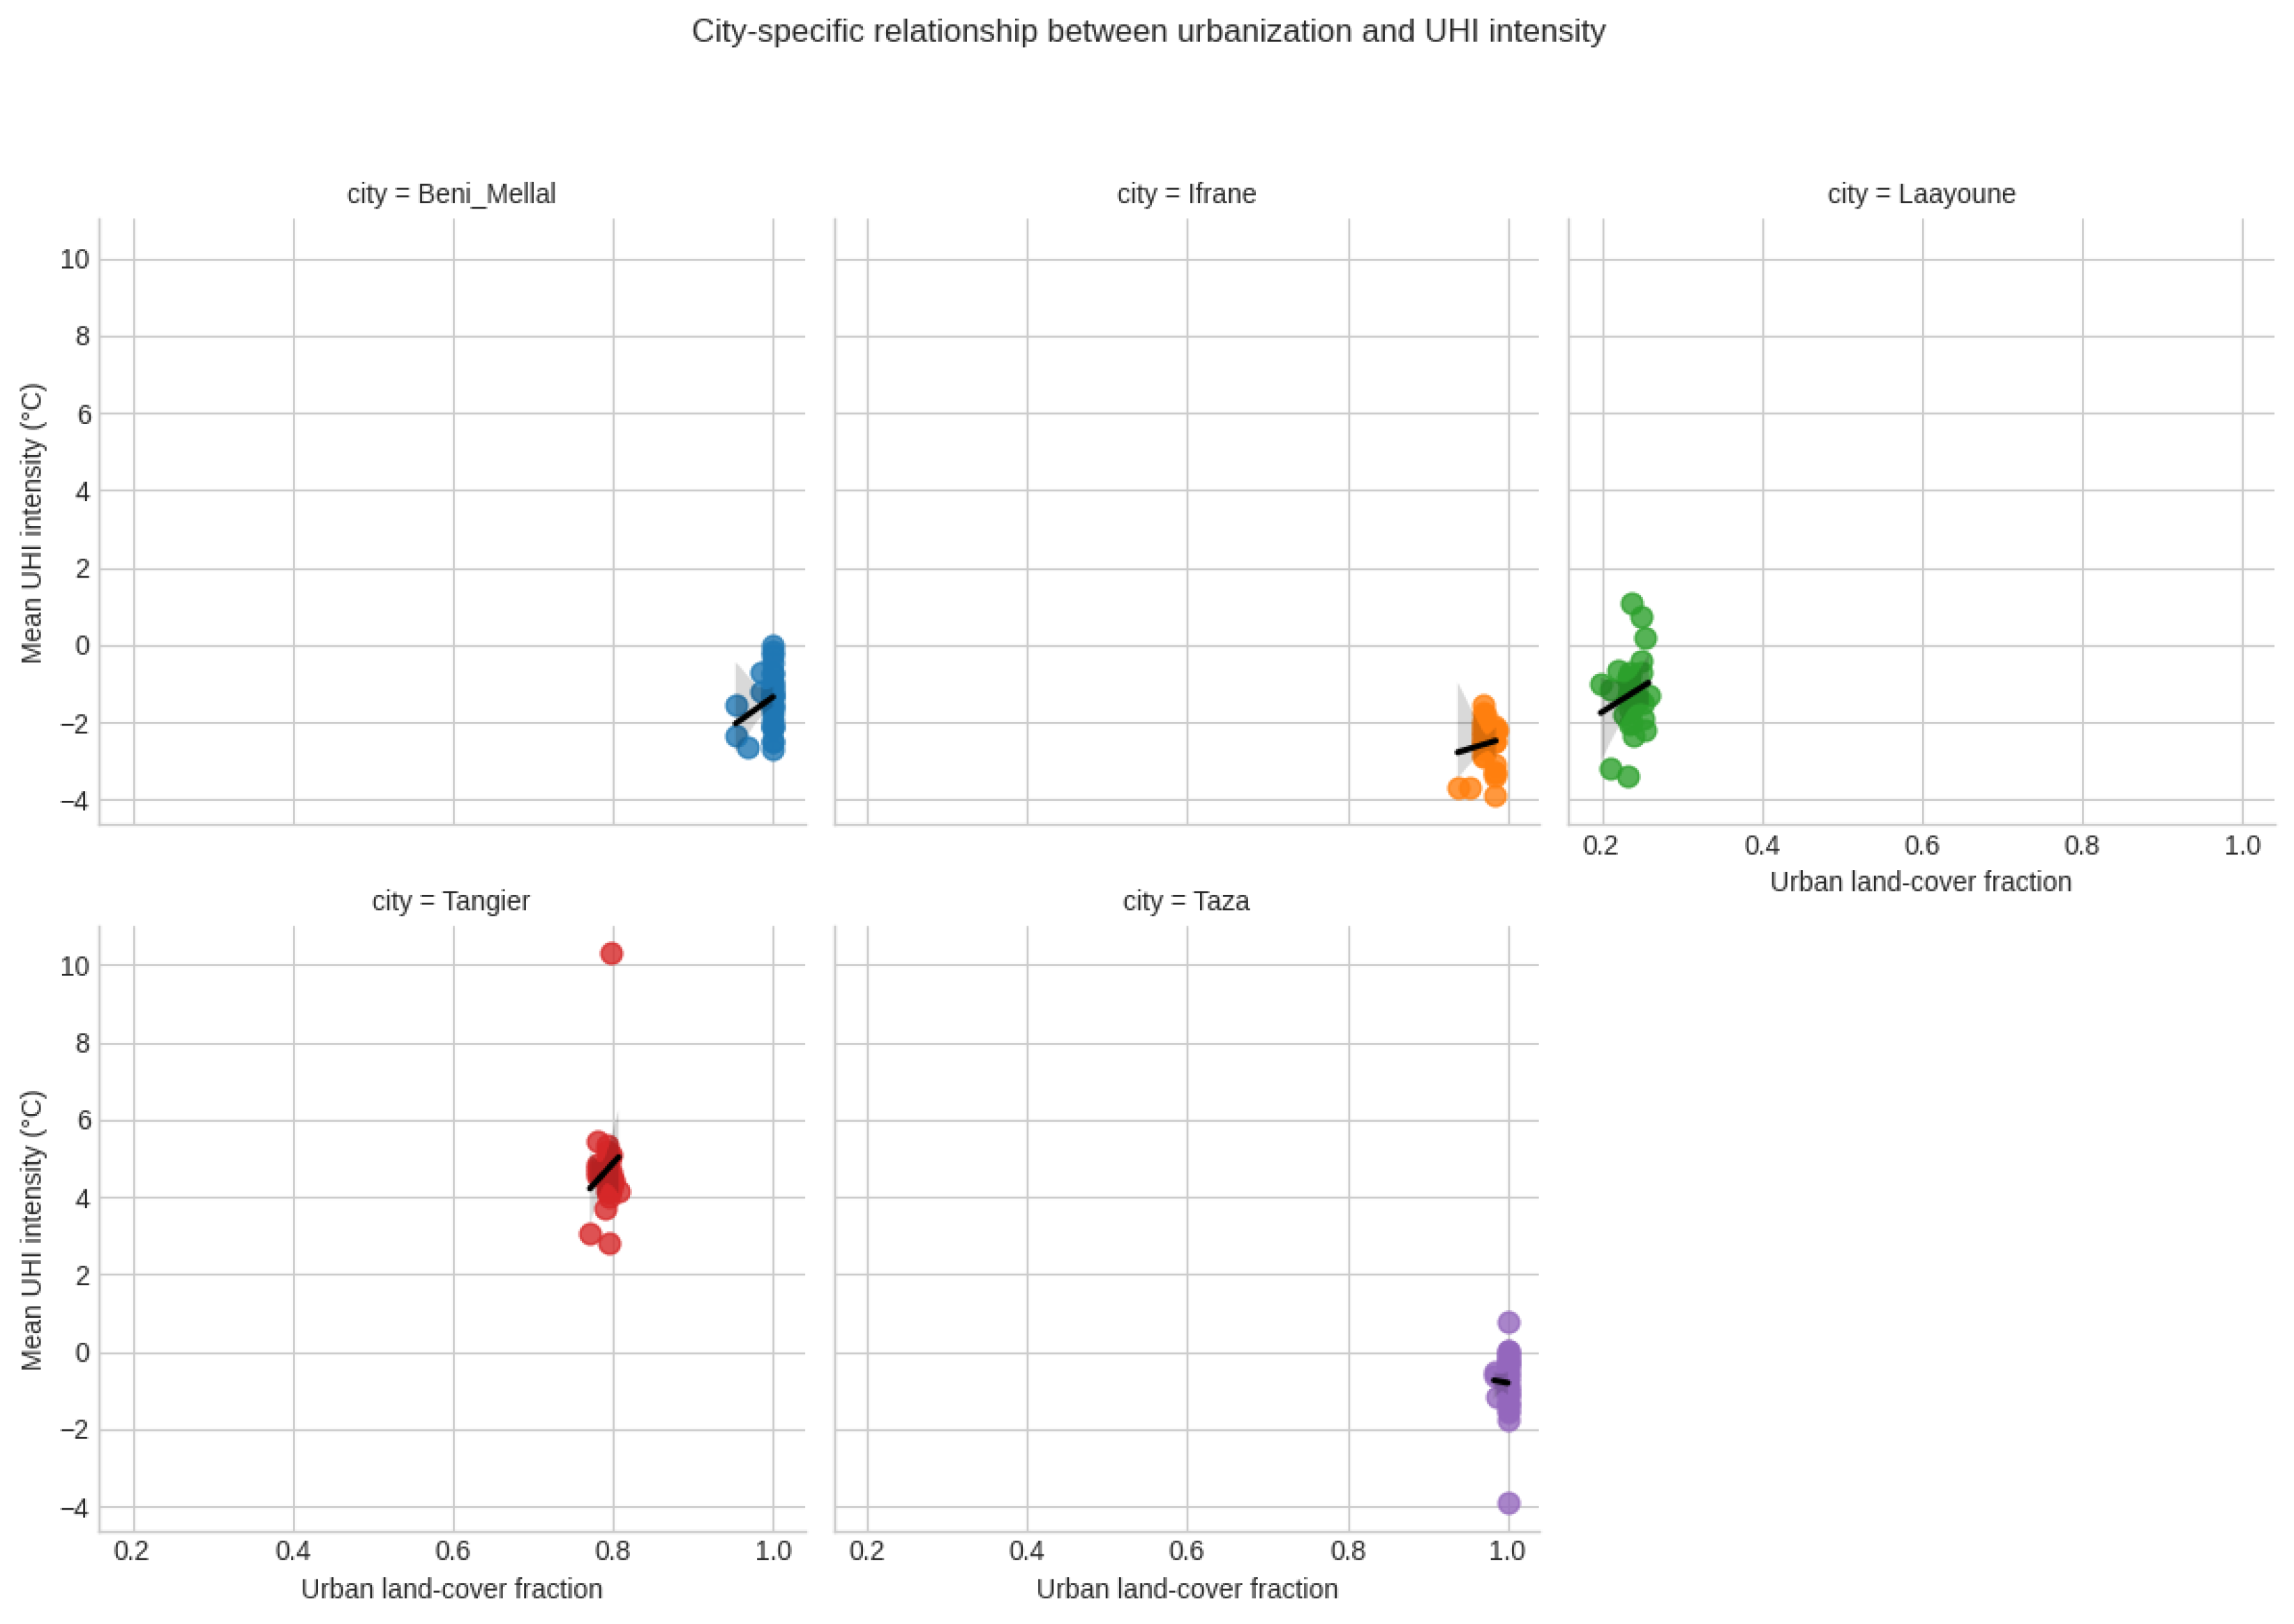
The analysis at the city scale refines the global pattern by showing that the already weak overall relationship masks strong inter-city variability. Béni Mellal and Ifrane both display consistently negative UHI intensities with only a slight positive trend, confirming that even at high urban fractions, local cooling factors dominate. Taza follows a similar pattern, with near-zero to negative values and no clear relationship. In contrast, Laayoune shows a moderate positive relationship, indicating that urbanization begins to enhance UHI under arid conditions. The strongest effect appears in Tangier, where high urban fractions correspond to markedly positive UHI intensities and a clear upward trend.
Overall, these city-specific trends reinforce that the weak global relationship is the result of contrasting local behaviors: urbanization amplifies UHI in some contexts (Tangier, Laayoune) but is offset or reversed in others (Ifrane, Béni Mellal, Taza), confirming the dominant role of local climatic and environmental controls. These results align with existing literature showing that UHI intensity largely depends on background climate and the properties of the urban fabric, rather than urbanization level alone [23,24]. Studies in Moroccan coastal cities showed that UHI is driven by local climate and land-cover dynamics rather than urban extent alone [5]. A national-scale satellite analysis found that UHI behavior depends on the surrounding environment, not just urban size or extent [4], and other studies confirmed that in arid conditions, UHI patterns are strongly affected by vegetation, sometimes even reducing UHI intensity [6,12].
4. Discussion
4.1. City-Specific Thermal Regimes and Arid-Climate UHI Theory
The five-city design provides a scientifically robust framework for testing hypotheses that emerge from arid-city UHI synthesis: namely, that UHI amplitude and sign depend fundamentally on the thermal character of the reference landscape and on directionally varying features such as sea influence, forest adjacency, and barren soil exposure. The persistent classical UHI pattern in Tangier reflects the presence of vegetated and maritime-influenced peripheral zones that provide effective cooling contrast relative to the built-up core. This finding aligns with theoretical expectations and with Moroccan transect literature documenting strong directional asymmetry in coastal cities [8].
Ifrane's frequent UHS episodes are consistent with its mountainous and forested context, where adjacent natural land cover can be substantially cooler than the built-up area, producing a relative urban warming effect. The transient and oscillatory UHI regimes observed in Béni Mellal, Taza, and Laayoune reflect the complex interplay between seasonal vegetation dynamics, atmospheric moisture, and the thermal properties of surrounding landscapes. In Laayoune, the critical interpretive challenge is definitional: if the 6–7 km ring includes bare, arid, strongly heated surfaces, the city may appear as a heat sink by day even if the urban core is hot in absolute terms. This is consistent with both Moroccan national assessments and broader arid-city findings [3,4].
4.2. Environmental Controls: Humidity Versus Vegetation
The dominance of humidity as a thermal regulator in most cities, combined with the comparatively weaker role of vegetation, represents a notable finding. While the negative LST–NDVI relationship is well established in the literature, the relatively modest strength of this correlation in the present study suggests that vegetation's cooling effect is highly context-dependent and mediated by urban form, vegetation density, climatic zone, and seasonal timing. Laayoune's anomalous positive humidity–LST relationship warrants particular attention, as it suggests that atmospheric moisture in coastal-desert settings operates through different physical pathways than in inland environments. These results are consistent with broader SUHI literature showing that the effects of vegetation and moisture are not uniform predictors of urban cooling [7,19].
4.3. Absence of Long-Term Trends and Implications
The absence of statistically significant monotonic trends in UHI intensity across all five cities is an important finding that should not be interpreted as evidence of negligible climate risk. Rather, it indicates that the thermal contrast between urban cores and surrounding areas has remained relatively stable over the study period, with variability primarily driven by seasonal dynamics and short-term environmental controls. This stability may reflect compensating effects: urbanization-driven warming may be partially offset by changes in peripheral land cover, vegetation dynamics, or atmospheric circulation patterns. The finding also underscores that trend detection in UHI intensity requires long time series and robust non-parametric methods, as the strong seasonal component can mask or mimic long-term changes in shorter records.
4.4. Model Performance and Forecasting Implications
The contrasted model performances across cities provide important practical guidance for urban climate forecasting. The superiority of SARIMA in cities with regular seasonal structures (Ifrane, Tangier) confirms the relevance of seasonal autoregressive models as a robust statistical baseline when the temporal signal is dominated by periodic components. The superior performance of machine-learning approaches in Laayoune and Taza demonstrates the complementary value of data-driven methods where the thermal signal is more irregular. The convergence of forecasts across all four modeling approaches—all projecting persistence of existing seasonal regimes without abrupt regime shifts—strengthens confidence in the predictive interpretation and supports the use of multi-model frameworks in urban climate studies.
4.5. Urbanization as a Context-Dependent UHI Driver
The finding that urbanization amplifies UHI in some cities (Tangier, Laayoune) but is offset or reversed in others (Ifrane, Béni Mellal, Taza) underscores the primacy of local environmental context over urban extent as a determinant of thermal behavior. This result aligns with the growing consensus that UHI intensity depends on background climate and the properties of the urban fabric rather than urbanization level alone [23,24]. In practical terms, this implies that urban planning and heat mitigation strategies must be tailored to local climatic and environmental conditions rather than applied uniformly across different settings.
4.6. Limitations
Several limitations should be acknowledged. First, LST is not equivalent to near-surface air temperature; results primarily characterize surface thermal behavior, with ERA5 covariates providing atmospheric context at coarse spatial resolution (~9 km). Second, mixing Landsat missions introduces potential cross-sensor biases, although mitigated by using Collection 2 Level-2 products. Third, cloud masking and orbital frequency produce months with low or no valid observations. Fourth, the 7 km sampling radius may not capture the full urban–rural transition in rapidly expanding metropolitan areas. Fifth, C3S land cover, while temporally consistent, has documented classification uncertainties affecting land-cover-based stratification analyses.
5. Conclusions
This study provides a comprehensive, multi-decadal analysis of surface urban heat island dynamics across five Moroccan cities spanning the country's climatic gradient from hyper-arid to humid mountainous settings. Using a reproducible Google Earth Engine workflow with standardized eight-direction radial transect sampling, the investigation reconstructed monthly urban–periphery thermal gradients from 1995 to 2024, integrating multi-mission Landsat LST and NDVI, ERA5-Land atmospheric covariates, and Copernicus C3S land-cover classifications.
The results demonstrate that UHI behavior in Morocco is fundamentally city-specific, with thermal regimes ranging from persistent classical UHI patterns in Tangier to recurrent urban heat sink conditions in Ifrane. No statistically significant long-term monotonic trend in UHI intensity was detected in any city, indicating that thermal contrasts are governed primarily by seasonal dynamics and local environmental controls rather than by unidirectional climatic evolution. Humidity emerged as the dominant environmental regulator of surface temperature in most cities, while vegetation played a secondary though locally significant role.
The multi-model predictive framework demonstrated that SARIMA excels in cities with regular seasonal LST structures, while machine-learning approaches (Random Forest, XGBoost) and deep learning (LSTM) outperform in contexts with irregular thermal signals. All models projected persistence of existing seasonal regimes over the 2026–2027 horizon, reinforcing the interpretation that near-future heat exposure will remain organized around recurrent seasonal peaks. The urbanization analysis confirmed that urban expansion amplifies UHI selectively, with clear effects in Tangier and Laayoune but offsetting local cooling factors in Ifrane, Béni Mellal, and Taza.
These findings carry practical implications for urban planning and climate adaptation in Morocco and comparable arid and semi-arid environments. Heat mitigation strategies must be tailored to local climatic context and surrounding land-cover characteristics, rather than applied uniformly based on urbanization level alone. Future research should integrate additional predictors such as NDBI, soil moisture, and urban morphology into the forecasting framework, extend the analysis to nighttime thermal dynamics, and incorporate air temperature monitoring to bridge the gap between surface and canopy-layer UHI characterization.
Author Contributions
Conceptualization, A.L. (Adnane Labbaci) and S.B.; methodology, A.L. (Adnane Labbaci) and S.B.; software, A.L. (Adnane Labbaci); validation, A.L. (Adnane Labbaci), S.B. (Salwa Belaqziz), H.R (Hassan Radoine). and L.E.G. (Laila El Ghazouani); formal analysis, A.L. (Adnane Labbaci); investigation, A.L. (Adnane Labbaci) and S.B.; resources, A.L. (Adnane Labbaci), H.R. and L.E.G.; data curation, A.L. (Adnane Labbaci); writing—original draft preparation, A.L. (Adnane Labbaci); writing—review and editing, S.B., H.R., L.E.G. and A.L. (Asia Lachir); visualization, A.L. (Adnane Labbaci); supervision, H.R., L.E.G. and A.L. (Asia Lachir); project administration, A.L. (Adnane Labbaci) and H.R. All authors have read and agreed to the published version of the manuscript.
Funding
This research received no external funding.
Data Availability Statement
To have access to results, use this link: https://drive.google.com/drive/folders/1jvr9oYlblsqaJ_Ujr-gcdAQZ0_jMV5NQ?usp=sharing.
Conflicts of Interest
The authors declare no conflicts of interest.
Abbreviations
The following abbreviations are used in this manuscript:
| C3S | Copernicus Climate Change Service |
| ETM+ | Enhanced Thematic Mapper Plus |
| GEE | Google Earth Engine |
| IGBP | International Geosphere–Biosphere Programme |
| LCCS | Land Cover Classification System |
| LST | Land Surface Temperature |
| LSTM | Long Short-Term Memory |
| MAE | Mean Absolute Error |
| MODIS | Moderate Resolution Imaging Spectroradiometer |
| NDVI | Normalized Difference Vegetation Index |
| OLI | Operational Land Imager |
| QA_PIXEL | Landsat quality-assessment pixel band |
| R² | Coefficient of determination |
| RF | Random Forest |
| RMSE | Root Mean Square Error |
| SARIMA | Seasonal Autoregressive Integrated Moving Average |
| STL | Seasonal-Trend decomposition using LOESS |
| SUHI | Surface Urban Heat Island |
| TM | Thematic Mapper |
| TIRS | Thermal Infrared Sensor |
| UHI | Urban Heat Island |
| UHS | Urban Heat Sink |
| USGS | United States Geological Survey |
| WGS 84 | World Geodetic System 1984 |
| XGBoost | Extreme Gradient Boosting |
References
- Oke, T.R. The energetic basis of the urban heat island. Q. J. R. Meteorol. Soc. 1982, 108, 1–24. [CrossRef]
- Voogt, J.A.; Oke, T.R. Thermal remote sensing of urban climates. Remote Sens. Environ. 2003, 86, 370–384. [CrossRef]
- Liu, Z.; Ye, R.; Yang, Q.; Hu, T.; Liu, Y.; Chakraborty, T.C.; Liao, Z. Identification of surface urban heat versus cool islands for arid cities depends on the choice of urban and rural definitions. Sci. Total Environ. 2024, 951, 175631. [CrossRef]
- Fathi, N.; Bounoua, L.; Messouli, M. A satellite assessment of the urban heat island in Morocco. Can. J. Remote Sens. 2019, 45, 26–41. [CrossRef]
- Bahi, H.; Rhinane, H.; Bensalmia, A.; Fehrenbach, U.; Scherer, D. Effects of urbanization and seasonal cycle on the surface urban heat island patterns in the coastal growing cities: A case study of Casablanca, Morocco. Remote Sens. 2016, 8, 829. [CrossRef]
- Gourfi, A.; Taïbi, A.N.; Salhi, S.; Hannani, M.E.; Boujrouf, S. The surface urban heat island and key mitigation factors in arid climate cities, case of Marrakesh, Morocco. Remote Sens. 2022, 14, 3935. [CrossRef]
- Derdouri, A.; Murayama, Y.; Morimoto, T. Spatiotemporal thermal variations in Moroccan cities: A comparative analysis. Sensors 2023, 23, 6229. [CrossRef]
- El Ghazouani, L.; Bounoua, L.; Nigro, J.; Mansour, M.; Radoine, H.; Souidi, H. Combining satellite data and spatial analysis to assess the UHI amplitude and structure within urban areas: The case of Moroccan cities. Urban Sci. 2021, 5, 67. [CrossRef]
- Weng, Q. Thermal infrared remote sensing for urban climate and environmental studies: Methods, applications, and trends. ISPRS J. Photogramm. Remote Sens. 2009, 64, 335–344. [CrossRef]
- Rouse, J.W., Jr.; Haas, R.H.; Schell, J.A.; Deering, D.W. Monitoring vegetation systems in the Great Plains with ERTS. In Proceedings of the Third Earth Resources Technology Satellite-1 Symposium, Washington, DC, USA, 10–14 December 1973; NASA: Washington, DC, USA, 1974; Volume I, pp. 309–317.
- Zargari, M.; Mofidi, A.; Entezari, A.; Baaghideh, M. Climatology of Tehran surface heat island: A satellite-based spatial analysis. Sci. Rep. 2025, 15, 10567. [CrossRef]
- Lachir, A.; Bounoua, L.; Zhang, P.; Thome, K.; Messouli, M. Modeling the urban impact on semiarid surface climate: A case study in Marrakech, Morocco. Can. J. Remote Sens. 2016, 42, 379–395. [CrossRef]
- Stamou, A.; Stylianidis, E. Urban monitoring from the cloud: A review of Google Earth Engine (GEE)-based approaches for assessing urban environmental indices. Geographies 2025, 5, 68. [CrossRef]
- Breiman, L. Random forests. Mach. Learn. 2001, 45, 5–32. [CrossRef]
- Chen, T.; Guestrin, C. XGBoost: A scalable tree boosting system. In Proceedings of the 22nd ACM SIGKDD International Conference on Knowledge Discovery and Data Mining, San Francisco, CA, USA, 13–17 August 2016; ACM: New York, NY, USA, 2016; pp. 785–794. [CrossRef]
- Hochreiter, S.; Schmidhuber, J. Long short-term memory. Neural Comput. 1997, 9, 1735–1780. [CrossRef]
- Lawrence, M.G. The relationship between relative humidity and the dewpoint temperature in moist air: A simple conversion and applications. Bull. Am. Meteorol. Soc. 2005, 86, 225–233. [CrossRef]
- Weng, Q.; Lu, D.; Schubring, J. Estimation of land surface temperature–vegetation abundance relationship for urban heat island studies. Remote Sens. Environ. 2004, 89, 467–483. [CrossRef]
- Peng, S.; Piao, S.; Ciais, P.; Friedlingstein, P.; Ottle, C.; Bréon, F.-M.; Nan, H.; Zhou, L.; Myneni, R.B. Surface urban heat island across 419 global big cities. Environ. Sci. Technol. 2012, 46, 696–703. [CrossRef]
- Box, G.E.P.; Jenkins, G.M.; Reinsel, G.C.; Ljung, G.M. Time Series Analysis: Forecasting and Control, 5th ed.; John Wiley & Sons: Hoboken, NJ, USA, 2015.
- Hyndman, R.J.; Athanasopoulos, G. Forecasting: Principles and Practice, 3rd ed.; OTexts: Melbourne, Australia, 2021. Available online: https://otexts.com/fpp3/ (accessed on 27 June 2026).
- Maxwell, A.E.; Warner, T.A.; Fang, F. Implementation of machine-learning classification in remote sensing: An applied review. Int. J. Remote Sens. 2018, 39, 2784–2817. [CrossRef]
- Hidalgo García, D.; Arco Díaz, J. Modeling of the urban heat island on local climatic zones of a city using Sentinel 3 images: Urban determining factors. Urban Clim. 2021, 37, 100840. [CrossRef]
- Zhang, Z.; Paschalis, A.; Mijic, A.; Meili, N.; Manoli, G.; van Reeuwijk, M.; Fatichi, S. A mechanistic assessment of urban heat island intensities and drivers across climates. Urban Clim. 2022, 44, 101215. [CrossRef]
Figure 3.
Figure 3. Monthly LST time series (1995–2024) across the five studied cities.
Disclaimer/Publisher’s Note: The statements, opinions and data contained in all publications are solely those of the individual author(s) and contributor(s) and not of MDPI and/or the editor(s). MDPI and/or the editor(s) disclaim responsibility for any injury to people or property resulting from any ideas, methods, instructions or products referred to in the content. |
© 2026 by the authors. Licensee MDPI, Basel, Switzerland. This article is an open access article distributed under the terms and conditions of the Creative Commons Attribution (CC BY) license (http://creativecommons.org/licenses/by/4.0/).
Copyright: This open access article is published under a Creative Commons CC BY 4.0 license, which permit the free download, distribution, and reuse, provided that the author and preprint are cited in any reuse.


