
Submitted:
30 June 2026
Posted:
01 July 2026
You are already at the latest version
Abstract
The utilisation of microwave radiances is crucial for enhancing the precision of weather forecasts. Despite existing uncertainties over land and ice-covered surfaces, recent advances have enhanced their use. This study examines the impact of assuming either Lambertian or specular surface reflection on the simulation of brightness temperatures for surface-sensitive, clear-sky AMSU-A microwave radiances across land and snow-covered areas. It represents the preliminary work before to run a full assimilation and forecast impact study. Using the high-resolution HARMONIE-AROME regional modelling system, experiments were conducted to retrieve and analyse the retrieved emissivity in different conditions/seasons. The emissivity was also used as input to the radiative transfer model to simulate brightness temperatures at surface-sensitive sounding channels. The results show that the Lambertian assumption produces higher variability in dynamic surface emissivity, while the specular approach yields smaller and more consistent deviations. During winter, specular reflection shows higher first-guess departures (e.g. observations minus simulations) to surface-sensitive sounding observations, whereas in summer it performs better over land surfaces. Over snow-covered regions, the use of the Lambertian reflection to simulate the brightness temperature gives smaller mean errors for AMSU-A channels 4 (52.8 GHz) and 5 (53.59 GHz). These findings encourage us to further investigate the implementation of a parameter that accounts for the Lambertian component of surface reflection when simulating brightness temperature in high-resolution limited-area models.
Keywords:
surface emissivity
; AMSU-A
; lambertian reflection
; specular reflection
; limited area model
; land surface
; snow-cover surface
1. Introduction
Over the Northern latitudes, Numerical Weather Prediction (NWP) systems are not as accurate as for the mid-latitudes. Initial conditions heavily rely on the assimilation of satellite radiance observations, due to the lack of conventional observations [1]. However, despite the dominant impact of microwave sounding data in the global ECMWF system, [2] demonstrated that a larger number of radiance observations were rejected in winter compared to summer. Uncertainties in the surface modelisation of snow [3] and ice have been cited as one of the reasons [4].
At a high-resolution regional scale, the assimilation of microwave observations in high-resolution data assimilation (DA) systems also significantly improves the accuracy of NWP models [5,6,7]. The positive impact of surface-sensitive MW observations over land has been well documented [2,8,9,10]. Due to their positive impact on NWP performance, the use of MW radiance measurements over land surfaces has become increasingly common in global data assimilation systems [8,11,12,13]. Within the DA framework of the European Centre for Medium-Range Weather Forecasts (ECMWF), this influence has been thoroughly examined through observing system experiments [10]. The study highlights the impact of low-peaking channels, using Lambertian reflection to provide a neutral to positive forecast impact at high latitudes. Additionally, improved forward modeling enables the assimilation of more observations.
A pre-requirement for the effective assimilation of satellite radiance data in NWP systems is the accurate estimation of surface emissivity, which exhibits significant spatial and temporal variability contingent upon surface properties. During the assimilation process, brightness temperatures for atmospheric sounding channels are simulated using a forward radiative transfer model to evaluate the consistency and reliability of satellite observations. Observations that display substantial discrepancies from the simulated brightness temperatures are generally excluded, indicating that the accuracy of these simulations directly influences both the quantity of usable satellite data and the overall efficacy of the assimilation system. The retrieval of accurate surface temperature remains particularly challenging in regions characterized by pronounced diurnal temperature variations, as MW signals at different frequencies penetrate to varying depths depending on the land surface type. Additionally, the spatial heterogeneity of land surfaces complicates the direct measurement of microwave emissivity [14]. MW land surface emissivities are generally higher and vary depending on surface type, roughness, and moisture levels. This variability makes it challenging to distinguish between surface and atmospheric signals in radiance measurements. Obtaining accurate emissivity estimates can greatly enhance humidity profile retrievals over land [15]. Additionally, their effectiveness is influenced by land skin temperature [16]. Consequently,[17] conducted a study demonstrating that the integration of land emissivity climatology with precise skin temperature measurements effectively constrains atmospheric temperature and humidity during the assimilation of MW radiances over land surfaces. A comprehensive understanding of land surface emissivity and skin temperature is essential for improving the accuracy of microwave satellite observations. This is because the accuracy of observation is independent of our understanding of emissivity or skin temperature. Over recent decades, significant advancements have been achieved in modeling land surface emissions through physical parameterizations as well as direct and indirect measurements. While some variability persists primarily due to limited input data, many effective emissivity models have been developed. In the study conducted by [18], two surface-sensitive channels from the Advanced Microwave Sounding Unit-A (AMSU-A) were assimilated over terrestrial regions within the China Meteorological Administration Global Forecast System model, employing land surface emissivity data obtained through a window channel retrieval technique. The results indicated that this retrieval approach more effectively minimized discrepancies between observations and model outputs, thereby enhancing the accuracy of near-surface humidity estimates and global forecasts, especially in areas characterized by extensive land coverage. The dynamic emissivity method has been demonstrated to enhance the assimilation of MW radiances over land [8,17]. In this study emissivity is retrieved using measurements from a selected window channel (channel 3, 50.3 GHz), assuming the surface to have specular reflection (SPEC). This method assumes a smooth, planar surface that reflects radiation in a mirror-like manner. The validity of this hypothesis has been challenged in the context of rough surfaces within the global NWP system [19,20]. An alternative approach, known as the Lambertian surface assumption (LAMB), posits isotropic reflection, whereby radiation is uniformly scattered in all directions. Bormann [12] emphasizes that the implementation of the LAMB assumption improves the characterization of bias and enhances the accuracy of radiance assimilation over land and snow-covered regions. This study aims to improve the assimilation of AMSU-A surface-sensitive channels in a limited area model (LAM) by estimating the most appropriate surface reflection over various surface types. The study covers a five-month period from January, April, June, October 2024, and February 2025 to capture winter, summer, and autumn conditions and to represent diverse atmospheric environments and surface characteristics. To capture the broad range of seasonal variability, ice and snow surface characteristics were evaluated during four representative periods. However, in mid-latitude regions, most extreme snow and ice events occur during winter; therefore, two months were selected to represent winter conditions. The structure of the paper is as follows: Section 2 provides a comprehensive description of the model configuration and elucidates the data assimilation approach employed for satellite observations. It also outlines the methodologies applied to estimate surface emissivity from satellite data, with particular attention to the primary sources of error affecting surface emissivity. Section 3 presents the results, focusing on the impact of emissivity calculated using the SPEC and LAMB reflection models, as assessed through first-guess departure (e.g. observations minus simulations) statistics. Additionally, this section includes an analysis of the experimental findings. Finally, Section 4 summarizes the study and offers concluding remarks.
1.1. Study Objectives and Novelty
This study aims to:
- present the first systematic evaluation of the SPEC and LAMB surface reflection assumptions within an operational high-resolution limited-area modeling (LAM) framework;
- investigate the challenges associated with highly heterogeneous Nordic surface conditions, including coastal, lacustrine, and snow-covered environments; and
- provide practical guidance for regional model configuration and future assimilation of Arctic Weather Satellite (AWS) microwave observations.
2. Methodology
2.1. Model configuration and Data Assimilation
This study focuses on the region covered by the Meteorological Cooperation on Operational Numerical Weather Prediction (MetCoOp), a collaborative initiative involving the national meteorological services of Sweden, Norway, Finland, Estonia, and Latvia. MetCoOp provides short-range weather forecasts that are integrated into the forecasting systems of its member countries. Within this partnership, the AROME-MetCoOp model is utilized, which is a regional configuration of the HARMONIE-AROME system, part of the HIRLAM–ALADIN Research on Mesoscale Operational NWP in Euromed (HARMONIE) project [21,22]. This modeling framework has been developed by the High Resolution Limited Area Model (HIRLAM) consortium, a collaborative research effort among 11 European meteorological institutes. For this study, the default physical parameterization settings described by [23] were selected. The model physical parameterization includes key components such as prognostic equations for cloud species and turbulent kinetic energy, a shallow convection scheme, and multiband radiation processes [24]. Additionally, the configuration incorporates the Morcrette shortwave radiation scheme [23] and the Rapid Radiative Transfer Model (RRTM) for longwave radiation [25]. The MetCoOp operational model domain is illustrated in Figure 1. Hourly lateral boundary conditions are provided by global forecasts from the Integrated forecasting system (IFS) of European Centre for Medium Range Weather Forecasts (ECMWF).
A series of experiments were conducted employing the high-resolution HARMONIE-AROME model integrated with the 3D-Var DA system. The model was configured with a spatial resolution of 2.5 km, consistent with the operational MetCoOp model configuration [21]. Simulations were performed using the HARMONIE–AROME NWP system. In this study we assimilated conventional types of observations as well as MHS and AMSU-A MW radiances, in conjunction with the Radiative Transfer for TOVS (RTTOV, version: 11.2) model, were applied at locations corresponding to MW observations. All available MW observations were assimilated within each 3-hour cycle, employing a +/- 1-hour temporal window. The climatological background-error covariance matrices (B-Matrix) were represented using a multivariate formulation based on forecast errors of control variables, including vorticity, divergence, temperature, surface pressure, and specific humidity [26,27]. Initially, AMSU-A data were processed at their full resolution and subsequently thinned to an average resolution of 80 km. An adaptive variational bias correction (VarBC) scheme was implemented to correct AMSU-A microwave biases at each 3-hour assimilation cycle [28,29].
For each month, two separate experiments were performed: one assuming a specular reflection from the surface (SPEC is assumed as the control experiment since this configuration is used as default in HARMONIE-AROME) and another experiment assuming the surface to have a Lambertian LAMB reflection scheme to retrieve surface emissivity at AMSU-A channel 3. Due to limited resources, hybrid reflection models were not tested in this study. In both experiments, initial conditions and VarBC coefficients were sourced from the MetCoOp operational run and the boundary conditions are fed by the ECMWF system as mentioned above. Each experiment has been run for 30 days in a non cycled way, every 3-hour. This approach allows us to examine how emissivity varies between the two reflection schemes and how it affects the simulation of adjacent surface-sensitive sounding channels while keeping all other model settings consistent. Because the aim of this paper was to isolate the effect on surface assumption on the Brightness Temperature (BT) simulation, we have decided to use all other input parameters as identical as possible, extracted from the same source (e.g. from the MetCoOp operational run which use the specular assumption as default to simulate the radiances). The first-guess fields are the same in both SPEC and LAMB experiments and the VarBC coefficients are the same as well. The adaptive scheme incorporated within variational data assimilation simultaneously updates bias parameters and atmospheric state variables to reduce radiance discrepancies. The model is formulated as a linear combination of predictors, including atmospheric thickness (e.g., 1000–300 hPa), total column water vapor, and surface variables, with coefficients optimized via the cost function [6]. These model parameters were derived from a cycled experiment that assimilated microwave (MW) observations under the assumption of a specular surface. Consequently, the derived bias-correction coefficients are inherently tied to the specular (SPEC) surface reflection assumption. As a result, these coefficients cannot be directly transferred between the SPEC and LAMB experiments. Care must therefore be taken when interpreting first-guess departure statistics, since differences in the underlying surface reflection assumptions may introduce systematic inconsistencies, rendering the departures from the two experiments not directly comparable.
2.2. Observation and Retrieval of Surface Emissivities
The AMSU-A is a sophisticated 15-channel microwave radiometer specifically engineered for atmospheric temperature profiling. In this study we use data from AMSU-A on-board polar orbiting platform of NOAA-18, NOAA-19, Metop-B, Metop-C. As a cross-track scanning instrument, the AMSU-A encompasses a swath approximately 2343 km in width, executing 30 step-scanned observations per swath. At nadir, each observation yields a footprint of approximately 48 km, which increases in size towards the edges of the swath. The instrument comprises 12 temperature sounding channels (channels 3–14) that are centered around the 50–58 GHz oxygen absorption band, providing critical insights into the vertical distribution of temperatures in both the troposphere and stratosphere. Additionally, it features three window channels (1, 2, and 15) operating at frequencies of 23.8, 31.4, and 89 GHz, which are particularly responsive to surface conditions, water vapor, cloud cover, and precipitation.
The radiative response of the AMSU-A channels is influenced by altitude and atmospheric conditions. Channels 1-3, classified as window or near-window channels, exhibit heightened sensitivity to surface emissions and cloud interactions. Figure 2 illustrates the relative contributions of various atmospheric layers to the BT for AMSU-A. Among all these listed channels currently we are using channel 3 for dynamic emissivity retrieval, channel 4 is monitored, channel 5-9 are actively used. For channels 10 and higher, the weighting functions exceed the model’s vertical extent, which is approximately 20 hPa. Consequently, these channels are not assimilated into the model. The maximum sensitivity of the weighting functions peaks lower in winter than in summer, presumably due to the humidity sensitivity for these channels and drier conditions in winter.
Following [17], the surface emissivity is retrieved using the so-called dynamic emissivity method, assuming the surface flat and specular (i.e SPEC configuration, [30]. However, over a snow covered land surface, the use of that approximation was shown to be questionable [19,20]. Instead, the Lambertian surface assumes diffuse, isotropic reflection of downwelling radiation which accounts better of the snow asperities and roughness. The approach derives the surface emissivity at AMSU-A window channels (here, channel 3, 50.3 GHz), reversing the radiative transfer equation. The channel used for the retrieval must be discarded from assimilation later on. As input, the RTTOV model uses the surface temperature and atmospheric profiles from the previous 3-hour short range forecast. Over land, an emissivity atlas, kindly provided by Meteo-France (https://www.umr-cnrm.fr), is used as back-up in case the retrieval is failing (over 1 or if the difference with the atlas is over 0.2).
The brightness temperature can be expressed as:
where
Here, denotes the skin temperature, while and correspond to the atmospheric downwelling and upwelling brightness temperatures, respectively. The net atmospheric transmissivity is characterized as a function of the atmospheric opacity and the observation zenith angle . H represents the height at the top of the atmosphere, and denotes the surface emissivity.
The atmospheric upwelling brightness temperature is expressed as:
where z denotes altitude, represents the atmospheric absorption by gases at altitude z, and is the atmospheric temperature at altitude z. The zenith opacity between altitudes and is defined as
To account for full Lambertian reflection in the RTTOV radiative transfer modeling, we use a parameterization originally proposed by [31] and tested for NWP applications by [19]. This approach simulates diffuse reflection by computing downwelling radiation at an effective zenith angle, obtained by integrating contributions over a hemisphere under the assumption of a uniform atmosphere. The effective angle depends on the atmospheric opacity and typically varies from approximately for weakly surface-sensitive channels to for strongly surface-sensitive channels. In the present study, a simplified implementation following [19] was employed, whereby a fixed effective zenith angle of was assumed for all channels. This approximation was adopted as a first-step representation of Lambertian reflection while maintaining a computationally straightforward implementation. A more advanced treatment, such as the opacity-dependent formulation proposed by [20], is left for future work.
In this paper, the expression to retrieve the emissivity assuming full Lambertian surface can be formulated as follows:
As previously noted, surface emissivity has been estimated by assuming the surface to be either flat and specular (SPEC) or rough and Lambertian (LAMB). The system was applied across multiple seasons to better understand how retrieval sensitivity varies with surface conditions, such as snow in winter and dry soil in summer. Each input used in this “single-channel” retrieval approach can influence the resulting emissivity and first-guess departures. As highlighted by [32], emissivity is particularly sensitive to errors in surface temperature. Figure 3 presents a time series illustrating the daily sensitivity (in percentage) to a +/- 2 K error in the skin temperature input, indicating that emissivity retrievals can be affected by approximately +/- 1%. The impact on first-guess departures is even more pronounced, with amplitude variations reaching up to 75% and notable daily fluctuations. Other input parameter errors such as bias correction, day/night timing, atmospheric profiles, and snow depth may also affect the retrieval, though generally to a lesser extent [17,32].
Figure 4 illustrates the variations of the surface emissivity differences computed under the SPEC and LAMB assumptions, together with the amount of AMSU-A observations per scan positions for four months in 2024. The AMSU-A zenith angle ranges from +/- 58°, with scan positions 15 and 16 corresponding to the nadir. Observations at the scan edges (positions 1–3 and 28–30) are excluded due to the increased scan angles, which result in larger footprint sizes, reduced representativeness, and lower transmission. As expected, January shows the larger sensitivity (about 0.1 at nadir) to the surface hypothesis probably due to the high occurrence of snow over the domain at that period. It should be noted that surface emissivity is a dimensionless quantity. Emissivity is defined as the ratio of the radiation emitted by a surface to that emitted by a perfect blackbody at the same temperature. Its values range from 0 to 1, where 0 corresponds to a perfect reflector (no emission) and 1 corresponds to a perfect blackbody (full emission). This is consistent with the findings of [19,20]. The figure further indicates that the number of available observations remains relatively uniform across scan positions, meaning that, overall, the regional domain is observed homogeneously from all parts of the scan and not only one side how it could happen over more polar latitudes. January records fewer total observations compared to the other three months, likely attributable to data availability constraints, this may be data availability. During April, June, and October, the emissivity discrepancies between the two approaches are reduced.
3. Results
This section assesses the influence of employing surface emissivity derived from the SPEC and LAMB hypotheses on the simulation of BT in a regional NWP system. Contrary to past reference studies, mentioned above, that have been run in global systems with coarser resolution, this study has been performed in a regional NWP framework providing very high resolution background information (about 2.5 km). Furthermore, this study extends beyond the focus on active and thinned data, as seen in [20], by incorporating all available observations across the MetCoOp domain. The subsequent analysis examines first-guess departures from observations prior to the application of bias correction, except where otherwise indicated. This methodology is employed to prevent any preferential bias toward the SPEC experiment, given that the MetCoOp reference, which supplies the bias correction coefficients, is based on the specular emissivity approach.
3.1. Impact over Land surface
The consistency of the estimated land surface emissivities was evaluated through an analysis of their spatial variability, as illustrated in Figure 5. The emissivity values obtained using the SPEC and LAMB methods are influenced by surface properties and skin temperature. As depicted in Figure 5a–c, the LAMB method demonstrates greater variability, as indicated by the standard deviation, particularly during the winter season. Notably, the LAMB method performs more effectively in winter, which may be attributed to the diffuse reflection properties of snow. This phenomenon can be explained by the high porosity and rough texture of dry snow, which induces multiple scattering events, resulting in more isotropic reflection patterns. Specifically, multiple scattering within dry snow layers, combined with surface roughness, tends to diminish coherent specular reflection and enhance the isotropic scattering characteristics of the emitted microwave radiation [3,31]. In contrast, the SPEC method shows a much lower and more consistent spread when the gridded mean skin temperature is below –10 °C (Figure 5c). For April 2024, the gridded average emissivity indicates that both SPEC and LAMB methods yield higher values when skin temperature ranges within +/-5 °C (Figure 5d-f). However, LAMB tends to produce higher values overall, likely due to radiation scattering across all discretizations. During the summer months, when skin temperatures rise above 10 °C, variability decreases for both methods a few kilometers inland (Figure 5g-i). In October, the LAMB method exhibited higher variability (Figure 5j-l), particularly in the northern regions of Sweden and Norway, as well as across much of Denmark. Elevated variability remains evident in coastal regions throughout all seasons in the LAMB experiment. This is largely attributable to sub-grid variations in the land–sea fraction sampled by individual satellite footprints. While observations are grouped into spatial bins according to the footprint centre location, the actual surface composition within the footprint can differ considerably. The strong emissivity contrast between land and ocean surfaces therefore results in substantial variations in effective surface emissivity, leading to enhanced variability in the coastal zones. Overall, the LAMB method consistently shows greater variability in surface emissivity across all months. Conversely, the SPEC method demonstrates significantly lower and more uniform standard deviations, reflecting a more constrained and reliable variability range.
In the SPEC experiment for January, the root mean square error (RMSE) of first-guess departures BT (in Kelvin) is notably higher across much of the Scandinavian region, particularly in northern Norway, Sweden, and Finland (Figure 6). In contrast, the southern parts of Sweden and Finland, along with Denmark, Estonia, Latvia, Lithuania, and southern Poland, exhibit relatively lower RMSE values. In the LAMB experiment (Figure 6c), the RMSE decreases across many areas, especially over Sweden and Finland. Additionally, higher RMSE values correspond to regions with a greater number of observations (Figure 6a). For April (Figure 6d-f), the error pattern differs from the winter months. Here, the first-guess departure RMSE is significantly higher in the LAMB experiment compared to the SPEC experiment, with the highest values located in western Norway and Sweden. During June (Figure 6g-i) and October (Figure 6j-l), the gridded RMSE values are relatively lower for both experiments, with errors more evenly distributed across the domain. For February (Figure 6m-n), another winter month, the error distribution resembles that of April, with the LAMB experiment showing higher RMSE, particularly in northern Sweden.
Figure 7 presents a comparison of the channel-wise mean error in BT measured in Kelvin for AMSU-A over land surface, based on the SPEC and LAMB experiments conducted over a five-month period. The average values were derived from all 3-hour assimilation cycles each day throughout each month. Cells highlighted in blue denote enhanced performance of the LAMB experiment throughout the winter months. The findings reveal that during January, October and February, the LAMB experiment outperformed SPEC, showing lower mean errors. For channel 4 (52.8 GHz), the mean errors in the SPEC experiment were 1.01 K, 0.27 K, and 0.68 K for these months, respectively, which improved to 0.44 K, -0.08 K, and 0.02 K in the LAMB experiment. Conversely, in April and June, the SPEC experiment demonstrated better performance, with mean errors of 0.42 K and 0.09 K, compared to the LAMB experiment’s mean errors of -0.44 K and -0.27 K. For channel 5 (53.5 GHz), the LAMB experiment demonstrated superior performance during January, April, October, and February compared to the SPEC experiment. Specifically, the mean errors in the SPEC experiment for these months were 0.51 K, 0.18 K, 0.09 K, and 0.33 K, respectively, which improved to 0.22 K, -0.08 K, -0.06 K, and 0.06 K in the LAMB experiment. However, in the summer month of June, the SPEC experiment showed better results, with a mean error of 0.01 K, compared to -0.31 K in the LAMB experiment. the reasons why SPEC performs better in summer are not fully discussed. It is recommended to add: bare soil and vegetation have stronger specular reflection characteristics in summer, and increased soil moisture may enhance surface smoothness. A similar trend was observed for channel 4 (52.8 GHz) and channel 5 (53.5 GHz) during January, June, October, and February, with the LAMB experiment outperforming SPEC in April. For the higher frequency channels 6-9, both experiments exhibited comparable performance, except for channel 6 in January, where the SPEC experiment outperformed the LAMB experiment. It is also noteworthy that a consistent negative bias in the timing of the first-guess departures has been observed for channels 6, 7, and 9 in both the SPEC and LAMB experiments, as well as across the multiple months. This indicates that the simulated BT tends to be overestimated
Figure 8 illustrates the statistics of first-guess departures for AMSU-A channel 5 under the SPEC and LAMB surface emissivity assumptions. Panels (a) and (c) correspond to regions with 20–40% land cover (coastal areas dominated by sea), while panels (b) and (d) represent regions with 60–80% land cover (coastal areas dominated by land). In regions with 20–40% land cover, the standard deviations of first-guess departures are comparable between SPEC and LAMB. However, the absolute bias is generally smaller for LAMB, highlighting the importance of accurately representing surface reflection in kilometer-scale models with strong land–sea contrasts and sub-footprint heterogeneity. In January 2024, SPEC showed a small positive bias of 0.18 K (Std: 0.62 K), whereas LAMB exhibited a slight negative bias of K with marginally lower variability (Std: 0.61 K). By February 2025, both experiments showed reduced spread (Std: 0.46 K), with SPEC maintaining a weak positive bias of 0.11 K. These results indicate a clear sensitivity of channel 5 departures to the emissivity representation over heterogeneous coastal areas.
For regions with 60–80% land cover (Figure 8b,d), the differences between SPEC and LAMB are more pronounced. In January 2024, SPEC exhibited a positive mean bias of 0.36 K with a standard deviation of 0.61 K, departures ranging from K to 3.45 K, and an RMSE of 0.70 K. In contrast, LAMB shows a near-neutral mean bias of 0.04 K with slightly lower variability (Std: 0.58 K) and departures ranging from K to 2.31 K. While both configurations display comparable dispersion, the LAMB assumption effectively reduces the mean first-guess departures. Overall, these results demonstrate that channel 5 first-guess departures are highly sensitive to emissivity representation, particularly in coastal regions with heterogeneous land–sea distributions, underscoring the need for accurate surface reflection treatment in high-resolution modeling.
3.2. Impact over Snow
The MW observation employed to delineate snow-covered areas comprise the snow mask, surface skin temperature, and the land-sea mask. A threshold of –10 °C is utilized for the surface skin temperature parameter. Regions exhibiting skin temperatures below this threshold are designated as snow-covered, contingent upon their location within terrestrial zones where the land-sea mask value surpasses 0.6, considering that the land-sea mask values range between 0 and 1. The majority of snow-covered surfaces are expected to occur predominantly during the winter months, particularly in January and February. In January, a significant portion of the land within the study area is snow-covered, with a notably higher density of observations compared to February and the subsequent months (Figure 9). This figure also illustrates the seasonal variation in snow-covered regions across Scandinavia. Notably, no snow cover was observed in June 2024. During the autumn month of October (Figure 9g), limited snowfall events were recorded over Norway and the northern part of Sweden. Regarding the RMSE, the SPEC experiment consistently shows higher values than the LAMB experiment across all four months analyzed. The error is particularly pronounced along the coastal regions of Norway, which may be attributed to the complex orographic influences associated with high altitudes, as well as interactions between maritime and terrestrial environments in these areas.
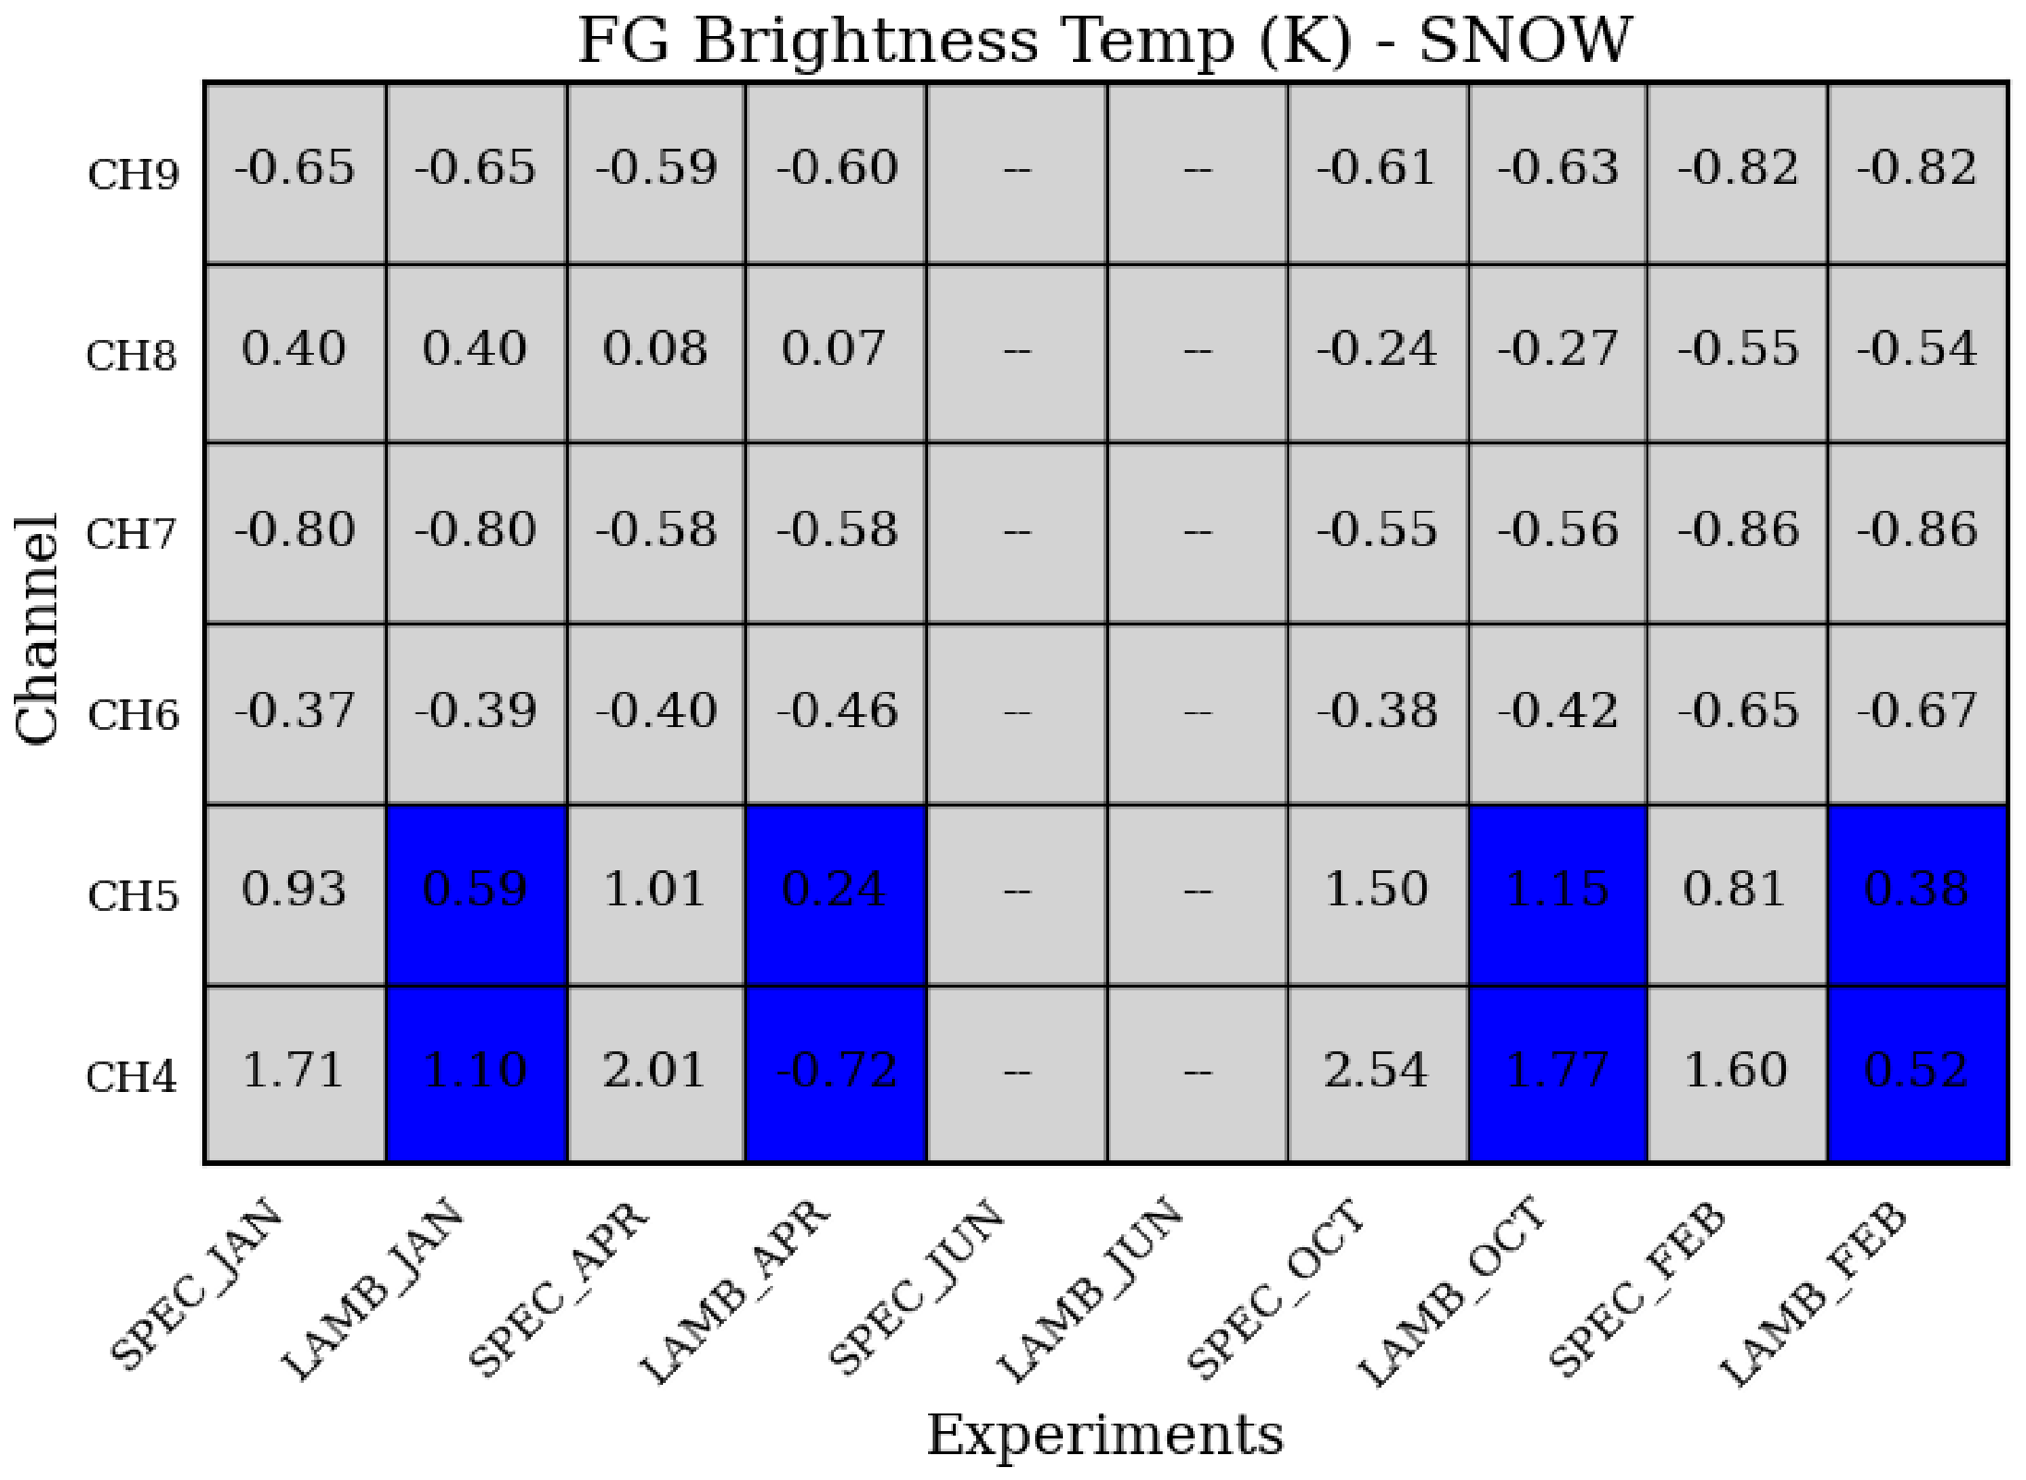
The distribution of observations, along with the mean first-guess departures of BT (in K) over snow-covered regions, indicates that the LAMB experiment outperforms the SPEC experiment for channel 4 (52.8 GHz) and channel 5 (53.59 GHz), exhibiting a positive mean error (Figure 10). However, for channel 6, the error distributions are comparable between the two experiments. Additionally, the number of observations is higher in the LAMB experiment than in the SPEC experiment across all months and channels. The discrepancy in the number of observations between the two experiments is attributable to the application of quality control measures prior to data assimilation. Specifically, observations were filtered in accordance with Equation (2) in Lindskog et al. (2021). This procedure incorporates a gross error check intended to eliminate radiance observations impacted by significant errors
A comparative evaluation of the SPEC and LAMB experiments over snow-covered areas was performed by examining the mean first-guess departures of brightness temperatures prior to bias correction. The results demonstrate that the LAMB experiment yields lower mean departures than the SPEC experiment for AMSU-A channel 4 (52.8 GHz) and channel 5 (53.59 GHz), with reductions of approximately 1.3 K and 0.5 K, respectively. Notably, the 1.3 K improvement corresponds to an estimated 50–100% reduction in error. Throughout the snow season, the LAMB configuration consistently surpasses the performance of the SPEC formulation. Conversely, the difference between the two experiments for channel 6 (54.4 GHz) is minimal, approximately 0.03 K, indicating that this discrepancy likely falls within the uncertainty bounds of the observations or the RTTOV simulations. For the higher-peaking channels (channels 7 through 9), both experiments exhibit comparable performance, which aligns with expectations given their diminished sensitivity to surface emission effects.
Figure 11.
Same as Figure 7 but over snow surfaces.
Figure 11.
Same as Figure 7 but over snow surfaces.
An effect-size analysis was performed to quantify the practical significance of the differences between the SPEC and LAMB experiments over snow-covered regions during January 2024 and February 2025. In January 2024 (see Table 1), the AMSU-A channel 4 demonstrated greater variability in departure values within the SPEC experiment compared to the LAMB experiment. Specifically, the standard deviation and variance were 0.97 and 0.95, respectively, for SPEC, whereas these values were lower in LAMB at 0.91 and 0.83. Additionally, the mean departure was notably higher in the SPEC experiment, as evidenced by the broader 95% confidence interval (1.70–1.72 K) relative to that of LAMB (1.09–1.11 K). This disparity is further substantiated by a substantial t-test statistic of 105.45, indicating a statistically significant difference in mean departures, while the F-test statistic of 1.14 suggests a measurable increase in variance. Considering that typical AMSU-A channel 4 departures range between 1 and 2 K, the observed reduction in mean departure from approximately 1.7 K in SPEC to 1.1 K in LAMB corresponds to an improvement of roughly 0.6 K. This represents a meaningful decrease in simulation error and implies a more accurate modeling of surface reflection processes within the LAMB configuration. Similar behavior is observed for channel 5, where SPEC exhibits a larger spread (0.63) and variance (0.40) than LAMB (0.54 and 0.29), with confidence intervals of 0.93–0.94 K and 0.58–0.59 K, respectively. The corresponding t-test and F-test statistics (96.46 and 1.40) further confirm statistically significant differences in both mean and variability.
A similar analysis was conducted for February 2025 (Table 2). In channel 4, the LAMB experiment exhibits larger spread (1.40) and variance (1.97) than SPEC (1.16 and 1.35). Nevertheless, the mean departure remains substantially higher in SPEC (1.58–1.62 K) than in LAMB (0.51–0.54 K), resulting in a highly significant t-test statistic of 89.32. For channel 5, SPEC again shows larger spread and variance than LAMB, together with larger mean departures. The corresponding statistical tests confirm significant differences in both mean and variance.
Overall, both winter periods demonstrate persistent and statistically significant differences in first-guess departures between the SPEC and LAMB emissivity formulations. The largest differences occur in channels 4 and 5, which are most sensitive to surface emission and skin-temperature effects over snow-covered surfaces. The consistently smaller mean departures obtained with the LAMB formulation suggest a more realistic representation of microwave surface emissivity over snow, resulting in improved agreement between observed and simulated brightness temperatures.
3.3. Discussion and Conclusions
The assimilation of surface-sensitive MW observations in complex regions continues to present challenges due to persistent uncertainties in the representation of surfaces in NWP systems. This study assesses the application of the emissivity method on the surface employing two distinct assumptions: SPEC and LAMB. To this end, two separate experiments were conducted based on these assumptions to investigate the seasonal variability of surface emissivity. The analysis primarily concentrates on the influence of these assumptions on land and snow-covered surfaces, with the objective of determining the most appropriate parameterization.
Experimental results indicate that these two reflectivity models exhibit distinct seasonal first-guess departures patterns. During the winter months (January–February), the SPEC assumption results in higher RMSE in first-guess departures over land relative to the LAMB approach. In contrast, during the summer season, the SPEC model outperforms LAMB across land surfaces. In terms of observation. After applying bias correction, the LAMB experiment exhibited a 4% increase in the number of assimilated observations compared to the SPEC experiment over the land area. In snow-covered regions during the winter season, both models consistently exhibit positive biases in first-guess departures. Furthermore, the variability in surface emissivity is markedly higher under the LAMB assumption, while the SPEC model produces lower and more spatially uniform standard deviations. Regarding the mean first guess departure, the LAMB experiment demonstrates superior performance for surface-sensitive channels compared to the SPEC experiment.
Previous studies by [19] and [20] demonstrated that adopting a Lambertian surface assumption can substantially reduce biases. Consistent with these findings, our analysis of departure statistics derived using SPEC over both land and snow surfaces revealed notable biases that were significantly mitigated when a Lambertian surface assumption was applied over the snow surface. Their study further notes that, despite these improvements, residual biases persist across several channels. Notably, the surface sensitive channels exhibited a less consistent relationship when comparing observed bias differences with those predicted from simulations of the Lambertian effect across various months. They also found that the presence of negative biases at nadir for channel 4 suggests potential overcorrection, implying that a partially Lambertian surface assumption may offer a more accurate representation.
Our results also indicate a degree of seasonal variability consistent with prior studies. Specifically, the reduced error observed during winter months in the LAMB experiment suggests increased Lambertian behavior, implying that surface characteristics fluctuate with snow conditions. This observation corroborates the findings of [19], who reported that the Lambertian assumption yielded optimal performance during the Antarctic winter, whereas more specular assumptions were preferable in summer. Hence, our findings corroborate those of [19] and [20], reinforcing the conclusion that adopting a Lambertian surface assumption enhances bias representation and improves the accuracy of radiance assimilation over land area and snow area, particularly for low-peaking channels.
The main innovation of this study is the use of a high-resolution limited-area model to improve microwave brightness temperature simulations over heterogeneous surfaces such as coasts, lakes, and snow-covered regions. Unlike previous studies that focused mainly on surface reflection or emissivity parameterization within global models (e.g., [20]), This work demonstrates the importance of high-resolution background fields in reducing representativeness errors. The results provide new statistical evidence that finer spatial resolution significantly enhances AMSU-A radiance simulations over complex land and snow surfaces.
An independent study is currently being conducted to assess the impact of these two experiments over sea-ice regions [33]. This work is limited to AMSU-A MW radiances under clear-sky conditions. As stated in [20], these results could also be beneficial to optimize the assimilation of other existing microwave sounders such as ATMS, MWHS-2 and MHS. These instruments are presently actively assimilated in HARMONIE. Ongoing progress in all-sky radiance assimilation techniques is expected to increase the usefulness of MW observation by allowing effective assimilation of observations in cloudy and precipitating conditions, thereby enhancing the overall observation impact. In addition, the European Space Agency (ESA) successfully launched the Arctic Weather Satellite (AWS) on August 16, 2024 [34,35]. The AWS carries a cross-track scanning microwave radiometer with 19 channels operating between 50 and 325 GHz. These channels provide information on atmospheric temperature and humidity profiles and include frequencies at 50, 89, and 183 GHz, similar to those of other AMSU microwave instruments. The results from this study can provide valuable input for assimilating surface-sensitive AWS radiances under both clear-sky and all-sky conditions and can be further extended using new AWS datasets in future research.
The overarching objective of this research is to assess the strengths and limitations of the current data assimilation system. Particular emphasis is placed on identifying geographic regions where existing methodologies exhibit suboptimal performance, with the intent of developing refined surface characterization approaches to address these shortcomings. Moreover, to date, atmospheric analyses have not actively incorporated surface-related information such as surface temperature or emissivity. With the emergence of coupled data assimilation frameworks, future investigations will prioritize leveraging surface information to improve the consistency and accuracy of integrated atmosphere–surface analyses [36].
Finally, recent advances in machine learning have demonstrated significant potential for estimating surface emissivity using microwave remote sensing observations. A longstanding challenge in remote sensing is the limited understanding of geophysical states inferred from satellite measurements of Earth’s emitted radiation. To address this issue, [37] introduced a novel sea ice surface emissivity model and produced detailed, global, year-round maps of sea ice concentration through inverse modeling techniques. This study advanced the retrieval of surface emissivity from satellite microwave data by employing a hybrid framework that integrates machine learning with data assimilation. The supervised learning component incorporated prior knowledge of relevant geophysical variables, thereby enhancing both model accuracy and interpretability. The results indicate that such hybrid methodologies can substantially improve the estimation of model parameters and geophysical variables across diverse Earth system applications. Complementing this work, [38] developed a neural network–based framework that transforms traditional models into satellite retrieval algorithms, enabling the direct estimation of boundary conditions from adjacent spectral channels. Their method achieved high retrieval accuracy, validated with real observational datasets, underscoring its potential for integration within assimilation systems. The continued expansion of these hybrid machine learning approaches represents a promising direction for future research.
Author Contributions
All authors contributed equally to this work. All authors have read and agreed to the published version of the manuscript.
Funding
This research received no external funding
Data Availability Statement
Not applicable.
Acknowledgments
This research was supported by the European Space Agency (ESA) project: Performance Evaluation of Arctic Weather Satellite Data (No. 4000136511/21/NL/IA). The Swedish contribution was also supported by the Swedish National Space Agency (SNSA) project: Consistent Air-Ice-Sea Data Assimilation of Satellite Observations (CAISA) (No. 2021-00085).
Conflicts of Interest
The authors declare no conflicts of interest.
References
- Bauer, P.; Magnusson, L.; Thépaut, J.N.; Hamill, T.M. Aspects of ECMWF model performance in polar areas. Q. J. R. Meteorol. Soc. 2016, 142, 583–596. [Google Scholar] [CrossRef]
- Lawrence, H.; Bormann, N.; Sandu, I.; Day, J.; Farnan, J.; Bauer, P. Use and impact of Arctic observations in the ECMWF Numerical Weather Prediction system. Q. J. R. Meteorol. Soc. 2019, 145, 3432–3454. [Google Scholar] [CrossRef]
- Sandells, M.; Rutter, N.; Wivell, K.; Essery, R.; Fox, S.; Harlow, C.; Picard, G.; Roy, A.; Royer, A.; Toose, P. Simulation of Arctic snow microwave emission in surface-sensitive atmosphere channels. The Cryosphere 2024, 18, 3971–3990. [Google Scholar] [CrossRef]
- Hirahara, Y.; de Rosnay, P.; Arduini, G. Evaluation of a microwave emissivity module for snow covered area with CMEM in the ECMWF Integrated Forecasting System. Remote Sens. 2020, 12, 2946. [Google Scholar] [CrossRef]
- Randriamampianina, R.; Iversen, T.; Storto, A. Exploring the assimilation of IASI radiances in forecasting polar lows. Q. J. R. Meteorol. Soc. 2011, 137, 1700–1715. [Google Scholar] [CrossRef]
- Lindskog, M.; Dybbroe, A.; Randriamampianina, R. Use of microwave radiances from Metop-C and Fengyun-3C/D satellites for a Northern European limited-area data assimilation system. Adv. Atmos. Sci. 2021, 38, 1415–1428. [Google Scholar] [CrossRef]
- Lindskog, M.; Azad, R.; de Haan, S.; Blomster, J.; Ridal, M. Impact of Mode-S enhanced surveillance weather observations on forecasts over the MetCoOp Northern European model domain. J. Appl. Meteorol. Climatol. 2023, 62, 985–1003. [Google Scholar] [CrossRef]
- Karbou, F.; Gérard, E.; Rabier, F. Global 4DVAR assimilation and forecast experiments using AMSU observations over land. Part I: Impacts of various land surface emissivity parameterizations. Weather Forecast. 2010, 25, 5–19. [Google Scholar] [CrossRef]
- Geer, A.J.; Bauer, P.; English, S.J. Assimilating AMSU-A temperature sounding channels in the presence of cloud and precipitation. Technical Report Technical Memorandum No. 670, ECMWF, 2012. [Google Scholar]
- Bormann, N.; Lupu, C.; Geer, A.; Lawrence, H.; Weston, P.; English, S. Assessment of the forecast impact of surface-sensitive microwave radiances over land and sea ice. 2017. [Google Scholar] [CrossRef]
- Karbou, F.; Rabier, F.; Prigent, C. The assimilation of observations from the Advanced Microwave Sounding Unit over sea ice in the French global numerical weather prediction system. Mon. Weather Rev. 2014, 142, 125–140. [Google Scholar] [CrossRef]
- Baordo, F.; Geer, A.J. Assimilation of SSMIS humidity-sounding channels in all-sky conditions over land using a dynamic emissivity retrieval. Q. J. R. Meteorol. Soc. 2016, 142, 2854–2866. [Google Scholar] [CrossRef]
- Okabe, I.; Okamoto, K. Assimilation of surface-sensitive bands’ clear-sky radiance data using retrieved surface temperatures from geostationary satellites. Q. J. R. Meteorol. Soc. 2023, 149, 1473–1497. [Google Scholar] [CrossRef]
- Mile, M.; Guedj, S.; Randriamampianina, R. Exploring the footprint representation of microwave radiance observations in an Arctic limited-area data assimilation system. Geosci. Model Dev. 2024, 17, 6571–6587. [Google Scholar] [CrossRef]
- Zhang, Z.; Brown, S.; Colliander, A. Retrieval of atmospheric water vapor and temperature profiles over Antarctica through an iterative approach. EGUsphere Prepr. 2024. [Google Scholar] [CrossRef]
- English, S.J.; Hewison, T.J. Fast generic millimeter-wave emissivity model. Proc. Proc. SPIE 1998, Vol. 3503, 288. [Google Scholar] [CrossRef]
- Karbou, F.; Gérard, E.; Rabier, F. Microwave land emissivity and skin temperature for AMSU-A and -B assimilation over land. Q. J. R. Meteorol. Soc. 2006, 132, 2333–2355. [Google Scholar] [CrossRef]
- Xiao, H.; Li, J.; Liu, G.; Wang, L.; Bai, Y. Assimilation of AMSU-A Surface-Sensitive Channels in the CMA-GFS 4D-Var System over Land. Weather Forecast. 2023, 38, 1777–1790. [Google Scholar] [CrossRef]
- Guedj, S.; Karbou, F.; Rabier, F.; Bouchard, A. Toward a better modeling of surface emissivity to improve AMSU data assimilation over Antarctica. IEEE Trans. Geosci. Remote Sens. 2010, 48, 1976–1985. [Google Scholar] [CrossRef]
- Bormann, N. Accounting for Lambertian reflection in the assimilation of microwave sounding radiances over snow and sea ice. Q. J. R. Meteorol. Soc. 2022, 148, 2796–2813. [Google Scholar] [CrossRef]
- Müller, M.; et al. AROME-MetCoOp: A Nordic convective-scale operational weather prediction model. Weather Forecast. 2017, 32, 609–627. [Google Scholar] [CrossRef]
- Ridal, M.; Sanchez-Arriola, J.; Dahlbom, M. Optimal use of radar radial winds in the HARMONIE numerical weather prediction system. J. Appl. Meteorol. Climatol. 2023, 62, 1745–1759. [Google Scholar] [CrossRef]
- Bengtsson, L.; et al. The HARMONIE–AROME model configuration in the ALADIN–HIRLAM NWP system. Mon. Weather Rev. 2017, 145, 1919–1935. [Google Scholar] [CrossRef]
- Frogner, I.; et al. HarmonEPS—The HARMONIE Ensemble Prediction System. Weather Forecast. 2019, 34, 1909–1937. [Google Scholar] [CrossRef]
- Mlawer, E.J.; Taubman, S.J.; Brown, P.D.; Iacono, M.J.; Clough, S.A. Radiative transfer for inhomogeneous atmospheres: RRTM, a validated correlated-k model for the longwave. J. Geophys. Res. Atmos. 1997, 102, 16663–16682. [Google Scholar] [CrossRef]
- Berre, L. Estimation of synoptic and mesoscale forecast error covariances in a limited-area model. Mon. Weather Rev. 2000, 128, 644–667. [Google Scholar] [CrossRef]
- Montmerle, T.; Berre, L. Diagnosis and formulation of heterogeneous background-error covariances at the mesoscale. Q. J. R. Meteorol. Soc. 2010, 136, 1408–1420. [Google Scholar] [CrossRef]
- Dee, D.P. Bias and data assimilation. Q. J. R. Meteorol. Soc. 2005, 131, 3323–3334. [Google Scholar] [CrossRef]
- Auligné, T.; McNally, A.P. Interaction between bias correction and quality control. Q. J. R. Meteorol. Soc. 2007, 133, 643–653. [Google Scholar] [CrossRef]
- Prigent, C.; Rossow, W.; Matthews, E. Microwave land surface emissivities estimated from SSM/I observations. J. Geophys. Res. 1997, 102, 21867–21890. [Google Scholar] [CrossRef]
- Mätzler, C. Applications of the interaction of microwaves with the natural snow cover. Remote Sens. Rev. 1987, 2, 259–387. [Google Scholar] [CrossRef]
- English, S.J. The importance of accurate skin temperature in assimilating radiances from satellite sounding instruments. IEEE Trans. Geosci. Remote Sens. 2008, 46, 403–408. [Google Scholar] [CrossRef]
- Tonboe, R.T.; Schyberg, H.; Nielsen, E.; Larsen, K.R.; Tveter, F.T. The EUMETSAT OSI SAF Near 50 GHz Sea Ice Emissivity Model. Tellus A Dyn. Meteorol. Oceanogr. 2013, 65, 18380. [Google Scholar] [CrossRef]
- Eriksson, P.; Emrich, A.; Kempe, K.; Riesbeck, J.; Aljarosha, A.; Auriacombe, O.; et al. The Arctic Weather Satellite radiometer. Atmos. Meas. Tech. 2025, 18, 4709–4729. [Google Scholar] [CrossRef]
- Duncan, D.; Bormann, N.; Dahoui, M.; Crepulja, M. Assessment of the Arctic Weather Satellite in NWP; EUMETSAT; Technical Report Contract Report No. RFQ/21/1383948, 2025. [Google Scholar]
- de Rosnay, P.; Browne, P.; de Boisséson, E.; Fairbairn, D.; Hirahara, Y.; Ochi, K.; et al. Coupled data assimilation at ECMWF: Current status, challenges and future developments. Q. J. R. Meteorol. Soc. 2022, 148, 2672–2702. [Google Scholar] [CrossRef]
- Geer, A.J. Simultaneous inference of sea ice state and surface emissivity model using machine learning and data assimilation. J. Adv. Model. Earth Syst. 2024, 16, e2023MS004080. [Google Scholar] [CrossRef]
- Kang, E.J.; Sohn, B.J.; Song, H.J.; Liu, C. Satellite-estimated microwave emissivity and emission temperature over the Arctic sea ice: ANN-based algorithm. J. Geophys. Res. Atmos. 2025, 130, e2024JD042265. [Google Scholar] [CrossRef]
Figure 1.
MetCoOp operational model domain shown over the contour-colored skin temperature (°C), valid at 00 UTC on 10 February 2025.
Figure 1.
MetCoOp operational model domain shown over the contour-colored skin temperature (°C), valid at 00 UTC on 10 February 2025.
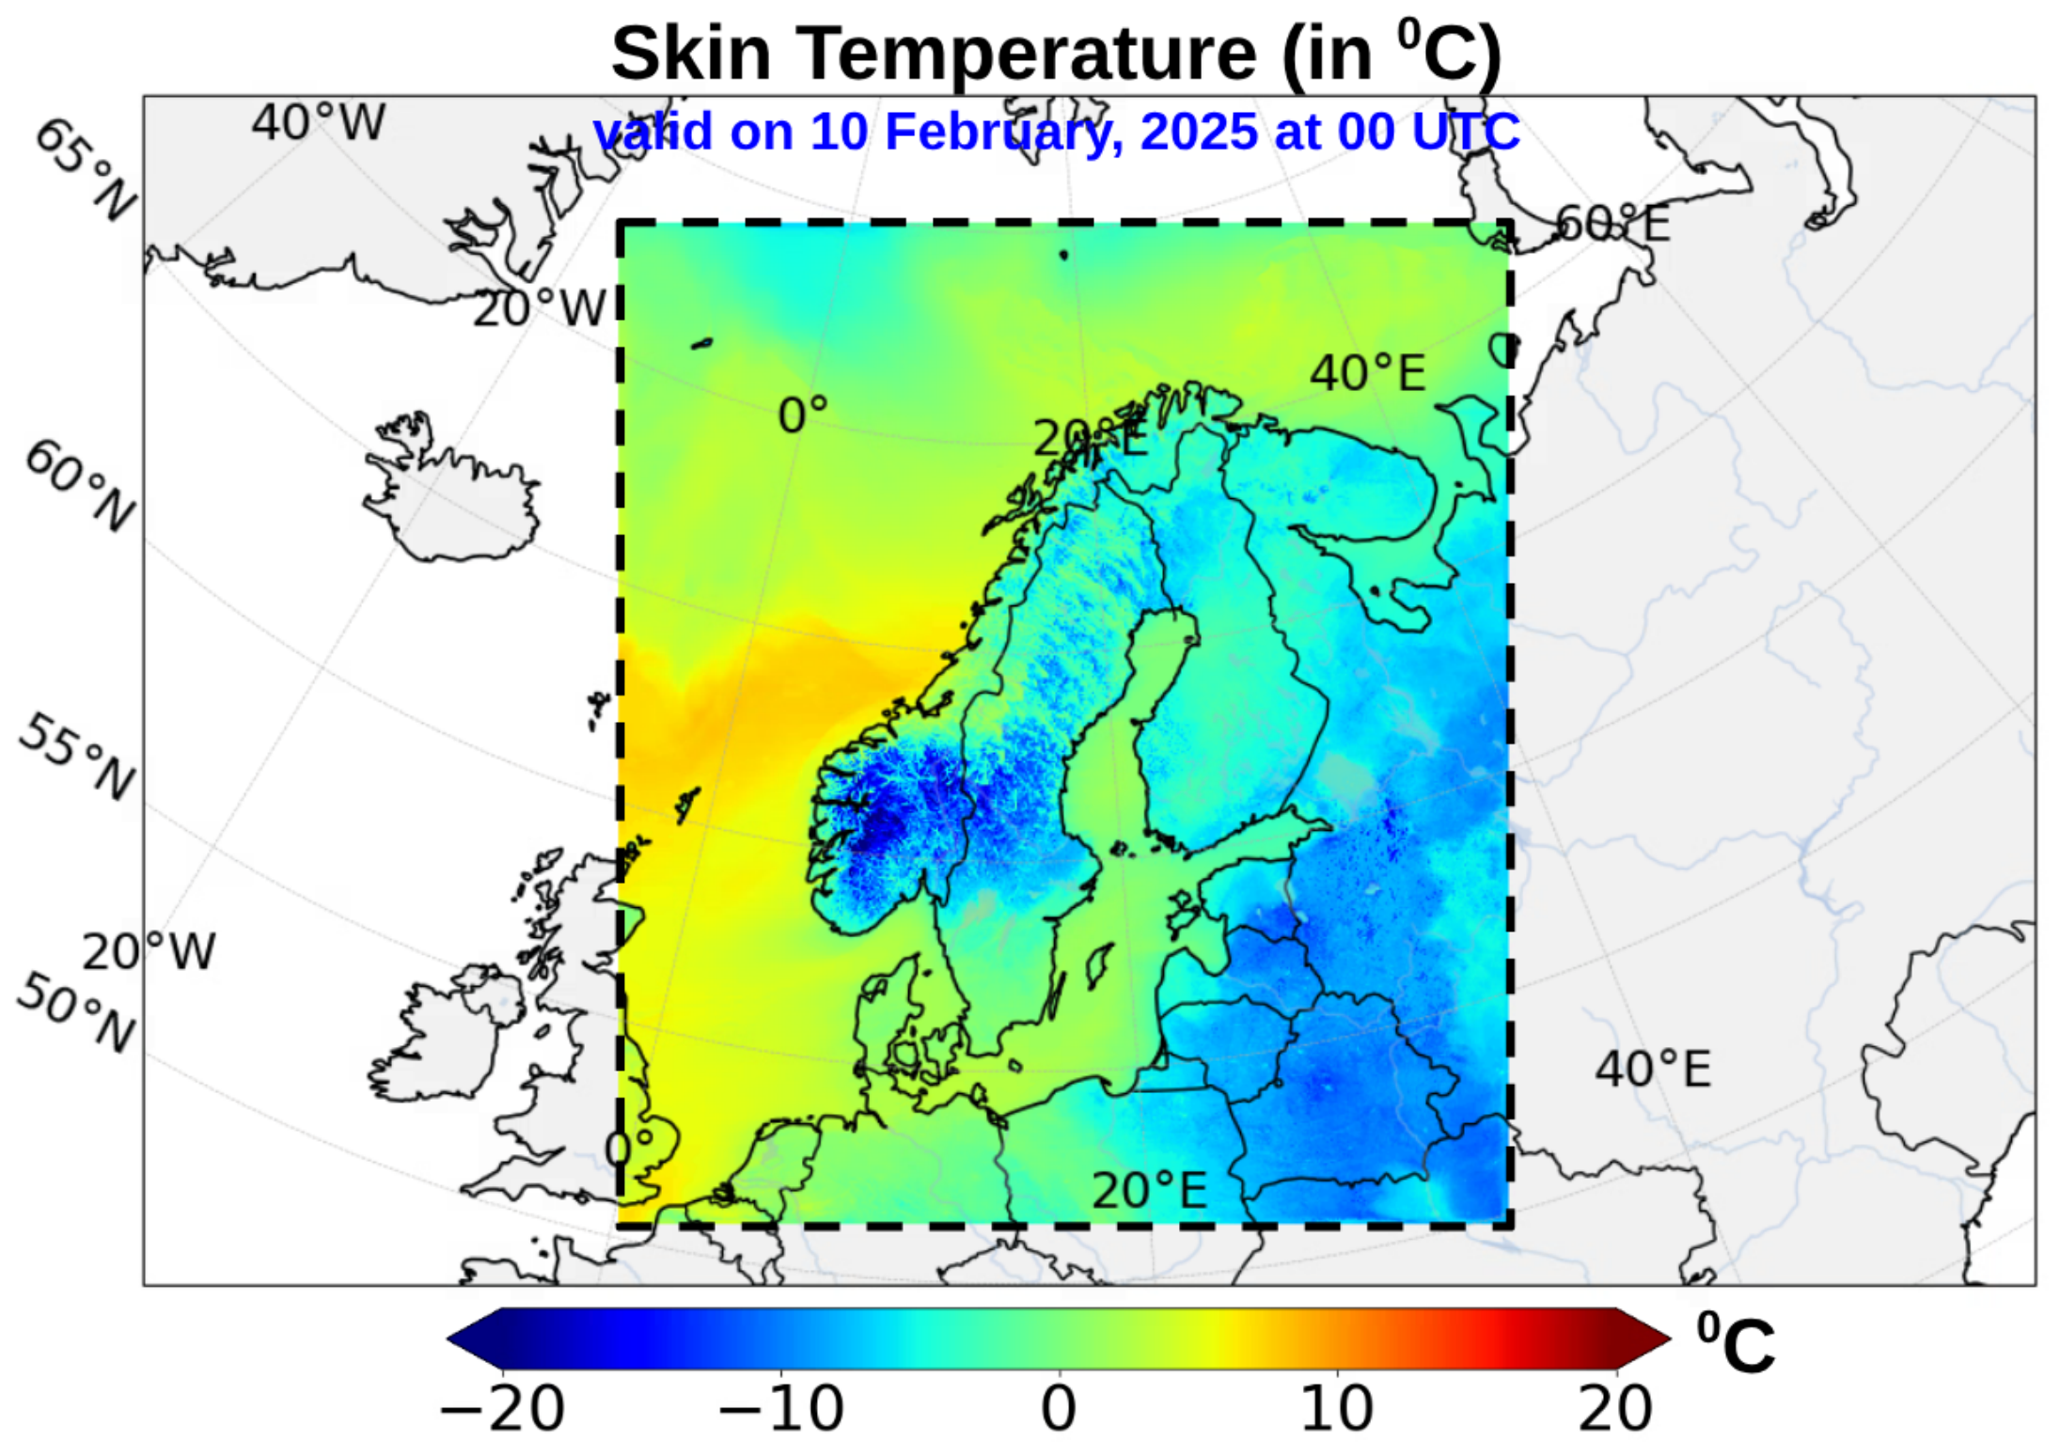
Figure 2.
Normalized clear-sky mid-latitude weighting functions for AMSUA channels 3 through 9 are presented, with the left panel depicting data for winter (left panel) and summer months (right panel).
Figure 2.
Normalized clear-sky mid-latitude weighting functions for AMSUA channels 3 through 9 are presented, with the left panel depicting data for winter (left panel) and summer months (right panel).
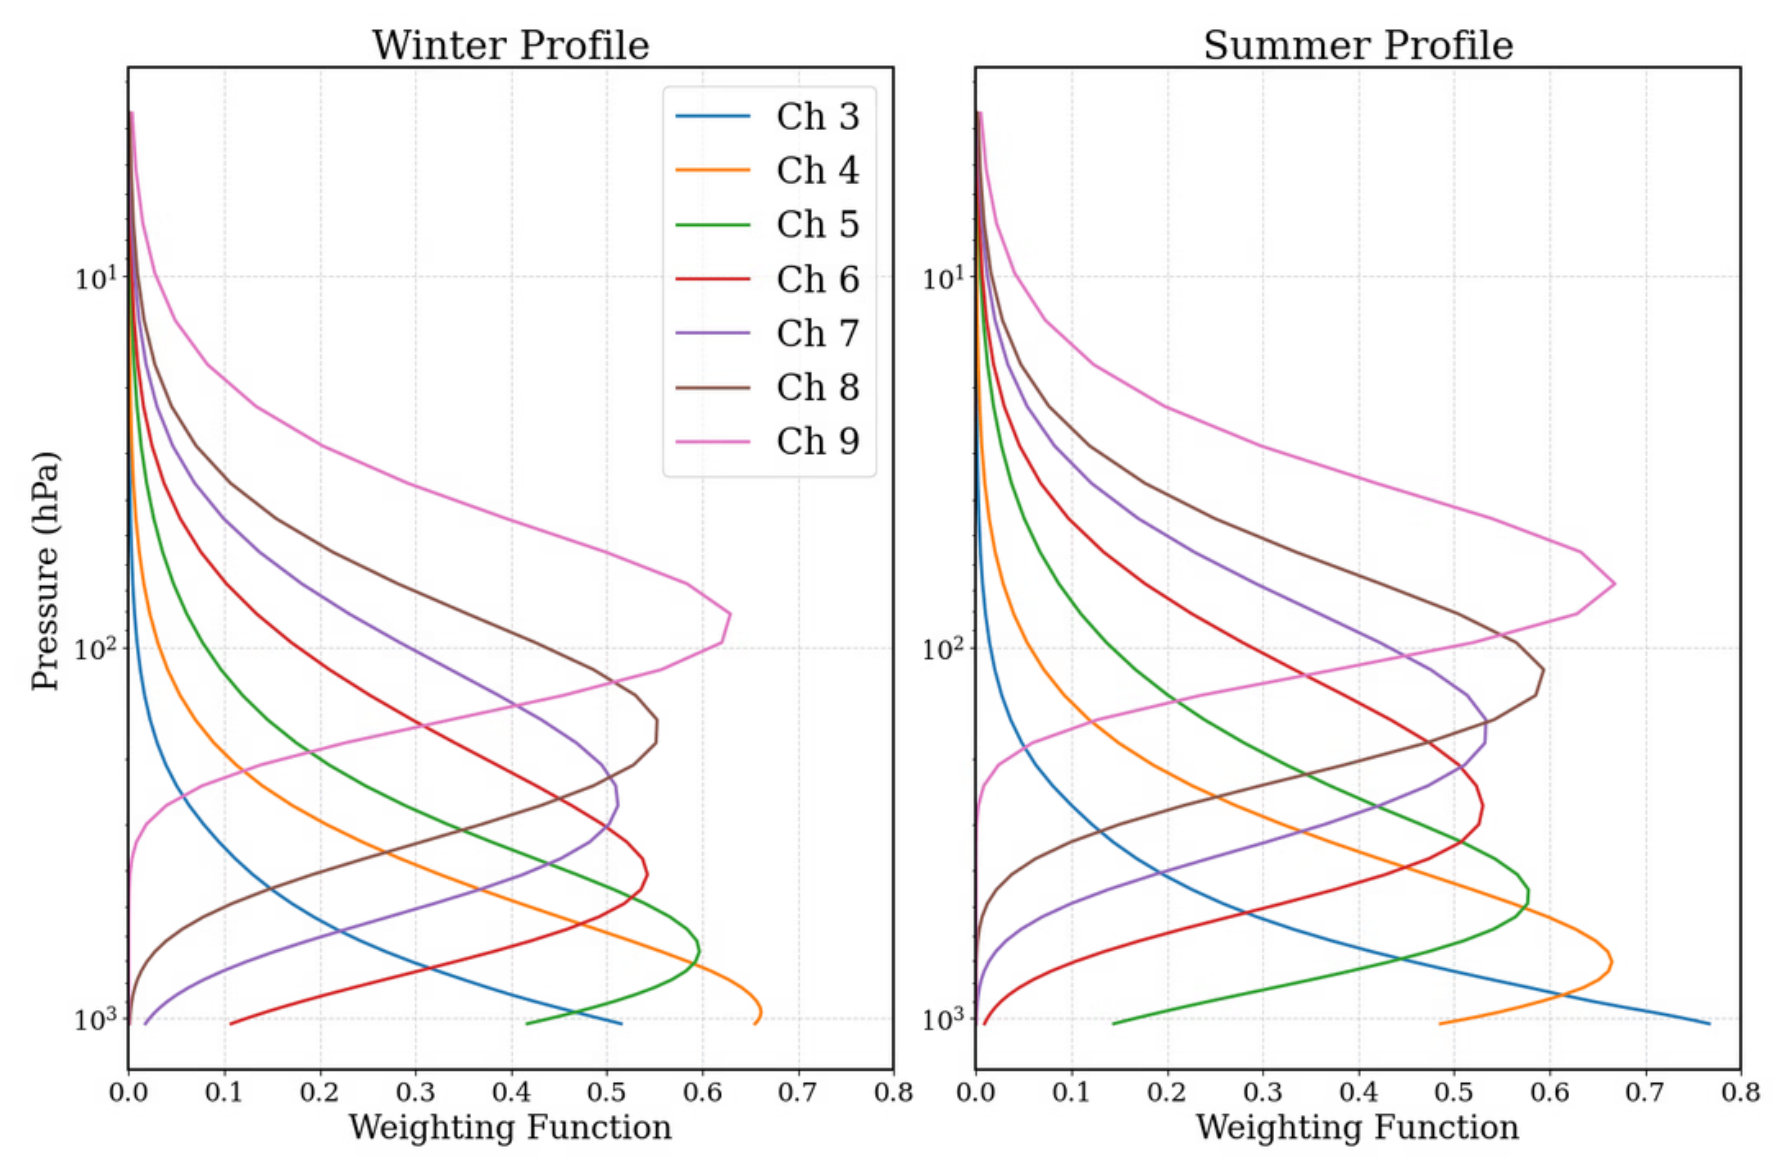
Figure 3.
Time series of daily averaged relative percentage differences in emissivity (0–1 scale) and first-guess departures (K) for AMSU-A channel 5 observations over land during the period 2–10 February 2025. The control simulation (CNTL) is compared with two sensitivity experiments in which the skin temperature is perturbed by +2 K (EXP-P) and K (EXP-M).
Figure 3.
Time series of daily averaged relative percentage differences in emissivity (0–1 scale) and first-guess departures (K) for AMSU-A channel 5 observations over land during the period 2–10 February 2025. The control simulation (CNTL) is compared with two sensitivity experiments in which the skin temperature is perturbed by +2 K (EXP-P) and K (EXP-M).
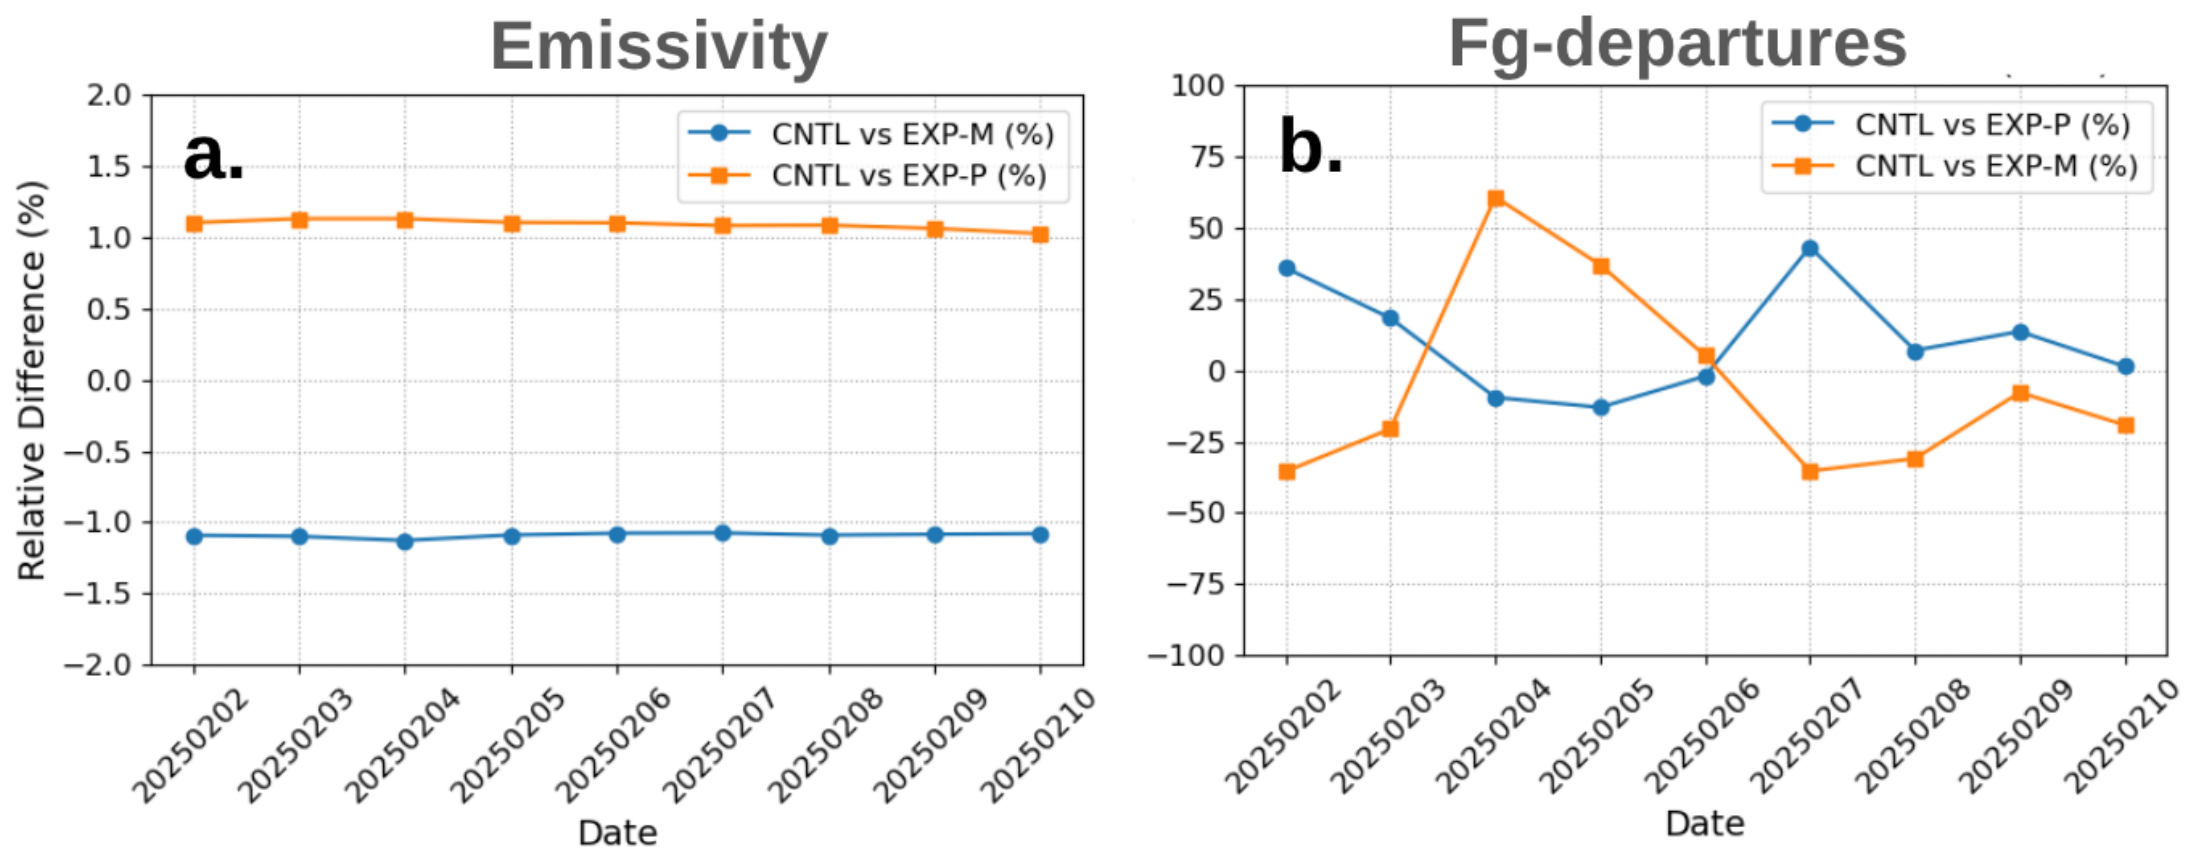
Figure 4.
The box-and-whisker plot characterizes the emissivity differences calculated at AMSU-A channel 3, per scan position (x-axis) from SPEC and LAMB experiments for the months of (a) January, (b) April, (c) June, and (d) October 2024, over the MetCoOp domain. The y-axis represents the number of observations used at different scan angles. Nadir corresponds to scan positions 15 and 16.
Figure 4.
The box-and-whisker plot characterizes the emissivity differences calculated at AMSU-A channel 3, per scan position (x-axis) from SPEC and LAMB experiments for the months of (a) January, (b) April, (c) June, and (d) October 2024, over the MetCoOp domain. The y-axis represents the number of observations used at different scan angles. Nadir corresponds to scan positions 15 and 16.
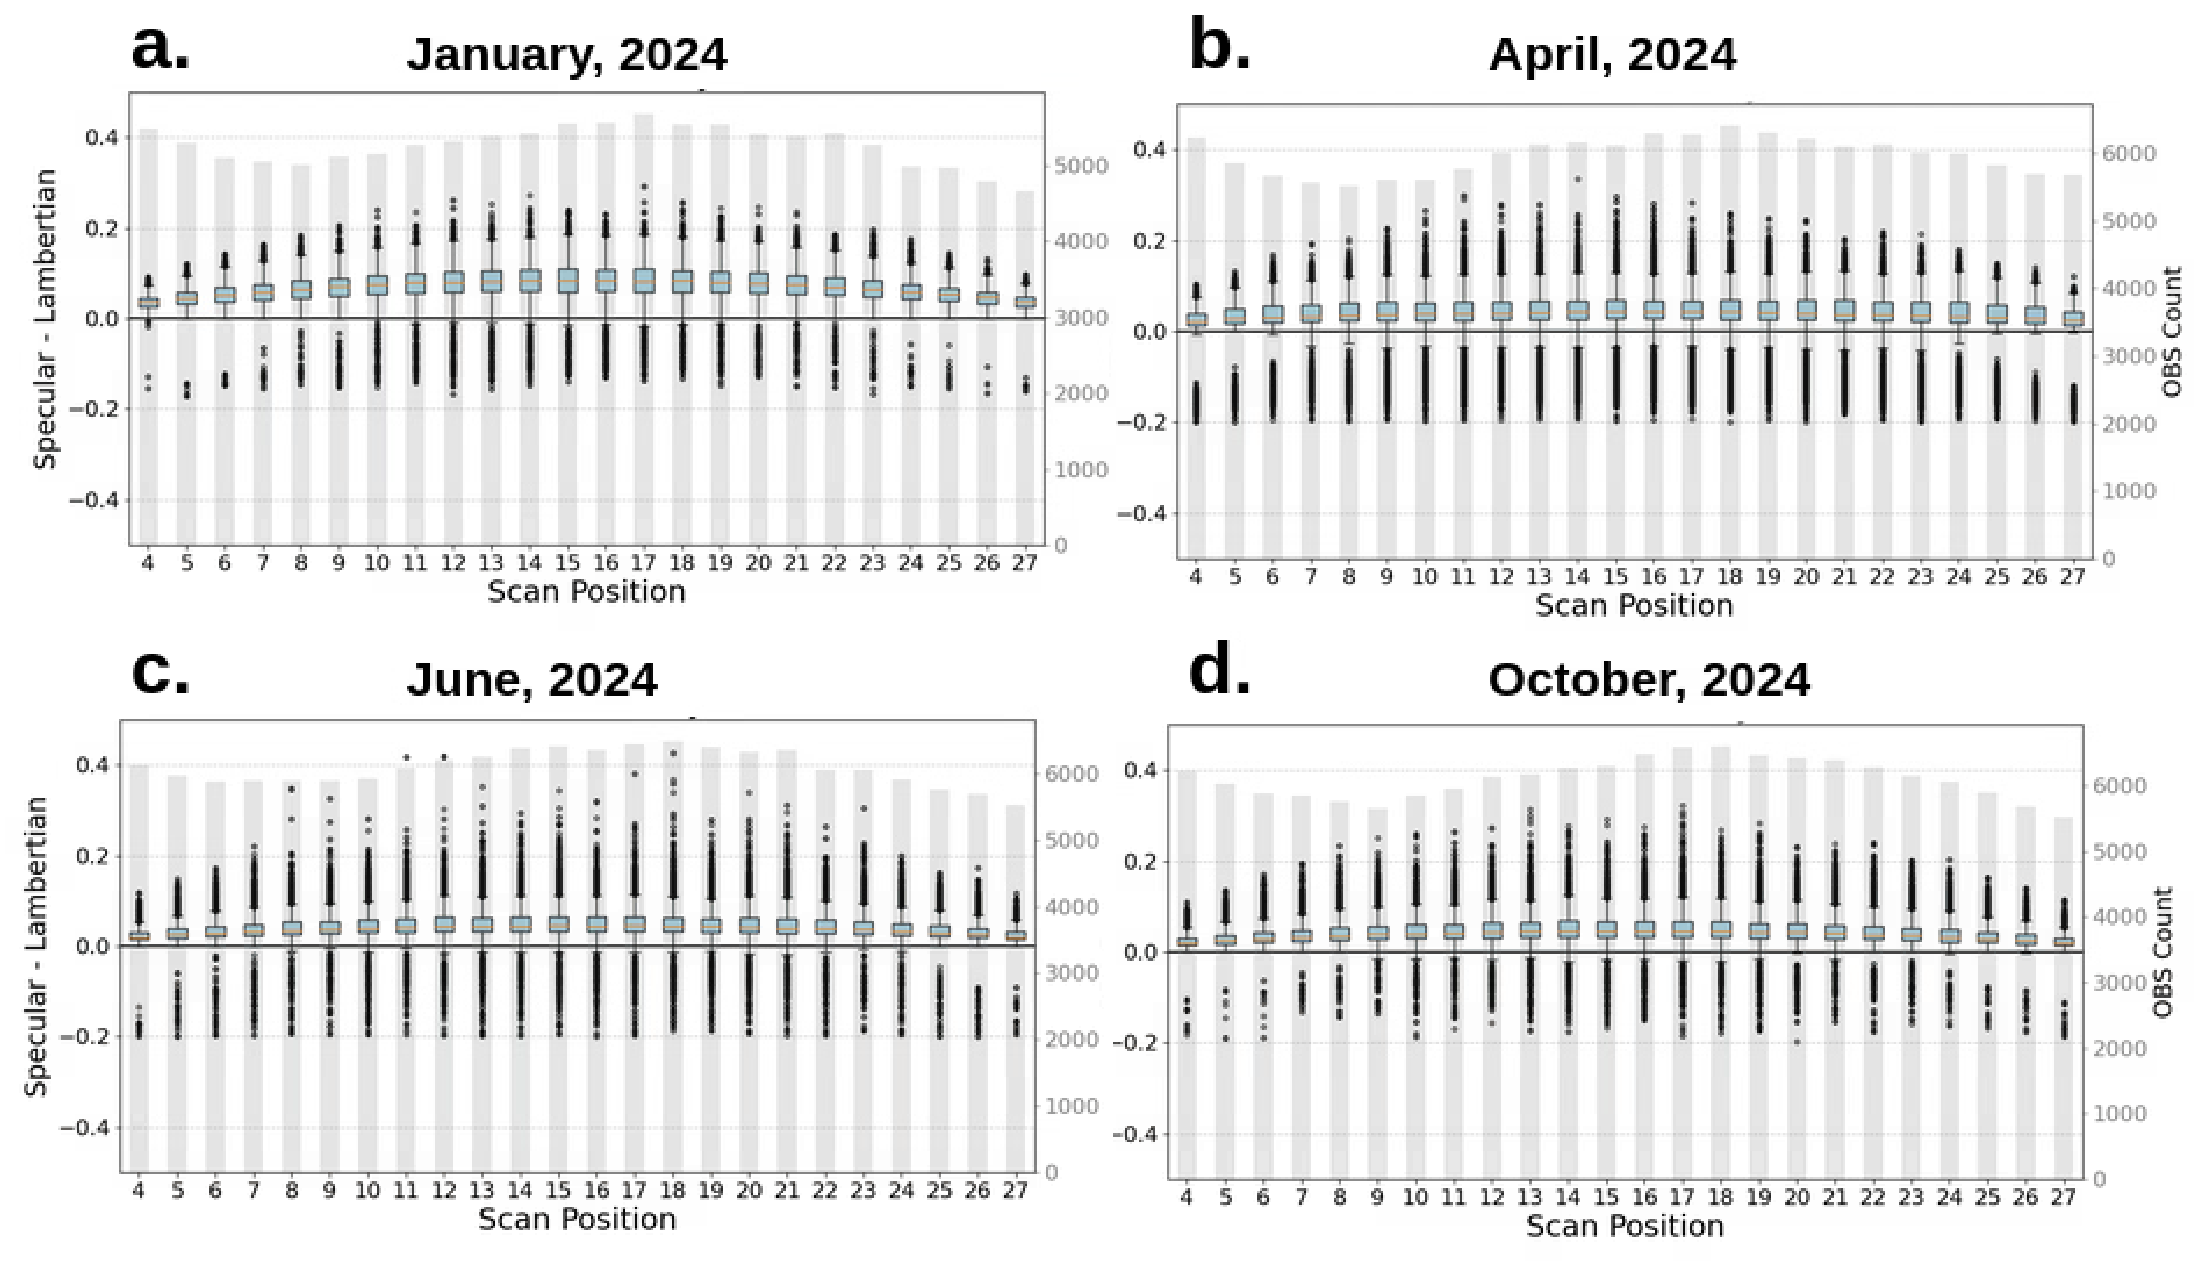
Figure 5.
Spatial distribution of the gridded (0.5x0.5) standard deviation (SD) of retrieved emissivity for SPEC and LAMB experiment, two distinct scenarios of AMSU-A channel 5, alongside the skin temperature (°C) used to retrieve surface emissivity and for four different months. For all the months and over the MetCoOp domain.
Figure 5.
Spatial distribution of the gridded (0.5x0.5) standard deviation (SD) of retrieved emissivity for SPEC and LAMB experiment, two distinct scenarios of AMSU-A channel 5, alongside the skin temperature (°C) used to retrieve surface emissivity and for four different months. For all the months and over the MetCoOp domain.
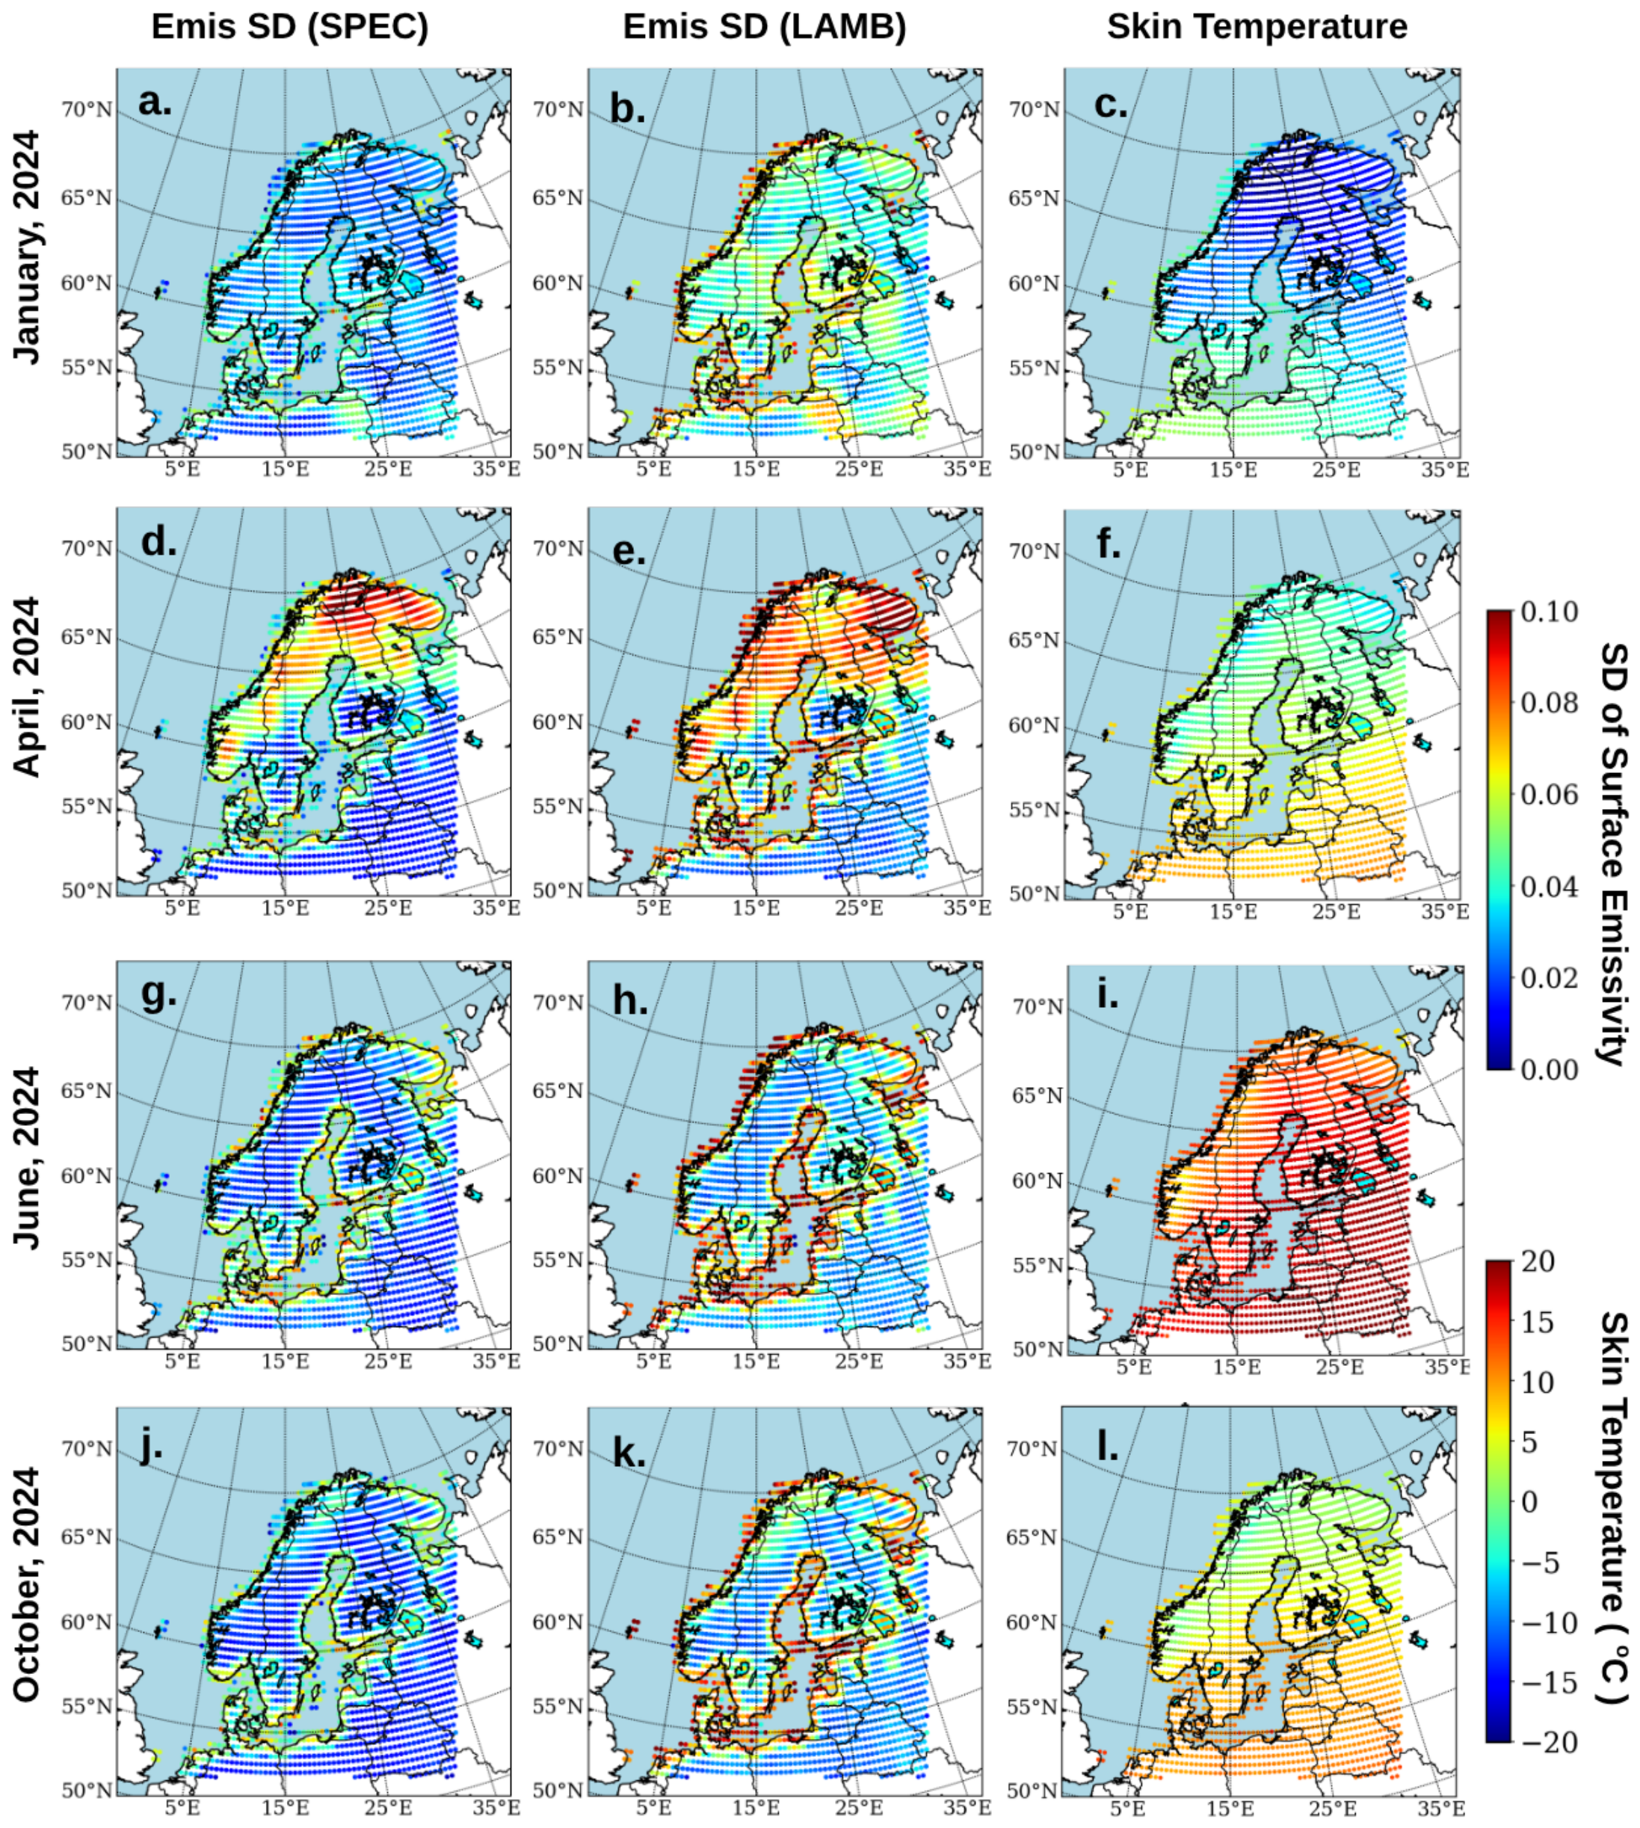
Figure 6.
Spatial distribution of the gridded (0.5x0.5) available MW observation count at the center of the nadir (scan position 15 and 16) and the corresponding root mean square error (RMSE) in terms of Brightness Temperature (BT, in Kelvin) first-guess departures to observations at AMSU-A channel 5, computed using SPEC and LAMB method for five different months. Green color scale corresponds to the observation count and the jet color scale corresponds to the first-guess departure RMSE.
Figure 6.
Spatial distribution of the gridded (0.5x0.5) available MW observation count at the center of the nadir (scan position 15 and 16) and the corresponding root mean square error (RMSE) in terms of Brightness Temperature (BT, in Kelvin) first-guess departures to observations at AMSU-A channel 5, computed using SPEC and LAMB method for five different months. Green color scale corresponds to the observation count and the jet color scale corresponds to the first-guess departure RMSE.
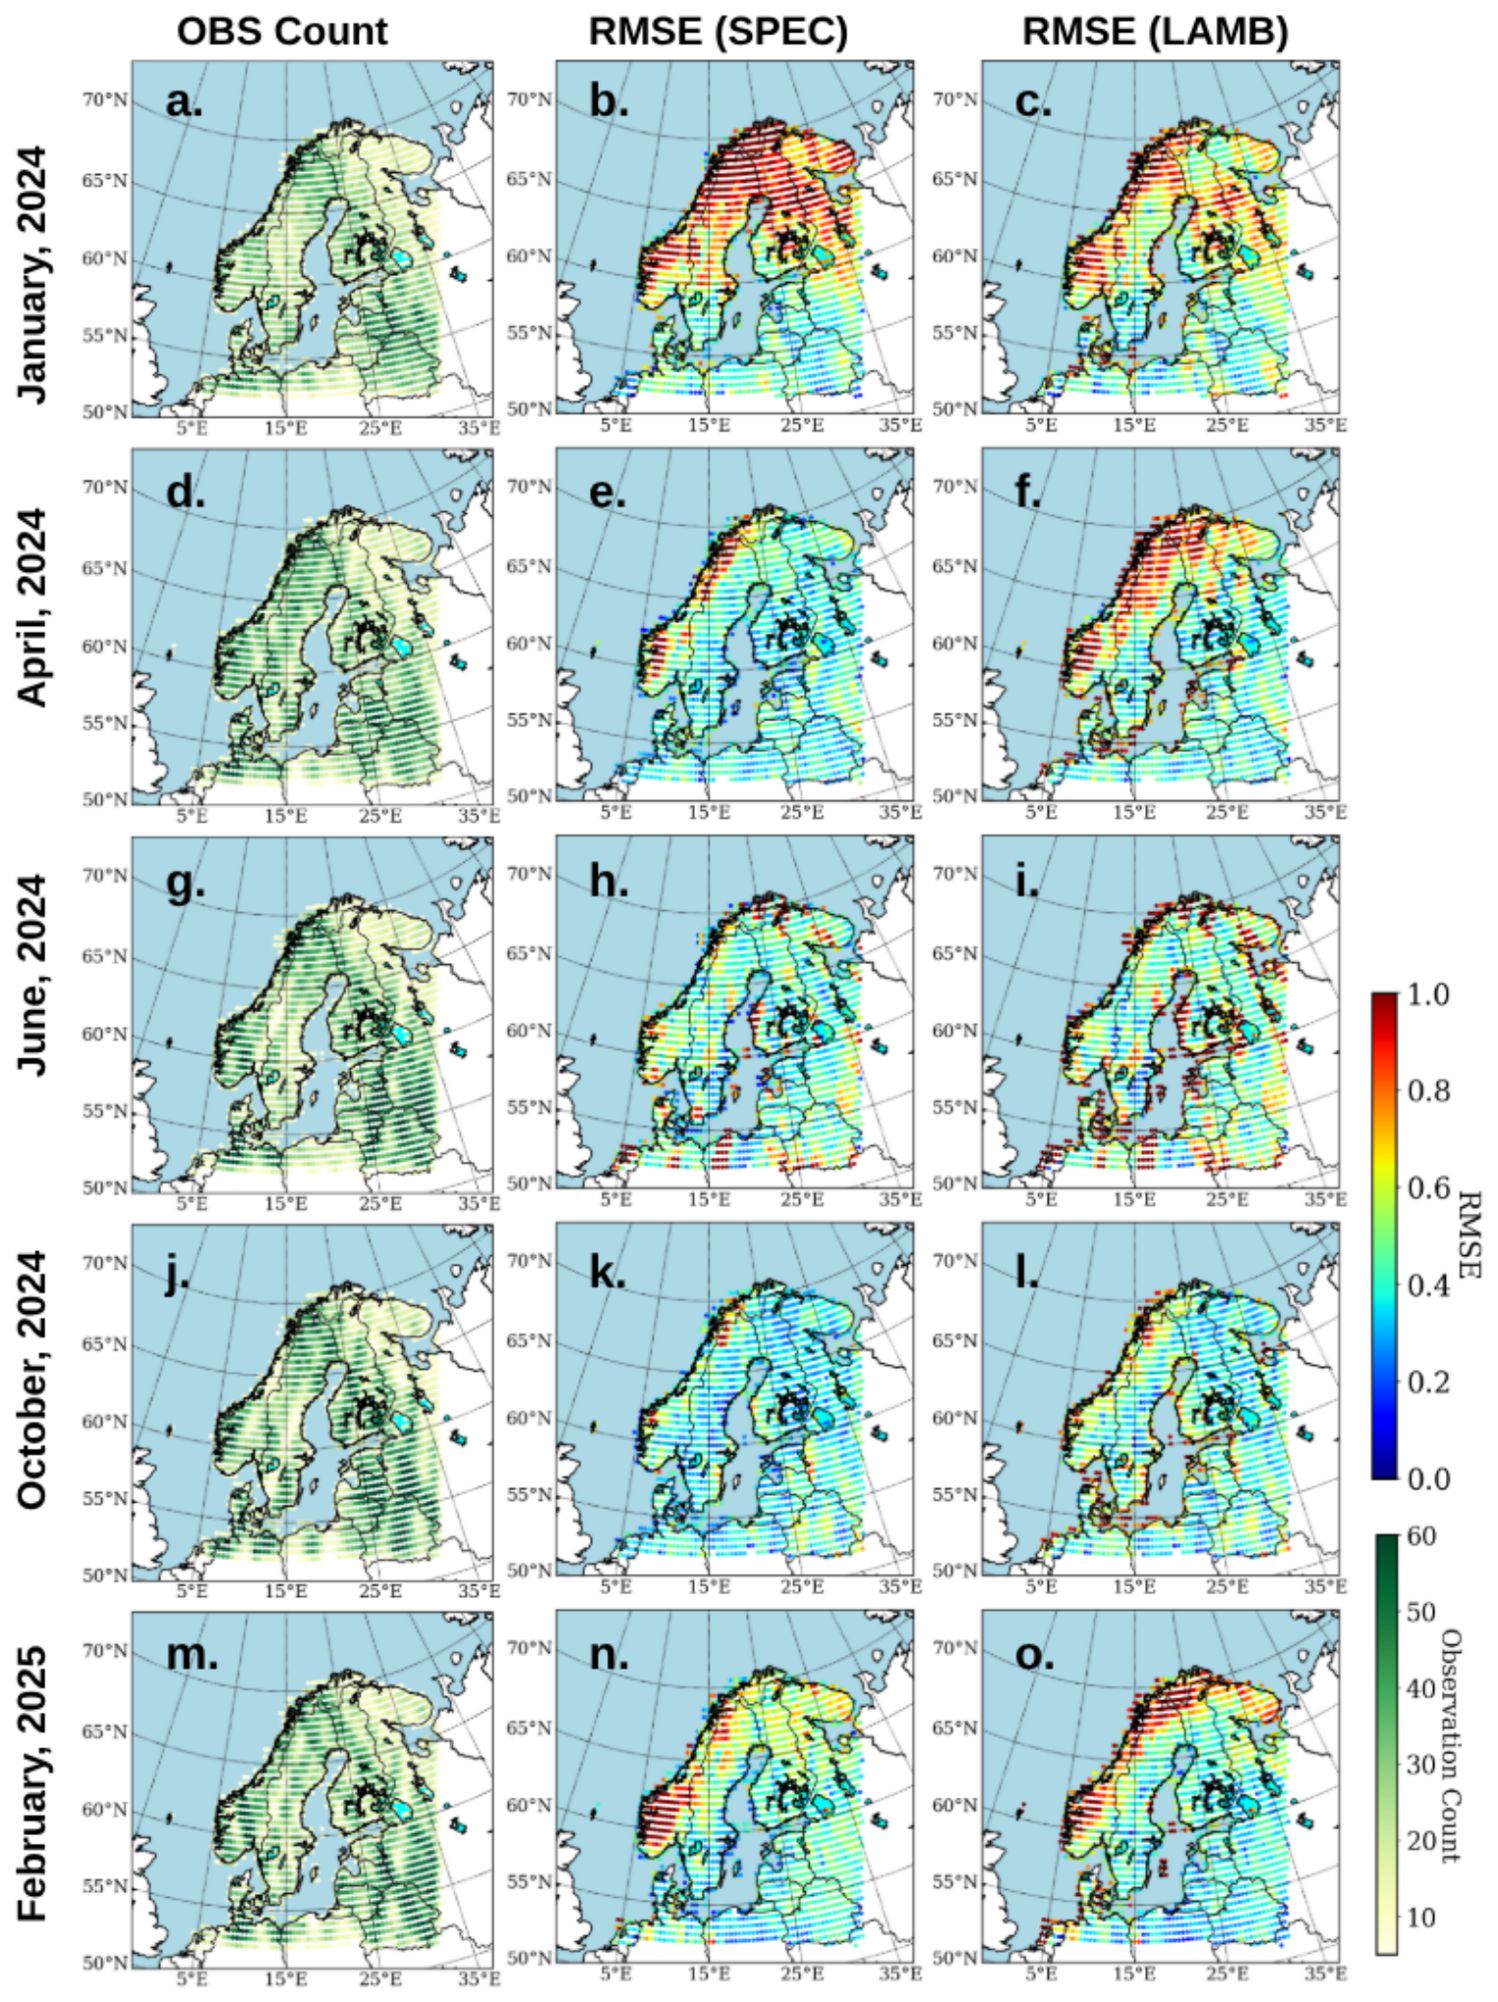
Figure 7.
Mean first-guess departures to observations at AMSU-A channel 4 to 9 (in Kelvin) over land surface from the SPEC and LAMB experiments over the five months. The average values were calculated every 3 hours each day for every month. Cells highlighted in blue indicate enhanced performance of the LAMB experiment during the winter months.
Figure 7.
Mean first-guess departures to observations at AMSU-A channel 4 to 9 (in Kelvin) over land surface from the SPEC and LAMB experiments over the five months. The average values were calculated every 3 hours each day for every month. Cells highlighted in blue indicate enhanced performance of the LAMB experiment during the winter months.
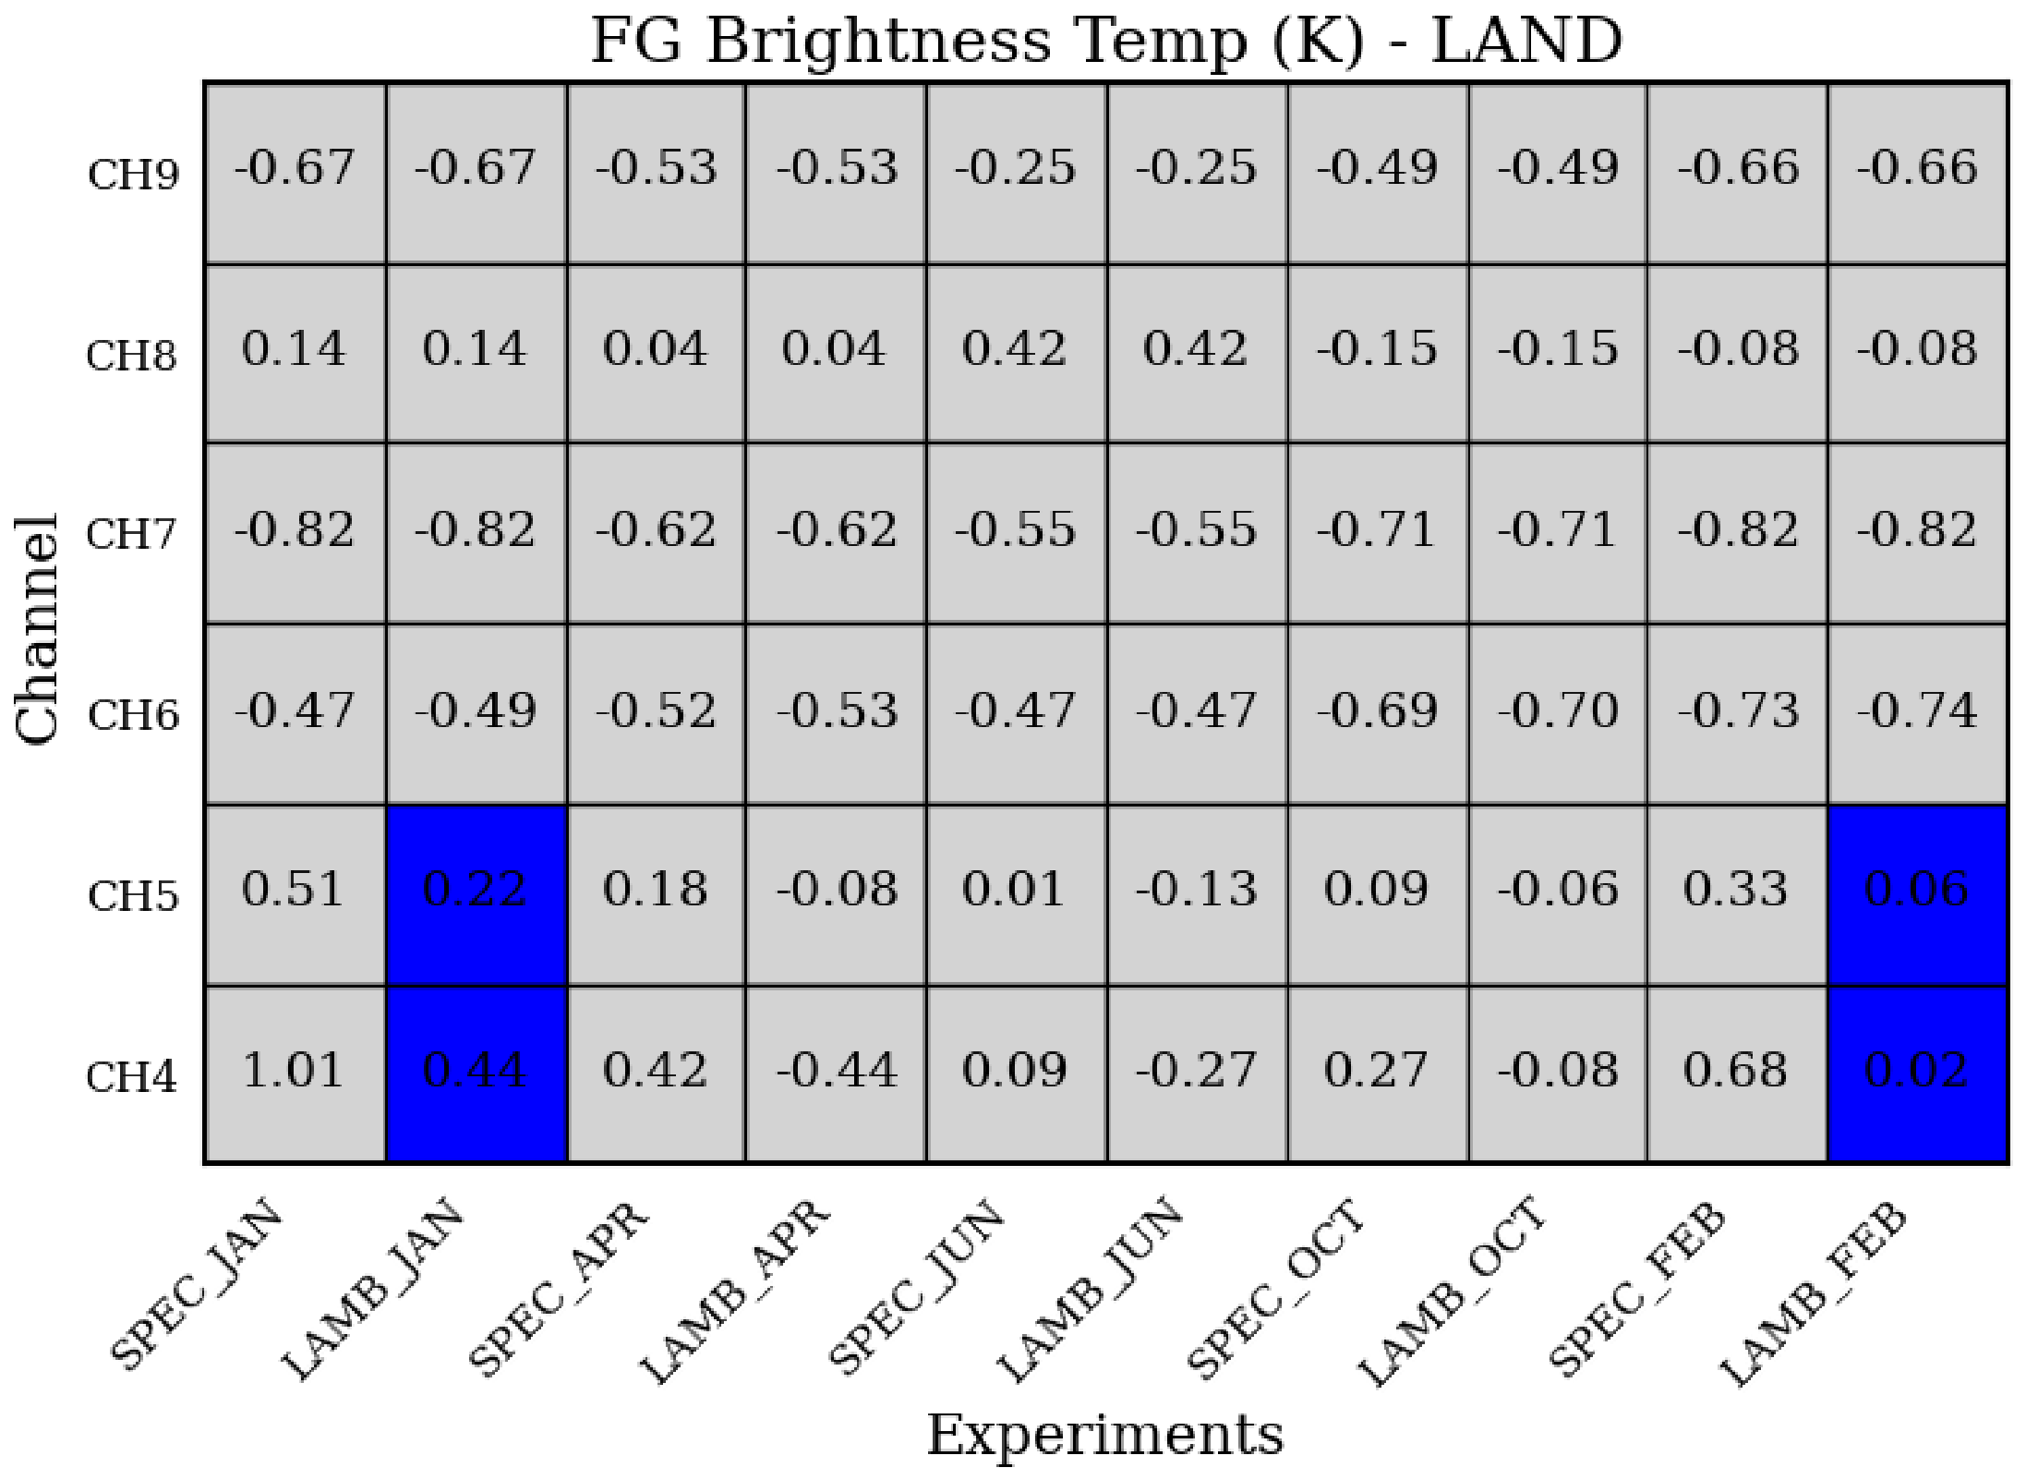
Figure 8.
Distribution of first-guess departures (K) for AMSU-A channel 5 observations using brightness temperature simulations based on the SPEC emissivity formulation (green) and the LAMB approximation (blue). The left column corresponds to regions with 20–40% land cover (coastal areas dominated by sea), while the right column represents regions with 60–80% land cover (coastal areas dominated by land). Results are shown for January 2024 and February 2025. The total number of observations (N), mean departure (Mean), and standard deviation (Std) are provided in each panel.
Figure 8.
Distribution of first-guess departures (K) for AMSU-A channel 5 observations using brightness temperature simulations based on the SPEC emissivity formulation (green) and the LAMB approximation (blue). The left column corresponds to regions with 20–40% land cover (coastal areas dominated by sea), while the right column represents regions with 60–80% land cover (coastal areas dominated by land). Results are shown for January 2024 and February 2025. The total number of observations (N), mean departure (Mean), and standard deviation (Std) are provided in each panel.
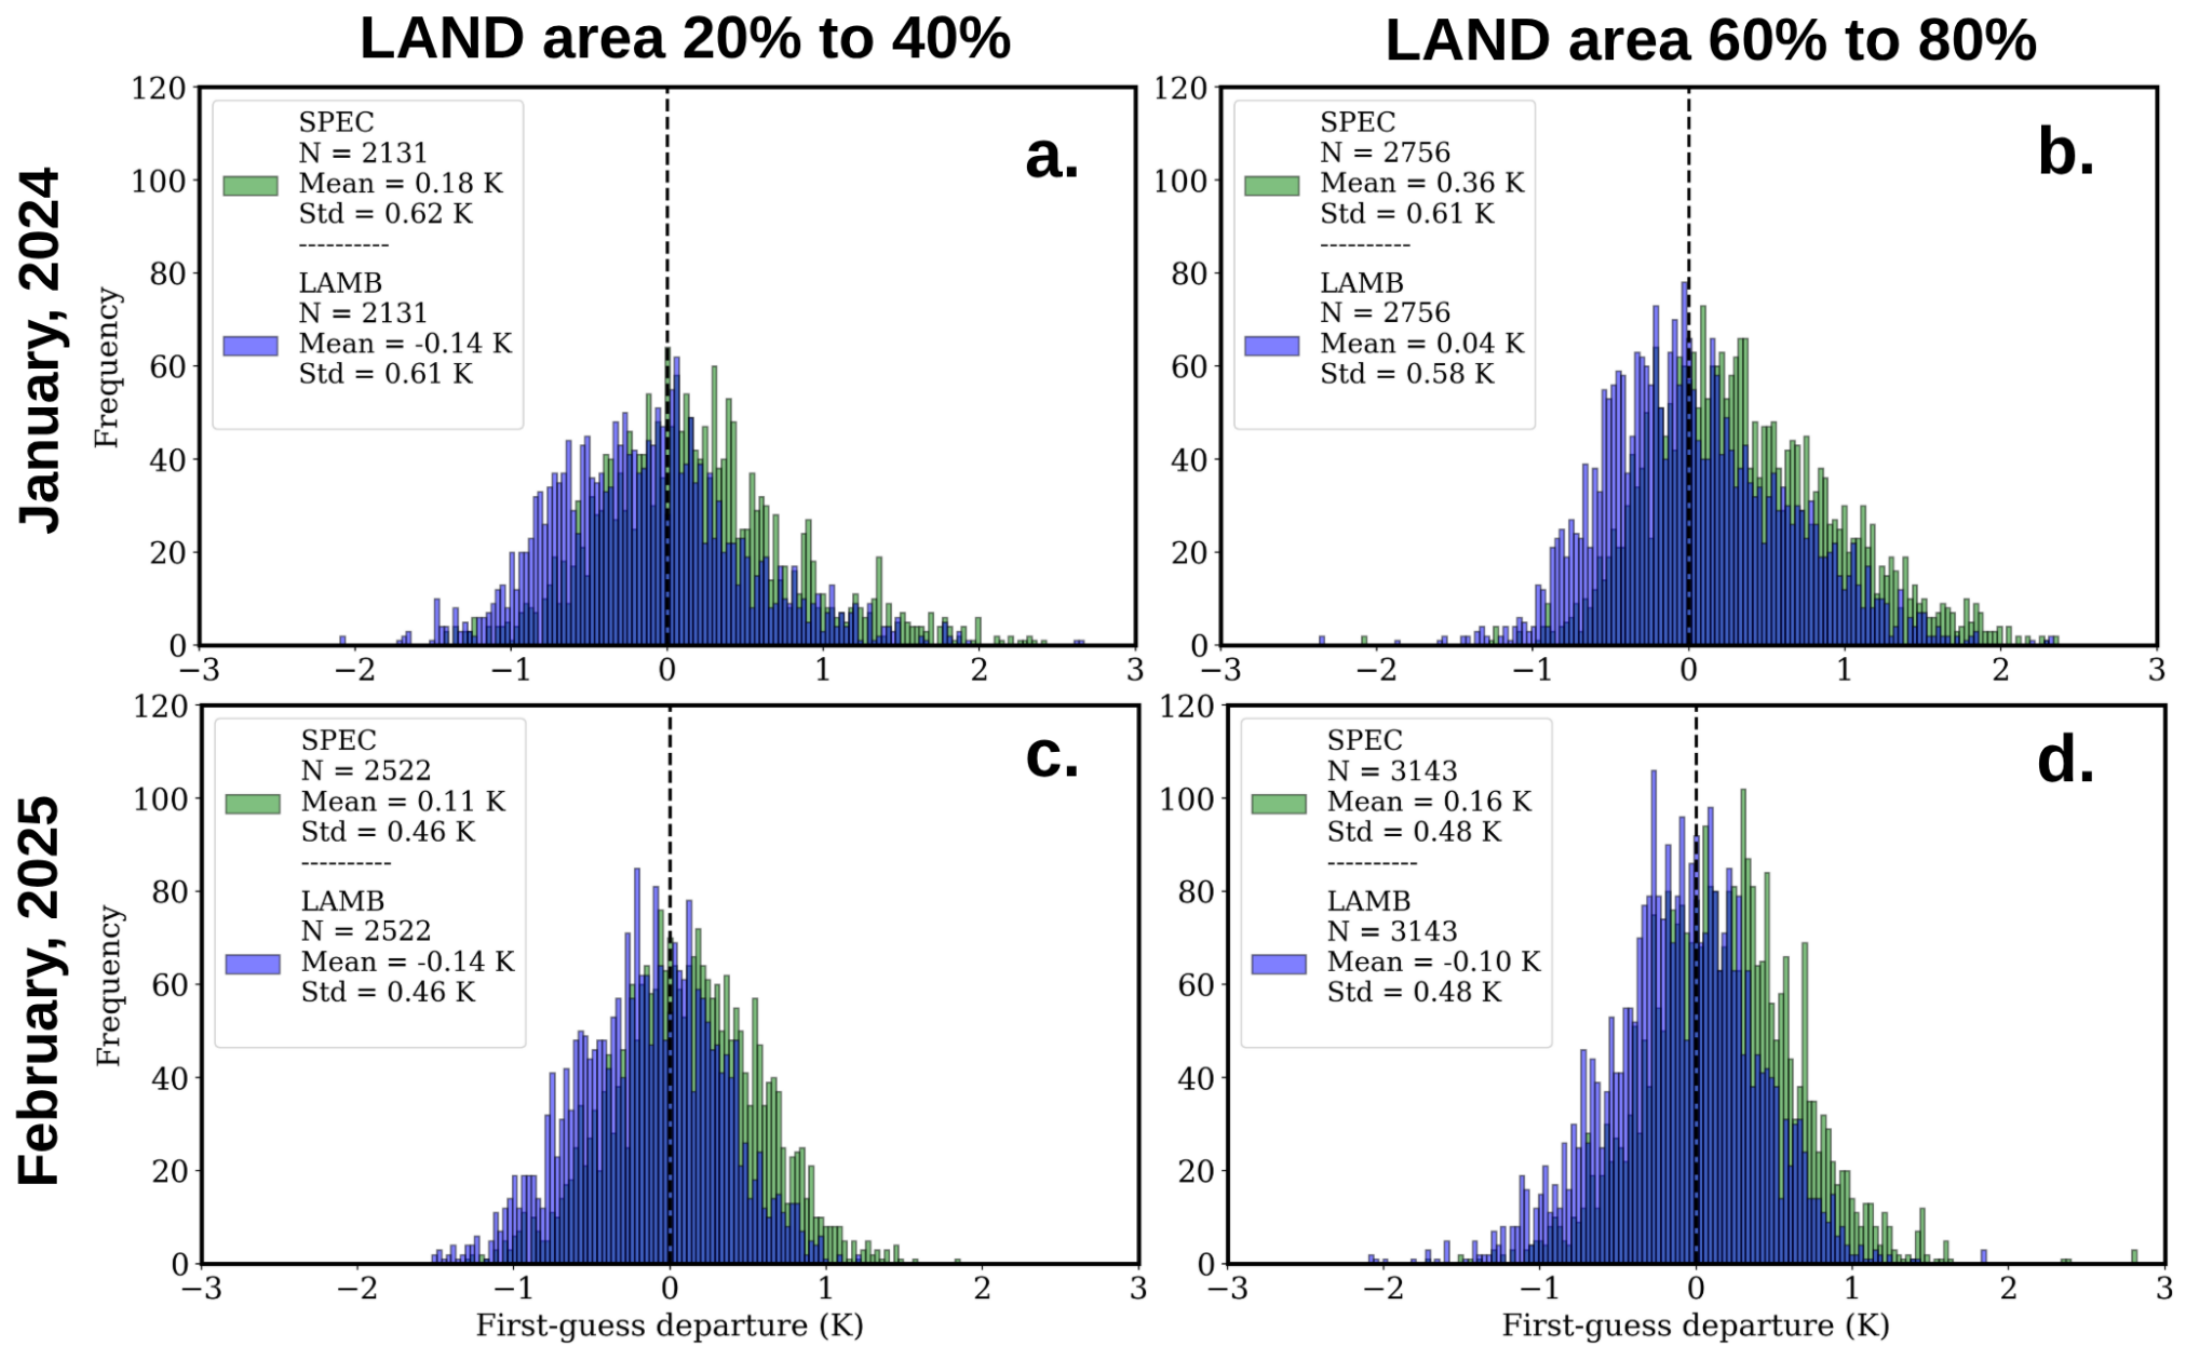
Figure 9.
Spatial distribution, over snow-covered surfaces, of the gridded (0.5x0.5) available MW observation count at the center of the nadir (scan position 15 and 16) and the corresponding RMSE in terms of BT (in Kelvin) of first-guess departures to observations at AMSU-A channel 5, computed using SPEC and LAMB method. of AMSU-A channel 5, and for four different months. Blue color scale corresponds to the observation count and the jet color scale corresponds to the first-guess departure RMSE.
Figure 9.
Spatial distribution, over snow-covered surfaces, of the gridded (0.5x0.5) available MW observation count at the center of the nadir (scan position 15 and 16) and the corresponding RMSE in terms of BT (in Kelvin) of first-guess departures to observations at AMSU-A channel 5, computed using SPEC and LAMB method. of AMSU-A channel 5, and for four different months. Blue color scale corresponds to the observation count and the jet color scale corresponds to the first-guess departure RMSE.
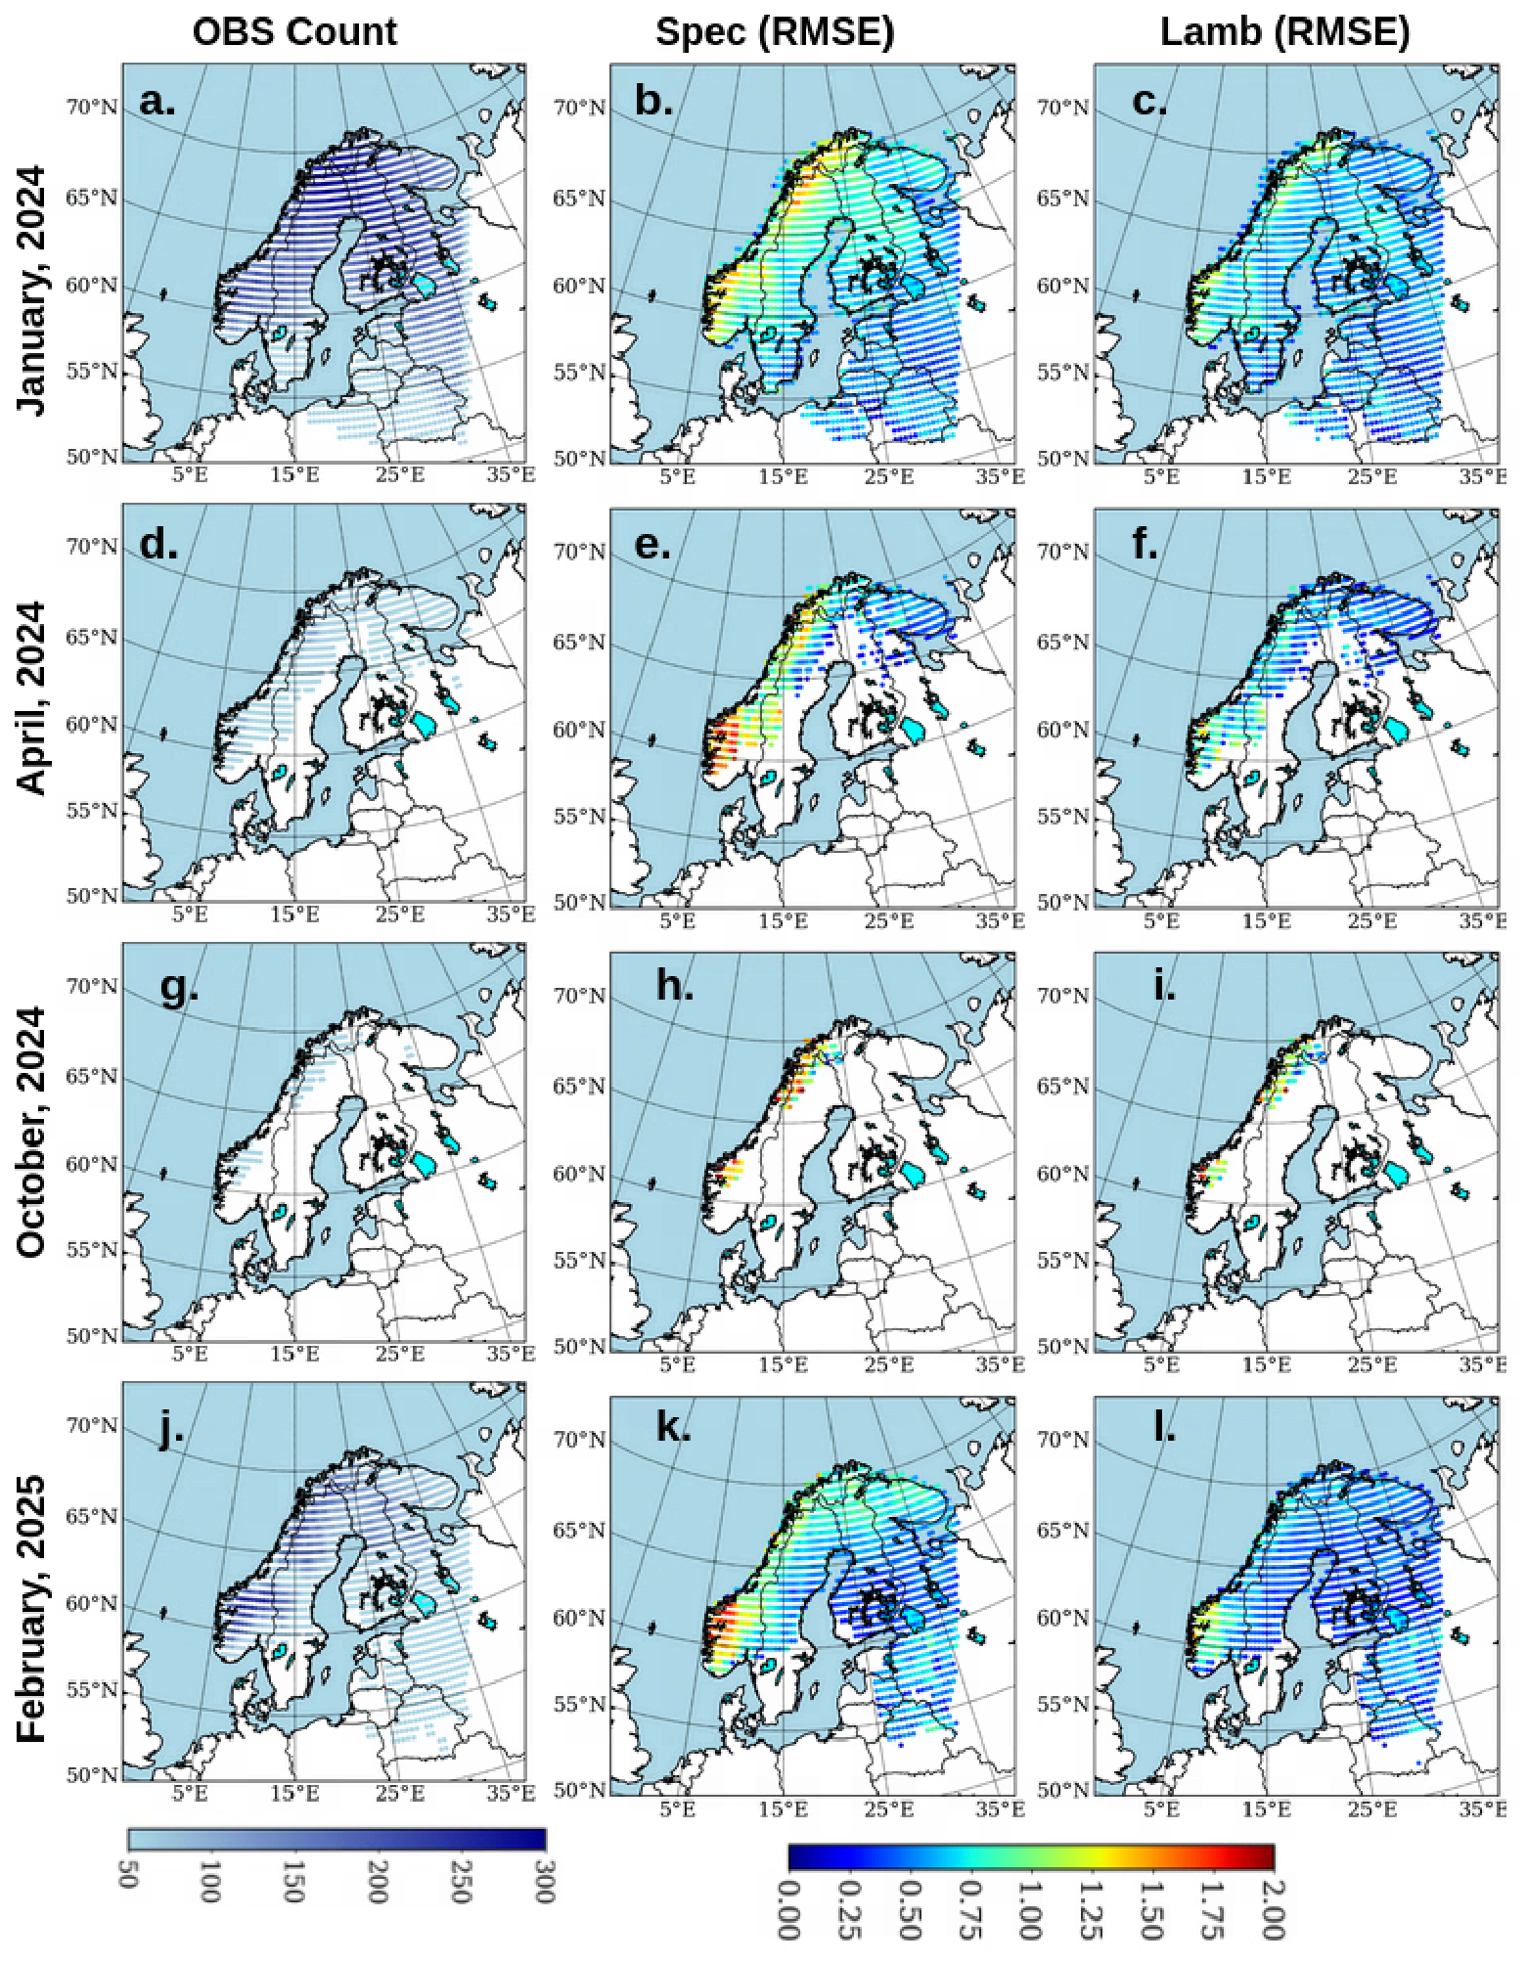
Figure 10.
Histogram of first-guess departures to AMSU-A observations at channels 4, 5, and 6 (measured in Kelvin) over snow-covered surfaces. The distribution is shown for two configurations: BT simulations using the SPEC method (in yellow) and the LAMB approximation (in blue) to retrieve emissivity at channel 3. Data from January and April 2024, as well as February 2025, have been included in this analysis.
Figure 10.
Histogram of first-guess departures to AMSU-A observations at channels 4, 5, and 6 (measured in Kelvin) over snow-covered surfaces. The distribution is shown for two configurations: BT simulations using the SPEC method (in yellow) and the LAMB approximation (in blue) to retrieve emissivity at channel 3. Data from January and April 2024, as well as February 2025, have been included in this analysis.
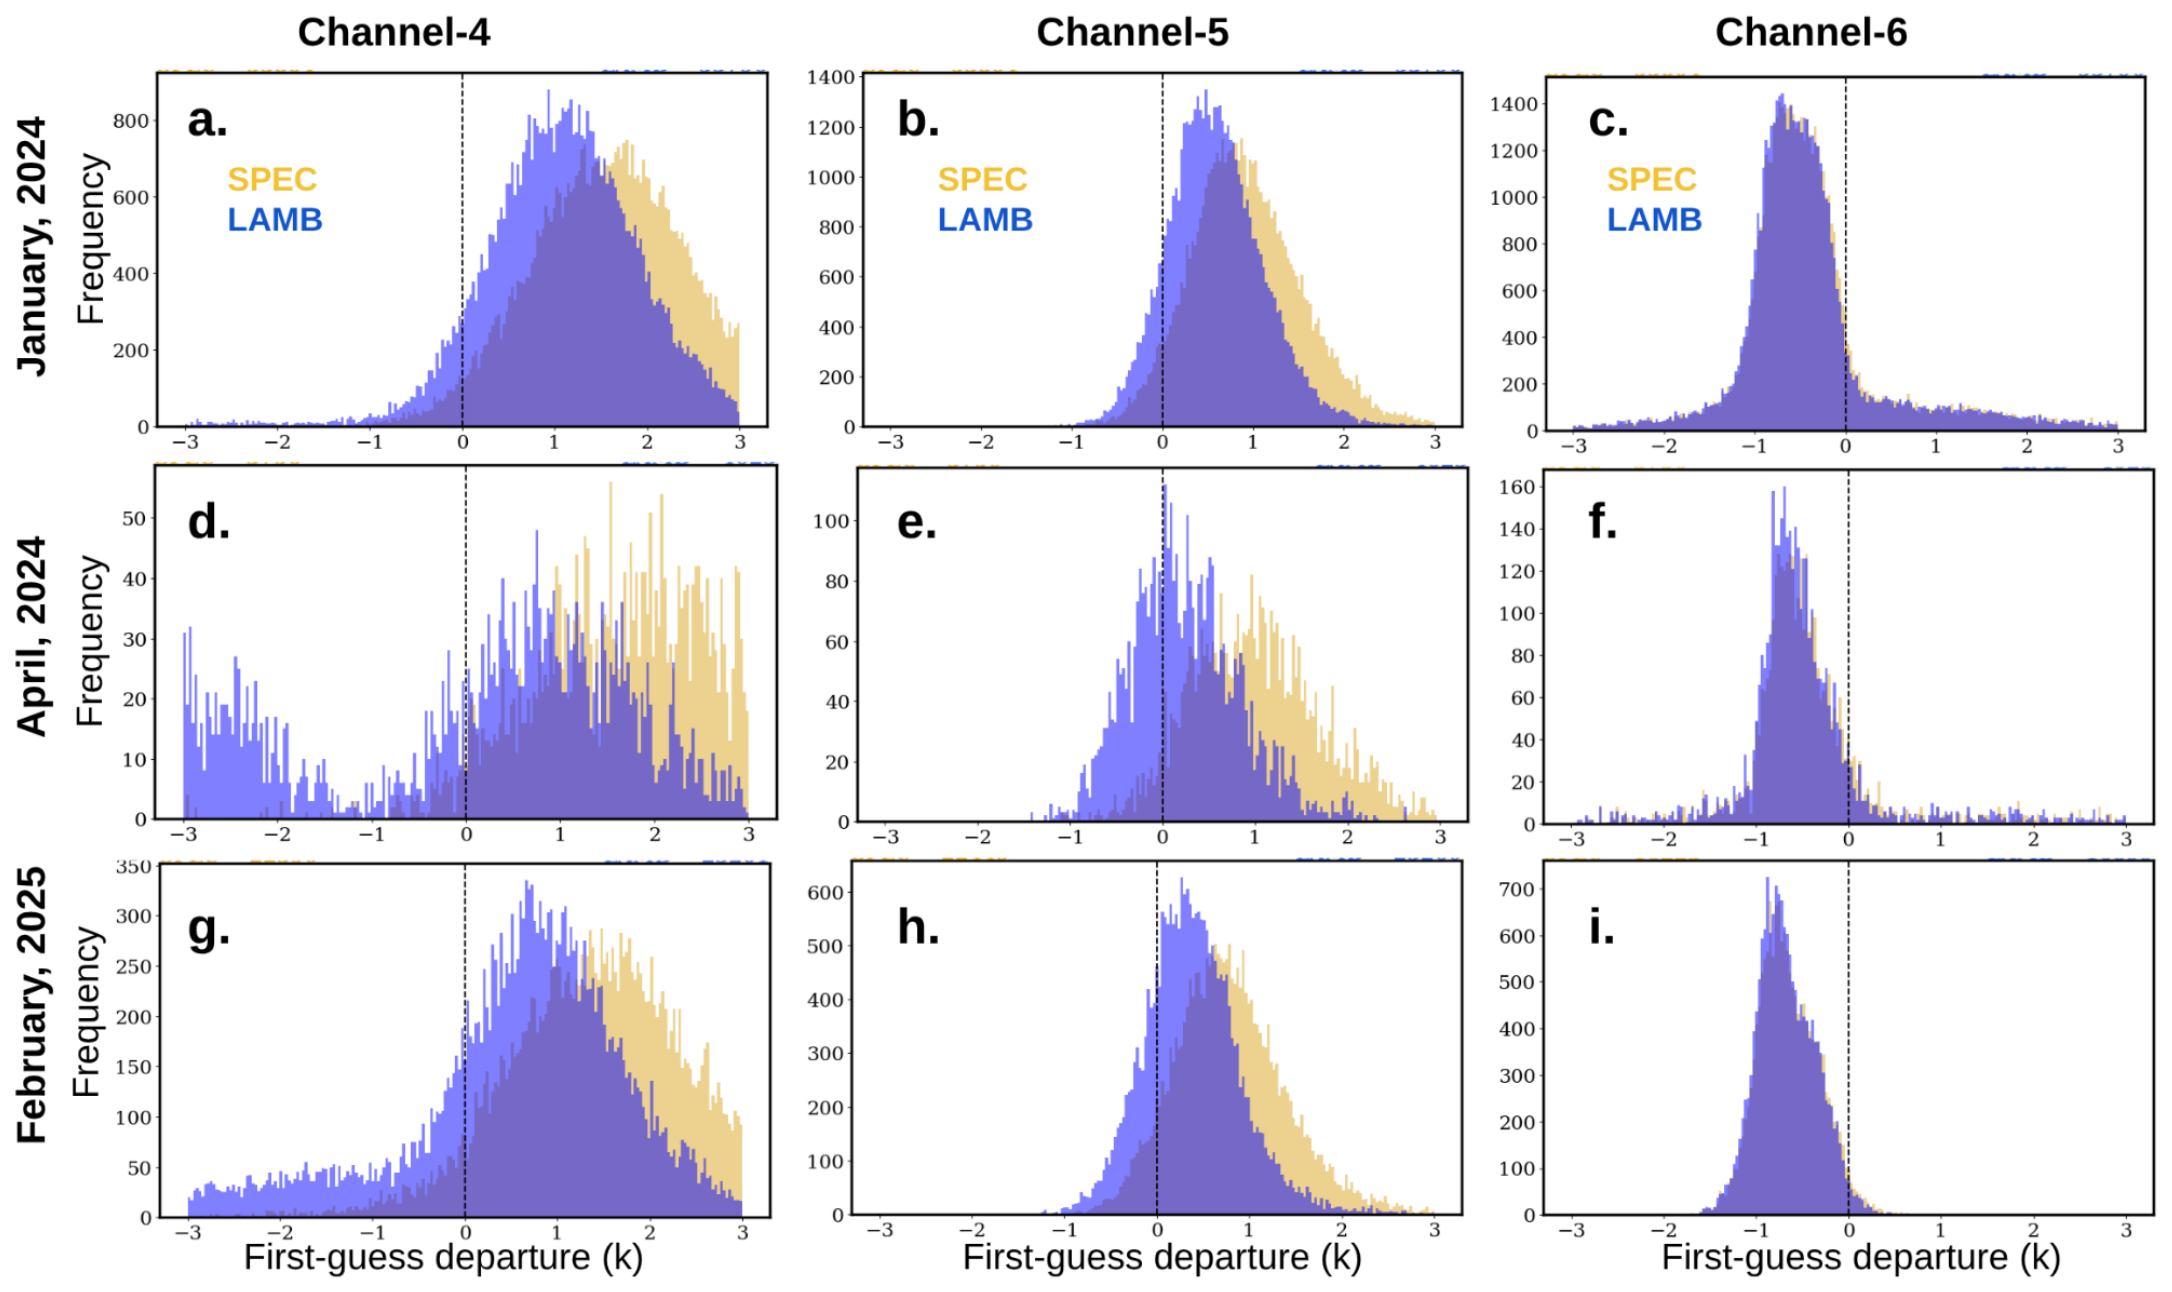

Table 1.
Statistical summary of first-guess departures over snow-covered surfaces for AMSU-A channels 4–5 using the SPEC and LAMB emissivity formulations during January 2024. Shown are the number of observations, spread, variance, 95% confidence intervals of the mean ( and ), and the corresponding Student’s t-test and F-test statistics evaluating differences in mean departures and variability between the two experiments.
Table 1.
Statistical summary of first-guess departures over snow-covered surfaces for AMSU-A channels 4–5 using the SPEC and LAMB emissivity formulations during January 2024. Shown are the number of observations, spread, variance, 95% confidence intervals of the mean ( and ), and the corresponding Student’s t-test and F-test statistics evaluating differences in mean departures and variability between the two experiments.
| Metric | CH4-SPEC | CH4-LAMB | CH5-SPEC | CH5-LAMB |
|---|---|---|---|---|
| Obs Count | 53803 | 53795 | 53803 | 53795 |
| Spread | 0.97 | 0.91 | 0.63 | 0.54 |
| Variance | 0.95 | 0.83 | 0.40 | 0.29 |
| 1.70 | 1.09 | 0.93 | 0.58 | |
| 1.72 | 1.11 | 0.94 | 0.59 | |
| t-test | 105.45 | 105.45 | 96.46 | 96.46 |
| F-test | 1.14 | 1.14 | 1.40 | 1.40 |
Table 2.
Same as Table 1, but for February 2025.
Table 2.
Same as Table 1, but for February 2025.
| Metric | CH4-SPEC | CH4-LAMB | CH5-SPEC | CH5-LAMB |
|---|---|---|---|---|
| Obs Count | 22389 | 23200 | 22448 | 23259 |
| Spread | 1.16 | 1.40 | 0.63 | 0.53 |
| Variance | 1.35 | 1.97 | 0.40 | 0.28 |
| 1.58 | 0.51 | 0.80 | 0.38 | |
| 1.62 | 0.54 | 0.81 | 0.39 | |
| t-test | 89.32 | 89.32 | 76.96 | 76.96 |
| F-test | 0.68 | 0.68 | 1.43 | 1.43 |
Disclaimer/Publisher’s Note: The statements, opinions and data contained in all publications are solely those of the individual author(s) and contributor(s) and not of MDPI and/or the editor(s). MDPI and/or the editor(s) disclaim responsibility for any injury to people or property resulting from any ideas, methods, instructions or products referred to in the content. |
© 2026 by the authors. Licensee MDPI, Basel, Switzerland. This article is an open access article distributed under the terms and conditions of the Creative Commons Attribution (CC BY) license (http://creativecommons.org/licenses/by/4.0/).
Copyright: This open access article is published under a Creative Commons CC BY 4.0 license, which permit the free download, distribution, and reuse, provided that the author and preprint are cited in any reuse.


