

Submitted:
29 June 2026
Posted:
30 June 2026
You are already at the latest version
Abstract
Diffuse large B-cell lymphoma (DLBCL) is an aggressive lymphoma characterized by a diffuse proliferation of large neoplastic B lymphocytes. DLBCL is histologically and clinically heterogeneous. Skeletonization reduces binary objects to 1-pixel wide curved line representations without changing the essential structure of the image. This is useful for feature extraction and represents an object’s topology. This study used the skeletonization function to analyze the topological heterogeneity of DLBCL in a series of 153 patients, including 110 patients with DLBCL and 43 patients with reactive lymphoid tissue. In comparison with reactive tissue, DLBCL was characterized by lower skeletonization: 5665.20 ± 1012.82 vs 6341.16 ± 548.23, respectively (P < 0.001). Within the DLBCL diagnostic category, high skeletonization correlated with poor overall survival (hazard risk = 2.5, P = 0.003). High skeletonization also correlated with higher EBER positivity and lower CD5, E2F1, BCL2, ISY1, and TNFAIP8 protein levels (all P values < 0.05). Gene expression was available in a subset of 30 cases, including 18 cases with high skeletonization and 12 cases with low skeletonization. The analysis showed that 166 immuno-oncology genes were upregulated in the high group and only 8 genes were upregulated in the low skeletonization group. In conclusion, DLBCL is characterized by lower skeletonization than reactive lymphoid tissue. In DLBCL, high skeletonization is associated with poor prognosis and enrichment of immuno-oncology markers.
Keywords:
diffuse large B-cell lymphoma
; lymphoma
; large B-cell
; diffuse
; computer vision
; skeletonization
; prognosis
; gene expression
; immune-oncology
1. Introduction
Diffuse large B-cell lymphoma (DLBCL) is one of the most frequent lymphomas, accounting for approximately 25% of non-Hodgkin lymphomas [1].
DLBCL usually presents as a symptomatic lymph node enlargement in the neck or truck, but extranodal involment is also possible. In 30% of the cases, the patients manifest fever, night sweats, or weight loss, known as “B” symptoms [1]. The incidence of DLBCL is around 3-7 cases per 100,000 persons per year [2].
At presentation, in around 60% of the patients, the disease presents as advanced stage III-IV and elevated lactate dehydrogenase (LDH) in serum. Bone marrow is infiltrated in up to 30% of the cases. In the case of nodal DLBCL, secondary involvement of other organs such as the liver, kidney, lung, bone marrow, and central nervous system can occur [3,4,5,6].
From a histopathological point of view, DLBCL is characterized by a diffuse proliferation of large transformed B lymphocytes with prominent nucleoli and basophilic cytoplasm with abundant proliferation. The neoplastic lymphocytes resemble centroblasts or immunoblasts, and other morphologies, such as anaplastic, multinucleated, clear cells, epithelioid, and spindle cell shapes can be found [6,7,8,9,10,11].
At diagnosis, immunohistochemistry and/or flow cytometry are used to determine the immunophenotype at the protein level, which include B-cell markers (CD20, CD79a), CD10, BCL6, MUM1 (IRF4) for assessing the cell-of-origin Hans’classification, and BCL2, Ki67, MYC, CD5, and p53 for evaluating the proliferation status and prognostication [12,13,14,15,16,17,18,19]. Both the immunophenotype and cytological morphologies are useful in DLBCL diagnosis and prognosis [20].
Cytogenetic features are also analyzed despite no typical or diagnostic change. MYC, BCL2, and BCL6 gene rearrangements are routinely used to subclassify DLBCL into the DLBCL/high-grade B-cell lymphoma categories associated with a more aggressive clinical evolution [21,22,23,24,25,26,27,28,29,30].
The prediction of DLBCL prognosis using artificial intelligence and digital pathology has gained interest recently. For example, Jeong Honn Lee et al. recently retrospectively collected 251 slide images and performed deep learning and multi-modal prediction with contrastive learning and feature extraction that provided a performance with an area under the curve of 0.8 in the ROC analysis [31]. Other recent works include the work of Vrabac D et al. [32], Li Z. et al. [33], and Ma D. et al. [34] that also focused on the evaluation of histological images. However, the focus on topological features is less studied.
This study analyzed the topological characteristics of DLBCL using hematoxylin and eosin slides in a series of 153 patients, including 110 patients with DLBCL and 43 patients with reactive lymphoid tissue. The study found that DLBCL was characterized by lower skeletonization than reactive lymphoid tissue. In DLBCL, high skeletonization is associated with poor prognosis and enrichment of immuno-oncology markers.
2. Materials and Methods
2.1. Patients and Samples
A series of 153 patients were selected from the Department of Pathology, Tokai University, School of Medicine. The series included 110 cases of diffuse large B-cell lymphoma and 43 cases of reactive lymphoid tissue and reactive tonsils. The cases were diagnosed according to the current lymphoma classification [3,35,36,37,38,39]. The diagnosis was based on the clinicopathological characteristics of the patients, including the evaluation of the hematoxylin and eosin (H&E) stainings, immunophenotype, and molecular pathology data when required [37,38].
This study was conducted according to the guidelines of the Declaration of Helsinki and the World Medical Association for medical experimentation version 24. This study was approved by the Tokai University ethical committee (Institutional Review Board, IRB20/156).
2.2. Skeletonization and Area Measurement
Skeletonization reduces binary objects to 1 pixel-wide representations. The skeletonization technique is useful for feature extraction and represents an object (image)’s topology.
DLBCL images were transformed from hematoxylin and eosin (H&E) to a skeletonized image. H&E had previously been stained using an automated slide stainer (Tissue-Tek Prisma Plus, Sakura Finetek Japan Co., Ltd., Tokyo, Japan) as previously described [40]. H&E images were digitalized using a digital slide scanner and whole slide imaging system (NanoZoomer S360, #C13220-01, Hamamatsu Photonics K.K., Hamamatsu, Japan) and visualized using NDP.view2 image viewing software (#U12388-01, Hamamatsu Photonics K.K.). From each case, digitalized jpeg images were exported at 200x magnification and 150 dpi. For better image processing and performance, each image was split into image patches of 224× 224× 3 resolution using PhotoScape v3.7 (http://photoscape.org/; last accessed on June 20, 2026).
The skeletonization process extracted the centerline of an object while preserving the topology and Euler number (also known as the Euler characteristic). The process was initiated on grayscale image patches. The object of interest were dark threads against a light background. Skeletonization required a binary image with white foreground (1) and black background (0) pixels. The complement of the original grayscale image was used. Then, the image was binarized, and skeletonization was performed. In this study, pruning was not performed. Finally, the area of the skeleton was measured for each image patch.
When required only for visualization, the skeleton was overlayed on the original image, and small spurs that appeared on the skeleton were pruned.
2.3. Computer Code
Computer vision analysis was performed using Matlab (R2026a Update 3 (26.1.0.3276743), May 27 2026). This study used the ‘bwskel’ function. Morphological operations on binary images using ‘bwmorph’ were also tested, such as the ‘skel’ function that created comparable skeleton images as the ‘bwskel’ function. However, this study finally used the ‘bwskel’ function for the final analysis. The skeletonization codes for one image and a folder with multiple images are shown in Table 1. In this study, small spurs were not pruned.
2.4. Immunohistochemistry
Immunophenotype was performed using conventional immunohistochemical techniques using a Leica Bond Max II automated immunohistochemistry stainer following the manufacturer’s instructions (Leica Biosystems K.K., Tokyo, Japan). Immunohistochemistry reagents included Bond Dewax solution (#AR0084), Bond epitope retrieval solution 2 (#AR0087), primary antibody diluent (#AR9352), and Bond polymer refine detection kit (#DS9800). Slides were mounted using a fully automated glass coverslipper (Leica CV5030, Leica Biosystems).
All primary antibodies were purchased from Novocastra (Leica Biosystems), including CD20 (clone L26, #CD20-L26-L-CE), CD79a (clone JCB117, #CD79A-599-L-CE), CD3 (clone LN10, #CD3-565-L-CE), CD5 (clone 4C7, #CD5-4C7-L-CE), BCL2 (#BCL-2-L-CE), Ki67 (clone K2, ACK02), and MYC (anti-c-Myc antibody [Y69], ab32072, Abcam K.K., Tokyo, Japan).
The cell of origin characterization using the Hans’ algorithm [12] used the combination of CD10 (clone 56C6, #CD10-270-L-CE), BCL6 (clone LN22, # BCL-6-564-L), and MUM1 (clone EAU32, #MUM1-L); more than 30% of positivity by neoplastic B lymphocytes was considered positive for calculating Hans’ algorithm.
Immune microenvironment images were retrieved from our previous publications [41,42,43,44], and immunohistochemistry was reanalyzed. The primary antibodies that targeted the immune microenvironment, immune checkpoint and cell cycle were the following: Ki67 (Cell proliferation, clone MM1, Novocastra, Leica), IL10 ( Immuno-oncology, #LS-B7432, Lifespan Bioscience), PD-L1 (CD274) (Immuno-oncology, clone E1J2, Cell Signaling), CSF1R (Immuno-oncology, clone FER216, CNIO), CD163 (Tumor-associated macrophages, clone 10D6, Novocastra, Leica), CASP8 (Active subunit p18, clone 11B6, Novocastra), TNFAIP8 (Apoptosis, #14559-MM0, Sino Biological), LMO2 ( Hematopoietic development, clone 299B, CNIO), MYC (Proto-oncogene, clone Y69, Abcam), MDM2 (Proto-oncogene, IF2, Invitrogen), CDK6 (Cell cycle, clone 98D, CNIO), E2F1 (Cell cycle, clone Agro368V, CNIO), and TP53 (Cell regulation, DO-7, Novocastra, Leica).
2.5. In Situ Hybridization
Characterization of the gene rearrangement and translocation status was performed using DNA fluorescent in situ hybridization (FISH) break-apart probes targeting MYC, BCL2, and BCL6 genes (Vysis, Abbott Japan Co., Ltd., Tokyo, Japan).
RNA in situ hybridization to detect infection by Epstein–Barr virus (EBV)-targeted Epstein Barr virus encoded RNA (EBER) using Bond in situ hybridization probes (#PB0589, Leica Biosystems).
2.6. Gene Expression
RNA was extracted from formalin-fixed paraffin-embedded (FFPE) tissue sections of 10 micrometer thickness using the RNeasy FFPE Kit (50) (#73504, Qiagen). Before RNA extraction, the histology was revised, and cases with at least 80% of neoplastic areas were selected. After quality control, the RNA was used to quantify gene expression levels using the nCounter® PanCancer Profiling Panel (Bruker Spatial Biology, Bruker Corporation). The tissue sections were outsourced to Celgene Corporation (New Jersey, USA) for this analysis. This panel included 730 immune-oncology genes and 40 housekeeping genes. The analysis was the standard, including the calculation of log2 fold change and -log10 P values to create a volcano plot and later the heatmap, and hierarchical clustering using the one minus pearson correlation and average linkage method.
2.7. Statistical Analysis
Comparison between groups used nonparametric tests, including Mann–Whitney U test for 2-independent samples test and Kruskal-Wallis H test for several (≥3) independent samples. Crosstabulation was used to correlate qualitative variables with the Pearson chi-square test and Fisher’s exact test. Overall survival was calculated from the time of diagnosis and biopsy to the date of death or last follow-up using the Kaplan–Meier and log-rank tests. A p-value of less than 0.05 was considered statistically significant.
3. Results
3.1. Evaluation of Skeletonization in Test Images
Skeletonization reduces binary objects to 1 pixel-wide representations. The skeletoniza-tion technique is useful for feature extraction and represents an object (image)’s topology. Skeletonization area measurement was tested on a set of 8 images to evaluate the usefulness of the ‘bwskel’ function. The area values from images 1-8 were as follows: 0, 40, 100, 215, 526, 857, 1786, and 2603, respectively. Therefore, the function was measured correctly (Figure 1).
3.2. Evaluation of the Skeletonization Area in DLBCL
3.2.1. Difference Between DLBCL and Reactive Lymphoid Tissue
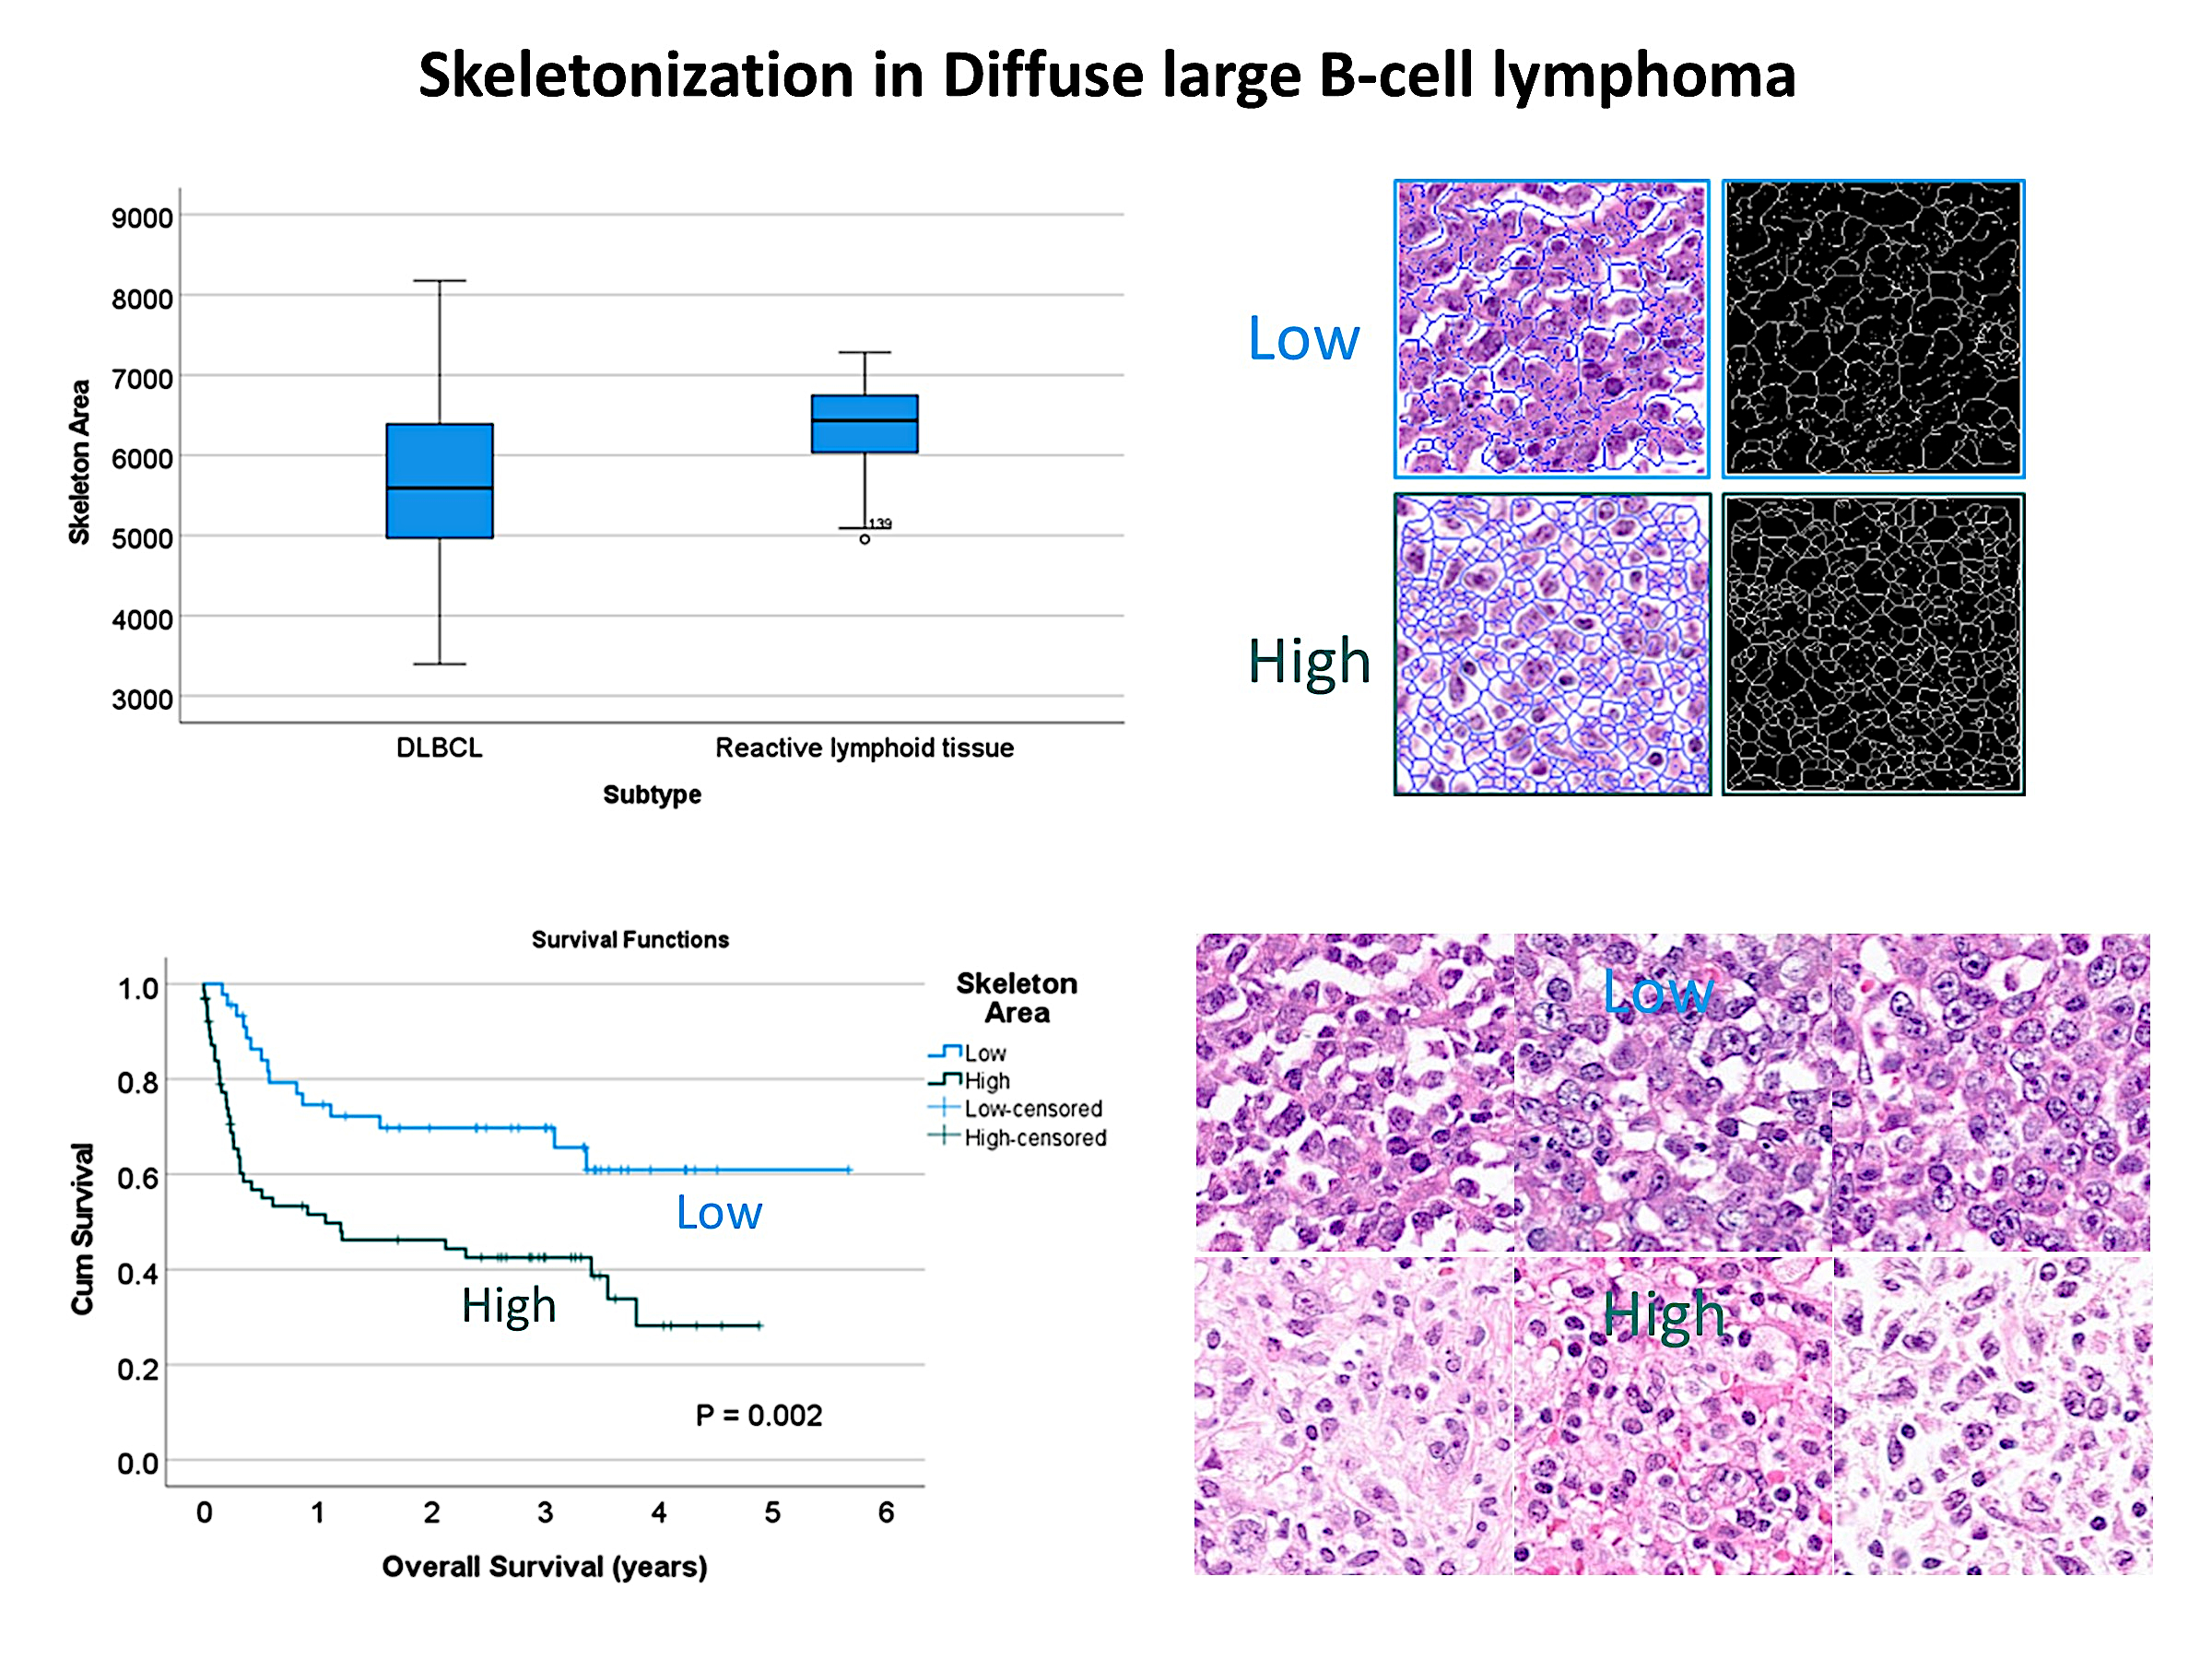
The skeletonization technique is useful for feature extraction and represents an object’s topology. The DLBCL skeleton area ranged from 3396.12 to 8176.94, with a mean of 5665.20 ± 1012.82 and median of 5591.65. In comparison to reactive lymphoid tissue, DLBCL was characterized by lower skeletonization area, 5665.20 ± 1012.82 vs 6341.16 ± 548.23 respectively (p < 0.001) (Figure 2).
3.2.2. Correlation Between Skeletonization and Overall Survival of the DLBCL Patients
The skeletonization area correlated with the overall survival of patients with DLBCL and the cases were classified into 2 groups: low skeletonization (45/110, 40.9%) and high skeletonization (65/110, 59.1%). Overall survival analysis using the Kaplan-Meier and log rank test showed that high skeletonizaton cases were associated with worse overall survival than cases with low skeletonization (log rank (Mantel-Cox) P value = 0.002). High skeletonization patients had a hazard risk of 2.484 (95% CI for Exp(B) = 1.362–4.531) (P = 0.003) (Figure 3).
3.2.3. Correlation Between Skeletonization and Clinicopathological Features of DLBCL Patients
The skeletonization was correlated with several clinical and pathological variables. High skeletonization correacted with higher EBER positivity (P < 0.001), lower CD5 positivity (P = 0.006), lower E2F1 percentage (P < 0.001), lower BCL2 percentage (P = 0.010), lower ISY1 percentage (P = 0.012), and lower TNFAIP8 (P = 0.014) (Table 2, Table 3 and Table 4 and Figure 9).
3.2.4. Gene Expression Analysis
Gene expression analysis using a pan-cancer immuno-oncology panel of 730 genes was available in a subset of 30 cases, including 18 cases with high skeletonization and 12 of low skeletonization. Conventional biostatistics was performed, including the calculation of differentially expressed P value and fold change. The analysis showed that 166 immuno-oncology genes were upregulated in the high skeletonization group and 8 genes upregulated in the low skeletonization group.
The first 10 most significant in the high skeletonization group were C4BPA (complement), MUC1 (CD molecules), IL13RA1 (chemokines, T-cell functions), RRAD (cell functions), CXCL1 (chemokine, regulation), PLAUR (CD molecule), IL22 (anti-inflammatory cytokine), TLR3 (innate immune response, Toll-like receptor), and PVR (regulation of immune response)
The 8 genes upregulated in the low skeletonization group were BLNK (humoral immune response), TNFRSF13B (TNF superfamily), CD3EAP (adaptive immune response), ILF3 (chemokine), CD1C (T-cell function), CD37 (adaptive immune response), POU2F2 (humoral immune response), and TLR9 (innate immune response, toll-like receptor) (Figure 10).
4. Discussion
DLBCL is the most common histological subtype of non-Hodgkin lymphoma (NHL) and accounts for approximately 35 of NHL [2,3,9]. The molecular pathogenesis is complex and a multistep process initially initiated by the neoplastic transformation of germinal center or post-germinal B lymphocytes. Most of the steps of neoplastic transformation are still unknown. One of the most known oncogenic events is the rearrangement of MYC, BCL2, and BCL6 genes. This study included the study of rearrangements in most of the cases. However, the rearrangement status did not correlate with skeletonization.
The diagnostic category of DLBCL was previously used to describe a group of lymphomas with heterogeneous morphology, genetics, and biological behavior. There are several distinct large B-cell lymphoma variants, including primary mediastinal large B-cell lymphoma (PMBL), T-cell-rich large B-cell lymphoma, intravascular large B-cell lymphoma, lymphomatoid granulomatosis, Epstein-Barr virus (EBV) positive DLBCL, DLBCL associated with chronic inflammation, fibrin-associated large B-cell lymphoma, primary large B-cell lymphoma of immune-privileged sites (central nervous system, vitreoretinal, and testis), fluid overload-associated large B-cell lymphoma, DLBCL associated with IRF4 rearrangements, and ALK-positive large B-cell lymphoma. This study of 110 cases of DLBCL did not differentiate with all these subtypes but used the DLBCL “not-otherwise specified” (NOS) diagnostic category, and the DLBCL cases were classified according to their primary site as nodal (plus spleen), Waldeyer’s ring, gastrointestinal, and other extranodal. When correlation was made with the skeletonization level, no differences were found. However, skelotonization correlated with the presence of Epstein–Barr virus (EBV): lows, 4/44 (9.1%) vs high 24/64 (37.5%) (P< 0.001). Therefore, our data indicate that in a subset of cases with virus infection, the level of skeletonization (understood as heterogeneity as well) depends on pathogenic mechanisms associated with EBV. Notwithstanding, 72.5% of high skeletonization cases was not associated with EBV. Therefore, other mechanisms may be associated.
Gene expression has been extensively studied in DLBCL and led to the identification of three main types: germinal center B-cell-like (GCB), activated B-cell-like (ABC), and not-otherwise-specified type 3 [45,46,47]. In this study, we used the surrogate immunohistochemical-based cell-of-origin classification of Hans that differentiates 2 groups, GCB and non-GCB. The non-GCB DLBCL is associated with poor prognosis [12,13,48]. We speculated that the high skeletonization group associated with poor prognosis would also correlate with non-GCB subtype. Nevertheless, that was not the case. Other factors may be associated with the histological subtype.
We correlated skeletonization level with other markers of the immune microenvironment and cell cycle and found that high skeletonization also correlated with lower CD5, E2F1, BCL2, ISY1, and TNFAIP8 protein levels (all P values < 0.05). We previously described that high immunohistochemical expression of TNFAIP8 is associated with poor prognosis in DLBCL [49]. To deepen the pathological background of high skeletonization and its association with the prognosis of the DLBCL patients, we performed gene expression analysis using a pan cancer immune profiling panel. We found that 166 immuno-oncology genes were upregulated in the high group and only 8 genes were up-regulated in the low skeletonization group. Therefore, the high skeletonization enriches immuno-oncology markers. This association is important as immunotherapy in DLBCL has gained interest recently [50,51,52,53].
5. Limitations
This study has the limitation of the number of cases. Larger series of cases will be needed to confirm our findings.
6. Conclusions
DLBCL is characterized by lower skeletonization than reactive lymphoid tissue. In DLBCL, high skeletonization is associated with poor prognosis and enrichment of immuno-oncology markers.
Funding
This research was funded by Ministry of Education, Culture, Sports, Science and Technology (MEXT), Grants-in-Aid for Scientific Research, KAKENHI, JSPS grant number 23K06454, 23K06454, and 15K19061.
Institutional Review Board Statement
The study was conducted in accordance with the Declaration of Helsinki, and approved by the Institutional Review Board (or Ethics Committee) of TOKAI UNIVERSITY, SCHOOL OF MEDICINE (protocol code IRB20/156 and date of approval 2026-04-01).
Informed Consent Statement
Informed consent was obtained from all subjects involved in the study.
Data Availability Statement
Data is available in this article and supplementary data and upon request to Joaquim Carreras (joaquim.carreras@tokai.ac.jp).
Acknowledgments
N/A
Conflicts of Interest
The authors declare no conflicts of interest.
Abbreviations
The following abbreviations are used in this manuscript:
| DLBCL | Diffuse large B-cell lymphoma |
| H&E | Hematoxylin and eosin |
References
- Caster, J.C.; Herrera, A.F.; Lister, A.; Winter, J.N.; Rosmarin, A.G. Diffuse large B cell lymphoma and other large B cell lymphomas: Presentation, diagnosis, and classification. UpToDate. May 2026. Available online: www.uptodate.com (accessed on 23 June 2026).
- National Cancer Institute. Surveillance, Epidemiology, and End Results Program. Cancer Stat Facts: NHL - Diffuse Large B-Cell Lymphoma (DLBCL). Available online: https://seer.cancer.gov/statfacts/html/dlbcl.html (accessed on 23 June 2026).
- Campo, E.; Jaffe, E.S.; Cook, J.R.; Quintanilla-Martinez, L.; Swerdlow, S.H.; Anderson, K.C.; Brousset, P.; Cerroni, L.; de Leval, L.; Dirnhofer, S.; et al. The International Consensus Classification of Mature Lymphoid Neoplasms: a report from the Clinical Advisory Committee. Blood 2022, 140, 1229–1253. [Google Scholar] [CrossRef] [PubMed]
- Liu, Y.; Barta, S.K. Diffuse large B-cell lymphoma: 2019 update on diagnosis, risk stratification, and treatment. Am. J. Hematol. 2019, 94, 604–616. [Google Scholar] [CrossRef] [PubMed]
- Thieblemont, C.; Bernard, S.; Meignan, M.; Molina, T. Optimizing initial therapy in DLBCL. Best Pract. Res. Clin. Haematol. 2018, 31, 199–208. [Google Scholar] [CrossRef] [PubMed]
- Sukswai, N.; Lyapichev, K.; Khoury, J.D.; Medeiros, L.J. Diffuse large B-cell lymphoma variants: an update. Pathology 2020, 52, 53–67. [Google Scholar] [CrossRef] [PubMed]
- Martelli, M.; Ferreri, A.J.; Agostinelli, C.; Di Rocco, A.; Pfreundschuh, M.; Pileri, S.A. Diffuse large B-cell lymphoma. Crit. Rev. Oncol. Hematol. 2013, 87, 146–171. [Google Scholar] [CrossRef] [PubMed]
- De Paepe, P.; De Wolf-Peeters, C. Diffuse large B-cell lymphoma: a heterogeneous group of non-Hodgkin lymphomas comprising several distinct clinicopathological entities. Leukemia 2007, 21, 37–43. [Google Scholar] [CrossRef] [PubMed]
- Swerdlow, S.H.; Campo, E.; Harris, N.L.; Jaffe, E.S.; Pileri, S.A.; Stein, H.; Thiele, J. WHO Classification of Tumours of Haematopoietic and Lymphoid Tissues. In WHO Classification of Tumours, Revised 4th Edition; IARC Publications, 2017; Volume 2, ISBN -13: 9789283244943. [Google Scholar]
- Ott, G.; Klapper, W.; Feller, A.C.; Hansmann, M.L.; Moller, P.; Stein, H.; Rosenwald, A.; Fend, F. Revised version of the 4th edition of the WHO classification of malignant lymphomas: What is new? Pathologe 2019, 40, 157–168. [Google Scholar] [CrossRef] [PubMed]
- Ott, G. Aggressive B-cell lymphomas in the update of the 4th edition of the World Health Organization classification of haematopoietic and lymphatic tissues: refinements of the classification, new entities and genetic findings. Br. J. Haematol. 2017, 178, 871–887. [Google Scholar] [CrossRef] [PubMed]
- Hans, C.P.; Weisenburger, D.D.; Greiner, T.C.; Gascoyne, R.D.; Delabie, J.; Ott, G.; Muller-Hermelink, H.K.; Campo, E.; Braziel, R.M.; Jaffe, E.S.; et al. Confirmation of the molecular classification of diffuse large B-cell lymphoma by immunohistochemistry using a tissue microarray. Blood 2004, 103, 275–282. [Google Scholar] [CrossRef] [PubMed]
- Wn Najmiyah, W.A.W.; Azlan, H.; Faezahtul, A.H. Classifying DLBCL according cell of origin using Hans algorithm and its association with clinicopathological parameters: A single centre experience. Med. J. Malays. 2020, 75, 98–102. [Google Scholar]
- Dhar, L.; Singh, S.; Jain, S.L.; Vindal, A.; Sinha, P.; Gautam, R. Cell of Origin Classification of Diffuse Large B-Cell Lymphoma. J. Microsc. Ultrastruct. 2024, 12, 193–198. [Google Scholar] [CrossRef] [PubMed]
- Lee, J.; Hue, S.S.; Ko, S.Q.; Tan, S.Y.; Liu, X.; Girard, L.P.; Chan, E.H.L.; De Mel, S.; Jeyasekharan, A.; Chee, Y.L.; et al. Clinical impact of the cell-of-origin classification based on immunohistochemistry criteria and Lymph2Cx of diffuse large B-Cell lymphoma patients in a South-east Asian population: a single center experience and review of the literature. Expert Rev. Hematol. 2019, 12, 1095–1105. [Google Scholar] [CrossRef] [PubMed]
- Zaiem, F.; Jerbi, R.; Albanyan, O.; Puccio, J.; Kafri, Z.; Yang, J.; Gabali, A.M. High Ki67 proliferation index but not cell-of-origin subtypes is associated with shorter overall survival in diffuse large B-cell lymphoma. Avicenna J. Med. 2020, 10, 241–248. [Google Scholar] [CrossRef] [PubMed]
- Batlle-Lopez, A.; Gonzalez de Villambrosia, S.; Francisco, M.; Malatxeberria, S.; Saez, A.; Montalban, C.; Sanchez, L.; Garcia, J.; Gonzalez-Barca, E.; Lopez-Hernandez, A.; et al. Stratifying diffuse large B-cell lymphoma patients treated with chemoimmunotherapy: GCB/non-GCB by immunohistochemistry is still a robust and feasible marker. Oncotarget 2016, 7, 18036–18049. [Google Scholar] [CrossRef] [PubMed]
- Choi, W.W.; Weisenburger, D.D.; Greiner, T.C.; Piris, M.A.; Banham, A.H.; Delabie, J.; Braziel, R.M.; Geng, H.; Iqbal, J.; Lenz, G.; et al. A new immunostain algorithm classifies diffuse large B-cell lymphoma into molecular subtypes with high accuracy. Clin. Cancer Res. 2009, 15, 5494–5502. [Google Scholar] [CrossRef] [PubMed]
- Gutierrez-Garcia, G.; Cardesa-Salzmann, T.; Climent, F.; Gonzalez-Barca, E.; Mercadal, S.; Mate, J.L.; Sancho, J.M.; Arenillas, L.; Serrano, S.; Escoda, L.; et al. Gene-expression profiling and not immunophenotypic algorithms predicts prognosis in patients with diffuse large B-cell lymphoma treated with immunochemotherapy. Blood 2011, 117, 4836–4843. [Google Scholar] [CrossRef] [PubMed]
- Colomo, L.; Lopez-Guillermo, A.; Perales, M.; Rives, S.; Martinez, A.; Bosch, F.; Colomer, D.; Falini, B.; Montserrat, E.; Campo, E. Clinical impact of the differentiation profile assessed by immunophenotyping in patients with diffuse large B-cell lymphoma. Blood 2003, 101, 78–84. [Google Scholar] [CrossRef] [PubMed]
- Moore, E.M.; Gibson, S.E. How I diagnose high-grade B-cell lymphoma. Am. J. Clin. Pathol. 2025, 163, 487–500. [Google Scholar] [CrossRef] [PubMed]
- Davies, A.J. The high-grade B-cell lymphomas: double hit and more. Blood 2024, 144, 2583–2592. [Google Scholar] [CrossRef] [PubMed]
- Sha, C.; Barrans, S.; Cucco, F.; Bentley, M.A.; Care, M.A.; Cummin, T.; Kennedy, H.; Thompson, J.S.; Uddin, R.; Worrillow, L.; et al. Molecular High-Grade B-Cell Lymphoma: Defining a Poor-Risk Group That Requires Different Approaches to Therapy. J. Clin. Oncol. 2019, 37, 202–212. [Google Scholar] [CrossRef] [PubMed]
- Ok, C.Y.; Medeiros, L.J. High-grade B-cell lymphoma: a term re-purposed in the revised WHO classification. Pathology 2020, 52, 68–77. [Google Scholar] [CrossRef] [PubMed]
- Novo, M.; Castellino, A.; Nicolosi, M.; Santambrogio, E.; Vassallo, F.; Chiappella, A.; Vitolo, U. High-grade B-cell lymphoma: how to diagnose and treat. Expert Rev. Hematol. 2019, 12, 497–506. [Google Scholar] [CrossRef] [PubMed]
- Collinge, B.; Hilton, L.K.; Wong, J.; Alduaij, W.; Ben-Neriah, S.; Slack, G.W.; Farinha, P.; Boyle, M.; Meissner, B.; Cook, J.R.; et al. High-grade B-cell lymphoma, not otherwise specified: an LLMPP study. Blood Adv. 2025, 9, 5409–5422. [Google Scholar] [CrossRef] [PubMed]
- Alsharif, R.; Dunleavy, K. Burkitt Lymphoma and Other High-Grade B-Cell Lymphomas with or without MYC, BCL2, and/or BCL6 Rearrangements. Hematol. Oncol. Clin. North Am. 2019, 33, 587–596. [Google Scholar] [CrossRef] [PubMed]
- Miyaoka, M.; Carreras, J.; Kikuti, Y.Y.; Ikoma, H.; Nagase, S.; Ito, A.; Orita, M.; Kawada, H.; Sakai, R.; Sato, Y.; et al. Clinicopathological and transcriptomic profiles of 101 patients with diffuse large B-cell lymphoma/high-grade B-cell lymphoma with double-hit MYC and BCL2 or BCL6 and triple hit. Histopathology 2026, 88, 1324–1347. [Google Scholar] [CrossRef] [PubMed]
- Miyaoka, M.; Kikuti, Y.Y.; Carreras, J.; Ito, A.; Ikoma, H.; Tomita, S.; Kawada, H.; Roncador, G.; Bea, S.; Campo, E.; et al. Copy Number Alteration and Mutational Profile of High-Grade B-Cell Lymphoma with MYC and BCL2 and/or BCL6 Rearrangements, Diffuse Large B-Cell Lymphoma with MYC-Rearrangement, and Diffuse Large B-Cell Lymphoma with MYC-Cluster Amplification. Cancers 2022, 14. [Google Scholar] [CrossRef] [PubMed]
- Miyaoka, M.; Kikuti, Y.Y.; Carreras, J.; Itou, A.; Ikoma, H.; Tomita, S.; Shiraiwa, S.; Ando, K.; Nakamura, N. AID is a poor prognostic marker of high-grade B-cell lymphoma with MYC and BCL2 and/or BCL6 rearrangements. Pathol. Int. 2022, 72, 35–42. [Google Scholar] [CrossRef] [PubMed]
- Lee, J.H.; Song, G.Y.; Lee, J.; Kang, S.R.; Moon, K.M.; Choi, Y.D.; Shen, J.; Noh, M.G.; Yang, D.H. Prediction of immunochemotherapy response for diffuse large B-cell lymphoma using artificial intelligence digital pathology. J. Pathol. Clin. Res. 2024, 10, e12370. [Google Scholar] [CrossRef] [PubMed]
- Vrabac, D.; Smit, A.; Rojansky, R.; Natkunam, Y.; Advani, R.H.; Ng, A.Y.; Fernandez-Pol, S.; Rajpurkar, P. DLBCL-Morph: Morphological features computed using deep learning for an annotated digital DLBCL image set. Sci. Data 2021, 8, 135. [Google Scholar] [CrossRef] [PubMed]
- Li, Z.; Shi, J.; Wu, X.; Cui, Z.; Liu, B.; Liu, Y. Machine learning-based histopathological features of histological slides and clinical characteristics as a novel prognostic indicator in diffuse large B-cell lymphoma. Pathol. Res. Pract. 2025, 272, 156071. [Google Scholar] [CrossRef] [PubMed]
- Ma, D.; Yuan, Y.; Miao, X.; Gu, Y.; Wang, Y.; Luo, D.; Fan, M.; Shi, X.; Xi, S.; Ji, B.; et al. Predicting the risk of relapsed or refractory in patients with diffuse large B-cell lymphoma via deep learning. Front Oncol. 2025, 15, 1480645. [Google Scholar] [CrossRef] [PubMed]
- Alaggio, R.; Amador, C.; Anagnostopoulos, I.; Attygalle, A.D.; Araujo, I.B.O.; Berti, E.; Bhagat, G.; Borges, A.M.; Boyer, D.; Calaminici, M.; et al. The 5th edition of the World Health Organization Classification of Haematolymphoid Tumours: Lymphoid Neoplasms. Leukemia 2022, 36, 1720–1748. [Google Scholar] [CrossRef] [PubMed]
- Arber, D.A.; Orazi, A.; Hasserjian, R.P.; Borowitz, M.J.; Calvo, K.R.; Kvasnicka, H.M.; Wang, S.A.; Bagg, A.; Barbui, T.; Branford, S.; et al. International Consensus Classification of Myeloid Neoplasms and Acute Leukemias: integrating morphologic, clinical, and genomic data. Blood 2022, 140, 1200–1228. [Google Scholar] [CrossRef] [PubMed]
- Cazzola, M.; Sehn, L.H. Developing a classification of hematologic neoplasms in the era of precision medicine. Blood 2022, 140, 1193–1199. [Google Scholar] [CrossRef] [PubMed]
- de Leval, L.; Alizadeh, A.A.; Bergsagel, P.L.; Campo, E.; Davies, A.; Dogan, A.; Fitzgibbon, J.; Horwitz, S.M.; Melnick, A.M.; Morice, W.G.; et al. Genomic profiling for clinical decision making in lymphoid neoplasms. Blood 2022, 140, 2193–2227. [Google Scholar] [CrossRef] [PubMed]
- Karube, K.; Satou, A.; Kato, S. New classifications of B-cell neoplasms: a comparison of 5th WHO and International Consensus classifications. Int. J. Hematol. 2025, 121, 331–341. [Google Scholar] [CrossRef] [PubMed]
- Carreras, J.; Roncador, G.; Hamoudi, R. Dataset and AI Workflow for Deep Learning Image Classification of Ulcerative Colitis and Colorectal Cancer. Data 2025, 10, 99. [Google Scholar] [CrossRef]
- Carreras, J.; Kikuti, Y.Y.; Roncador, G.; Miyaoka, M.; Hiraiwa, S.; Tomita, S.; Ikoma, H.; Kondo, Y.; Ito, A.; Shiraiwa, S.; et al. High Expression of Caspase-8 Associated with Improved Survival in Diffuse Large B-Cell Lymphoma: Machine Learning and Artificial Neural Networks Analyses. BioMedInformatics 2021, 1, 18–46. [Google Scholar] [CrossRef]
- Carreras, J.; Kikuti, Y.Y.; Miyaoka, M.; Hiraiwa, S.; Tomita, S.; Ikoma, H.; Kondo, Y.; Ito, A.; Shiraiwa, S.; Hamoudi, R.; et al. A Single Gene Expression Set Derived from Artificial Intelligence Predicted the Prognosis of Several Lymphoma Subtypes; and High Immunohistochemical Expression of TNFAIP8 Associated with Poor Prognosis in Diffuse Large B-Cell Lymphoma. AI 2020, 1, 342–360. [Google Scholar] [CrossRef]
- Carreras, J.; Kikuti, Y.Y.; Miyaoka, M.; Roncador, G.; Garcia, J.F.; Hiraiwa, S.; Tomita, S.; Ikoma, H.; Kondo, Y.; Ito, A.; et al. Integrative Statistics, Machine Learning and Artificial Intelligence Neural Network Analysis Correlated CSF1R with the Prognosis of Diffuse Large B-Cell Lymphoma. Hemato 2021, 2, 182–206. [Google Scholar]
- Carreras, J. Higher Histological Entropy is Correlated with Poor Overall Survival and Dead Within the First 2 Years in Diffuse Large B-Cell Lymphoma. Preprints 2026, 2026060742. [Google Scholar] [CrossRef]
- Alizadeh, A.A.; Eisen, M.B.; Davis, R.E.; Ma, C.; Lossos, I.S.; Rosenwald, A.; Boldrick, J.C.; Sabet, H.; Tran, T.; Yu, X.; et al. Distinct types of diffuse large B-cell lymphoma identified by gene expression profiling. Nature 2000, 403, 503–511. [Google Scholar] [CrossRef] [PubMed]
- Masters, J.R.; Lakhani, S.R. How diagnosis with microarrays can help cancer patients. Nature 2000, 404, 921. [Google Scholar] [CrossRef] [PubMed]
- Klapper, W.; Kreuz, M.; Kohler, C.W.; Burkhardt, B.; Szczepanowski, M.; Salaverria, I.; Hummel, M.; Loeffler, M.; Pellissery, S.; Woessmann, W.; et al. Patient age at diagnosis is associated with the molecular characteristics of diffuse large B-cell lymphoma. Blood 2012, 119, 1882–1887. [Google Scholar] [CrossRef] [PubMed]
- Duminuco, A.; Scarso, S.; Del Fabro, V.; Caruso, L.A.; Stanzione, G.; Di Raimondo, F.; Palumbo, G.A.; Vetro, C. Diffuse large B-cell lymphoma in the new era: prognostic tools for mapping risk. Ann. Hematol. 2025, 104(10), 4897–4911. [Google Scholar] [CrossRef] [PubMed] [PubMed Central]
- Carreras, J.; Kikuti, Y.Y.; Miyaoka, M.; Hiraiwa, S.; Tomita, S.; Ikoma, H.; Kondo, Y.; Ito, A.; Shiraiwa, S.; Hamoudi, R.; et al. A Single Gene Expression Set Derived from Artificial Intelligence Predicted the Prognosis of Several Lymphoma Subtypes; and High Immunohistochemical Expression of TNFAIP8 Associated with Poor Prognosis in Diffuse Large B-Cell Lymphoma. AI 2020, 1, 342–360. [Google Scholar] [CrossRef]
- Duell, J.; Westin, J. The future of immunotherapy for diffuse large B-cell lymphoma. Int. J. Cancer 2025, 156, 251–261. [Google Scholar] [CrossRef] [PubMed]
- Pelzl, R.J.; Benintende, G.; Gsottberger, F.; Scholz, J.K.; Ruebner, M.; Yao, H.; Wendland, K.; Rejeski, K.; Altmann, H.; Petkovic, S.; et al. Large B-cell lymphoma imprints a dysfunctional immune phenotype that persists years after treatment. Blood 2025, 146, 1300–1313. [Google Scholar] [CrossRef] [PubMed]
- Zhang, M.; Tian, S.; Fu, D.; et al. Genetic subtype-guided immunochemotherapy in diffuse large B cell lymphoma: The randomized GUIDANCE-01 trial. Cancer Cell 2023, 41, 1705–1716.e5. [Google Scholar] [CrossRef] [PubMed]
- Okosun, J. Immunotherapy response: is it all in the DLBCL-IQs? Blood 2025, 145, 2402–2403. [Google Scholar] [CrossRef] [PubMed]
Figure 1.
Skeletonization on test images. Skeletonization can be used for feature extraction and represent an object’s topology. Skeletonization area measurement was tested on a set of 8 images to evaluate the usefulness of the ‘bwskel’ function. The area values from images 1-8 were as follows: 0, 40, 100, 215, 526, 857, 1786, and 2603, respectively. Therefore, the function was measured correctly.
Figure 1.
Skeletonization on test images. Skeletonization can be used for feature extraction and represent an object’s topology. Skeletonization area measurement was tested on a set of 8 images to evaluate the usefulness of the ‘bwskel’ function. The area values from images 1-8 were as follows: 0, 40, 100, 215, 526, 857, 1786, and 2603, respectively. Therefore, the function was measured correctly.
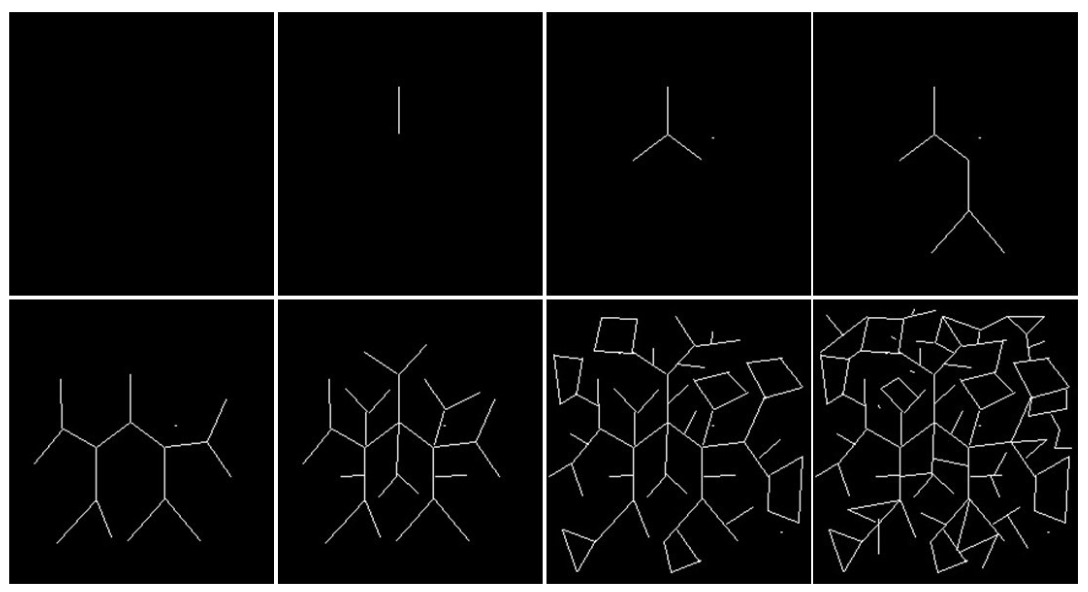
Figure 2.
Different skeletonization areas between DLBCL and reactive lymphoid tissue. Skeletonization technique is useful for feature extraction and represent an object’s topology. In comparison to reactive lymphoid tissue, DLBCL was characterized by lower skeletonization area, 5665.20 ± 1012.82 vst 6341.16 ± 548.23 respectively (p < 0.001).
Figure 2.
Different skeletonization areas between DLBCL and reactive lymphoid tissue. Skeletonization technique is useful for feature extraction and represent an object’s topology. In comparison to reactive lymphoid tissue, DLBCL was characterized by lower skeletonization area, 5665.20 ± 1012.82 vst 6341.16 ± 548.23 respectively (p < 0.001).
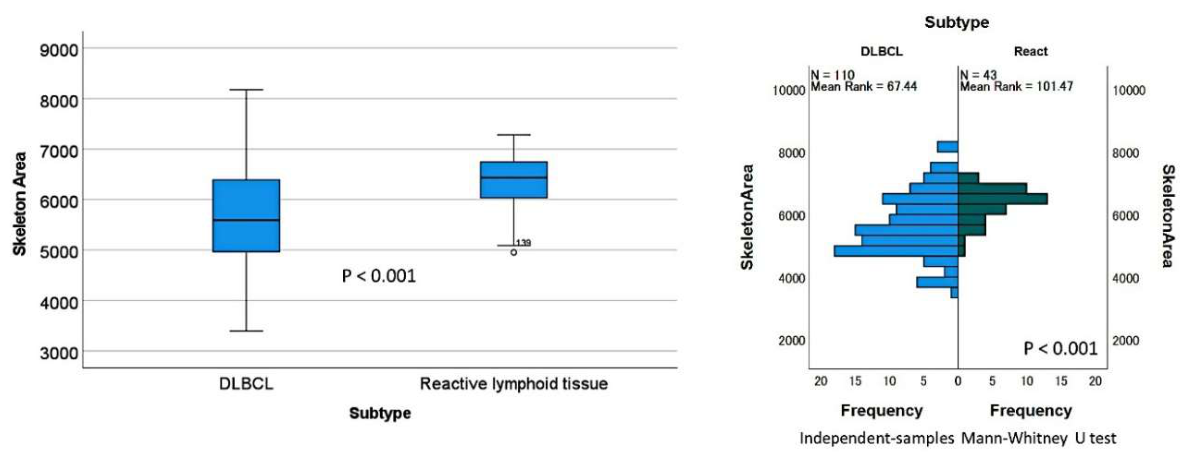
Figure 3.
High skeletonization correlated with poor overall survival of DLBCL. Overall survival analysis using the Kaplan–Meier and log rank tests showed that high skeletonizaton cases were associated with worse overall survival (P = 0.002; Hazard risk = 2.48).
Figure 3.
High skeletonization correlated with poor overall survival of DLBCL. Overall survival analysis using the Kaplan–Meier and log rank tests showed that high skeletonizaton cases were associated with worse overall survival (P = 0.002; Hazard risk = 2.48).
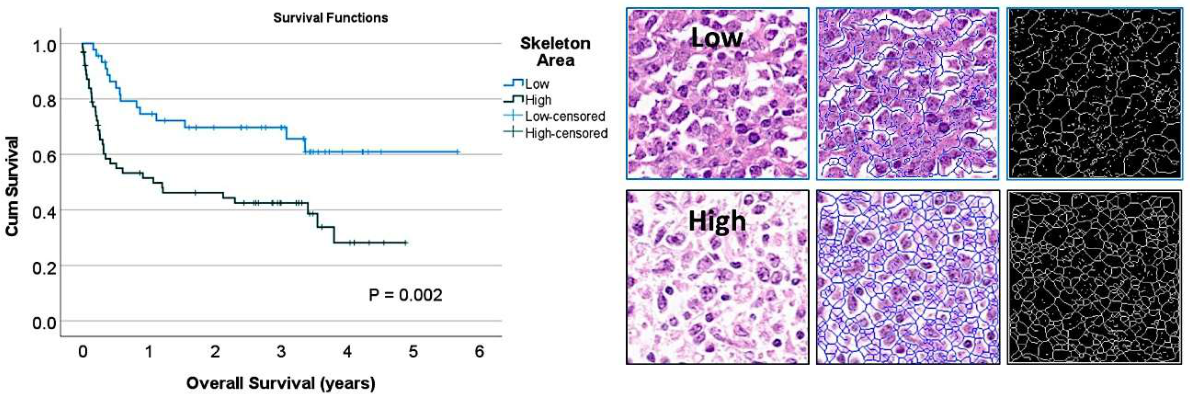
Figure 4.
Skeletonization of reactive lymphoid tissue. Skeletonization reduces binary objects to 1 pixel wide curved line representations without changing the essential structure of the image. This is useful for feature extraction and represents an object’s topology. This study used the skeletonization function to analyze the topological heterogeneity of reactive lymphoid tissue and DLBCL. This figure shows images of reactive lymphoid tissue characterized by higher skeletonization (heterogeneity) than DLBCL.
Figure 4.
Skeletonization of reactive lymphoid tissue. Skeletonization reduces binary objects to 1 pixel wide curved line representations without changing the essential structure of the image. This is useful for feature extraction and represents an object’s topology. This study used the skeletonization function to analyze the topological heterogeneity of reactive lymphoid tissue and DLBCL. This figure shows images of reactive lymphoid tissue characterized by higher skeletonization (heterogeneity) than DLBCL.
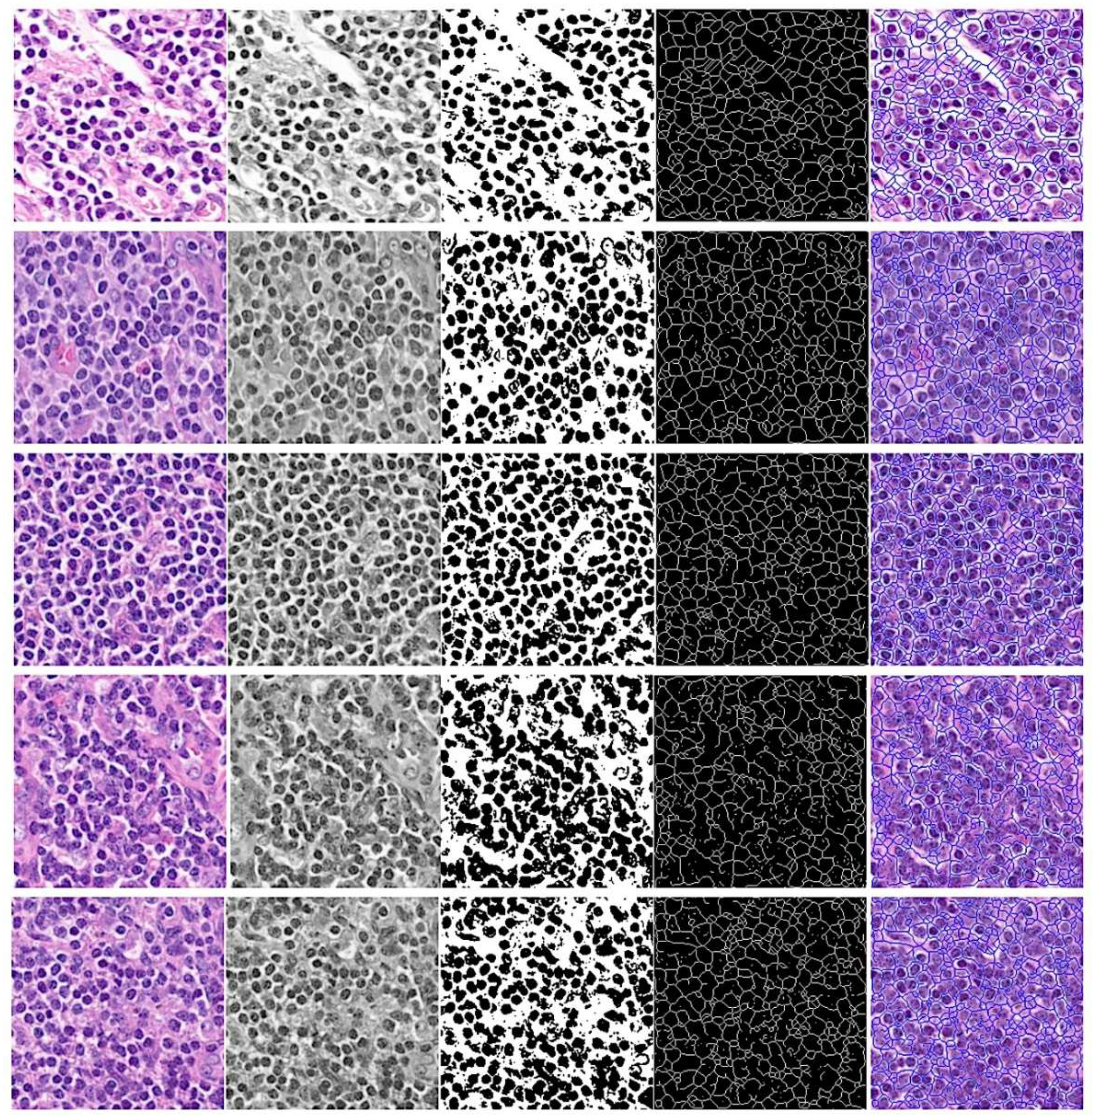
Figure 5.
Low skeletonization in the DLBCL. Skeletonization reduces binary objects to 1 pixel wide curved line representations without changing the essential structure of the image. This is useful for feature extraction and represents an object’s topology. This study used the skeletonization function to analyze the topological heterogeneity of reactive lymphoid tissue and DLBCL. This figure shows images of DLBCL with low skeletonization (heterogeneity).
Figure 5.
Low skeletonization in the DLBCL. Skeletonization reduces binary objects to 1 pixel wide curved line representations without changing the essential structure of the image. This is useful for feature extraction and represents an object’s topology. This study used the skeletonization function to analyze the topological heterogeneity of reactive lymphoid tissue and DLBCL. This figure shows images of DLBCL with low skeletonization (heterogeneity).
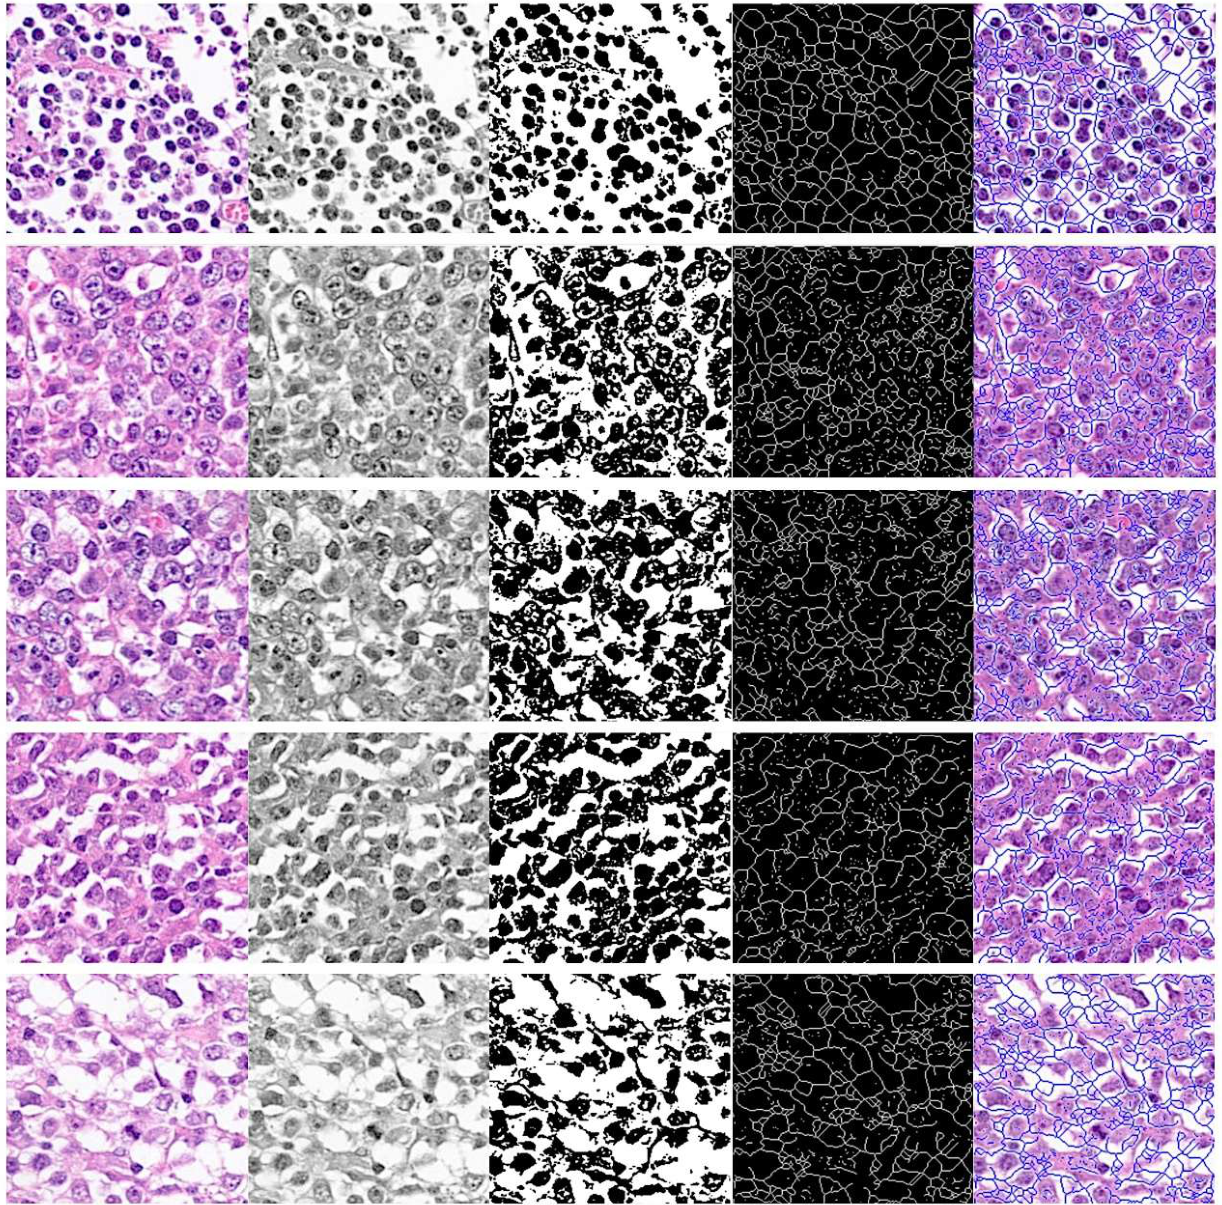
Figure 6.
High skeletonization in DLBCL. Skeletonization reduces binary objects to 1 pixel wide curved line representations without changing the essential structure of the image. This is useful for feature extraction and represents an object’s topology. This study used the skeletonization function to analyze the topological heterogeneity of reactive lymphoid tissue and DLBCL. This figure shows images of DLBCL with high skeletonization (heterogeneity).
Figure 6.
High skeletonization in DLBCL. Skeletonization reduces binary objects to 1 pixel wide curved line representations without changing the essential structure of the image. This is useful for feature extraction and represents an object’s topology. This study used the skeletonization function to analyze the topological heterogeneity of reactive lymphoid tissue and DLBCL. This figure shows images of DLBCL with high skeletonization (heterogeneity).
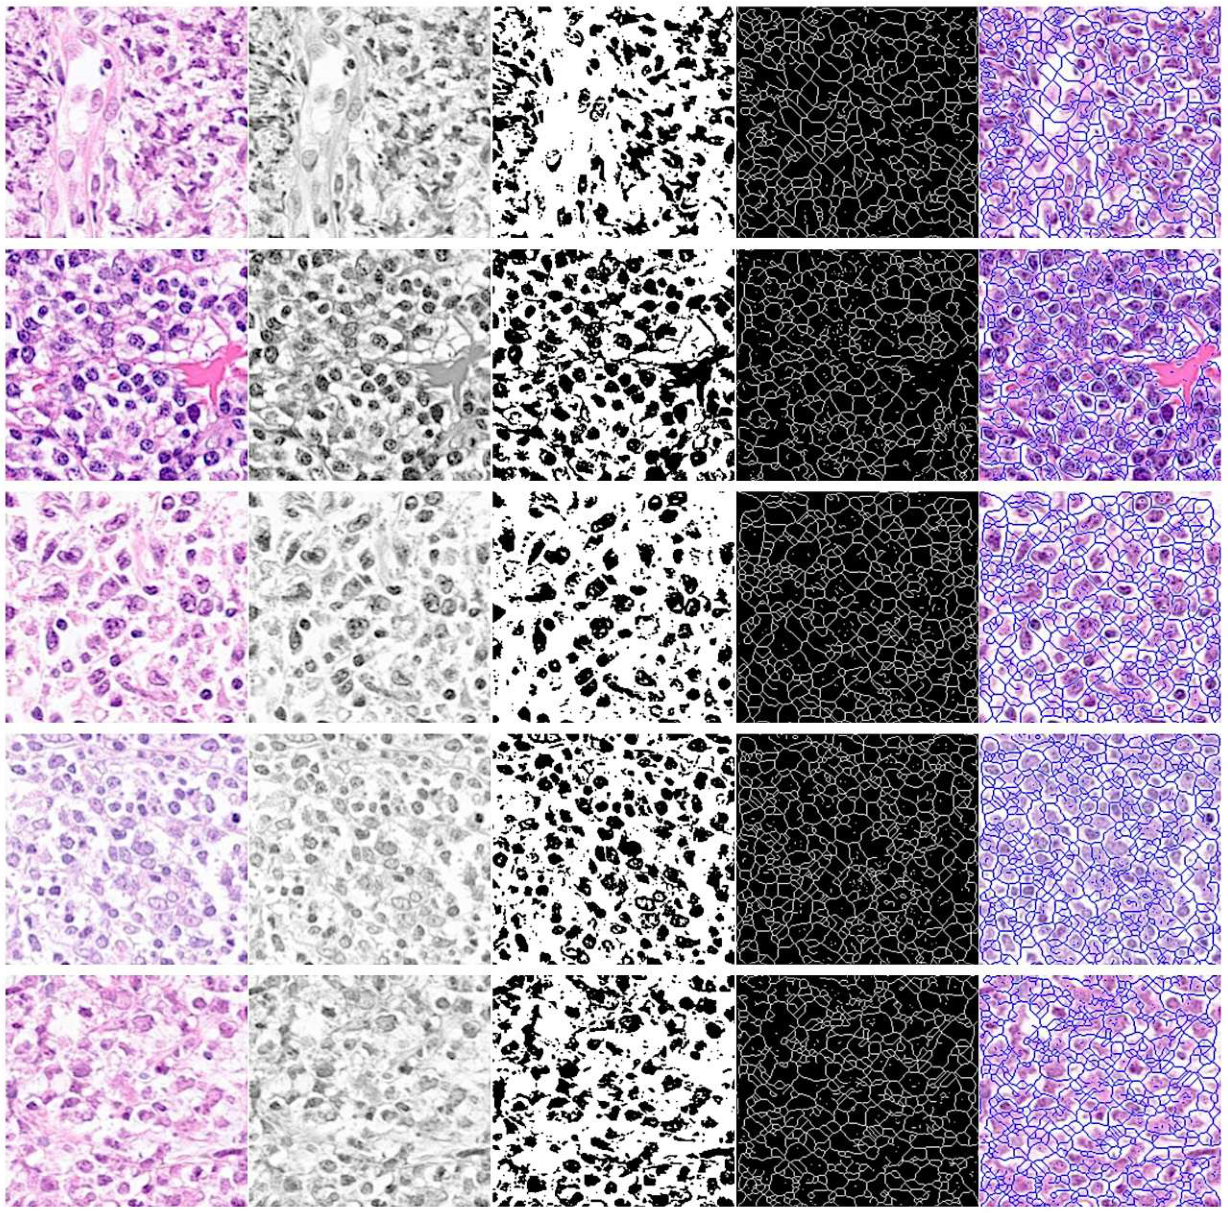
Figure 7.
Additional images and differences between low and high skeletonization cases (H&E). In comparison with high skeletonization cases, low skeletonization cases had a DLBCL with more homogeneous and diffuse histological morphology (centrobastic and immunoblastic).
Figure 7.
Additional images and differences between low and high skeletonization cases (H&E). In comparison with high skeletonization cases, low skeletonization cases had a DLBCL with more homogeneous and diffuse histological morphology (centrobastic and immunoblastic).
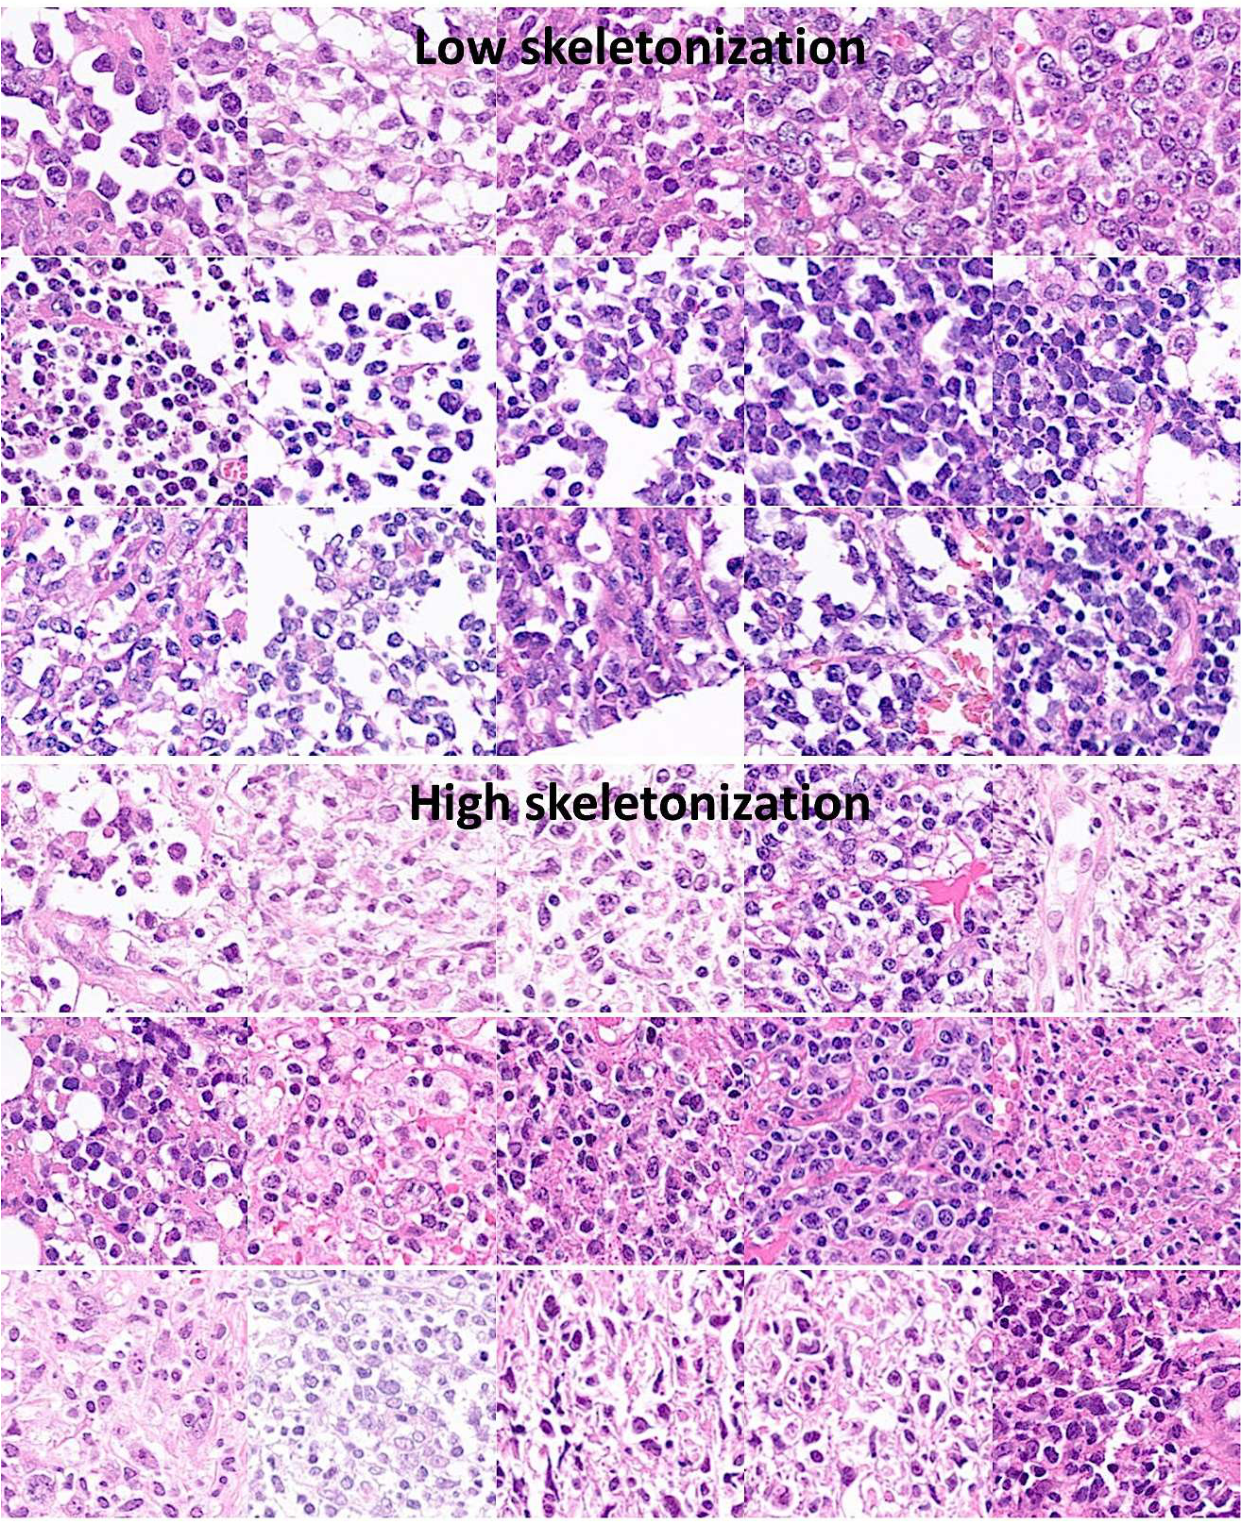
Figure 8.
Additional images and differences between low and high skeletonization cases (H&E). High skeletonization cases show a denser filament structure of the skeleton, which correlated with heterogeneous histological cells and topological structure.
Figure 8.
Additional images and differences between low and high skeletonization cases (H&E). High skeletonization cases show a denser filament structure of the skeleton, which correlated with heterogeneous histological cells and topological structure.
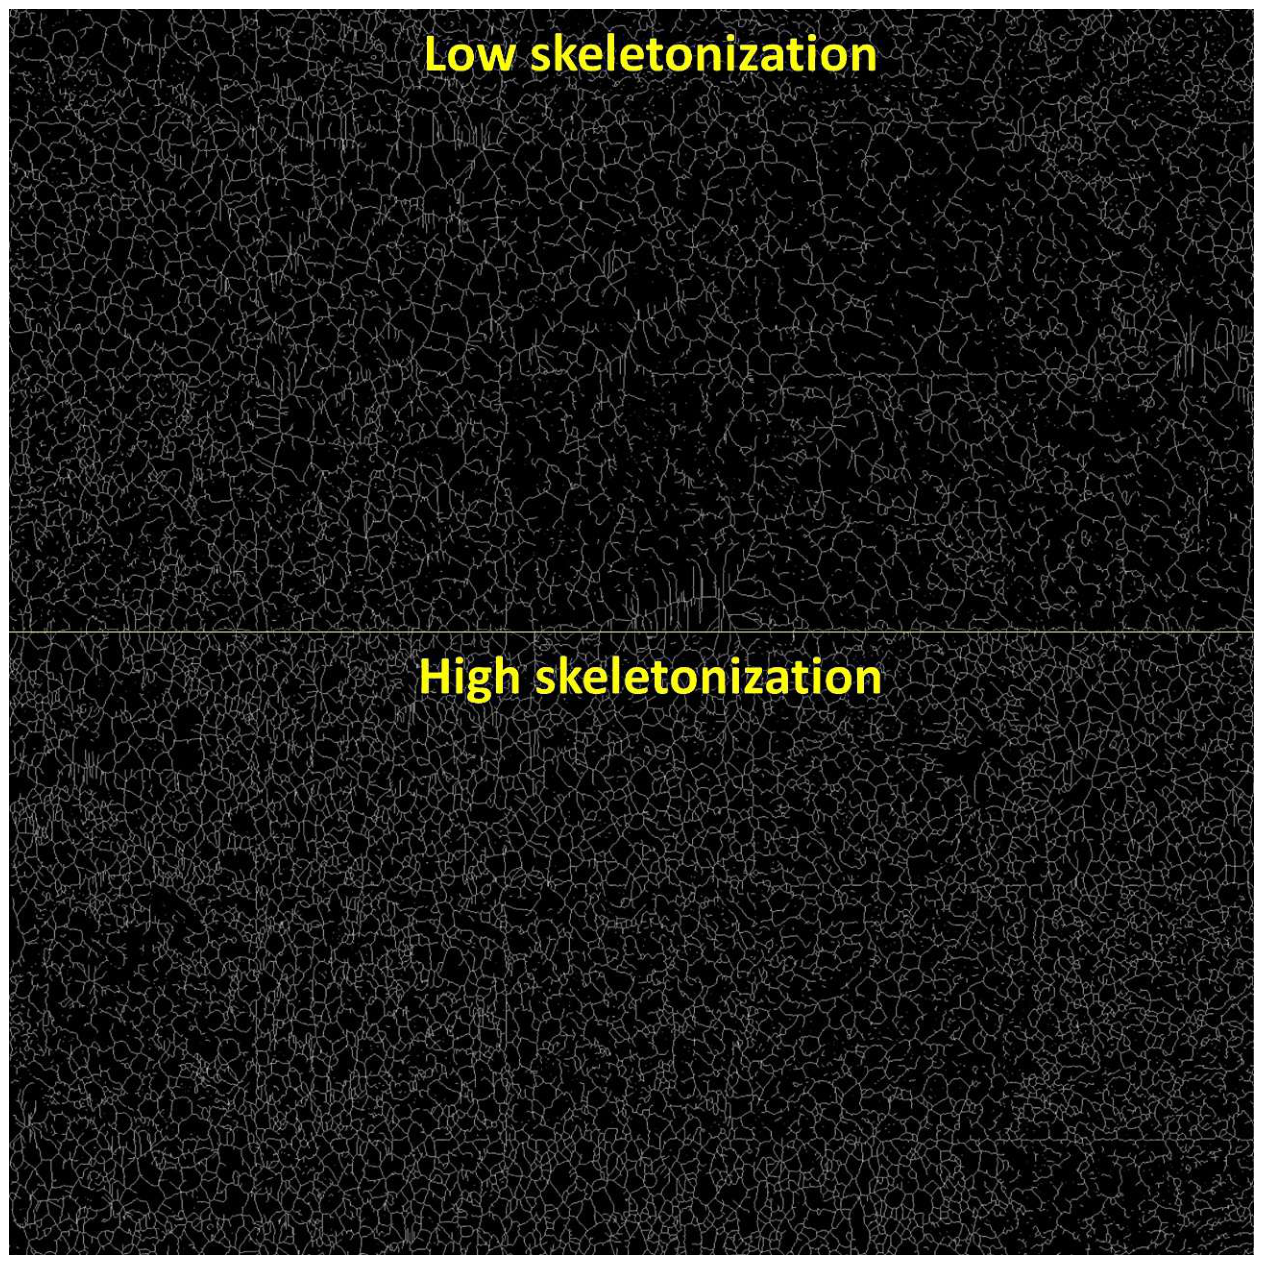
Figure 9.
Immunohistochemical images. The skeletonization was correlated with several clinical and pathological variables. High skeletonization correacted with higher EBER positivity (P < 0.001), lower CD5 posi-tivity (P = 0.006), lower E2F1 percentage (P < 0.001), lower BCL2 percentage (P = 0.010), lower ISY1 percentage (P = 0.012), and lower TNFAIP8 (P = 0.014).
Figure 9.
Immunohistochemical images. The skeletonization was correlated with several clinical and pathological variables. High skeletonization correacted with higher EBER positivity (P < 0.001), lower CD5 posi-tivity (P = 0.006), lower E2F1 percentage (P < 0.001), lower BCL2 percentage (P = 0.010), lower ISY1 percentage (P = 0.012), and lower TNFAIP8 (P = 0.014).
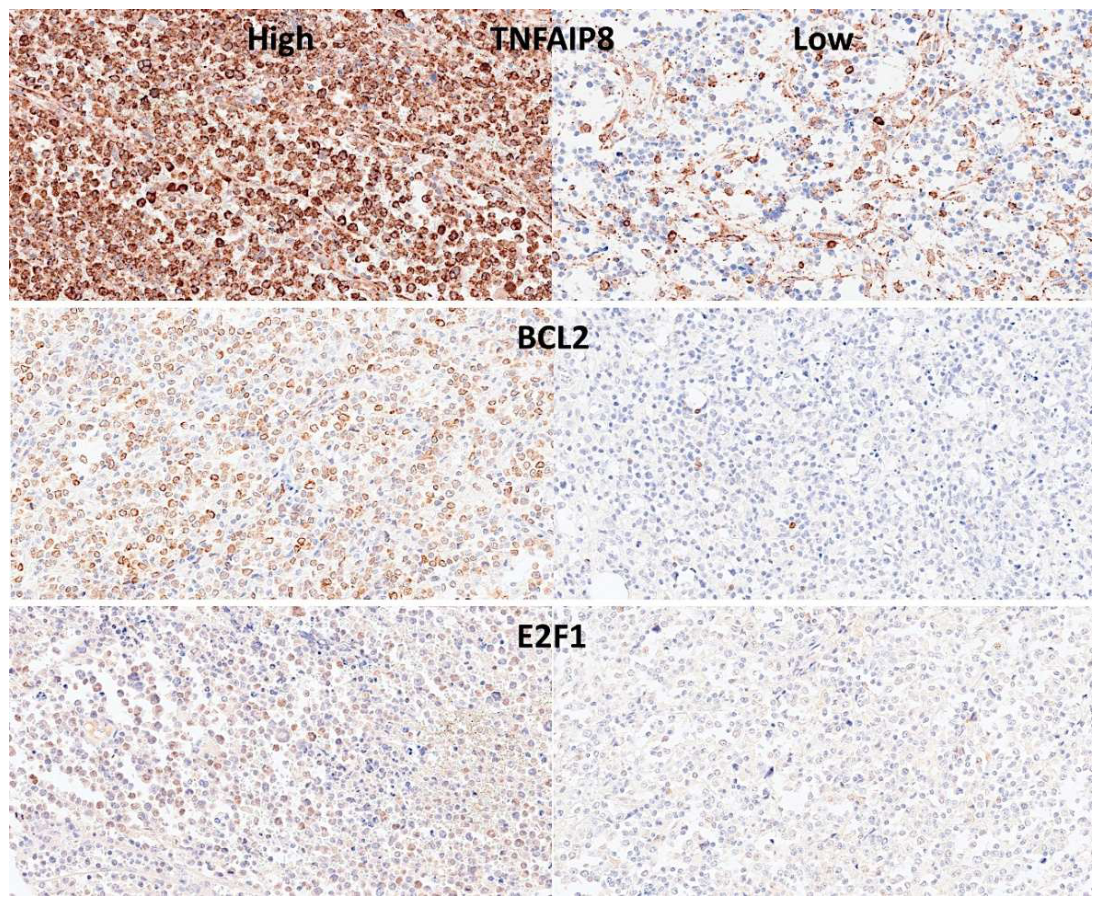
Figure 10.
Differential gene expression. This figure shows the heatmap and differential gene expression between high and low skeletonization. The analysis showed that 166 immuno-oncology genes were upregulated in the high skeletonization group and 8 genes upregulated in the low skeletonization group.
Figure 10.
Differential gene expression. This figure shows the heatmap and differential gene expression between high and low skeletonization. The analysis showed that 166 immuno-oncology genes were upregulated in the high skeletonization group and 8 genes upregulated in the low skeletonization group.
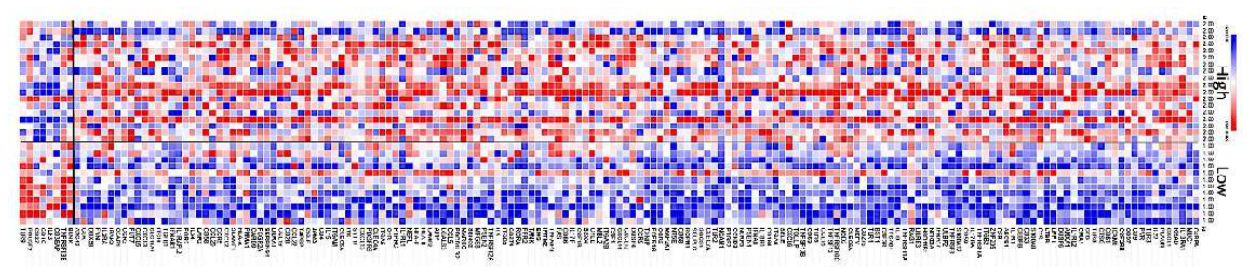

Table 1.
Skeletonization code.
| %Code for one image | %Code for folder |
|---|---|
| clc clear I = imread("***"); imageshow(I) G = rgb2gray(I) imageshow(G) BW = imbinarize(G) imageshow(BW) B = bwskel(BW); stats = regionprops(B, "Area"); areaValue = sum([stats.Area]) |
imageLoc = "skeletontraining"; ds = imageDatastore(imageLoc); for i = 1:length(ds.Files) I = readimage(ds, i); G = rgb2gray(I); B = imbinarize(G); S1 = bwskel(B); imageshow(S1) stats = regionprops(S1, "Area"); if isempty(stats) areaValue = 0; else areaValue = sum([stats.Area]); end areaStats(i) = areaValue; end |
| %Overlay skeleton on original image | %Prune small spurs |
| bAnnotated = labeloverlay(I,B,Transparency=0); imageshow(bAnnotated) |
bPruned = bwskel(BW,MinBranchLength=15); bPrunedAnnotated = labeloverlay(I,bPruned,Transparency=0); imageshow(bPrunedAnnotated) |
In this study, small spurs were not pruned before area measurement.
Table 2.
Correlation between the the skeletonization area and clinical variables.
| Variable | Low skeletonization | High skeletonization | P value |
|---|---|---|---|
| Age > 60 years | 29/45 (64.4%) | 48/65 (73.8%) | 0.300 |
| Male | 25/45 (55.6%) | 32/65 (49.2%) | 0.564 |
| Location | |||
| Nodal (+Spleen) | 26/45 (57.8%) | 31/65 (47.7%) | 0.398 |
| Waldeyer’s ring | 2/45 (4.4%) | 8/65 (12.3%) | |
| Gastrointestinal | 4/45 (8.9%) | 9/65 (13.8%) | |
| Other extranodal | 13/45 (28.9%) | 17/65 (26.2%) | |
| Treatment | |||
| RCHOP | 33/42 (78.6%) | 36/52 (69.2%) | 0.583 |
| RCHOP-like | 7/42 (16.7%) | 13/52 (25.0%) | |
| Others | 2/42 (4.8%) | 3/52 (5.8%) | |
| LDH High | 25/43 (58.1%) | 38/57 (66.7%) | 0.409 |
| ECOG PS 2-4 | 3/37 (8.1%) | 8/44 (18.2%) | 0.214 |
| Stage III-IV | 18/41 (43.9%) | 26/52 (50.0%) | 0.676 |
| IPI HI+H | 10/38 (26.3%) | 19/49 (38.8%) | 0.257 |
| Clinical response | 33/41 (80.5%) | 31/47 (66.0%) | 0.154 |
| High sIL2R | 32/42 (76.2%) | 44/54 (81.5%) | 0.615 |
| B symptoms | 8/38 (21.1%) | 14/45 (31.1%) | 0.330 |
Pearson chi-square and/or Fisher’s exact test.
Table 3.
Correlation between skeletonization area and pathological variables.
| Variable | Low skeletonization | High skeletonization | P value |
|---|---|---|---|
| CD3 positive | 0/45 (0.0%) | 0/65 (0.0%) | 0.512 |
| CD20 positive | 45/45 (100.0%) | 65/65 (100.0%) | N/A |
| CD5 positive | 10/44 (22.7%) | 3/65 (4.6%) | 0.006 |
| CD10 positive | 14/44 (31.8%) | 17/65 (26.2%) | 0.525 |
| BCL6 positive | 29/45 (64.4%) | 44/64 (68.8%) | 0.682 |
| MUM1 positive | 29/45 (64.4%) | 44/64 (68.8%) | 0.682 |
| LMO2 high | 22/44 (50%) | 28/44 (63.6%) | 0.282 |
| Non-GCB | 30/44 (68.2%) | 45/64 (70.3%) | 0.834 |
| High Ki67 | 24/44 (54.5%) | 33/54 (61.1%) | 0.543 |
| EBER+ | 4/44 (9.1%) | 24/64 (37.5%) | < 0.001 |
| BCL2 rearrangement | 0/42 (0.0%) | 3/51 (5.9%) | 0.249 |
| MYC rearrangement | 1/42 (2.4%) | 4/52 (7.7%) | 0.376 |
| Double-hit | 0/42 (0.0%) | 0/49 (0.0%) | N/A |
| High entropy (>7.2) | 7/45 (15.6%) | 17/64 (26.6%) | 0.241 |
Pearson Chi-Square and/or Fisher’s Exact test.
Table 4.
Correlation between skeletonization area and germinal center, cell cycle pathological, and immuno-oncology variables.
Table 4.
Correlation between skeletonization area and germinal center, cell cycle pathological, and immuno-oncology variables.
| Variable | Low skeletonization | High skeletonization | P value |
|---|---|---|---|
| Ki69 | 16.7% ± 15.9 | 14.9 ± 13.5 | 0.508 |
| LMO2 | 2.2% ± 3.7 | 3.1 ± 3.5 | 0.109 |
| MYC Y69 | 5.3% ± 4.8 | 4.8% ± 5.7 | 0.231 |
| MDM2 | 12.4% ± 9.2 | 8.9% ± 5.7 | 0.083 |
| CDK6 | 5.8% ± 7.4 | 3.9% ± 5.7 | 0.052 |
| E2F1 | 2.4% ± 2.1 | 1.1% ± 1.1 | <0.001 |
| BCL2 | 9.4% ± 11.5 | 3.6% ± 5.5 | 0.010 |
| CASP8 | 7.9% ± 8.9 | 5.9% ± 8.2 | 0.163 |
| MYOB | 25.2% ± 150.3 | 24.3% ± 150.4 | 0.155 |
| TP53 | 5.2% ± 8.3 | 5.4% ± 8.5 | 0.550 |
| cPARP | 0.9% ± 1.2 | 0.9% ± 1.2 | 0.793 |
| cCASP3 | 1.4% ± 2.3 | 1.1% ± 1.2 | 0.850 |
| ISY1 | 2.4% ± 2.8 | 1.1% ± 2.1 | 0.012 |
| TNFAIP8 | 48.0% ± 26.5 | 34.6% ± 23.6 | 0.014 |
| CSF1R | 32.9% ± 27.3 | 34.5% ± 28.2 | 0.675 |
| CD163 | 34.1% ± 24.5 | 37.4% ± 24.9 | 0.372 |
Independent-samples Mann–Whitney U test.
Disclaimer/Publisher’s Note: The statements, opinions and data contained in all publications are solely those of the individual author(s) and contributor(s) and not of MDPI and/or the editor(s). MDPI and/or the editor(s) disclaim responsibility for any injury to people or property resulting from any ideas, methods, instructions or products referred to in the content. |
© 2026 by the authors. Licensee MDPI, Basel, Switzerland. This article is an open access article distributed under the terms and conditions of the Creative Commons Attribution (CC BY) license (http://creativecommons.org/licenses/by/4.0/).
Copyright: This open access article is published under a Creative Commons CC BY 4.0 license, which permit the free download, distribution, and reuse, provided that the author and preprint are cited in any reuse.


