

Submitted:
29 June 2026
Posted:
30 June 2026
You are already at the latest version
Abstract
Integrated organo-mineral fertilization is considered an effective strategy for im-proving soil quality, nutrient use efficiency, and productivity in acidic orchard systems. This study evaluated the effects of compost (30 t ha⁻¹ combined with P₁₅₀K₁₂₀) and nitrogen fertilizers (urea or ammonium nitrate applied at 0, 90, 120, and 150 kg ha⁻¹) on soil quality, nutrient dynamics, yield, fruit quality, and nu-trient use efficiency (NUE) of kiwifruit grown on acidic Luvisols in the humid subtropical Lankaran–Astara region of Azerbaijan during a two-year field ex-periment. Integrated fertilization significantly increased soil organic carbon (SOC), water-stable aggregates (WSA), and nutrient availability (NH₄⁺–N, NO₃⁻–N, P₂O₅, and K₂O) in both non-degraded and moderately degraded soils. Results showed strong positive relationships between soil organic carbon (SOC) and soil fertility parameters, particularly NH₄⁺–N (R² = 0.92), NO₃⁻–N (R² = 0.84), P₂O₅ (R² = 0.82), and water-stable aggregates (WSA; R² = 0.76), highlighting the crucial role of SOC in enhancing soil fertility, promoting nutrient availability, and improving soil structural stability. Stepwise regression analysis showed that NO₃⁻–N (~73%), P₂O₅, SOC, and K₂O together explained 93% of the variation in kiwifruit yield (R² = 0.93, P < 0.001). Fertilization significantly improved kiwifruit productivity and fruit quality. In non-degraded soil, yield increased from 7004 to 20,139 kg ha⁻¹ under Base + N150treatment; however, the increase over Base + N120 was small and non-significant. Urea generally resulted in higher yield, better fruit quality, and greater NUE than ammonium nitrate, particularly under non-degraded soil conditions. The highest NUE was observed under the urea N120 treatment (0.99), whereas NUE declined at higher nitrogen application rates. Integrated fertilization also reduced the productivity gap between degraded and non-degraded soils, demonstrating its restorative potential for degraded acidic Luvisols. The combi-nation of compost (30 t ha⁻¹) and a moderate nitrogen application rate (N120), particularly in urea form, represented the most effective strategy for improving soil fertility, enhancing kiwifruit yield and quality, increasing economic return, and reducing possible environmental risks under humid subtropical conditions.
Keywords:
Actinidia deliciosa
; integrated fertilization
; Luvisols
; soil organic carbon
; aggregate stability
; nutrient use efficiency
; kiwifruit
; urea
; ammonium nitrate
; subtropical agriculture
1. Introduction
The Lankaran–Astara region, located in the southeastern part of the Republic of Azerbaijan, lies within the country’s humid subtropical zone and is characterized by high agro-climatic potential and productive soils such as Luvisols (Babayev et al., 2020; Babaev, 2025; Gulaliyev, 2024). Abundant precipitation, high relative humidity, and mild winters provide favorable conditions for the cultivation of subtropical fruit crops, particularly Actinidia deliciosa (kiwifruit). Due to its rich biochemical composition, high antioxidant capacity, and recognized nutritional value, kiwifruit is increasingly demanded in both local and international markets (Adekiya et al., 2022; Mammadzade, 2024; Müller et al., 2015; Rahman et al., 2011), making it a strategically important crop for economic development and food security.
However, long-term intensive cultivation of acidic Luvisols, especially under unbalanced fertilization practices, has resulted in progressive soil degradation (Parent et al., 2015; Peticilă et al., 2015). Declining organic matter, nutrient leaching, and reduced microbial activity have weakened soil functions, negatively affecting crop productivity, fruit quality, and agroecosystem sustainability (Rahman et al., 2011; Khachi et al., 2015). These challenges are not unique to Azerbaijan but are widely observed in intensively managed horticultural systems worldwide, emphasizing the global importance of sustainable soil fertility management. In this context, scientifically based fertilization strategies are required to restore soil productivity while maintaining environmental quality, minimizing greenhouse gas emissions, and reducing risks to surface and groundwater associated with nutrient leaching and runoff (; Tarakcioglu et al., 2007; Ferguson et al., 2012Zhao et al., 2017; Ahmed et al., 2022;).
Integrated nutrient management, based on the combined application of organic and mineral fertilizers, is widely recognized as an effective approach for improving soil quality and productivity (FAO, 2020). Such systems increase soil organic carbon (SOC), enhance aggregate stability, stimulate microbial activity, and improve nutrient cycling efficiency, thereby supporting long-term soil fertility and ecosystem functioning (Zhao et al., 2017; Ahmed et al., 2019; FAO, 2020; Jones, 2001). Organic amendments further improve soil aggregation, cation exchange capacity, and water retention, facilitating efficient nutrient uptake (Asher et al., 2008; Alley et al., 2009; Bronick et al., 2005; Mulualem et al., 2021), while balanced fertilization ensures adequate micronutrient availability and optimal plant physiological functioning (Asher et al., 2008; Boyd, 2012; Kozlova et al., 2015). In addition, long-term integrated fertilization stabilizes soil carbon dynamics, enhances enzymatic activity, and increases nutrient availability (NH₄⁺–N, NO₃⁻–N, P₂O₅, and K₂O), thereby improving soil resilience and productivity (Li, 2012; Guarconi et al., 2019). These processes are particularly important in humid subtropical acidic soils, where structural stability and nutrient mobility are key constraints for sustainable crop and horticultural production (Adekiya et al., 2022). At the same time, fertilizer efficiency and environmental outcomes are strongly influenced by site-specific factors such as soil fertility, texture, and resource availability, which regulate nutrient retention, transformation processes, and nutrient losses (Zhao, 2001; Ferguson et al., 2012; Peticilă et al., 2015; Ahmed et al., 2019; FAO, 2020).
In addition to fertilizer application rate, the form of nitrogen applied plays a critical role in determining soil processes and crop response. Urea and ammonium nitrate differ in their transformation pathways and mobility in soil. Urea is hydrolyzed to ammonium (NH₄⁺), which can be temporarily retained on soil exchange sites, whereas ammonium nitrate supplies both ammonium (NH₄⁺) and nitrate (NO₃⁻), the latter being more mobile and susceptible to leaching under humid conditions (Ahmed et al., 2019; Ferguson et al., 2012). These differences influence nitrogen use efficiency, soil biochemical processes, and environmental losses, including impacts on water quality (Tarakcioglu et al., 2007; Zhao et al., 2017). However, the comparative performance of these nitrogen sources within integrated fertilization systems under acidic Luvisols remains insufficiently explored (; Tarakcioglu et al., 2007Ferguson et al., 2012; Zhao et al., 2017 Ahmed et al., 2019).
Despite substantial advances in integrated fertilization research, region-specific evidence for humid subtropical Luvisols—particularly in the Lankaran–Astara region—remains limited. In particular, the relationships between soil organic carbon (SOC) and aggregate stability, and their implications for ecosystem services, as well as the identification of optimal nitrogen management strategies that balance productivity, resource efficiency, and environmental protection, require further investigation. It is hypothesized that the integrated application of organic and mineral fertilizers enhances soil structural and biochemical properties—particularly SOC and aggregate stability—thereby improving nutrient use efficiency, yield, and fruit quality compared with single-source fertilization. Furthermore, yield and quality responses are expected to reach an optimum at moderate nitrogen rates (e.g., N120 kg ha⁻¹), with limited additional benefits at higher rates (e.g., N150–250 kg ha⁻¹), consistent with the principle of diminishing returns in nitrogen fertilization (Ferguson et al., 2012; Zhao et al., 2017 Ahmed et al., 2019). In addition, differences between nitrogen forms (urea and ammonium nitrate) are expected to be less pronounced under integrated fertilization conditions.
Therefore, the objective of the study was: (i) to evaluate the effects of integrated organic and mineral fertilization on the agrophysical and fertility properties of acidic Luvisols, and to quantify the relationship between soil organic carbon (SOC) and aggregate stability; and (ii) to identify the optimal nitrogen fertilization strategy (urea versus ammonium nitrate) for enhancing kiwifruit yield and fruit quality under subtropical conditions.
2. Materials and Methods
2.1. Experimental Design and Soil Properties
Field experiments were established on non-degraded Luvisols (yellow pseudo-podzolic gleyic soils) located in the foothill zone at 18 m above sea level (38°40′37.04″ N, 48°47′11.21″ E), as well as on a moderately degraded kiwifruit (Actinidia deliciosa) site situated on a gently sloping (3–4°), southwest-facing terrain at 24 m above sea level (38°40′35.63″ N, 48°47′11.21″ E).In both degraded and non-degraded fields, and for the comparison of fertilizer types (urea versus ammonium nitrate), the experiment was arranged in a randomized complete block design (RCBD) with five fertilization treatments and four replications (Figure 1).
The study was conducted in four experimental units (~0.16 ha each), representing two soil degradation levels (non-degraded and moderately degraded) and two nitrogen fertilizer sources (urea and ammonium nitrate). Within each soil degradation category, separate treatment plots were established using either urea or ammonium nitrate as the nitrogen source. Detailed descriptions and abbreviations of all experimental units are provided in the caption of Figure 1. The orchard was established with a planting scheme of 4 m × 5 m (within-row × between-row spacing), corresponding to an average density of approximately 500 plants ha⁻¹. Each individual tree was considered an experimental unit; thus, a total of 20 plants (5 treatments × 4 replications × 2 site conditions: degraded and non-degraded) were used for monitoring, biometric measurements, and yield assessment. A buffer distance of 4 m was maintained between adjacent experimental units in both directions to minimize border effects (Figure 1). All agronomic practices, including irrigation, pruning, and pest and disease control, were applied uniformly across all treatments throughout the experimental period to ensure that observed differences could be attributed solely to fertilization treatments.
The soils are classified as Luvisols and are characterized by a gleyic horizon, a bleached albic horizon, and pronounced illuvial clay accumulation. They exhibit medium to heavy texture, slightly acidic to acidic reaction, and relatively high water-holding capacity and fertility. These properties enhance nutrient retention but may also increase susceptibility to structural degradation under improper nitrogen management (e.g., Mamedov et al., 2021). Consequently, the interaction between soil organic carbon (SOC) and aggregate stability in these soils is highly sensitive to fertilization practices. Soil samples were collected before the growing season and during key phenological stages (flowering, fruit development, and harvest). Also prior to fertilization, baseline soil properties were determined. At the beginning of the experiment, samples were collected using a stratified approach from genetic horizons to ensure representative characterization of the soil profile. Depth intervals of 0–20 and 20–40 cm was used to assess treatments effects on available nutrients and SOC and WSA during the growing season (Table 1).
Soil degradation primarily reduces soil quality by decreasing structural stability and soil organic carbon (SOC), while increasing compaction, with the strongest effects observed in the surface horizons (Table 1). Degradation reduces soil fertility mainly through the loss of soil organic matter (SOM) and aggregate stability, which are key regulators of nutrient storage and availability (Mamedov et al., 2021). In the topsoil (0–30 cm), SOC decreased by approximately 30%, resulting in reduced nutrient reserves. Total nitrogen declined by about 36%, while phosphorus and potassium decreased by 25–30%. More importantly, plant-available nutrient fractions were more strongly affected: available N decreased by approximately 38%, available P by 34%, and available K2O by 40%, with even greater losses observed in deeper soil layers. Mineral nitrogen, particularly NO₃⁻, also showed a marked decline, indicating reduced microbial activity and slower nutrient cyling processes. Overall, soil degradation leads to a pronounced decline in NPK fertility, driven by SOM loss and reduced nutrient availability (Table 1).
2.2. Treatments
In this study, the medium-maturing kiwifruit (Actinidia deliciosa) cultivar ‘Bruno’ was selected as the experimental plant material. Five fertilization treatments were applied to evaluate the effects of compost and mineral fertilizers on soil quality (moisture content, soil organic carbon (SOC), and aggregate stability), soil fertility (NH₄⁺, NO₃⁻, P₂O₅, and K₂O), as well as kiwifruit yield and fruit quality parameters (total sugars, titratable acidity, and vitamin C content). The experimental design included five fertilization treatments, two soil degradation levels, and two fertilizer nitrogen forms. The treatments were as follows:
(1) Control (no compost and no NPK application);
(2) Compost base: compost (30 t ha⁻¹) + P₁₅₀K₁₂₀ (N₀);
(3) Compost base + N₉₀ kg ha⁻¹;
(4) Compost base + N₁₂₀ kg ha⁻¹;
(5) Compost base + N₁₅₀ kg ha⁻¹.
The “Lankaran” compost consisted of cattle manure (40%), tea and vegetable residues (30%), household organic waste (20%), and poultry manure (8%), supplemented with mineral additives (1–1.5% superphosphate and ammonium sulfate), ensuring a balanced C:N ratio and gradual nutrient mineralization. The compost was used as an organic baseline treatment to enhance soil organic carbon (SOC), microbial activity, and structural stability. On this background, nitrogen fertilizers were applied as ammonium nitrate (34.5% N) and urea (46% N) at rates of 90, 120, and 150 kg ha⁻¹ (active ingredient), while phosphorus and potassium were supplied as single superphosphate (18% P₂O₅) and potassium sulfate (48% K₂O), respectively. Cmpost was applied at the full prescribed rate in autumn and incorporated into the soil to a depth of 20–25 cm. Nitrogen was applied in split doses (50% in early spring, 25% at pre-flowering, and 25% during fruit development). Phosphorus was applied at 80% in autumn and 20% during fruit development, whereas potassium was applied at 80% in early spring and 20% during fruit development.t.
2.3. Soil and Plant Analyses
Soil analyses (texture, CEC, pH, organic carbon (SOC), NH₄⁺-N, NO₃⁻-N, P₂O₅, and K₂O) and plant measurements (biometric parameters and phenological stages, including budburst, flowering, fruit development, and vegetation period; yield and nutrient use efficiency (NUE); and fruit quality attributes such as total sugars, titratable acidity, and ascorbic acid content) were conducted following standard procedures described in Soil and Plant Analysis (Jones, 2001) and Food Analysis (Nielsen, 2017).
2.4. Statistical Analysis
Statistical analysis (Table 2 and Table 3) including analysis of variance (ANOVA), Tukey’s HSD post hoc test group (means separation), correlation analysis, stepwise regression, and linear regression, was performed using JMP 19 software (JMP Statistical Discovery LLC, 2025). When the soil degradation × treatment interaction for instance) was not significant (p > 0.05), only the main effects were presented, with values expressed as means ± standard deviation (SD) averaged across the levels of the other factor. When a significant soil degradation × treatment interaction was detected (p ≤ 0.05), results were presented and interpreted for each soil degradation–treatment combination (Table 2 and Table 3).
3. Results
3.1. Soil Available Nutrient Dynamics Under Fertilization
Soil available nutrients (NH₄⁺–N, NO₃⁻–N, available P₂O₅, and exchangeable K₂O) were significantly affected by soil degradation level, fertilization treatment, and kiwifruit phenological stage (Table 4). Across all sampling periods, non-degraded (ND) soil consistently exhibited higher nutrient concentrations than moderately degraded (MD) soil, indicating that soil degradation reduced nutrient retention and availability within the root zone. At the bud stage, nutrient concentrations were generally highest in both soils. In non-degraded (ND) soil, NH₄⁺–N increased from 29.5 mg kg⁻¹ in the control treatment to 37.5 mg kg⁻¹ under Base + N150, while NO₃⁻–N increased from 5.5 to 7.5 mg kg⁻¹. Available P₂O₅ and K₂O also increased, reaching 74.8 and 134.0 mg kg⁻¹, respectively. In moderately degraded (MD) soil, similar trends were observed, although nutrient concentrations remained lower than in ND soil. Under Base + N150, NH₄⁺–N increased from 24.5 to 32.5 mg kg⁻¹ and NO₃⁻–N from 3.0 to 6.8 mg kg⁻¹, while P₂O₅ and K₂O reached 63.0 and 128.5 mg kg⁻¹, respectively (Table 5).
During the flowering stage, mineral nitrogen concentrations declined in both soils, reflecting increased nutrient uptake during active vegetative and reproductive growth. Nevertheless, fertilized treatments maintained higher NH₄⁺–N and NO₃⁻–N concentrations than the control. In ND soil, NH₄⁺–N ranged from 27.5 to 35.5 mg kg⁻¹, whereas in MD soil it ranged from 25.0 to 33.0 mg kg⁻¹. Nitrate concentrations showed similar patterns. In contrast, available P₂O₅ and K₂O varied only slightly among treatments and growth stages, indicating comparatively stable phosphorus and potassium dynamics. By the end of the growing season, nutrient concentrations further declined in both soils. However, integrated fertilization treatments, particularly Base + N120 and Base + N150, maintained higher NH₄⁺–N and NO₃⁻–N levels compared with the control. In ND soil, NH₄⁺–N ranged from 22.5 to 29.5 mg kg⁻¹, while in MD soil it ranged from 19.0 to 28.5 mg kg⁻¹. Potassium values changed only slightly, especially in degraded soil, suggesting reduced nutrient retention efficiency under degraded conditions (Table 5).
Analysis of variance showed that soil degradation (D), fertilization treatment (T), and phenological stage (S) significantly affected soil nutrient availability (Table 3). Soil degradation had a highly significant effect on NH₄⁺–N, NO₃⁻–N, and P₂O₅ (P < 0.001), whereas its effect on K₂O was not significant. Fertilization treatment significantly influenced NH₄⁺–N, NO₃⁻–N, and P₂O₅, while its effect on K₂O was comparatively weaker. Among all factors, phenological stage exerted the strongest influence, significantly affecting all measured nutrients. Interaction effects revealed that the D × T interaction significantly affected NO₃⁻–N, whereas D × S significantly influenced NH₄⁺–N and NO₃⁻–N. The T × S × D interaction had a significant effect only on NO₃⁻–N. In contrast, most interaction effects on P₂O₅ and K₂O were not significant, indicating relatively stable phosphorus and potassium dynamics across treatments and growth stages (Table 2).
The results demonstrated that soil degradation reduced nutrient availability throughout the kiwifruit growing season, whereas integrated fertilization improved nutrient supply in both soils. The response to fertilization was more pronounced in non-degraded soil, reflecting its greater nutrient retention capacity and more favorable soil conditions. Although the highest nutrient concentrations were generally observed under Base + N150, the differences between N120 and N150 were relatively small, suggesting that N120 may represent a more efficient and agronomically optimal nitrogen application rate (Table 6).
3.2. Effects of f Treatments on Soil Quality and Fertility, Plant Yield and Fruit Quality
3.2.1. Effects of Fertilization Treatments on Soil Quality and Fertility
Soil quality and fertility indicators (mean for two year) were significantly affected by both soil degradation level and fertilization treatment (Table 6). Non-degraded (ND) soil consistently exhibited higher soil organic carbon (SOC), water-stable aggregates (WSA), and nutrient concentrations than moderately degraded (MD) soil. In ND soil, SOC increased from 1.54% in the control to 1.94% under Base + N150. Similarly, NH₄⁺–N increased from 30 to 38 mg kg⁻¹, NO₃⁻–N from 6 to 8 mg kg⁻¹, P₂O₅ from 60 to 75 mg kg⁻¹, and K₂O from 120 to 134 mg kg⁻¹. Water-stable aggregates also improved under fertilization, reaching 81% under both Base + N120 and Base + N150. In MD soil, fertilization likewise improved soil quality indicators, although values remained consistently lower than in ND soil. SOC increased from 1.09% in the control to 1.61% under Base + N150, while WSA increased from 60% to 70% under Base + N120. NH₄⁺–N increased from 25 to 33 mg kg⁻¹, NO₃⁻–N from 3 to 7 mg kg⁻¹, and K₂O from 115 to 129 mg kg⁻¹. Available P₂O₅ showed only minor variation among treatments but remained generally lower than in ND soil (Table 6).
Analysis of variance showed that soil degradation significantly affected SOC, WSA, NH₄⁺–N, and NO₃⁻–N, whereas its effect on P₂O₅ and K₂O was not significant (Table 3) Fertilization treatment significantly influenced SOC, NH₄⁺–N, NO₃⁻–N, and P₂O₅, while its effect on WSA was comparatively weaker and its effect on K₂O was not significant. The degradation, treatment and degradation × treatment interaction significantly affected only for NO₃⁻–N, indicating that fertilizer responses differed between degraded and non-degraded soils (Table 3; Figure 2).
Analysis of variance showed that soil degradation significantly affected SOC, WSA, NH₄⁺–N, and NO₃⁻–N, whereas its effect on P₂O₅ and K₂O was not significant (Table 3a) Fertilization treatment significantly influenced SOC, NH₄⁺–N, NO₃⁻–N, and P₂O₅, while its effect on WSA was comparatively weaker and its effect on K₂O was not significant. The degradation, treatment and degradation × treatment interaction significantly affected only for NO₃⁻–N, indicating that fertilizer responses differed between degraded and non-degraded soils (Table 3a; Figure 2).
Integrated fertilization improved soil quality and fertility in both soils, with stronger responses observed in non-degraded soil. Higher nitrogen rates generally increased nutrient concentrations and SOC; however, the differences between N120 and N150 were relatively small, suggesting limited additional benefit from excessive nitrogen application.
Significant positive relationships between soil organic carbon (SOC) and all soil fertility parameters were observed (Figure 3).
As SOC increased from approximately 1.0% to 2.1%, NH₄⁺–N, NO₃⁻–N, P₂O₅, K₂O, and water-stable aggregates (WSA) increased consistently. The strongest relationship was observed between SOC and NH₄⁺–N (R² = 0.92), where NH₄⁺–N increased from approximately 24–26 to 38–40 mg kg⁻¹.SOC also showed a strong positive effect on NO₃⁻–N (R² = 0.84), with nitrate concentrations increasing from about 2–3 to 8–9 mg kg⁻¹. Available P₂O₅ increased from approximately 50–55 to 78–82 mg kg⁻¹ with increasing SOC (R² = 0.82), while WSA rose from about 55–58% to 85–88% (R² = 0.76), indicating improved soil structural stability. The weakest but still positive relationship was observed for K₂O (R² = 0.53), where values increased from approximately 105–110 to 140–145 mg kg⁻¹.Overall, higher SOC significantly enhanced both soil fertility and physical quality indicators(Figure 3).
Kiwifruit yield, fruit quality, and economic return were significantly influenced by soil degradation and fertilization treatment (Table 7). Across all treatments, non-degraded (ND) soil consistently produced higher yield and superior fruit quality compared with moderately degraded (MD) soil. In ND soil, yield increased from 7,0004 kg ha⁻¹ in the control to 20,14 kg ha⁻¹ under Base + N150. Total sugar (TS) increased from 7% in the control to 11% under both Base + N120 and Base + N150, while ascorbic acid (AA) increased from 95 to 107 mg 100 g⁻¹. In contrast, titratable acidity (TA) decreased from 2.0 in the control to 1.0 under higher nitrogen treatments. Economic return also increased substantially, from 11,21 to 29,17 AZN ha⁻¹ under Base + N150.In MD soil, yield increased from 6,27 kg ha⁻¹ in the control to 13,78 kg ha⁻¹ under Base + N150. Fruit quality also improved with fertilization: TS increased from 6% to 10%, while AA increased from 85 to 100 mg 100 g⁻¹. Income rose from 10,027 to approximately 19,24 AZN ha⁻¹ under Base + N90, although differences among higher nitrogen rates were relatively small (Table 7).
Analysis of variance showed that soil degradation significantly affected yield, total sugars (TS), ascorbic acid (AA), and income, whereas its effect on titratable acidity (TA) was not significant (Table 3b). Fertilization treatment significantly influenced all measured parameters. Significant degradation × treatment interactions for yield, TA, and income indicated that treatment responses differed between non-degraded (ND) and moderately degraded (MD) soils. Integrated fertilization substantially improved kiwifruit productivity, fruit quality, and economic return in both soils. The highest yield and income values were observed under Base + N150 in ND soil; however, differences between N120 and N150 were comparatively small, suggesting that N120 may provide a more efficient balance between productivity and fertilizer input (Table 7).
3.2.2. Relations Between Kiwi Yield, Soil Quality and Fertility
Correlation analysis revealed strong positive relationships among soil quality parameters, nutrient availability, kiwifruit yield, fruit quality, and income (Table 8).
Soil organic carbon (SOC) showed strong positive correlations with water-stable aggregates (WSA) (r = 0.87***), NH₄⁺–N (r = 0.96***), NO₃⁻–N (r = 0.92***), yield (r = 0.84***), total sugars (TS) (r = 0.88***), ascorbic acid (AA) (r = 0.89***), and income (r = 0.85***).NO₃⁻–N was also strongly correlated with yield (r = 0.85***), TS (r = 0.95***), AA (r = 0.83***), and income (r = 0.84***), highlighting the important role of nitrate availability in supporting kiwifruit productivity and fruit quality. Yield further showed strong positive correlations with TS (r = 0.92***), AA (r = 0.74***), and income (r = 0.99***) (Table 8).
Stepwise regression analysis identified NO₃⁻–N as the most influential predictor of the response variable, explaining 72.9% of the total variation (R² = 0.73, p = 0.001). Inclusion of P₂O₅ in the second step substantially improved model performance, increasing the explained variance to 91.6% and reducing both AICc and BIC values. Subsequent addition of SOC and K₂O further improved model fit, resulting in a final model with R² = 0.938 and lower information criterion values, indicating enhanced model adequacy (Table 9).
Although NH₄⁺–N and WSA slightly increased the coefficient of determination to 0.940, their effects were not statistically significant (p = 0.250), while both AICc and BIC values increased compared with Step 4. This indicates that inclusion of these variables did not meaningfully improve model performance and may reflect overparameterization. Therefore, the Step 4 model, which included NO₃⁻–N, P₂O₅, SOC, and K₂O, wwas considered optimal due to its high explanatory power and lower information criterion values (Table 9). The stepwise regression analysis indicated that kiwifruit yield was significantly associated with key soil fertility indicators, as described by the following regression model:
The regression model (1) developed through stepwise variable selection explained 93% of the total variation in kiwifruit yield (R² = 0.93, P < 0.001). Stepwise regression identified NO₃⁻–N (0.73)as the primary predictor (Figure 2 and Figure 3), followed by P₂O₅, SOC, and K₂O, which together substantially improved model performance. Among the evaluated variables, SOC and NO₃⁻–N showed the strongest positive contributions to yield, highlighting their key roles in enhancing kiwifruit productivity (Table 9).
3.3. N-Fertilizer Type (Urea vs Ammonium Nitrate-AN) Effect on Yield, Nutrient Use Efficiency (NUE) and Fruit Quality
Nitrogen fertilizer type significantly affected kiwifruit yield, nutrient use efficiency (NUE), and several fruit quality parameters under both non-degraded (ND) and moderately degraded (MD) soils (Table 4 and Table 10). Analysis of variance showed that soil degradation (D), fertilizer type (F), and treatment (T) significantly affected yield and nutrient use efficiency (NUE) (Table 4). Soil degradation had significant effects on all measured variables, with highly significant influences on yield, NUE, total sugars (TS), and ascorbic acid (AA), whereas its effect on titratable acidity (TA) was weaker. Fertilizer type significantly affected yield, NUE, and TA, while its effects on TS and AA were not significant. Treatment effects were highly significant for all measured parameters. Significant D × T interactions for yield, NUE, and TA indicated that treatment responses differed between degraded and non-degraded soils. D×T×F interaction effect was significant for yield (Table 4). In contrast, higher-order interactions involving fertilizer type were not significant, suggesting relatively consistent fertilizer responses across soil degradation levels (Table 4). The results indicated that urea fertilization generally provided greater improvements in yield, fruit quality, and NUE than ammonium nitrate, particularly under non-degraded soil conditions. However, NUE declined at the highest nitrogen application rates, indicating reduced fertilizer efficiency under excessive nitrogen inputs. Among the evaluated treatments, base + N120 appeared(comparable with Base+ N150) to provide the most balanced combination of high yield, improved fruit quality, and efficient nitrogen utilization (Table 10; Figure 4;).
In general, urea application resulted in higher yield, total sugars (TS), ascorbic acid (AA), and NUE values than ammonium nitrate (AN), particularly under ND soil conditions. In ND soil, yield increased progressively with increasing nitrogen application rates for both fertilizer types. Under urea fertilization, yield increased from 7,004 kg ha⁻¹ in the control to 20,139 kg ha⁻¹ under Base + N150, whereas AN fertilization produced 16,637 kg ha⁻¹ at the same nitrogen rate. Total sugars increased from 7.0% in the control to 10.9% under urea Base + N150, while AA increased from 95.0 to 106.8 mg 100 g⁻¹. Under AN fertilization, TS and AA reached 10.3% and 105.0 mg 100 g⁻¹, respectively. Titratable acidity (TA) generally decreased with increasing nitrogen rates, declining from 1.8 in the control to 1.3 under higher nitrogen treatments (Table 10).
In MD soil, overall yield and fruit quality values were lower than in ND soil, indicating the negative impact of soil degradation on kiwifruit productivity. Nevertheless, fertilization substantially improved plant performance compared with the control. Under urea fertilization, yield increased from 6,267 kg ha⁻¹ in the control to 13,777 kg ha⁻¹ under Base + N150, whereas AN fertilization produced a maximum yield of 13,577 kg ha⁻¹ under Base + N120. Total sugars increased from 5.5% in the control to 10.0% under urea Base + N150, while AA increased from 85.0 to 99.5 mg 100 g⁻¹. Under AN fertilization, TS and AA reached 9.5% and 96.4 mg 100 g⁻¹, respectively (Table 10).
Nutrient use efficiency differed markedly between fertilizer types and nitrogen rates. In ND soil, the highest NUE under urea was observed at Base + N120 (0.99), followed by a decline at N150 (0.88), indicating reduced efficiency at excessive nitrogen input. Under AN fertilization, NUE values were consistently lower, decreasing from 0.91 at N90 to 0.64 at N150. Similar trends were observed in MD soil, where NUE declined with increasing nitrogen rates for both fertilizer types. The highest NUE values in MD soil were recorded under Base + N90 for both urea (0.82) and AN (0.80), while the lowest values occurred under N150 (Table 10).
4. Discussion
The present study provides strong evidence that integrated organo-mineral fertilization significantly improves soil quality, nutrient availability, kiwifruit productivity, fruit quality, and economic return in acidic Luvisols under humid subtropical conditions (FAO, 2020; Lehmann et al., 2020). The combined application of compost and mineral nitrogen enhanced soil organic carbon (SOC), water-stable aggregates (WSA), and nutrient availability, which were directly associated with higher yield and improved fruit quality and income (Table 1, Table 2, Table 3, Table 4, Table 5, Table 6, Table 7, Table 8, Table 9 and Table 10; Figure 2, Figure 3 and Figure 4). The results further demonstrated that soil degradation reduced nutrient retention, soil fertility, and productivity; however, integrated fertilization partially restored soil functionality and reduced the productivity gap between degraded and non-degraded soils.
4.1. SOC and Aggregate Stability as Drivers of Soil Restoration
The present study demonstrated that integrated organo-mineral fertilization substantially improved soil quality in acidic Luvisols by increasing soil organic carbon (SOC) and enhancing water-stable aggregates (WSA). These improvements were observed in both non-degraded and moderately degraded soils, although the relative response was stronger under degraded conditions, highlighting the important restorative role of integrated fertilization in structurally impaired soils. These findings support the concept that combined organic amendments and balanced mineral fertilization enhance soil resilience and improve long-term soil functioning in humid subtropical orchard systems (Six et al., 2004; Bronick & Lal, 2005; FAO, 2020; Mamedov et al., 2021).
The strong positive relationship between SOC and WSA confirms that SOC acts as a key regulator of soil structural stability. Increased SOC likely stimulated microbial activity and promoted the formation of organo-mineral complexes and microbial binding agents, which contributed to aggregate formation and stabilization. Improved aggregation enhances pore continuity, water infiltration, aeration, and resistance to erosion, while simultaneously protecting organic matter from rapid mineralization (Six et al., 2004; Cotrufo et al., 2019). These mechanisms are particularly important in acidic Luvisols, where structural degradation and organic matter depletion can rapidly reduce soil productivity under intensive cultivation.
The stronger relative improvement observed in degraded soils suggests that integrated fertilization can partially reverse degradation-induced declines in soil functionality. Organic amendments likely compensated for reduced native organic matter by supplying carbon substrates that stimulated biological activity and improved soil physical properties. However, despite these improvements, degraded soils still maintained lower SOC and WSA values than non-degraded soils, indicating that restoration of degraded Luvisols is a gradual process requiring continuous organic matter inputs and long-term management (Lal, 2015; Bünemann et al., 2018).
The observed SOC accumulation also has broader implications for sustainable land management and climate resilience (Mammadzadeh, 2024). Increased SOC enhances nutrient retention, buffering capacity, and water-holding capacity, thereby improving soil resistance to climatic variability and reducing the vulnerability of orchard systems to degradation processes (Lehmann et al., 2020). Thus, integrated fertilization not only improves productivity but also contributes to long-term soil conservation and ecosystem sustainability.
4.2. Nutrient Dynamics and Soil Fertility Enhancement
Integrated fertilization significantly improved nutrient availability throughout the kiwifruit growing season, indicating enhanced soil fertility and nutrient cycling efficiency. The combined application of compost and mineral fertilizers increased the availability of NH₄⁺–N, NO₃⁻–N, P₂O₅, and K₂O in both degraded and non-degraded soils. These effects were closely associated with increased soil organic carbon (SOC), which likely improved nutrient retention, microbial activity, and nutrient transformation processes.The strong relationships observed between SOC and mineral nitrogen fractions indicate that organic matter played a central role in regulating nitrogen cycling and nutrient availability. Compost addition likely enhanced microbial biomass and cation exchange capacity, thereby improving ammonium retention and supporting gradual nitrogen mineralization. Increased SOC may also have reduced nutrient losses through leaching by improving aggregate stability and soil water retention (Lehmann & Kleber, 2015; Bünemann et al., 2018). These mechanisms are particularly important under humid subtropical conditions, where intense rainfall can accelerate nutrient leaching and reduce fertilizer efficiency.
The positive relationships between SOC and available phosphorus and potassium further suggest that integrated fertilization improved soil buffering capacity and nutrient synchronization with plant demand. Organic matter can reduce phosphorus fixation in acidic soils and enhance potassium retention through increased exchange capacity and aggregate formation (Alley & Vanlauwe, 2009;Mulualem et al., 2021). Consequently, integrated fertilization likely promoted a more stable and balanced nutrient supply during the growing season. Seasonal nutrient dynamics also reflected the physiological requirements of kiwifruit plants. Mineral nitrogen concentrations declined progressively from the bud stage to harvest, indicating active plant uptake during vegetative growth and fruit development. In contrast, phosphorus and potassium showed comparatively smaller seasonal variation, suggesting greater stability within the soil system. These findings emphasize the importance of synchronizing nitrogen availability with crop demand to improve nutrient use efficiency and reduce losses.
Although increasing nitrogen rates generally enhanced nutrient availability, the relatively small differences between N120 and N150 treatments indicate that excessive nitrogen inputs did not proportionally improve soil fertility. This pattern suggests declining fertilizer efficiency at higher nitrogen rates and supports the concept that moderate nitrogen application provides a more balanced strategy for maintaining soil fertility while minimizing nutrient losses and environmental risks (Zhao et al., 2017).
4.3. Fertilizers Effects on Yield, Fruit Quality, and Economic Efficiency
Integrated fertilization substantially improved kiwifruit yield, fruit quality, and economic return in both degraded and non-degraded soils. Improved nutrient availability and enhanced soil physical conditions likely stimulated vegetative growth, root activity, and fruit development, thereby increasing productivity and fruit quality parameters such as total sugars and ascorbic acid content. The higher productivity observed in non-degraded soils highlights the importance of favorable soil structural conditions and nutrient retention capacity for efficient crop response. Nevertheless, the significant yield improvements observed in degraded soils indicate that integrated fertilization can partially mitigate degradation effects and restore productive potential in acidic Luvisols.
The improvement in fruit quality under integrated fertilization may be associated with enhanced nutrient uptake and improved physiological functioning of kiwifruit plants. Adequate nitrogen supply supports chlorophyll formation and photosynthetic activity, while improved potassium availability contributes to sugar accumulation and overall fruit biochemical quality. Enhanced SOC and aggregate stability likely further supported nutrient uptake efficiency by improving root-zone conditions and soil moisture availability (Müller et al., 2015). Although higher nitrogen rates generally increased productivity, the relatively small differences between N120 and N150 treatments indicate diminishing agronomic returns at excessive nitrogen application levels. Similar responses have been reported in kiwifruit orchards and other intensive fruit production systems, where excessive nitrogen inputs stimulate vegetative growth without proportionally increasing fruit yield or quality (Parent et al., 2015; Zhao et al., 2017). The results therefore suggest that moderate nitrogen application rates provide a more efficient balance between productivity and fertilizer input.
The achieved yield levels are comparable to those reported for productive kiwifruit orchards in humid subtropical regions of China and New Zealand, where balanced nitrogen management and organic amendments substantially improved fruit production and quality (Parent et al., 2015; Zhao et al., 2017).. The optimal response observed under N120 is also consistent with previous kiwifruit fertilization studies indicating that moderate nitrogen rates maximize productivity while improving nutrient use efficiency and reducing environmental risks. Economic analysis further confirmed the agronomic advantages of integrated fertilization. Although the highest income values were generally associated with higher nitrogen application rates, the additional economic benefit beyond N120 was relatively limited when considering increased fertilizer costs and reduced nutrient use efficiency. Therefore, moderate nitrogen rates appear to be more economically sustainable for long-term orchard management.
4.4. Urea Versus Ammonium Nitrate and Nutrient Use Efficiency
The comparison of nitrogen fertilizer forms demonstrated that urea generally resulted in higher yield, improved fruit quality, and greater nutrient use efficiency (NUE) than ammonium nitrate, particularly in non-degraded soils. These findings highlight the important role of nitrogen form in regulating nutrient dynamics, nitrogen retention, and overall fertilizer efficiency in acidic Luvisols under humid subtropical conditions. The superior performance of urea may be attributed to differences in nitrogen transformation processes and rhizosphere pH dynamics. During hydrolysis, urea temporarily increases rhizosphere pH through the formation of ammonium and hydroxyl ions prior to nitrification. In acidic Luvisols, this short-term buffering effect may improve nutrient availability, stimulate microbial activity, and create more favorable conditions for root growth. In contrast, ammonium nitrate contributes more directly to proton release during nitrification, which can intensify soil acidification in the root zone and subsequently reduce root development and nitrogen uptake efficiency (Ahmed et al., 2019; Ferguson et al., 2012). Increased soil acidity may also suppress microbial activity and limit the availability of essential nutrients, thereby reducing fertilizer effectiveness.
Under humid subtropical climatic conditions, nitrate derived from ammonium nitrate is particularly vulnerable to leaching due to high rainfall and enhanced water movement through the soil profile. Because nitrate is highly mobile in soil solution, intense rainfall can accelerate its transport below the rooting zone, reducing nitrogen availability to plants and lowering fertilizer efficiency. In contrast, urea-derived ammonium can be temporarily retained on soil exchange sites prior to nitrification, improving synchronization between nitrogen release and plant demand. Similar mechanisms were described by Lehmann and Kleber (2015), who reported that organic amendments improve nutrient retention and reduce nitrogen losses in structurally degraded soils.
Integrated organo-mineral fertilization significantly influenced soil acidity, nutrient retention, and nutrient leaching dynamics in the acidic Luvisols of the study area. The combined application of compost and mineral nitrogen improved soil buffering capacity and mitigated the acidifying effects commonly associated with sole mineral fertilizer application. Long-term use of mineral nitrogen fertilizers, particularly ammonium-based sources, can accelerate soil acidification through nitrification processes that release hydrogen ions into the soil solution (Guo et al., 2010). In contrast, compost addition supplies organic matter and basic cations that help stabilize soil pH and improve soil cation exchange capacity (CEC) (Haynes and Naidu, 1998). Similar findings were reported by Agegnehu et al. (2016), who demonstrated that integrated organic and inorganic fertilization improves soil chemical properties and nutrient retention in degraded agricultural soils..
The increase in soil organic carbon (SOC) and aggregate stability observed under compost-amended treatments also contributed to greater nutrient conservation within the root zone. Improved soil aggregation reduced preferential flow pathways and enhanced nutrient adsorption and retention, particularly for nitrate and potassium, thereby decreasing nutrient losses through leaching (Blanco-Canqui and Lal, 2004). Under humid subtropical conditions, where intense rainfall frequently accelerates nutrient transport below the rooting zone, improved soil structure is especially important for maintaining nutrient availability and fertilizer efficiency.
Furthermore, compost application improved soil water-holding capacity and re-duced rapid percolation, which further limited the downward movement of soluble nutrients. Reduced nitrate leaching not only enhanced nitrogen use efficiency but also lowered the environmental risks associated with groundwater contamination (Diacono and Montemurro, 2010). Compost addition likely further promoted nitrogen retention through improved aggregation, microbial immobilization, and increased cation ex-change capacity, all of which contributed to greater nutrient conservation within the soil profile (Lehmann and Kleber, 2015). Consequently, the combined application of com-post and urea represents a more agronomically effective and environmentally sustain-able fertilization strategy for acidic Luvisols.
The decline in nutrient use efficiency (NUE) at higher nitrogen rates indicates that excessive nitrogen application reduced fertilizer efficiency regardless of fertilizer form. Similar reductions in NUE under high nitrogen inputs have been widely reported in orchard systems and are commonly associated with increased nutrient losses through leaching, volatilization, and gaseous emissions (Zhang et al., 2015; Zhao et al., 2017). The highest NUE observed under the urea N120 treatment suggests that moderate nitrogen rates more effectively synchronized nutrient supply with crop demand. In contrast, excessive nitrogen application likely exceeded plant uptake capacity, thereby increasing the proportion of nitrogen lost from the system.
The results and literatures demonstrate that urea combined with compost provides a more agronomically efficient and environmentally sustainable fertilization strategy than ammonium nitrate for acidic (soils) Luvisols under humid subtropical conditions. The integrated organo-mineral approach improved nutrient retention, reduced nitrogen losses, mitigated soil acidification, and enhanced fertilizer efficiency, thereby supporting both sustainable soil management and long-term orchard productivity.
4.5. Implications for Sustainable Soil Management
The results of this study demonstrate that integrated organo-mineral fertilization provides important agronomic, environmental, and economic benefits for sustainable kiwifruit production in acidic Luvisols. Increased soil organic carbon (SOC) and improved aggregate stability enhanced nutrient retention, strengthened soil resilience, and partially restored degraded soil functionality. These findings highlight the central role of soil carbon management in maintaining long-term productivity and sustainability in orchard ecosystems (Six et al., 2004; Rahman et Al., 2011; Lal, 2015; Parent et al., 2015; Zhao et al., 2017; Nannan et al., 2019; Lehmann et al., 2020; Mulualem, et al., 2021; Sharma et al., 2022).
The relatively small productivity gains observed beyond N120 indicate that excessive nitrogen inputs are inefficient and may increase environmental risks associated with nitrate leaching and other nitrogen losses. Therefore, moderate nitrogen application rates appear more appropriate for balancing productivity, fertilizer efficiency, and environmental protection. Optimizing nitrogen management is particularly important in humid subtropical regions, where high rainfall frequently accelerates nutrient losses and increases risks of groundwater contamination (Zhao et al., 2017; Zhang et al., 2015; FAO, 2020;).The combined application of compost and moderate nitrogen rates, particularly urea at N120, emerged as the most effective strategy for improving soil quality, enhancing nutrient use efficiency, increasing kiwifruit productivity, and mitigating degradation effects. These findings support the broader concept of integrated nutrient management as a sustainable approach for maintaining soil fertility and improving the resilience of subtropical orchard systems under intensive cultivation conditions (Agegnehu et al., 2016; Bünemann et al., 2018; Diacono & Montemurro, 2010).
5. Conclusions
This study demonstrated that integrated organo-mineral fertilization substantially improved soil quality, nutrient availability, kiwifruit productivity, fruit quality, and economic return in acidic Luvisols under humid subtropical conditions. The combined application of compost with mineral fertilizers increased soil organic carbon (SOC), aggregate stability (WSA), and the availability of NH₄⁺–N, NO₃⁻–N, P₂O₅, and K₂O in both non-degraded and moderately degraded soils, confirming the important role of integrated fertilization in restoring soil functionality and enhancing nutrient cycling processes. Strong positive relationships between SOC, aggregate stability, nutrient availability, and yield indicate that soil carbon accumulation is a key mechanism regulating soil fertility and crop productivity. Stepwise regression analysis further identified NO₃⁻–N, SOC, P₂O₅, and K₂O as the main predictors of kiwifruit yield, emphasizing the combined importance of soil quality and nutrient supply for sustainable orchard production.
Integrated fertilization significantly enhanced kiwifruit yield and fruit quality. Improvements in total sugars and ascorbic acid content reflected enhanced nutrient uptake and improved physiological performance under balanced fertilization. Although the highest yield values were generally observed under the highest nitrogen application rate, the relatively small differences between N120 and N150 indicate diminishing agronomic returns and reduced nitrogen use efficiency at excessive nitrogen inputs.Nitrogen fertilizer form also influenced system performance. Urea generally resulted in higher yield, improved fruit quality, and greater nutrient use efficiency than ammonium nitrate, particularly under non-degraded soil conditions. The superior performance of urea may be associated with more favorable nitrogen transformation dynamics and temporary rhizosphere pH buffering in acidic Luvisols, which likely improved nutrient retention and plant uptake efficiency.
Importantly, integrated fertilization reduced the productivity gap between degraded and non-degraded soils, demonstrating its potential for partial restoration of degraded acidic orchard soils. From both agronomic and environmental perspectives, the combination of compost (30 t ha⁻¹) with a moderate nitrogen application rate (N120), particularly in urea form, represented the most balanced and sustainable fertilization strategy. This approach improved soil fertility and productivity while enhancing nutrient use efficiency and reducing potential environmental risks associated with excessive nitrogen application. The findings provide a strong scientific basis for optimizing nutrient management strategies in kiwifruit orchards cultivated on acidic Luvisols and support the wider adoption of integrated fertilization practices for sustainable subtropical fruit production systems.
References
- Adekiya, A.O.; Agbede, T.M.; Ojeniyi, S.O.; Dunsin, O. Effect of organic manures on growth, yield, leaf nutrient uptake and soil physical properties of Actinidia deliciosa cv. Allison. Plants 2022, 11, 312. [Google Scholar] [CrossRef] [PubMed]
- Ahmed, W.; Liu, K.; Qaswar, M.; Huang, J.; Huang, Q.; Xu, Y.; Ali, S.; Mehmood, S.; Asghar, R.M.A.; Mahmood, S.; Zhang, H. Long-term mineral fertilization improved grain yield and phosphorus use efficiency by changing soil P fractions in Ferralic Cambisol. Agronomy 2019, 9, 784. [Google Scholar] [CrossRef]
- Albiach, R.; Canet, R.; Pomares, F.; Ingelmo, F. Organic matter components and aggregate stability after the application of different amendments to a horticultural soil. Bioresour. Technol. 2001, 76, 125–129. [Google Scholar] [CrossRef] [PubMed]
- Alley, M.M.; Vanlauwe, B. The Role of Fertilizers in Integrated Plant Nutrient Management; International Fertilizer Industry Association (IFA): Paris, France, 2009. [Google Scholar]
- Andrews, S.S.; Karlen, D.L.; Cambardella, C.A. The Soil Management Assessment Framework. Soil Sci. Soc. Am. J. 2004, 68, 1945–1962. [Google Scholar] [CrossRef]
- Asher, C.J.; Smith, G.S.; Clark, C.J.; Brown, N.S. Manganese deficiency of kiwifruit (Actinidia chinensis Planch.). J. Plant Nutr. 1984, 7, 1497–1509. [Google Scholar] [CrossRef]
- Babaev, K.Y. Agrochemical characteristics of yellow earth-pseudopodzolic soils of the Lankaran district of Azerbaijan. Bull. Sci. Pract. 2025, 11, 222–226. [Google Scholar]
- Babayev, M.P.; Ismailov, A.I.; Guseynova, S.M. The place of gleyic yellow soils of Azerbaijan in the international WRB system. Soils Environ. 2020, 3, e112. [Google Scholar] [CrossRef]
- Boyd, L. Resource Allocation in Kiwifruit (Actinidia chinensis) . Ph.D. Thesis, Massey University, Palmerston North, New Zealand, 2012. [Google Scholar]
- Bronick, C.J.; Lal, R. Soil structure and management: A review. Geoderma 2005, 124, 3–22. [Google Scholar] [CrossRef]
- Bünemann, E.K.; Bongiorno, G.; Bai, Z.; Creamer, R.E.; De Deyn, G.; de Goede, R.; Fleskens, L.; Geissen, V.; Kuyper, T.W.; Mäder, P.; et al. Soil quality—A critical review. Soil Biol. Biochem. 2018, 120, 105–125. [Google Scholar] [CrossRef]
- Carey, P.L.; Benge, J.R.; Haynes, R.J. Comparison of soil quality and nutrient budgets between organic and conventional kiwifruit orchards. Agric. Ecosyst. Environ. 2009, 132, 7. [Google Scholar] [CrossRef]
- Chen, M.; Zhang, S.; Liu, L.; Wu, L.; Ding, X. Combined organic amendments and mineral fertilizer application increase rice yield by improving soil structure, P availability and root growth in saline-alkaline soil. Soil Tillage Res. 2021, 212, 105060. [Google Scholar] [CrossRef]
- Cotrufo, M.F.; Ranalli, M.G.; Haddix, M.L.; Six, J.; Lugato, E. Soil carbon storage informed by particulate and mineral-associated organic matter. Nat. Geosci. 2019, 12, 989–994. [Google Scholar] [CrossRef]
- FAO. Soil Health and Integrated Nutrient Management in Horticulture; Food and Agriculture Organization of the United Nations: Rome, Italy, 2020. [Google Scholar]
- Ferguson, A.R.; Eiseman, J.A. Estimated annual removal of macronutrients in fruit and prunings from a kiwifruit orchard. N. Z. J. Agric. Res. 1983, 26, 115–117. [Google Scholar] [CrossRef]
- Ferreras, L.; Gomez, E.; Toresani, S.; Firpo, I.; Rotondo, R. Effect of organic amendments on some physical, chemical and biological properties in a horticultural soil. Bioresour. Technol. 2006, 97, 635–640. [Google Scholar] [CrossRef] [PubMed]
- Guarconi, L.; Ventura, F. Combined use of organic and chemical fertilizers improves soil microbial activity and ensures long-term productivity. Agric. Sci. 2019, 10, 107–115. [Google Scholar]
- Gulaliyev, C.; Kerimov, I.; Akperova, U. Analysis of yellow soils distributed in the Lankaran-Astara economic region according to granulometrical composition elements. Tech. Agrar. Sci. 2024, 4, 41–49. [Google Scholar]
- JMP Statistical Discovery LLC. JMP® Student Edition, Version 19; JMP Statistical Discovery LLC: Cary, NC, USA, 2025. [Google Scholar]
- Jones, J.B. Laboratory Guide for Conducting Soil Tests and Plant Analysis; CRC Press: Boca Raton, FL, USA, 2001. [Google Scholar]
- Karlen, D.L.; Mausbach, M.J.; Doran, J.W.; Cline, R.G.; Harris, R.F.; Schuman, G.E. Soil quality: A concept, definition, and framework for evaluation. Soil Sci. Soc. Am. J. 1997, 61, 4–10. [Google Scholar] [CrossRef]
- Khachi, B.; Sharma, S.D.; Ghumare, V.; Kumar, P.; Mir, M. Comparative efficacy of bio-organic nutrients on plant growth, leaf nutrient contents and fruit quality attributes of kiwifruit. J. Appl. Nat. Sci. 2015, 7, 175–181. [Google Scholar] [CrossRef]
- Kozlova, N.V.; Grebenyukov, S.N. Macroelement characteristics of Actinidia deliciosa fruits depending on mineral nutrition level and cultivar under cultivation in Russian subtropics. Bull. Agro-Ind. Complex Stavropol 2015, 1, 226–230. [Google Scholar]
- Lehmann, J.; Bossio, D.A.; Kögel-Knabner, I.; Rillig, M.C. The concept and future prospects of soil health. Nat. Rev. Earth Environ. 2020, 1, 544–553. [Google Scholar] [CrossRef] [PubMed]
- Lehmann, J.; Kleber, M. The contentious nature of soil organic matter. Nature 2015, 528, 60–68. [Google Scholar] [CrossRef] [PubMed]
- Li, X.H.; Han, X.Z.; Li, H.B.; Song, C.; Yan, J.; Liang, Y. Soil chemical and biological properties affected by 21-year application of composted manure with chemical fertilizers in a Chinese Mollisol. Can. J. Soil Sci. 2012, 92, 419–428. [Google Scholar] [CrossRef]
- Luo, Y.; Liang, J.; Zhou, C. Combination of mineral fertilizer with organic fertilizer improved soil phosphorus availability. 2024, 17, 2370421. [Google Scholar] [CrossRef]
- Mamedov, A.I.; Tsunekawa, A.; Tsubo, M.; Fujimaki, H.; Kawai, T.; Kebede, B.; Mulualem, T.; Abebe, G.; Wubet, A.; Levy, G.J. Soil structure stability under different land uses in association with polyacrylamide effects. Sustainability 2021, 13, 1407. [Google Scholar] [CrossRef]
- Mamedov, A.I.; Fujimaki, H.; Tsunekawa, A.; Tsubo, M.; Levy, G.J. Structure stability of acidic Luvisol: Effects of tillage type and exogenous additives. Soil Tillage Res. 2021, 206, 104832. [Google Scholar] [CrossRef]
- Mammadzade, V.T. Microbiological state of natural biotopes of Lankaran mountain forest yellow-podzolic soils. Vestn. Kurgan. State Agric. Acad. 2024, 3, 12–18. [Google Scholar]
- Müller, K.; Holmes, A.; Deurer, M.; Clothier, B.E. Eco-efficiency as a sustainability measure for kiwifruit production in New Zealand. J. Clean. Prod. 2015, 106, 333–342. [Google Scholar] [CrossRef]
- Mulualem, T.; Adgo, E.; Meshesha, D.T.; Tsunekawa, A.; Haregeweyn, N.; Tsubo, M.; Kebede, B.; Mamedov, A.I.; Masunaga, T.; Berihun, M.L. Examining the impact of polyacrylamide and other soil amendments on soil fertility and crop yield in contrasting agroecological environments. J. Soil Sci. Plant Nutr. 2021, 21, 1817–1830. [Google Scholar] [CrossRef]
- Orujova, N.H.; Babayev, M.P. Assessment of the biological activity of soils under vegetable cultures of the subtropical zone of Azerbaijan. J. Agric. Environ. 2019, 9, 1–9. [Google Scholar]
- Nannan, W.; He, H.; Christelle, L.; Cindy, M.; Liu, Z.; Ma, F. Soil fertility, leaf nutrients and their relationship in kiwifruit orchards of central Shaanxi Province, China. Soil Sci. Plant Nutr. 2019, 65, 369–376ş. [Google Scholar] [CrossRef]
- Nielsen, S.S. Food Analysis, 5th ed.; Springer: Cham, Switzerland, 2017. [Google Scholar]
- Parent, S.E.; Barlow, P.; Parent, L.E. Nutrient balances of New Zealand kiwifruit (Actinidia deliciosa cv. Hayward) at high yield level. Commun. Soil Sci. Plant Anal. 2015, 46, 256–271. [Google Scholar] [CrossRef]
- Peticilă, A.; Scăteanu, G.V.; Mădjar, R.; Stanică, F.; Aşaniţă, A. Fertilization effect on mineral nutrition of Actinidia deliciosa cultivated on different substrates. Agric. Agric. Sci. Procedia 2015, 6, 132–138. [Google Scholar] [CrossRef]
- Rahman, M.H.; Holmes, A.W.; McCurran, A.G.; Saunders, S.J. Impact of management systems on soil properties and their relationships to kiwifruit quality. Commun. Soil Sci. Plant Anal. 2011, 42, 332–357. [Google Scholar] [CrossRef]
- Sharma, S.; Rana, V.S.; Kumari, N.; Bhat, S.A.; Sharma, U.; Gudeta, K.; Alharbi, K.; Ameen, F.; Bhat, A. Effect of organic manures on growth, yield, leaf nutrient uptake and soil properties of kiwifruit (Actinidia deliciosa Chev.) cv. Allison. Plants 2022, 11, 3354. [Google Scholar] [CrossRef] [PubMed]
- Six, J.; Conant, R.T.; Paul, E.A.; Paustian, K. Stabilization mechanisms of soil organic matter: Implications for C saturation of soils. Plant Soil 2002, 241, 155–176. [Google Scholar] [CrossRef]
- Tarakcioglu, C.; Askin, T.; Cangi, R.; Duran, C. Nutritional status in some kiwifruit (Actinidia deliciosa) orchards: A case survey from the Karadeniz region of Turkey. J. Plant Sci. 2007, 2, 187–194. [Google Scholar] [CrossRef]
- Zhao, Z.P.; Duan, M.; Yan, S.; Liu, Z.F.; Wang, Q.; Fu, J.; Tong, Y.A. Effects of different fertilizations on fruit quality, yield and soil fertility in field-grown kiwifruit orchards. Int. J. Agric. Biol. Eng. 2017, 10, 162–171. [Google Scholar]
Figure 1.
Layout of the randomized complete block design (RCBD) showing the arrangement of treatments (T) in the non-degraded experimental unit. Independent randomization was also conducted for the moderately degraded experimental unit (soil area). The same plot size and experimental scheme were used for both fertilizer types; however, treatments were randomized separately within each fertilizer type.
Figure 1.
Layout of the randomized complete block design (RCBD) showing the arrangement of treatments (T) in the non-degraded experimental unit. Independent randomization was also conducted for the moderately degraded experimental unit (soil area). The same plot size and experimental scheme were used for both fertilizer types; however, treatments were randomized separately within each fertilizer type.
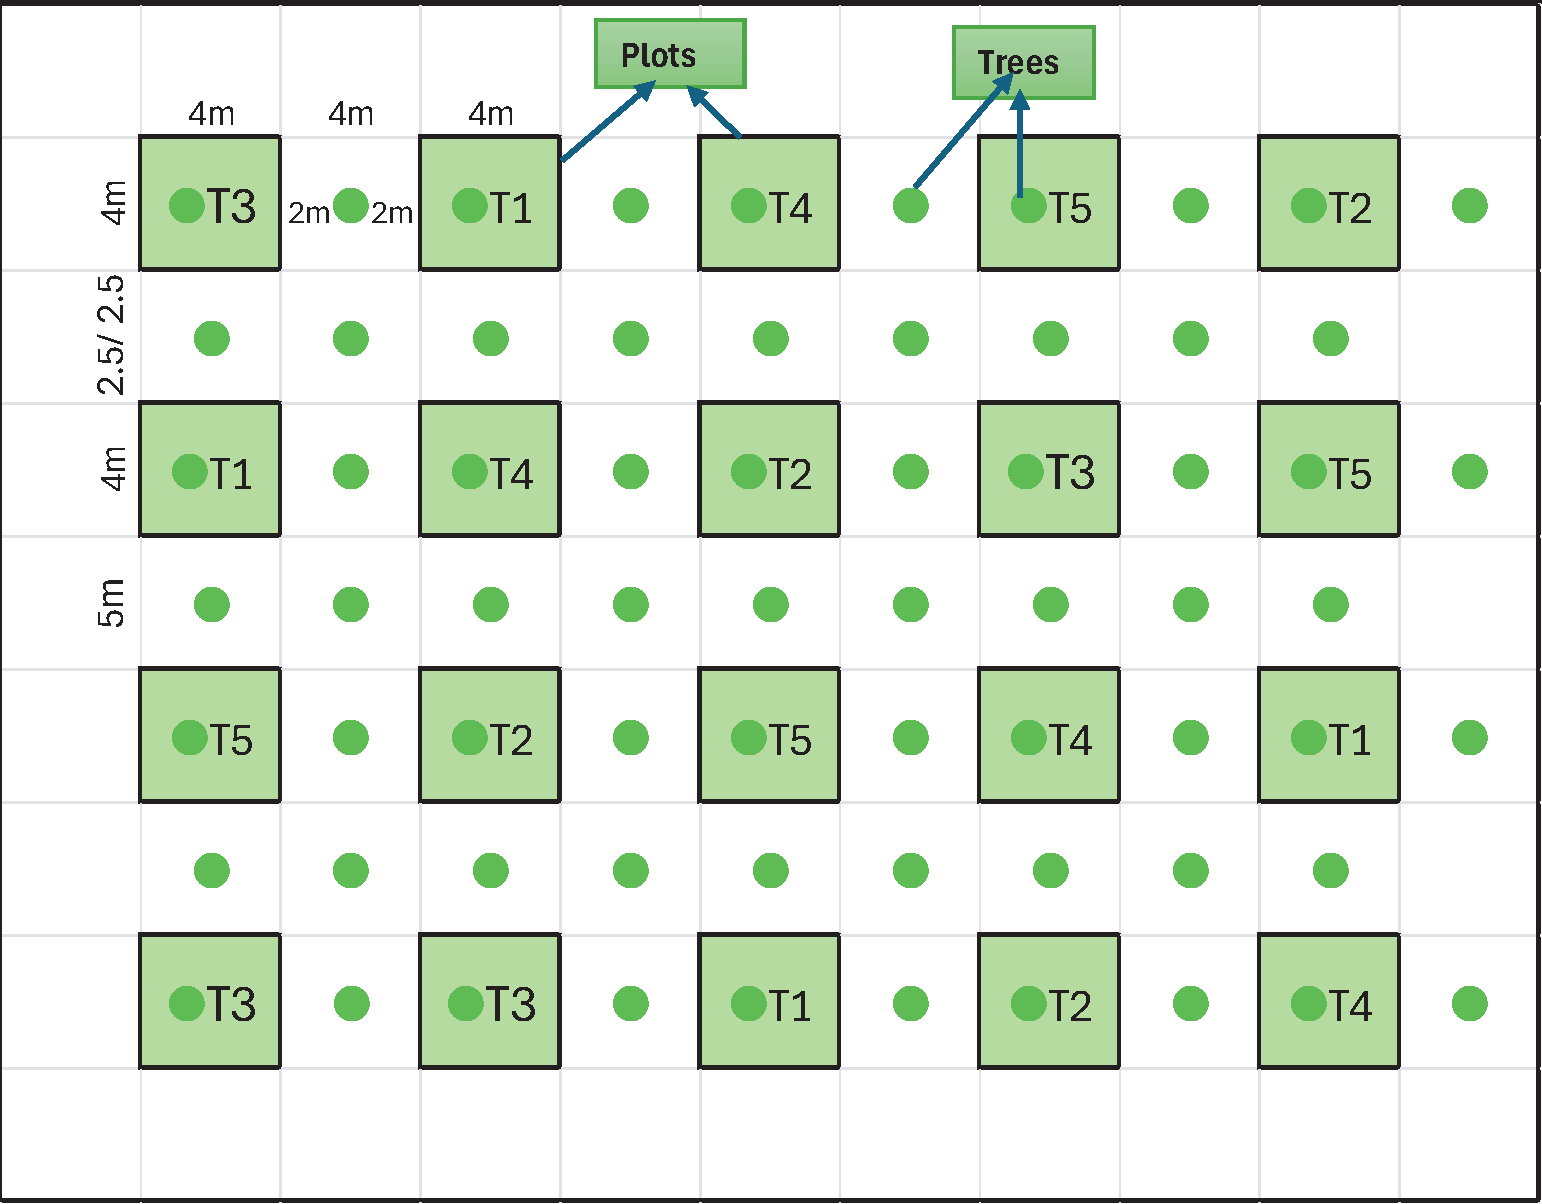
Figure 2.
Treatments effect on NO3-N (available nutrient content, mg kg-1). The columns labelled with same letter are not significantly different at p < 0.05 level. NO3-N: Non-degraded > Moderately degraded.
Figure 2.
Treatments effect on NO3-N (available nutrient content, mg kg-1). The columns labelled with same letter are not significantly different at p < 0.05 level. NO3-N: Non-degraded > Moderately degraded.
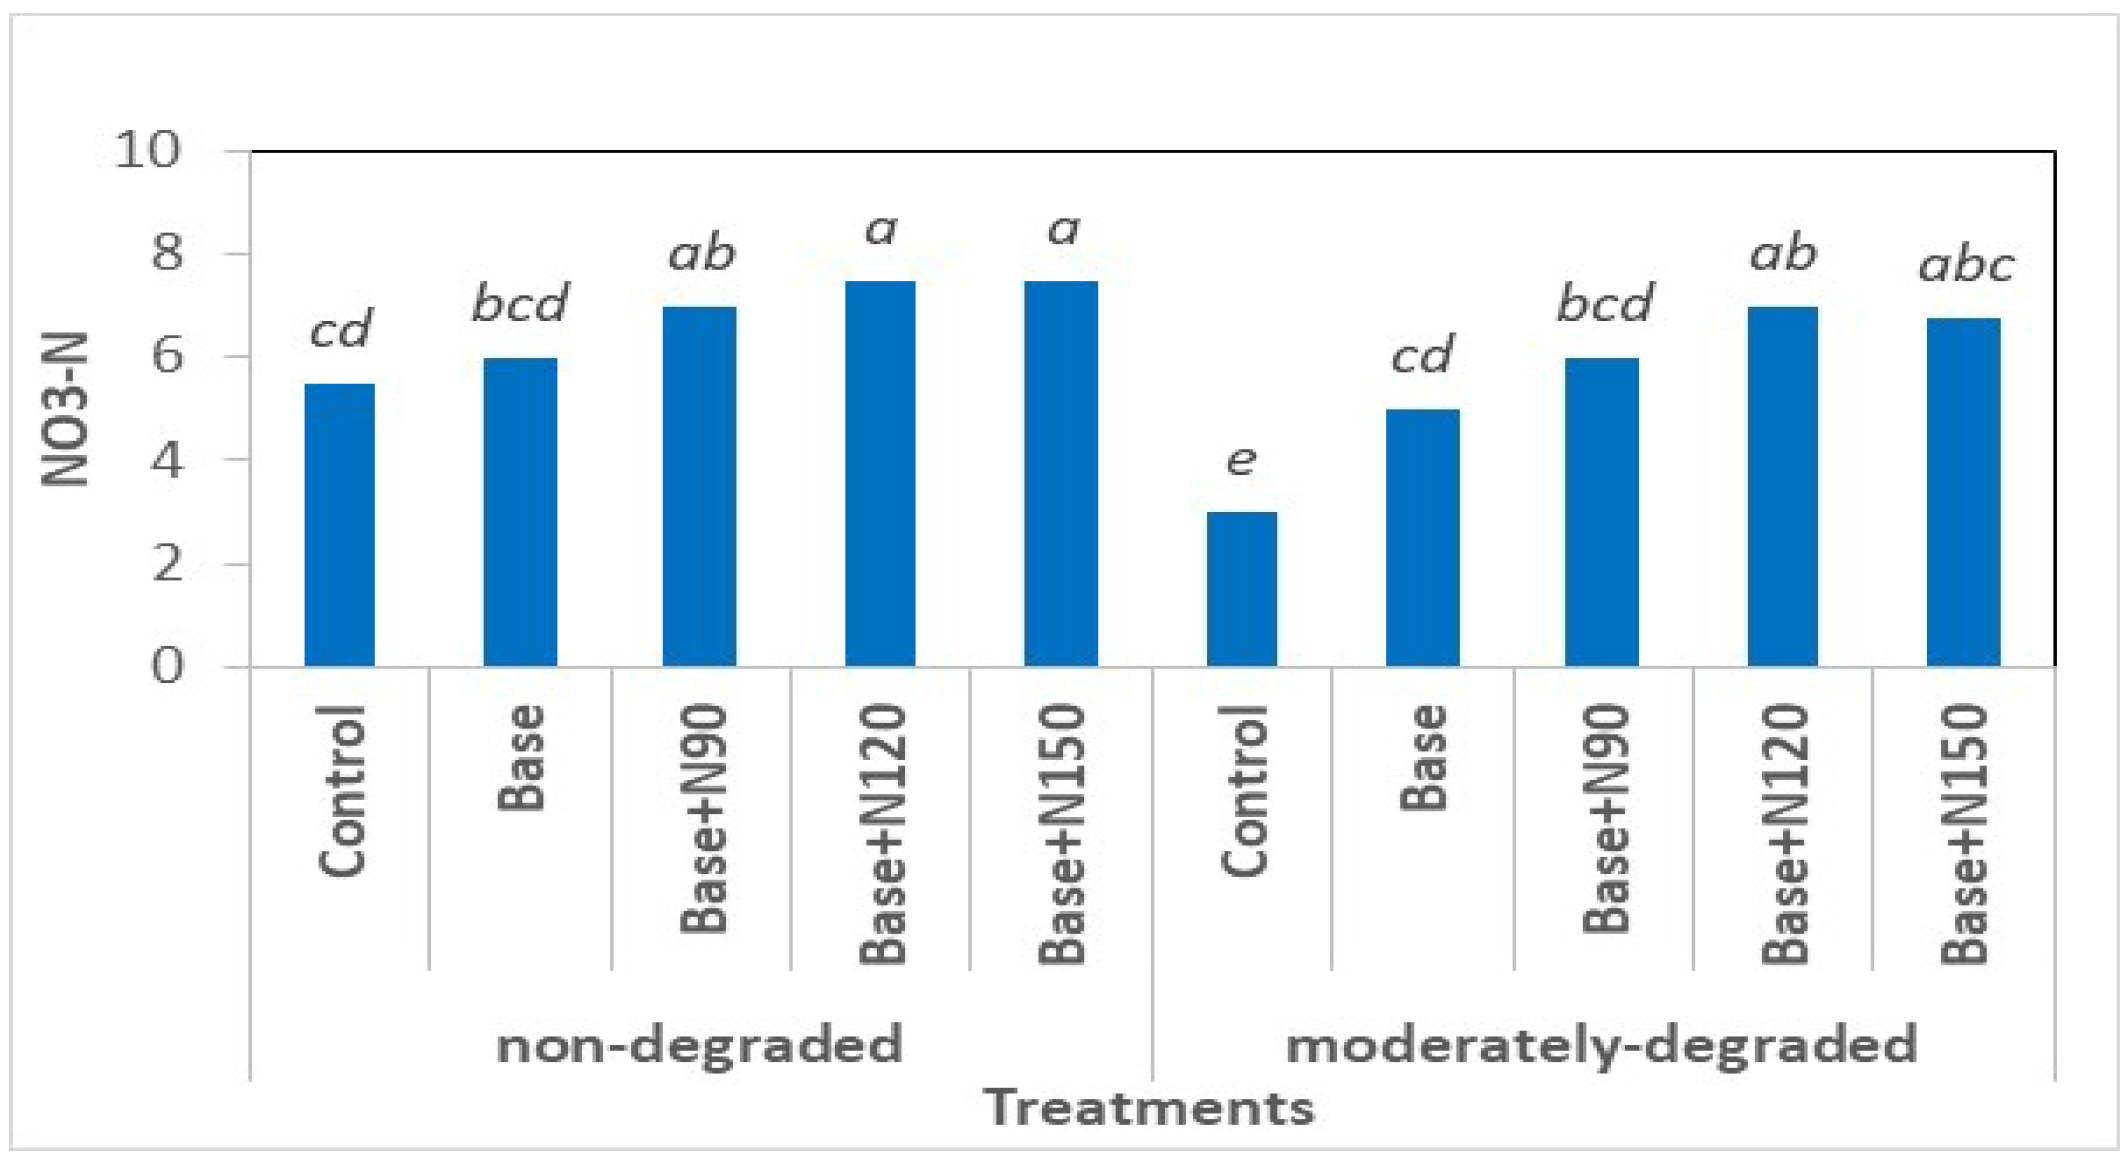
Figure 3.
Relationship between SOC, % and aggregate-structure stability (WSA, %) and fertility parameters (NH₄⁺–N, NO₃⁻–N, P₂O₅, and K2 O; mg/kg).
Figure 3.
Relationship between SOC, % and aggregate-structure stability (WSA, %) and fertility parameters (NH₄⁺–N, NO₃⁻–N, P₂O₅, and K2 O; mg/kg).
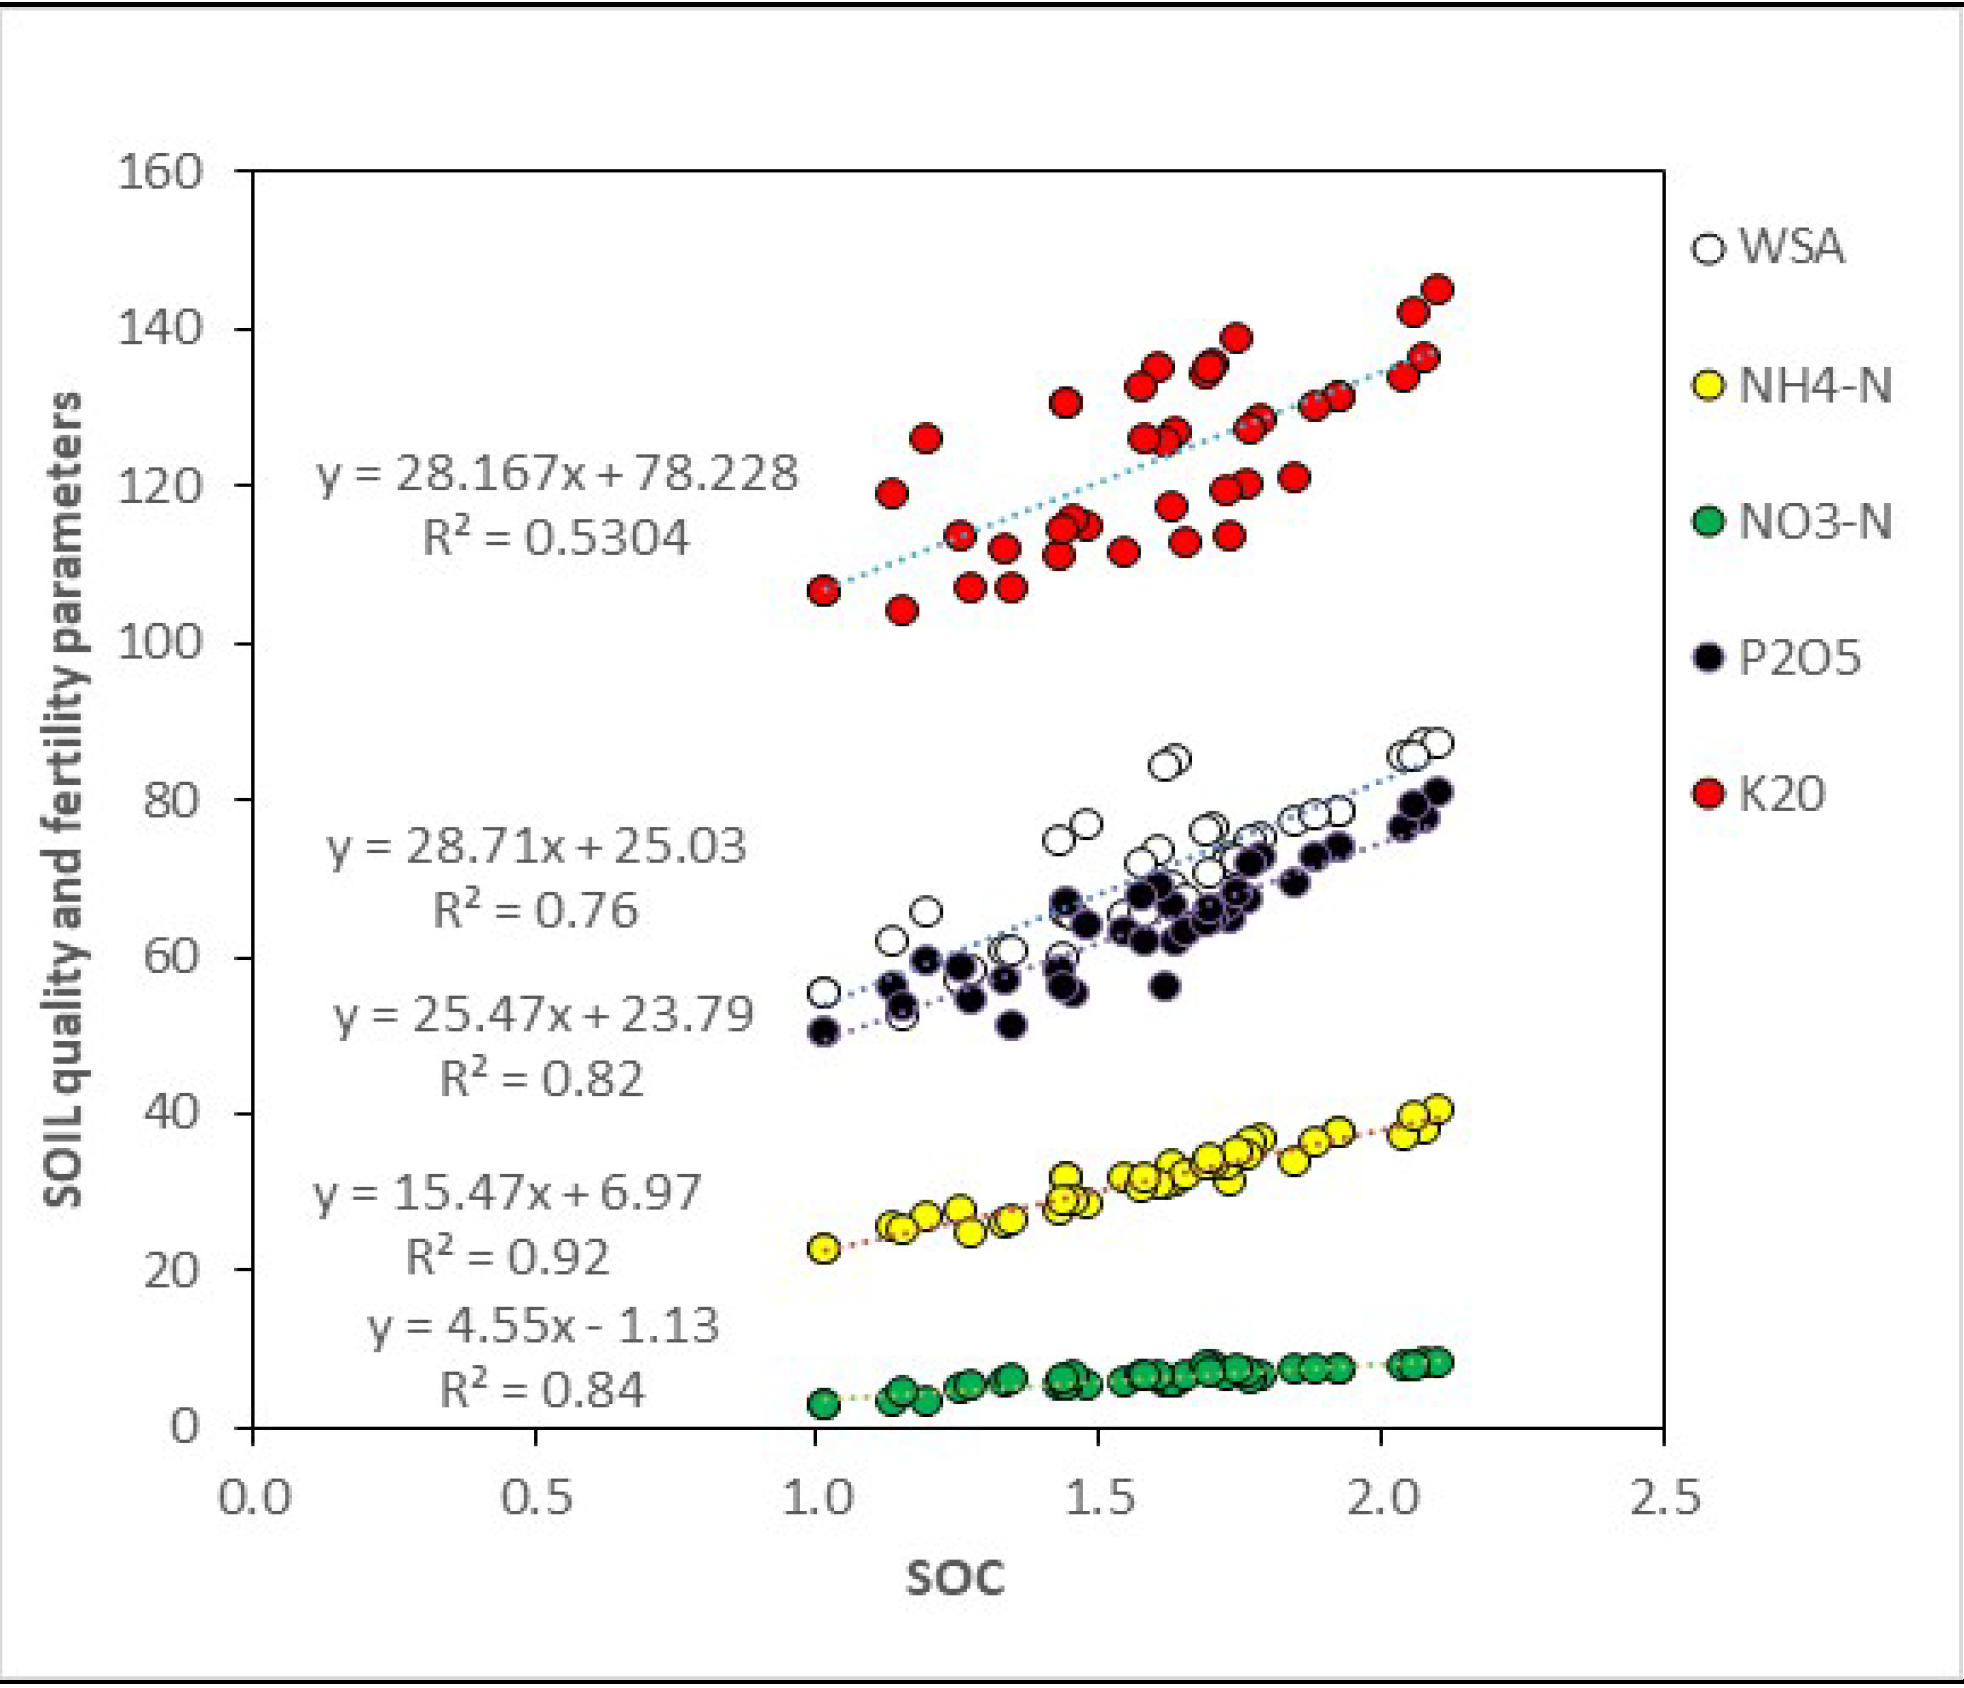
Figure 4.
Treatments interaction (DxFxT) effect on kiwifruit yield. The columns labelled with same letter are not significantly different at p < 0.05 level. Yield: Non-degraded > Moderately- degraded.
Figure 4.
Treatments interaction (DxFxT) effect on kiwifruit yield. The columns labelled with same letter are not significantly different at p < 0.05 level. Yield: Non-degraded > Moderately- degraded.
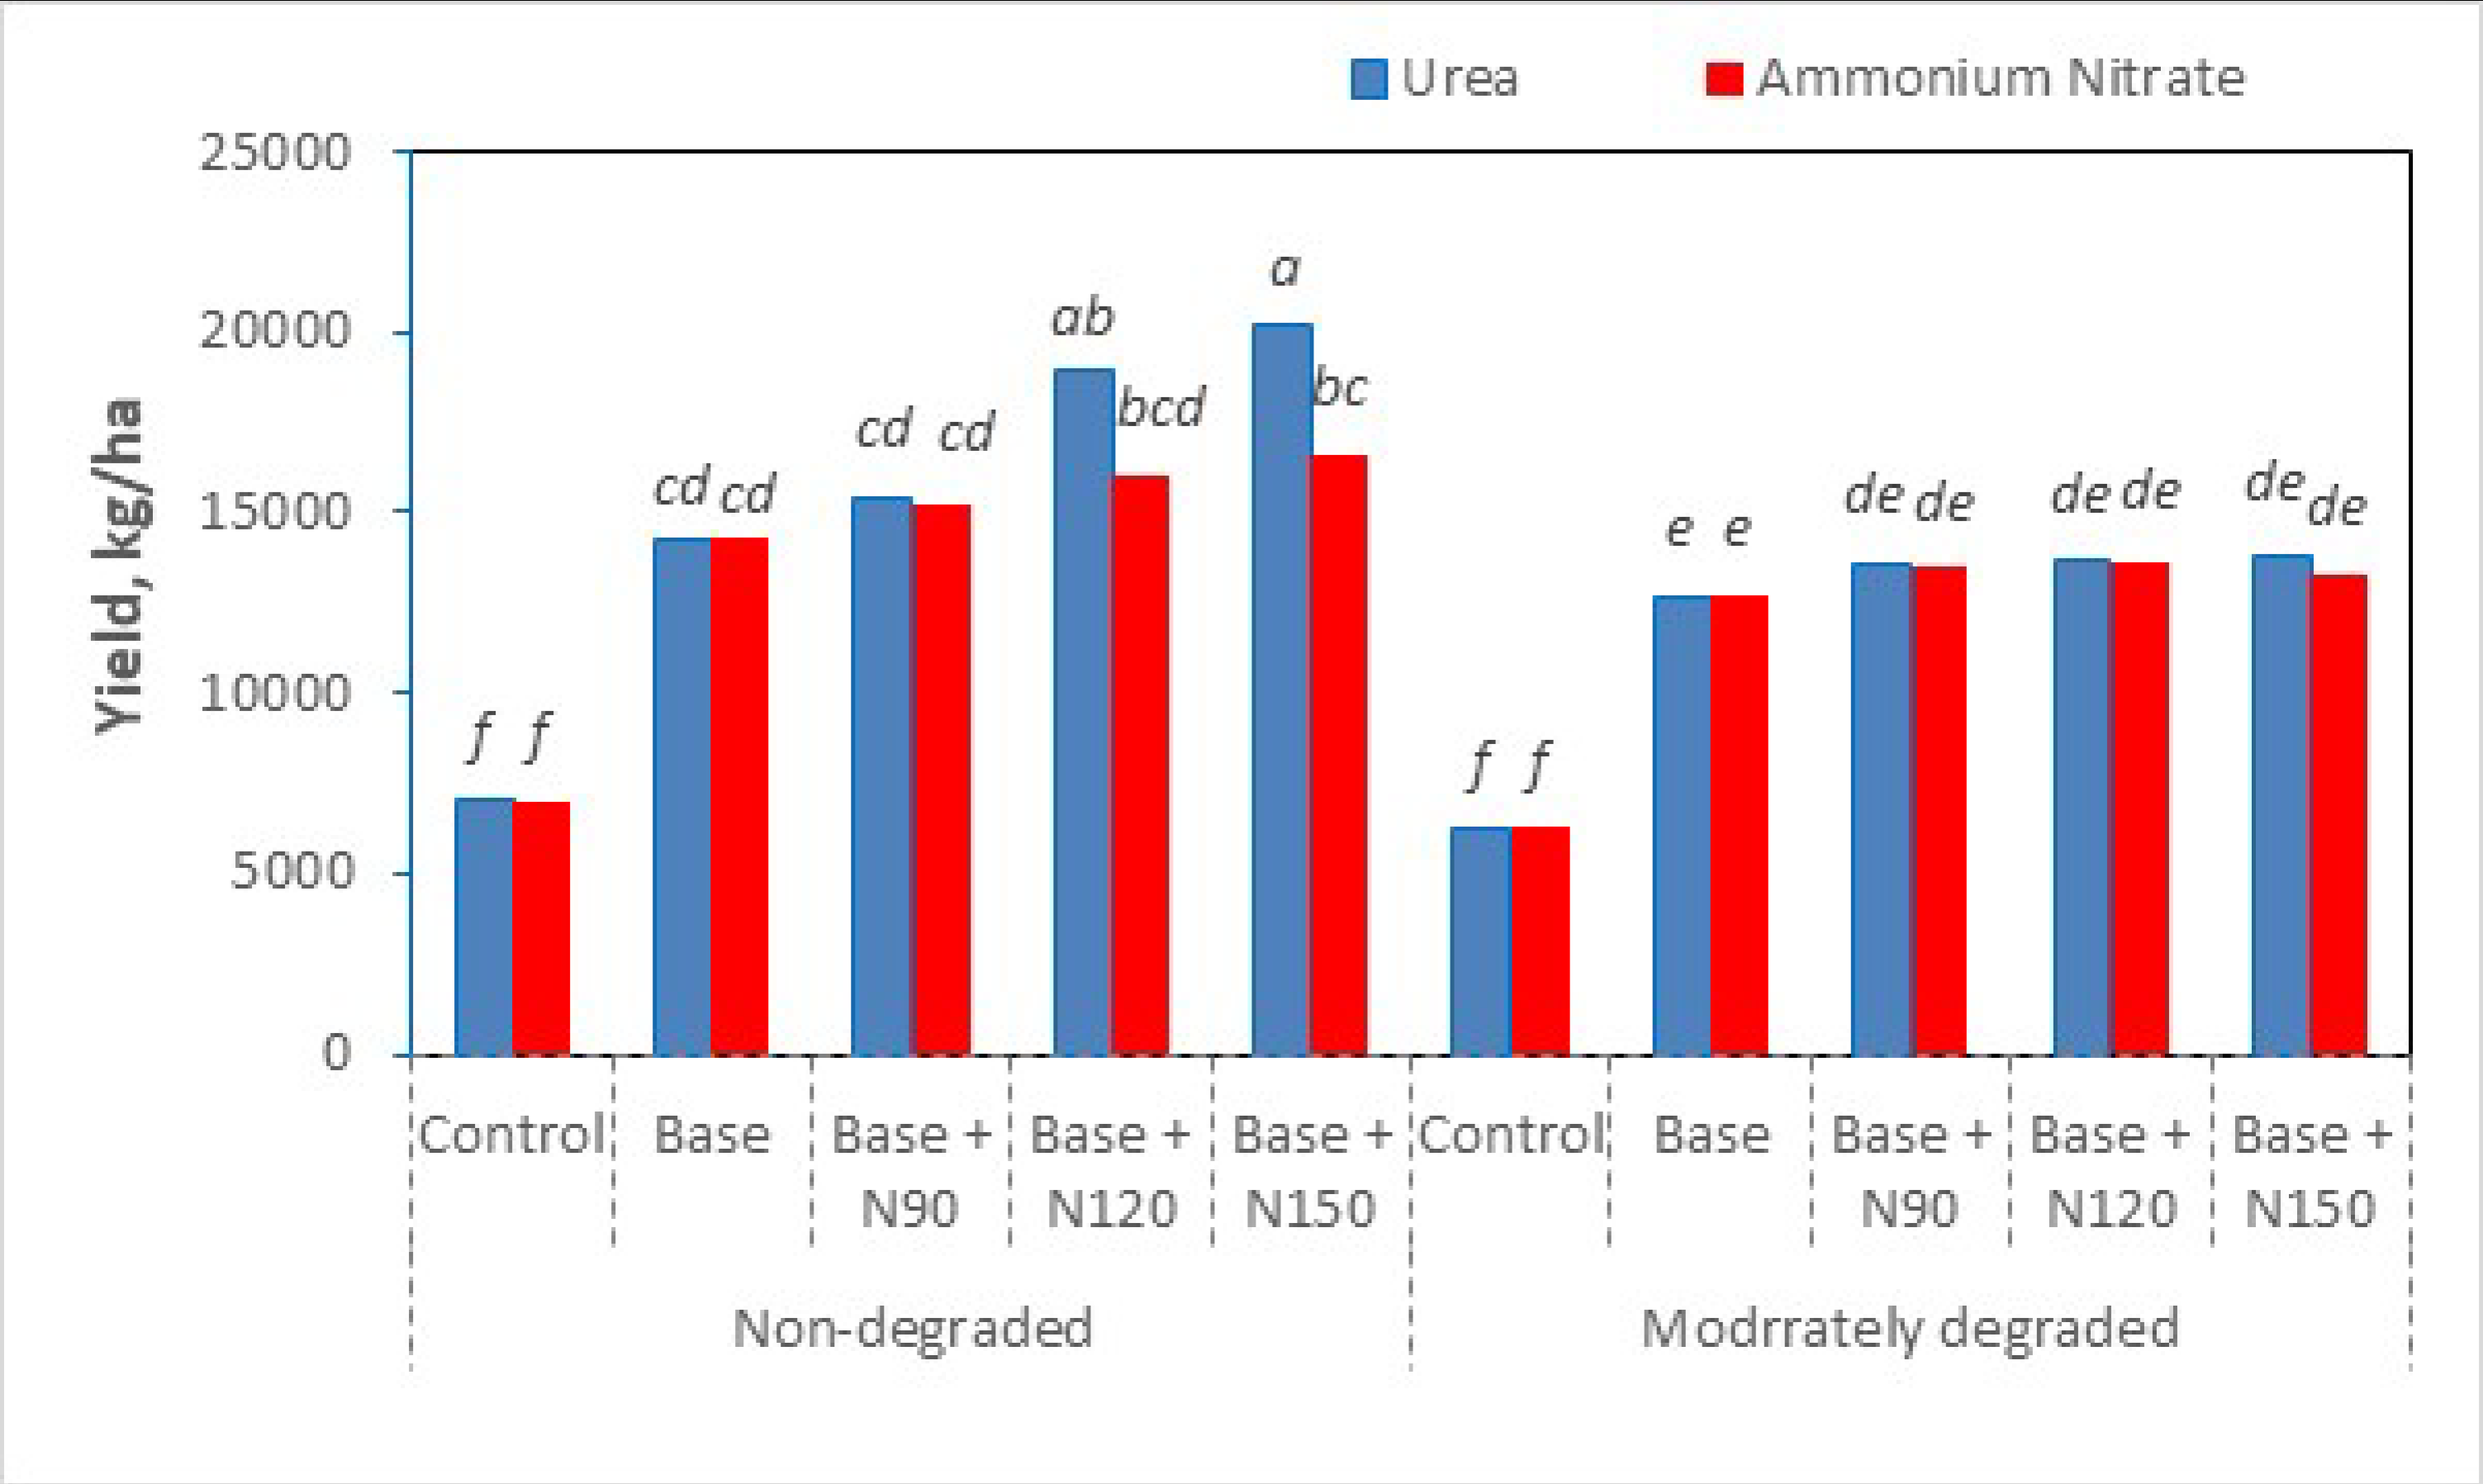

Table 1.
Selected soil properties (quality and fertility).
| Degradation level (D) | Horisons | Depth, cm | BD, g cm⁻³ | WSA, % | Clay, % | pH | SOM, % |
Total | Available | Soluble | ||||||
| CEC. cmolc kg⁻¹ |
N | P | K | NH4, | P2O | K2O, | NH4 | NO3, | ||||||||
| -------%------- | ----------- mg kg-1-------------- | |||||||||||||||
| non | Ayvg | 0-15 | 1.25 | 67.5 | 32.3 | 5.3 | 2.04 | 17.25 | 0.11 | 0.16 | 2.52 | 35.3 | 119.5 | 163 | 7 | 9 |
| AyELg | 15-35 | 1.45 | 75.3 | 29.3 | 5.4 | 0.81 | 12.74 | 0.09 | 0.12 | 2.45 | 23.4 | 117 | 133.5 | 5.6 | 8.1 | |
| BTg | 35-51 | 1.42 | 86.5 | 29 | 5.8 | 0.72 | 11.83 | 0.06 | 0.07 | 2.55 | 14.1 | 101 | 115 | 5 | 3.5 | |
| B/Cg | 51-72 | 1.43 | 68 | 34 | 6.2 | 0.62 | 12.97 | 0.05 | 0.06 | 2.35 | 12.1 | 91 | 112 | 4.5 | 3.3 | |
| moderate |
Ayvg | 0-10 | 1.3 | 42 | 23 | 5.8 | 1.45 | 11.32 | 0.07 | 0.12 | 1.76 | 22 | 79 | 97.5 | 5.3 | 4.5 |
| AyELg | 10-23 | 1.48 | 48 | 35 | 5.9 | 0.75 | 12.47 | 0.05 | 0.05 | 1.87 | 17.1 | 46.5 | 6.6 | 4.2 | 3.1 | |
| BTg | 23-43 | 1.46 | 72 | 28 | 6.2 | 0.4 | 10.32 | 0.03 | 0.06 | 1.72 | 9.05 | 30.5 | 68.5 | 1.5 | 2.5 | |
| B/Cg | 43-70 | 1.50 | 70 | 36 | 6.4 | 0.3 | 11.64 | 0.02 | 0.05 | 1.64 | 9.01 | 28.0 | 67.2 | 1.3 | 2.2 | |
| WSA=water stable aggregates (aggregate stability); CEC-cation exchange capacity; NO3 – nitrate nitrogen; P₂O₅ – available phosphorus; K₂O 5 – exchangeable potassium.; SOM-soil organic matter; | ||||||||||||||||
Table 2.
Effects of soil degradation, fertilization treatments, and plant phenological stages on soil available nutrients.
Table 2.
Effects of soil degradation, fertilization treatments, and plant phenological stages on soil available nutrients.
| Source | Nparam | df | NH4-N, mg kg⁻¹ | NO3-N, mg kg⁻¹ | P2O5, mg kg⁻¹ |
K2O, mg kg⁻¹ |
| Degradation (D) | 1 | 1 | *** | *** | *** | ns |
| Treatments (T) | 4 | 4 | *** | *** | *** | * |
| DxT | 4 | 4 | ns | *** | ns | ns |
| Phenological stages (S) | 2 | 2 | *** | *** | *** | *** |
| DxS | 2 | 2 | *** | * | ns | ns |
| TxS | 8 | 8 | ns | * | ns | ns |
| DxTxS | 8 | 8 | ns | * | ns | ns |
Table 3.
Soil degradation and treatment effect on soil quality and fertility, yield and fruit quality.
Table 3.
Soil degradation and treatment effect on soil quality and fertility, yield and fruit quality.
| 3a). Soil degradation and treatment effect on soil quality and fertility | ||||||||||||||
| Source | N parm | df | SOC, % |
WSA, % | NH₄⁺-N, mg kg⁻¹ |
NO₃⁻-N, mg kg⁻¹ |
P₂O₅, mg kg⁻¹ |
K₂O, mg kg⁻¹ |
||||||
| Degradation (D) | 1 | 1 | *** | *** | *** | *** | *** | ns | ||||||
| Treatments(T) | 4 | 4 | *** | * | *** | *** | *** | ns | ||||||
| D*T | 4 | 4 | ns | ns | ns | * | ns | ns | ||||||
| 3b). Soil degradation and treatment effect on kiwi yield and fruit quality and income | ||||||||||||||
| Source | N parm | df | yield | total sugar (TS), %) |
ascorbic acid(AA), mg 100g⁻¹ fw | titratable acidity (TA), % |
income | |||||||
| Degradation (D) | 1 | 1 | *** | *** | * | ns | *** | |||||||
| Treatments(T) | 4 | 4 | *** | *** | * | *** | *** | |||||||
| D*T | 4 | 4 | *** | ns | ns | *** | *** | |||||||
Table 4.
Effects of soil degradation, fertilization treatment, and fertilizer type on yield, nutent use efficiency (NUE), and fruit quality parameters.
Table 4.
Effects of soil degradation, fertilization treatment, and fertilizer type on yield, nutent use efficiency (NUE), and fruit quality parameters.
| Source | Npar | df | yield, kg ha⁻¹ | NUE | total sugar (TS) % |
ascorbic acid (AA), mg 100 g⁻¹ FW | titratable acidity (TA), % |
| Degradation (D) | 1 | 1 | *** | *** | *** | *** | * |
| Fertilizer type(F) | 1 | 1 | ** | ** | ns | ns | * |
| D*F | 1 | 1 | * | * | ns | ns | * |
| Treatment (T) | 4 | 4 | *** | *** | *** | *** | *** |
| D*T | 4 | 4 | *** | * | ns | ns | *** |
| F*T | 4 | 4 | * | ns | ns | ns | |
| D*T*F | 4 | 4 | * | ns | ns | ns |
Table 5.
Variation in soil available nutrient content in the root zone (0–40 cm) of kiwifruit plants under non-degraded and moderately degraded soils (mean for two year ±one standard deviation) as affected by soil degradation (D), fertilization treatments, and plant phenological stages (PS).
Table 5.
Variation in soil available nutrient content in the root zone (0–40 cm) of kiwifruit plants under non-degraded and moderately degraded soils (mean for two year ±one standard deviation) as affected by soil degradation (D), fertilization treatments, and plant phenological stages (PS).
| D | PS | Treatments | NH₄⁺-N, mg kg⁻¹ | NO₃⁻-N, mg kg⁻¹ | P₂O₅, mg kg⁻¹ |
K₂O, mg kg⁻¹ |
| Non-degraded | Bud | Control | 29.5±2.44 | 5.5±0.44 | 60±5.25 | 119.5±12.5 |
| Base | 34.5±2.81 | 6±0.49 | 68.5±6.01 | 121±12.6 | ||
| Base+N90 | 35.5±3.06 | 7±0.63 | 69.5±6.40 | 124±13.4 | ||
| Base+N120 | 35±2.98 | 7.5±0.62 | 72±6.62 | 126±13.6 | ||
| Base+N150 | 37.5±3.11 | 7.5±0.61 | 74.7±6.65 | 134±14.1 | ||
| Flowering | Control | 27.5±2.21 | 4.5±0.39 | 59±5.14 | 106.5±11.1 | |
| Base | 32.5±2.67 | 4.5±0.38 | 63±5.52 | 112±11.7 | ||
| Base+N90 | 31.5±2.69 | 6±0.56 | 61±5.62 | 110.5±12.0 | ||
| Base+N120 | 30.5±2.62 | 5.5±0.44 | 62.5±5.76 | 113±12.2 | ||
| Base+N150 | 35.5±2.93 | 6.75±0.55 | 63.5±5.64 | 120±12.7 | ||
| End | Control | 22.5±1.83 | 3.5±0.29 | 54±4.73 | 96±10.0 | |
| Base | 25.0±2.00 | 3±0.23 | 56.5±4.96 | 99.5±10.4 | ||
| Base+N90 | 27.0±2.32 | 4.9±0.45 | 58.5±5.38 | 98.5±10.6 | ||
| Base+N120 | 27.5±2.39 | 5±0.44 | 59.5±5.48 | 97.5±10.5 | ||
| Base+N150 | 29.5±2.48 | 4±0.32 | 59.5±5.31 | 97.5±10.3 | ||
| Moderate degraded | Bud | Control | 24.5±2.00 | 3±0.24 | 54±4.73 | 114.5±12.0 |
| Base | 29.0±2.32 | 5±0.43 | 61.5±5.37 | 119.5±12.5 | ||
| Base+N90 | 28.0±2.41 | 6±0.54 | 62±5.70 | 121.5±13.1 | ||
| Base+N120 | 30.5±2.67 | 7±0.59 | 59±5.43 | 123±13.3 | ||
| Base+N150 | 32.5±2.06 | 6.75±0.55 | 63±5.59 | 128.5±13.6 | ||
| Flowering | Control | 25.0±2.55 | 2.5±0.21 | 49.5±4.38 | 102±10.7 | |
| Base | 31.0±2.79 | 4.5±0.38 | 54.4±4.79 | 109.5±11.4 | ||
| Base+N90 | 32.5±2.80 | 5.25±0.48 | 54.5±5.02 | 108±11.7 | ||
| Base+N120 | 32.5±2.75 | 5.5±0.44 | 56.5±5.21 | 110.5±12.0 | ||
| Base+N150 | 33.0±1.51 | 6.5±0.55 | 58±5.16 | 117±12.4 | ||
| End | Control | 19.0±1.51 | 2.5±0.20 | 50±4.38 | 93.5±9.8 | |
| Base | 21.0±1.74 | 2.5±.0.21 | 53±4.64 | 97±10.1 | ||
| Base+N90 | 23.5±2.02 | 3.8±0.34 | 54±4.97 | 98±10.8 | ||
| Base+N120 | 23.5±2.03 | 4.1±0.33 | 55.5±5.10 | 94±10.3 | ||
| Base+N150 | 28.5±2.37 | 3.5±0.26 | 53±4.70 | 94.5±11.2 |
Table 6.
Treatments effect on soil quality and fertility (available nutrient content, mean for two year). For each nutrient column the data labeled with same letter are not significantly different at p < 0.05.
Table 6.
Treatments effect on soil quality and fertility (available nutrient content, mean for two year). For each nutrient column the data labeled with same letter are not significantly different at p < 0.05.
| Degradation | Treatments | SOC, % | WSA, % | NH₄-N, mg kg⁻¹ | NO₃⁻-N, mg kg⁻¹ | P₂O₅, mg kg⁻¹ |
K₂O, mg kg⁻¹ |
| ND | Control | 1.54 bcd | 68b | 30de | 6cd | 60cd | 120a |
| ND | Base | 1.68abc | 73ab | 35abc | 6cd | 69ab | 121ab |
| ND | Base+N90 | 1.82 ab | 77ab | 36ab | 7ab | 70ab | 124ab |
| ND | Base+N120 | 1.92 a | 81a | 35ab | 8a | 72a | 126a |
| ND | Base+N150 | 1.94 a | 81a | 38a | 8a | 75a | 134a |
| MD | Control | 1.09 e | 60b | 25f | 3e | 54d | 115b |
| MD | Base | 1.32 de | 65b | 29de | 5d | 62bcd | 120ab |
| MD | Base+N90 | 1.45 cd | 66b | 28ef | 6bc | 62bcd | 122ab |
| MD | Base+N120 | 1.55 bcd | 70ab | 31cde | 7ab | 59cd | 123ab |
| MD | Base+N150 | 1.61 bcd | 67b | 33bcd | 7ab | 63bc | 129ab |
| WSA=water stable aggregates (aggregate stability); SOC=soil organic carbon. Aavvai- ) nutrients: NH₄⁺ – ammonium nitrogen; NO₃⁻ – nitrate nitrogen; P₂O₅ – available phosphorus; K₂O 5 – exchangeable potassium. | |||||||
Table 7.
Treatments effect on yield, fruit quality and income. For each indicator (column), values followed by the same letter are not significantly different at p < 0.05.
Table 7.
Treatments effect on yield, fruit quality and income. For each indicator (column), values followed by the same letter are not significantly different at p < 0.05.
| Degradation | Treatments | Yield, kgha⁻¹ | TS, % | AA, mg100-1 fresh w | TA, ha⁻¹ |
Income, USD ha⁻¹ |
| Non-degraded | Control | 7004d | 7cd | 95ab | 1.8a | 1120c |
| Base | 14271b | 9.8ab | 98.5ab | 1.5abc | 2103b | |
| Base+N90 | 15447b | 10.4a | 103.2ab | 1.7ab | 22165b | |
| Base+N120 | 18901a | 10.6a | 105.4a | 1.3c | 27442a | |
| Base+N150 | 20139a | 10.9a | 106.8a | 1.3c | 29172a | |
| Moderately-degraded | Control | 6267d | 5.5d | 85.0b | 1.5abc | 10027c |
| Base | 12700c | 8.0bc | 92.3ab | 1.6abc | 18520b | |
| Base+N90 | 13620b | 9.5ab | 97.8ab | 1.5abc | 19242b | |
| Base+N120 | 13637b | 9.8ab | 98.5ab | 1.6abc | 19019b | |
| Base+N150 | 13777b | 10ab | 99.5ab | 1.4bc | 18993b |
Table 8.
Correlation between soil quality, fertility, plant yield, fruit quality parameters and income. *, **, ***=significancy at p < 0.05; 0.01; 0.0001 level respectively.
Table 8.
Correlation between soil quality, fertility, plant yield, fruit quality parameters and income. *, **, ***=significancy at p < 0.05; 0.01; 0.0001 level respectively.
| Variable | SOC, % |
WSA, % |
NH₄⁺-N, mg kg⁻¹ | NO₃⁻-N, mg kg⁻¹ | P₂O₅ mg kg⁻¹ |
K₂O, mg kg⁻¹ |
Yield, ha⁻¹ | TS, % |
AA, mg 100 g⁻¹ fw | TA, % |
| SOC | 1 | |||||||||
| WSA | 0.87*** | 1 | ||||||||
| NH₄⁺-N | 0.96*** | 0.80*** | 1 | |||||||
| NO₃⁻-N | 0.92*** | 0.73*** | 0.85*** | 1 | ||||||
| P₂O₅ | 0.40* | ns | 0.50** | 0.42** | 1 | |||||
| K₂O | 0.73*** | 0.74*** | 0.79*** | 0.68*** | 0.41** | 1 | ||||
| yield | 0.84** | 0.52*** | 0.82*** | 0.85*** | 0.75*** | 0.60*** | 1 | |||
| TS | 0.88*** | 0.61*** | 0.87*** | 0.95*** | 0.65*** | 0.70*** | 0.92*** | 1 | ||
| AA | 0.89*** | 0.84*** | 0.91*** | 0.83*** | 0.44** | 0.94*** | 0.74*** | 0.8413*** | 1 | |
| TA | ns | ns | ns | ns | 0.39* | 0.31* | 0.35* | ns | ns | 1 |
| Income | 0.85*** | 0.56*** | 0.84*** | 0.84*** | 0.73*** | 0.60** | 0.99*** | 0.90*** | 0.74*** | 0.34* |
| WSA=water stable aggregates (aggregate stability); SOC=soil organic carbon. Available nutrients: NH₄⁺ = ammonium nitrogen; NO₃⁻ =nitrate nitrogen; P₂O₅ = available phosphorus; K₂O 5 = exchangeable potassium; TS= total sugars ; AA= ascorbic acid; TA= titratable acidity. Fruit quality: TS-=total sugar; AA =ascorbic acid; TA= titratable acidity. sugar (TS) ascorbic acid (AA) titratable acidity (TA) sugar (TS) ascorbic acid (AA) titratable acidity (TA) | ||||||||||
Table 9.
Stepwise regression results for soil variables affecting kiwifruit yield, showing p-values, coefficient of determination (R²), Akaike information criterion corrected (AICc), and Bayesian information criterion (BIC) across model steps. Lower AICc and BIC values indicate better model performance.
Table 9.
Stepwise regression results for soil variables affecting kiwifruit yield, showing p-values, coefficient of determination (R²), Akaike information criterion corrected (AICc), and Bayesian information criterion (BIC) across model steps. Lower AICc and BIC values indicate better model performance.
| Step | Parameters | Prob | R2 | AICc | BIC |
| 1 | NO₃⁻-N, mg kg⁻¹ | 0.001 | 0.729 | 737.3 | 741.7 |
| 2 | P₂O₅, mg kg⁻¹ | 0.001 | 0.916 | 692.9 | 698.5 |
| 3 | SOC, % | 0.017 | 0.929 | 689.1 | 695.7 |
| 4 | K₂O, mg kg⁻¹ | 0.031 | 0.938 | 686.4 | 694.0 |
| 5 | NH₄⁺-N, mg kg⁻¹ | 0.25 | 0.940 | 687.8 | 696.1 |
| 6 | WSA,% | 0.25 | 0.940 | 690.8 | 699.7 |
Table 10.
Treatments and fertilizer type effect on yield, fruit quality and income. For each and indicator the numbers labelled with same letter are not significantly different at p < 0.05 level.
Table 10.
Treatments and fertilizer type effect on yield, fruit quality and income. For each and indicator the numbers labelled with same letter are not significantly different at p < 0.05 level.
| Degradation | Fertilizer type | Treatments | Yield, kgha⁻¹ | Total sugar (TS),% |
ascorbic acidm(AA), mg 100 g⁻¹ fw |
titratable acidity (TA),% | nutrient use efficiency(NUE), kg⁻¹ N |
| ND | urea | Control | 7004.0f | 7.0 | 95.0 | 1.8 | |
| ND | urea | Base | 14271.0cde | 9.8 | 98.5 | 1.5 | |
| ND | urea | Base + N90 | 15447.0bc | 10.4 | 103.2 | 1.7 | 0.94ab |
| ND | urea | Base + N120 | 18901.0a | 10.6 | 105.4 | 1.3 | 0.99a |
| ND | urea | Base + N150 | 20139.0a | 10.9 | 106.8 | 1.3 | 0.88bc |
| MD | urea | Control | 6267.0f | 5.5 | 85.0 | 1.5 | |
| MD | urea | Base | 12700.0e | 8.0 | 92.3 | 1.6 | |
| MD | urea | Base + N90 | 13620.0de | 9.5 | 97.0 | 1.5 | 0.82bc |
| MD | urea | Base + N120 | 13637.0de | 9.8 | 97.8 | 1.6 | 0.61c |
| MD | urea | Base + N150 | 13777.0cde | 10.0 | 99.5 | 1.4 | 0.50c |
| ND | AN | Control | 7004.0f | 7.0 | 95.0 | 1.8 | |
| ND | AN | Base | 14271.0cde | 9.8 | 98.5 | 1.5 | |
| ND | AN | Base + N90 | 15204.0bcd | 10.5 | 100.0 | 1.7 | 0.91a |
| ND | AN | Base + N120 | 16037.0b | 10.7 | 102.0 | 1.3 | 0.75ab |
| ND | AN | Base + N150 | 16637.0b | 10.3 | 105.0 | 1.3 | 0.64b |
| MD | AN | Control | 6267.0f | 5.5 | 85.0 | 1.5 | |
| MD | AN | Base | 12700.0e | 8.0 | 92.3 | 1.6 | |
| MD | AN | Base + N90 | 13467.0e | 9.2 | 94.2 | 1.7 | 0.80ab |
| MD | AN | Base + N120 | 13577.0de | 9.5 | 96.4 | 1.7 | 0.61bc |
| MD | AN | Base + N150 | 13313.6e | 9.4 | 94.5 | 1.8 | 0.47c |
| ND=non-degraded; MD=moderate=degraded; AN=ammonium nitrate | |||||||
Disclaimer/Publisher’s Note: The statements, opinions and data contained in all publications are solely those of the individual author(s) and contributor(s) and not of MDPI and/or the editor(s). MDPI and/or the editor(s) disclaim responsibility for any injury to people or property resulting from any ideas, methods, instructions or products referred to in the content. |
© 2026 by the authors. Licensee MDPI, Basel, Switzerland. This article is an open access article distributed under the terms and conditions of the Creative Commons Attribution (CC BY) license (http://creativecommons.org/licenses/by/4.0/).
Copyright: This open access article is published under a Creative Commons CC BY 4.0 license, which permit the free download, distribution, and reuse, provided that the author and preprint are cited in any reuse.


