

Submitted:
27 June 2026
Posted:
02 July 2026
You are already at the latest version
Abstract
Syndromic indicators of respiratory disease such as influenza-like illness (ILI) are commonly monitored by public health agencies and used in decision making. The diagnostic criteria for these indicators are based on clinical symptoms, not pathogen detection, and thus are a useful view into the overall burden of respiratory disease resulting from a myriad of pathogens. However, for some of the most important contributors to these indicators, such as influenza and COVID-19, many countries do collect pathogen-specific data that could help shed additional light on the pathogenic drivers of ILI. To explore this, we performed a Bayesian statistical analysis of data from 12 countries in Europe that publish routine surveillance data on ILI, influenza, RSV, and SARS-CoV-2. Our analysis revealed that the pathogens that contribute to ILI change dynamically over time, depending on which underlying pathogen happens to be surging in a given country in a given week. In general, we estimated that influenza infections were overrepresented in ILI, RSV proportionally represented, and SARS-CoV-2 underrepresented, relative to their overall circulation. In addition, we estimated that nearly half of ILI cases result from pathogens other than those three. Altogether, our results point to the underlying pathogenic drivers of ILI being highly complex and dynamic, suggesting a need for more granular surveillance of respiratory pathogens.
Keywords:
disease etiology
; infectious disease surveillance
; syndromic indicators
Introduction
Syndromic indicators of respiratory disease such as influenza-like illness (ILI) are commonly monitored by public health agencies and used in decision making. The diagnostic criteria for these indicators are based on clinical symptoms, not pathogen detection, and thus are a useful view into the overall burden of respiratory disease resulting from a myriad of pathogens. However, for some of the most important contributors to these indicators, such as influenza and COVID-19, many countries do collect pathogen-specific data that could help shed additional light on the pathogenic drivers of ILI. To explore this, we performed a Bayesian statistical analysis of data from 12 countries in Europe that publish routine surveillance data on ILI, influenza, RSV, and SARS-CoV-2. These data result from increased efforts in Europe in recent years to conduct standardized respiratory illness surveillance [1].
Methods
Data
All data were obtained from the European Respiratory Virus Surveillance Summary (ERVISS) [2]. These data are collected weekly, but reporting is voluntary for participating nations. We used a study period from 1 October 2021 to 30 April 2026. We chose October 2021 as the starting point because we wanted to include data after the emergence of SARS-CoV-2, and testing availability and practices varied greatly in 2020 and early 2021. We included countries that reported data at least 50% of the weeks we included in our study; 12 countries met this criterion (Figure 1).
We denote time on the weekly scale with the subscript t, country with the subscript c, and the specific pathogen with the subscript p when applicable. Each week t is characterized by two data sources. The first, St,c,p, comes from patients diagnosed with ILI who were then tested for a pathogen-specific etiology (SARS-CoV-2, influenza, RSV, or an uncharacterized “other”). These patients were all diagnosed and tested at sentinel surveillance sites; the data from these sites is reported to the relevant public health institutions in each country and used by these institutions to estimate ILI incidence in the general population. The second data source, Gt,c,p, is pathogen incidence for SARS-CoV2, influenza, and RSV in the general population. These are cases not captured within the sentinel surveillance scheme, and with no information on if criteria for an ILI diagnosis were met or how many pathogen tests were conducted; only case numbers are reported.
Likelihood
We assume that λt,c,p is multinomially distributed
according to a vector of pathogen-specific probabilities γt,c,p defined as
γt,c,p = (θt,c,₁ωc,₁, θt,c,2ωc,2, θt,c,3ωc,3, θt,c,4).
The vector θt,c is a simplex representing the true underlying distribution of sentinel ILI cases across the four pathogens, and ωc,p is a vector that captures the differing propensities of pathogens to result in an infection that meets the case definition of ILI and results in testing at sentinel surveillance sites. Values of ωc,p near 1 imply no differential detection, whereas values above or below 1 imply relative over- or under-detection of the corresponding pathogen among sentinel ILI cases relative to its circulation in the general population. The parameter ωc,p cannot be calculated for the “other” category, as there is no general population data available.
The proportions of SARS-CoV-2, influenza, and RSV in the non-sentinel general population are represented by the simplex ρt,c and related to the data τt,c,p by the Multinomial distribution:
τt,c,p ~ Multinomial(ρt,c,p)
The non-sentinel general population and the sentinel ILI population data interact via θt,c,p which is assigned a Dirichlet prior whose concentration parameter is derived from the pathogens circulating in the non-sentinel general population, ρt,c,p, and is scaled by a global precision parameter κc (Figure 2):
Where Xt,c is constructed by appending a constant value of 1.0 to ρt,c,p (to accommodate the fourth “other” ILI category for which there are no general population data). A small constant of 0.01 is added to the concentration vector to ensure numerical stability. This formulation allows the general population pathogen distribution to anchor the latent sentinel ILI pathogen distribution while permitting week-specific deviations, with the degree of shrinkage governed by κ. Larger values of κ imply that the ILI pathogen distribution more closely mirrors the general population pathogen distribution.
Priors
The parameter ρt,c,p is assigned a flat Dirichlet prior to allow the observed general population surveillance counts to drive inference. SARS-CoV-2, influenza, and RSV are co-circulating with different proportions relative to one another over time due to differing seasonality and transmission dynamics and thus we chose a prior that reflected equal plausibility to any relative proportions of these pathogens:
The precision parameter κc is assigned a lognormal prior:
This prior places the median value of κc at 2, reflecting a prior belief that the sentinel ILI pathogen distribution is moderately anchored to the general population pathogen distribution, while the standard deviation of 0.25 on the log scale allows for substantial uncertainty around this assumption: the 5th and 95th percentiles of this distribution are approximately 1.2 and 3.2, so while values much below 1 or above 5 receive little prior mass, the prior does not sharply constrain to any narrow range. The lognormal distribution was chosen to ensure remains strictly positive, as negative or zero values would be undefined in this context.
The parameter ωc,p was given a prior centered at 1 for all three pathogens, reflecting a prior belief that in the absence of data, no pathogen is assumed to be systematically over- or under-represented in confirmed sentinel ILI cases relative to its true prevalence:
The standard deviation of 0.3 was chosen to be permissive enough to allow meaningful detection bias to be estimated from the data — accommodating weights roughly in the range 0.4 to 1.6 within two standard deviations — while providing sufficient regularization to prevent implausible values in weeks where the likelihood is weak. The lower bound of zero on ensures weights remain non-negative, as a negative weight would have no coherent epidemiological interpretation. Centering all weights at 1 rather than, for example, initializing influenza higher, ensures that any estimated differences in ωc,p across pathogens are driven by the data rather than prior assumptions.
Model Fitting
We fitted our model using code written in the programming language Stan and interfaced via the rstan package in R. Posterior distributions were sampled using the No-U-Turn Sampler (NUTS), a variant of the Hamiltonian Monte Carlo algorithm. A high target acceptance rate (adapt_delta = 0.99) and an increased maximum tree depth of 15 were specified to ensure robust exploration of the posterior geometry — particularly important given the simplex-valued parameters (θt,c,p and ρt,c,p) and the concentration parameter κ, which can induce curved, high-dimensional posteriors.
Four parallel Markov chains were run for 5,000 iterations each, including a 2,500-iteration warmup period. This resulted in a total of 10,000 post-warmup samples across all chains used for posterior inference. Convergence was monitored using the R̂ statistic and effective sample size (n_eff), with convergence considered satisfactory when R̂ < 1.01 for all parameters.

Table 1.
Description of the inferred parameters with corresponding prior and posterior distributions.
Table 1.
Description of the inferred parameters with corresponding prior and posterior distributions.
| Parameter | Description | Prior | Posterior |
|---|---|---|---|
| θt,c,p | True distribution of sentinel ILI cases across SARS-CoV-2, Influenza, RSV, and Other | Dirichlet(Xt,c⋅κ+0.01) | ∝ Dirichlet(Xt,c,p⋅κ+0.01) ×Multinomial(λt,c,p ∣γt,c,p) |
| ρt,c,p | Proportions of SARS-CoV-2, Influenza, and RSV in the non-sentinel general population | Dirichlet(1,1,1) | ∝ Dirichlet(1,1,1) ×Multinomial(τt,c,p ∣ρt,c,p) |
| κc | Global precision governing shrinkage of θt,c,p toward ρt,c,p | LogNormal(log2,0.25) | |
| ωc,p | Differential detection weight for SARS-CoV-2, Influenza, and RSV in sentinel ILI surveillance | Normal(1,0.3) |
Results
Our model converged for all countries, confirmed by an <1.01 and visual inspection of the trace plots. We found that our model fit τt,c,p, the general population pathogen data well with a coverage probability of 99.8% (range: 98.8-99.9% across countries; Figure 3).
For the sentinel pathogen data, λt,c,p, our model estimated a coverage probability of 93.8% (range 91.2-97.5%; (Figure 4). These estimates represent the combination of θt,c,p, the latent true distribution of ILI cases across SARS-CoV-2, influenza, RSV, and other, and the ωc,p parameter, the differential weight of detection.
The parameter ωc,p bridges the gap from θt,c,p to the observed data which has an assumed bias in the differing propensity of pathogens to result in an infection that meets the case definition of ILI and present for testing at sentinel surveillance sites. We found that across all countries tested, generally SARS-CoV-2 was underrepresented in the ILI sentinel population when compared to its expected prevalence based on the general population pathogen data τt,c,p, whereas influenza was overrepresented (Figure 5). RSV was generally detected in proportion to the expected prevalence based on the general population data, albeit with variation across countries. This ranking of influenza having a greater detection weight than RSV and RSV being greater than SARS-CoV-2 was remarkably consistent across countries.
The latent θt,c,p estimates demonstrate the same pattern: SARS-CoV-2 estimates are higher in θt,c,p than the sentinel data which contains the detection bias (Figure S2). The residuals θt,c,p illustrate this point further – positive residuals are evident in the time series when the latent estimates are higher for SARS-CoV-2 than what positive tests occur in the sentinel population (Figure S3).
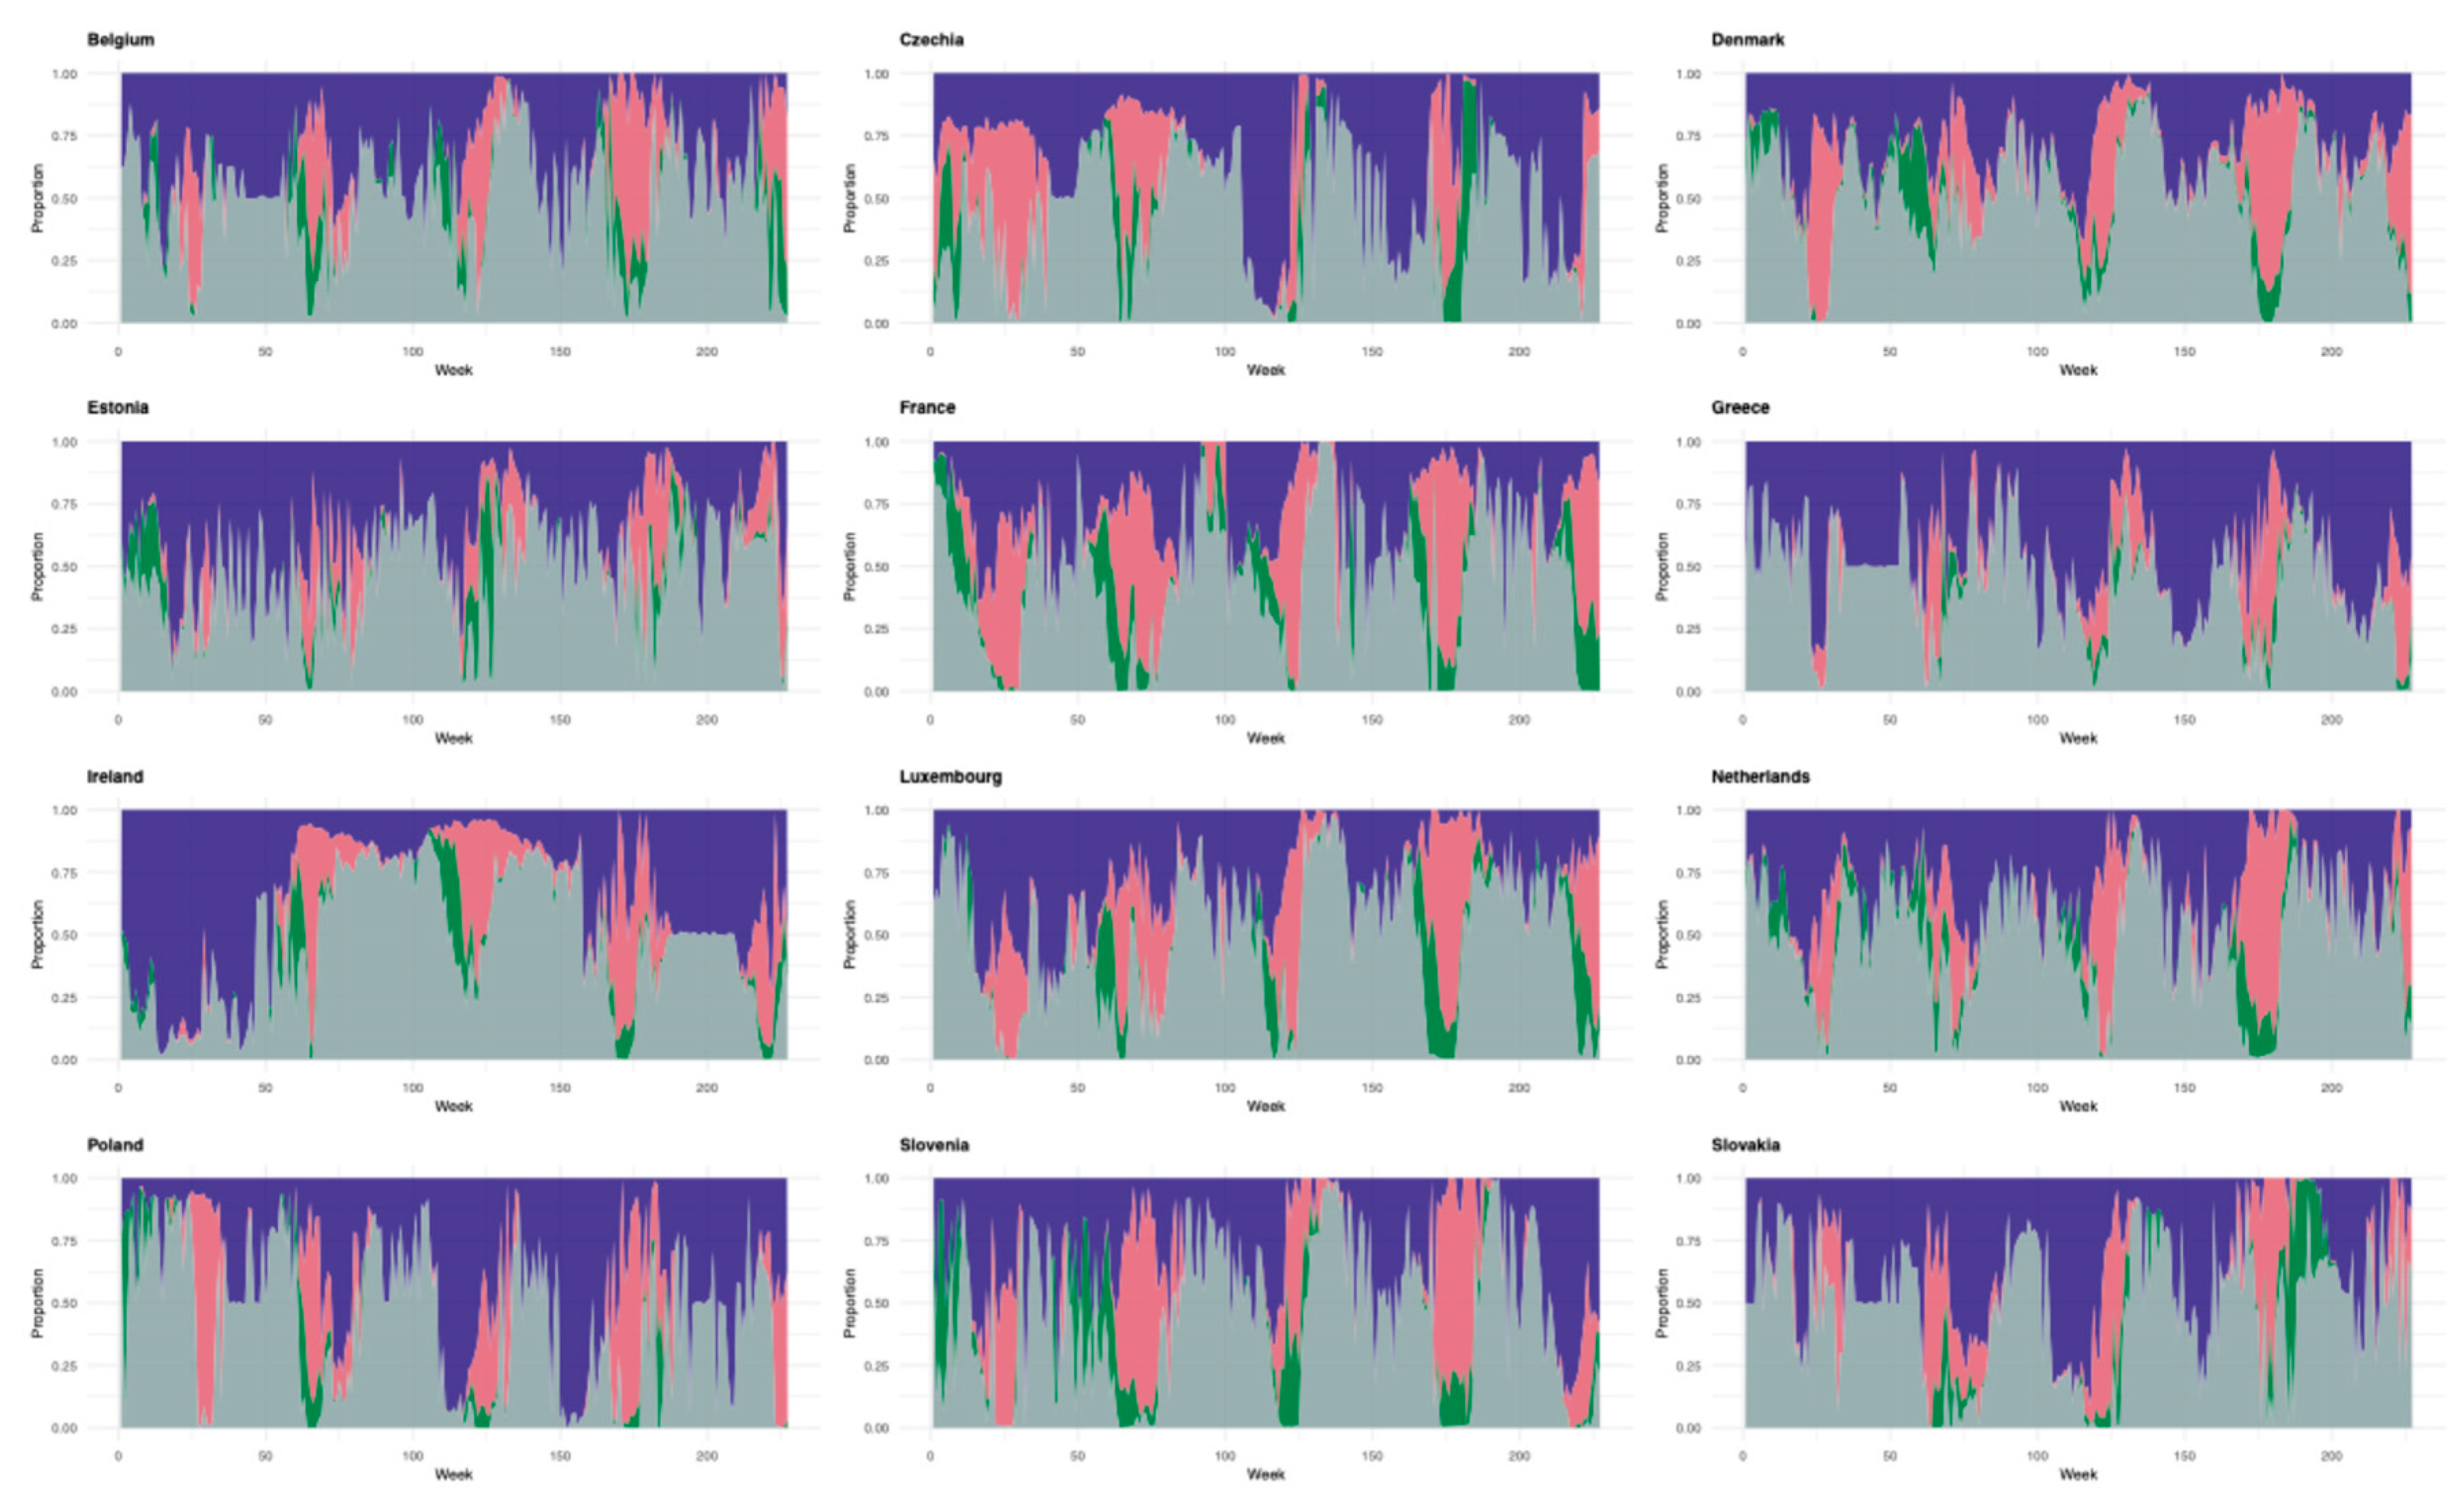
Finally, to gauge the temporal variation in the contribution of each pathogen to ILI cases over time we plotted their median estimated proportion to θt,c,p over time (Figure 6). Across countries we saw a common pattern of episodic periods of influenza dominance as expected due to its known seasonality, and outside of these influenza peaks both SARS-CoV-2 and other dominate more endemically and with less clear seasonality. One interesting anomaly is in the 2021-2022 influenza season we saw relatively little influenza in Ireland, even while other countries were experiencing influenza peaks, and instead saw a dominance of SARS-CoV-2 during this time. We also calculated the average proportion of each pathogen across the time series and found “other” dominated as the main pathogen present across time (45.1%±0.8 average proportion), followed by SARS-CoV-2 (35.2%±1.6) (Table S1).
Discussion
In summary, our analysis revealed that the pathogens that contribute to ILI change dynamically over time, depending on which underlying pathogen happens to be surging in a given country in a given week. In general, we estimated that influenza infections were overrepresented in ILI, RSV proportionally represented, and SARS-CoV-2 underrepresented, relative to their overall circulation. In addition, we estimated that nearly half of ILI cases result from pathogens other than those three. Previous work by Bollaerts et al. [3], who performed a similar analysis on data from Belgium, also found that RSV and other non-influenza pathogens contribute significantly to ILI. Altogether, our results point to the underlying pathogenic drivers of ILI being highly complex and dynamic, suggesting a need for more granular surveillance of respiratory pathogens.
Supplementary Materials
The following supporting information can be downloaded at the website of this paper posted on Preprints.org.
Acknowledgments
The authors received support from the NIH National Institute of General Medical Sciences R35 MIRA program (grant no. R35GM143029).
References
- European Centre for Disease Prevention and Control; World Health Organization Regional Office for Europe. Operational considerations for respiratory virus surveillance in Europe . 18 July 2022. Available online: https://www.ecdc.europa.eu/en/publications-data/operational-considerations-respiratory-virus-surveillance-europe.
- European Centre for Disease Prevention and Control; World Health Organization Regional Office for Europe. (2026). The European Respiratory Virus Surveillance Summary (ERVISS). Retrieved [Insert Date of Your Data Access. The European Respiratory Virus Surveillance Summary (ERVISS) . 2026. Available online: https://erviss.org/.
- Bollaerts, K.; Antoine, J.; Van Casteren, V.; Ducoffre, G.; Hens, N.; Quoilin, S. Contribution of respiratory pathogens to influenza-like illness consultations. Epidemiol. Infect. 2012, 141(11), 2196–2204. [Google Scholar] [CrossRef] [PubMed]
Figure 1.
Number of weeks each country participating in ERVISS provided data during our study period (total study period = 234 weeks). We included countries that had complete data reporting for a minimum of half the study period (117 weeks). This cutoff is indicated by the dashed line.
Figure 1.
Number of weeks each country participating in ERVISS provided data during our study period (total study period = 234 weeks). We included countries that had complete data reporting for a minimum of half the study period (117 weeks). This cutoff is indicated by the dashed line.
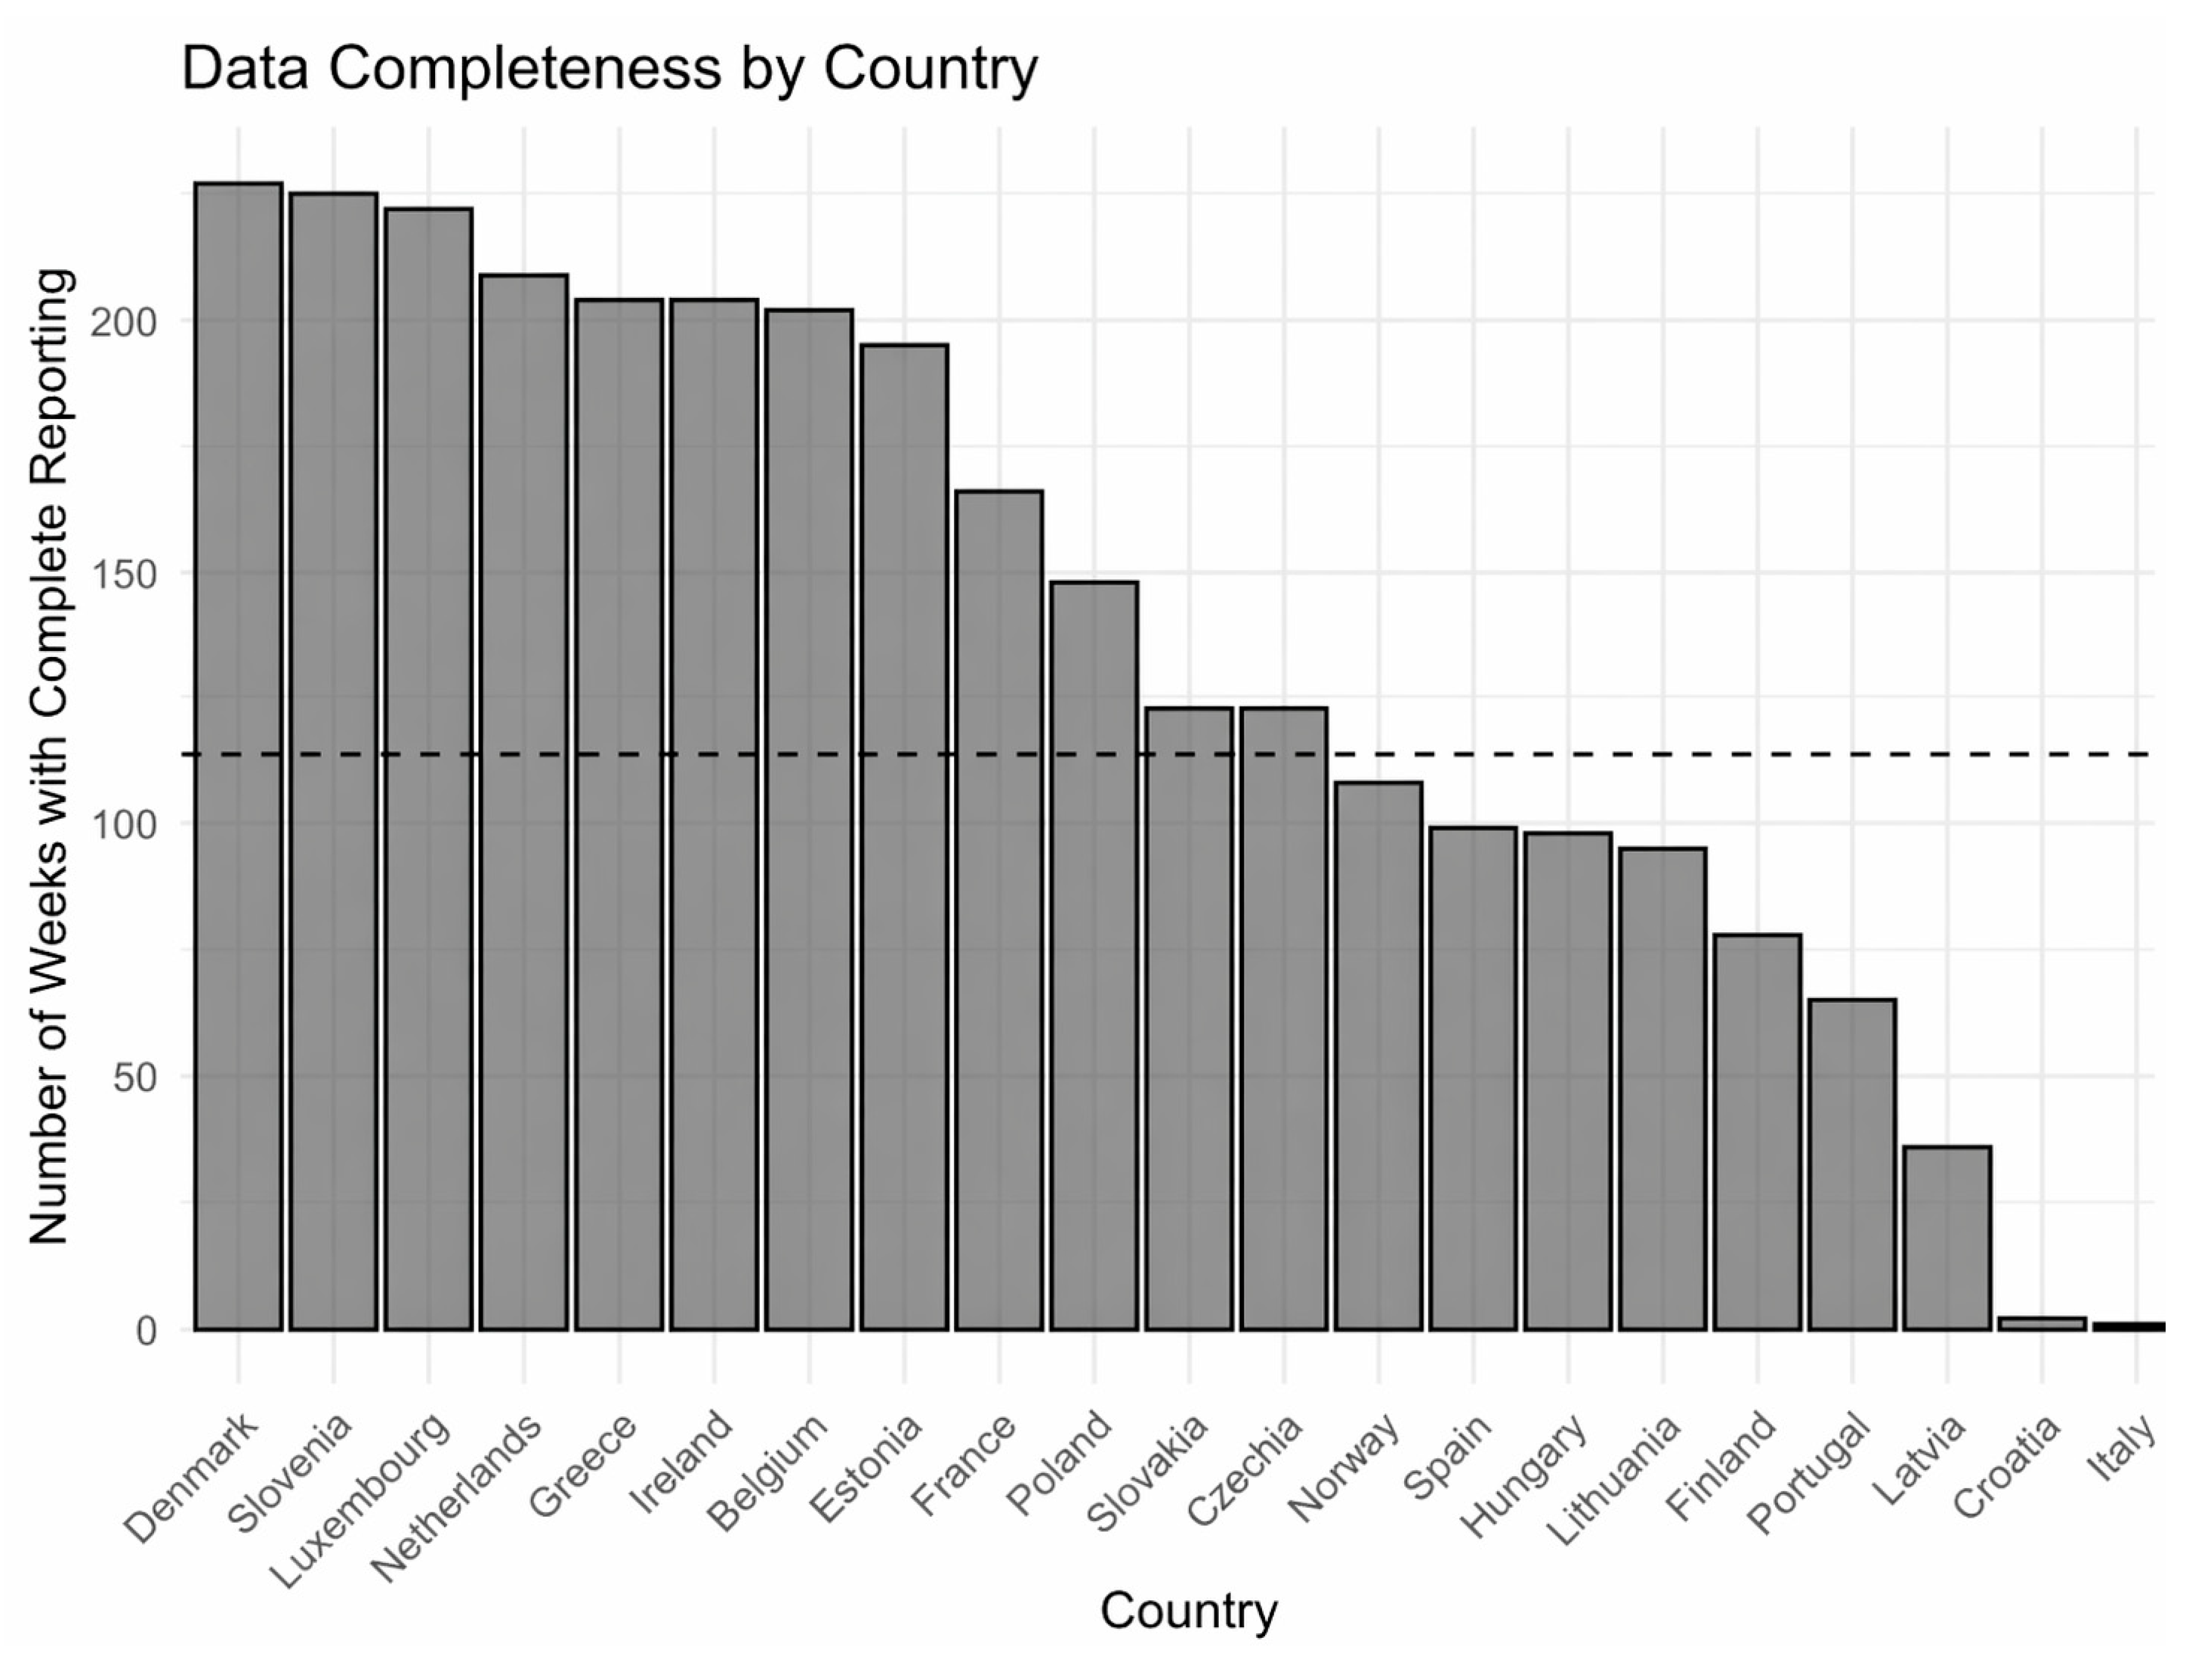
Figure 2.
The two main data sources for our model are the pathogen incidence from sentinel ILI cases, λt,c,p, and the pathogen incidence from the general population, τt,c,p. The model estimates for the general population pathogen composition inform the prior for the latent parameter θt,c,p, which in combination with the differential weight of detection ωc,p allows for the estimation of the sentinel population pathogen composition that presents as ILI cases in sentinel surveillance sites, γt,c,p.
Figure 2.
The two main data sources for our model are the pathogen incidence from sentinel ILI cases, λt,c,p, and the pathogen incidence from the general population, τt,c,p. The model estimates for the general population pathogen composition inform the prior for the latent parameter θt,c,p, which in combination with the differential weight of detection ωc,p allows for the estimation of the sentinel population pathogen composition that presents as ILI cases in sentinel surveillance sites, γt,c,p.
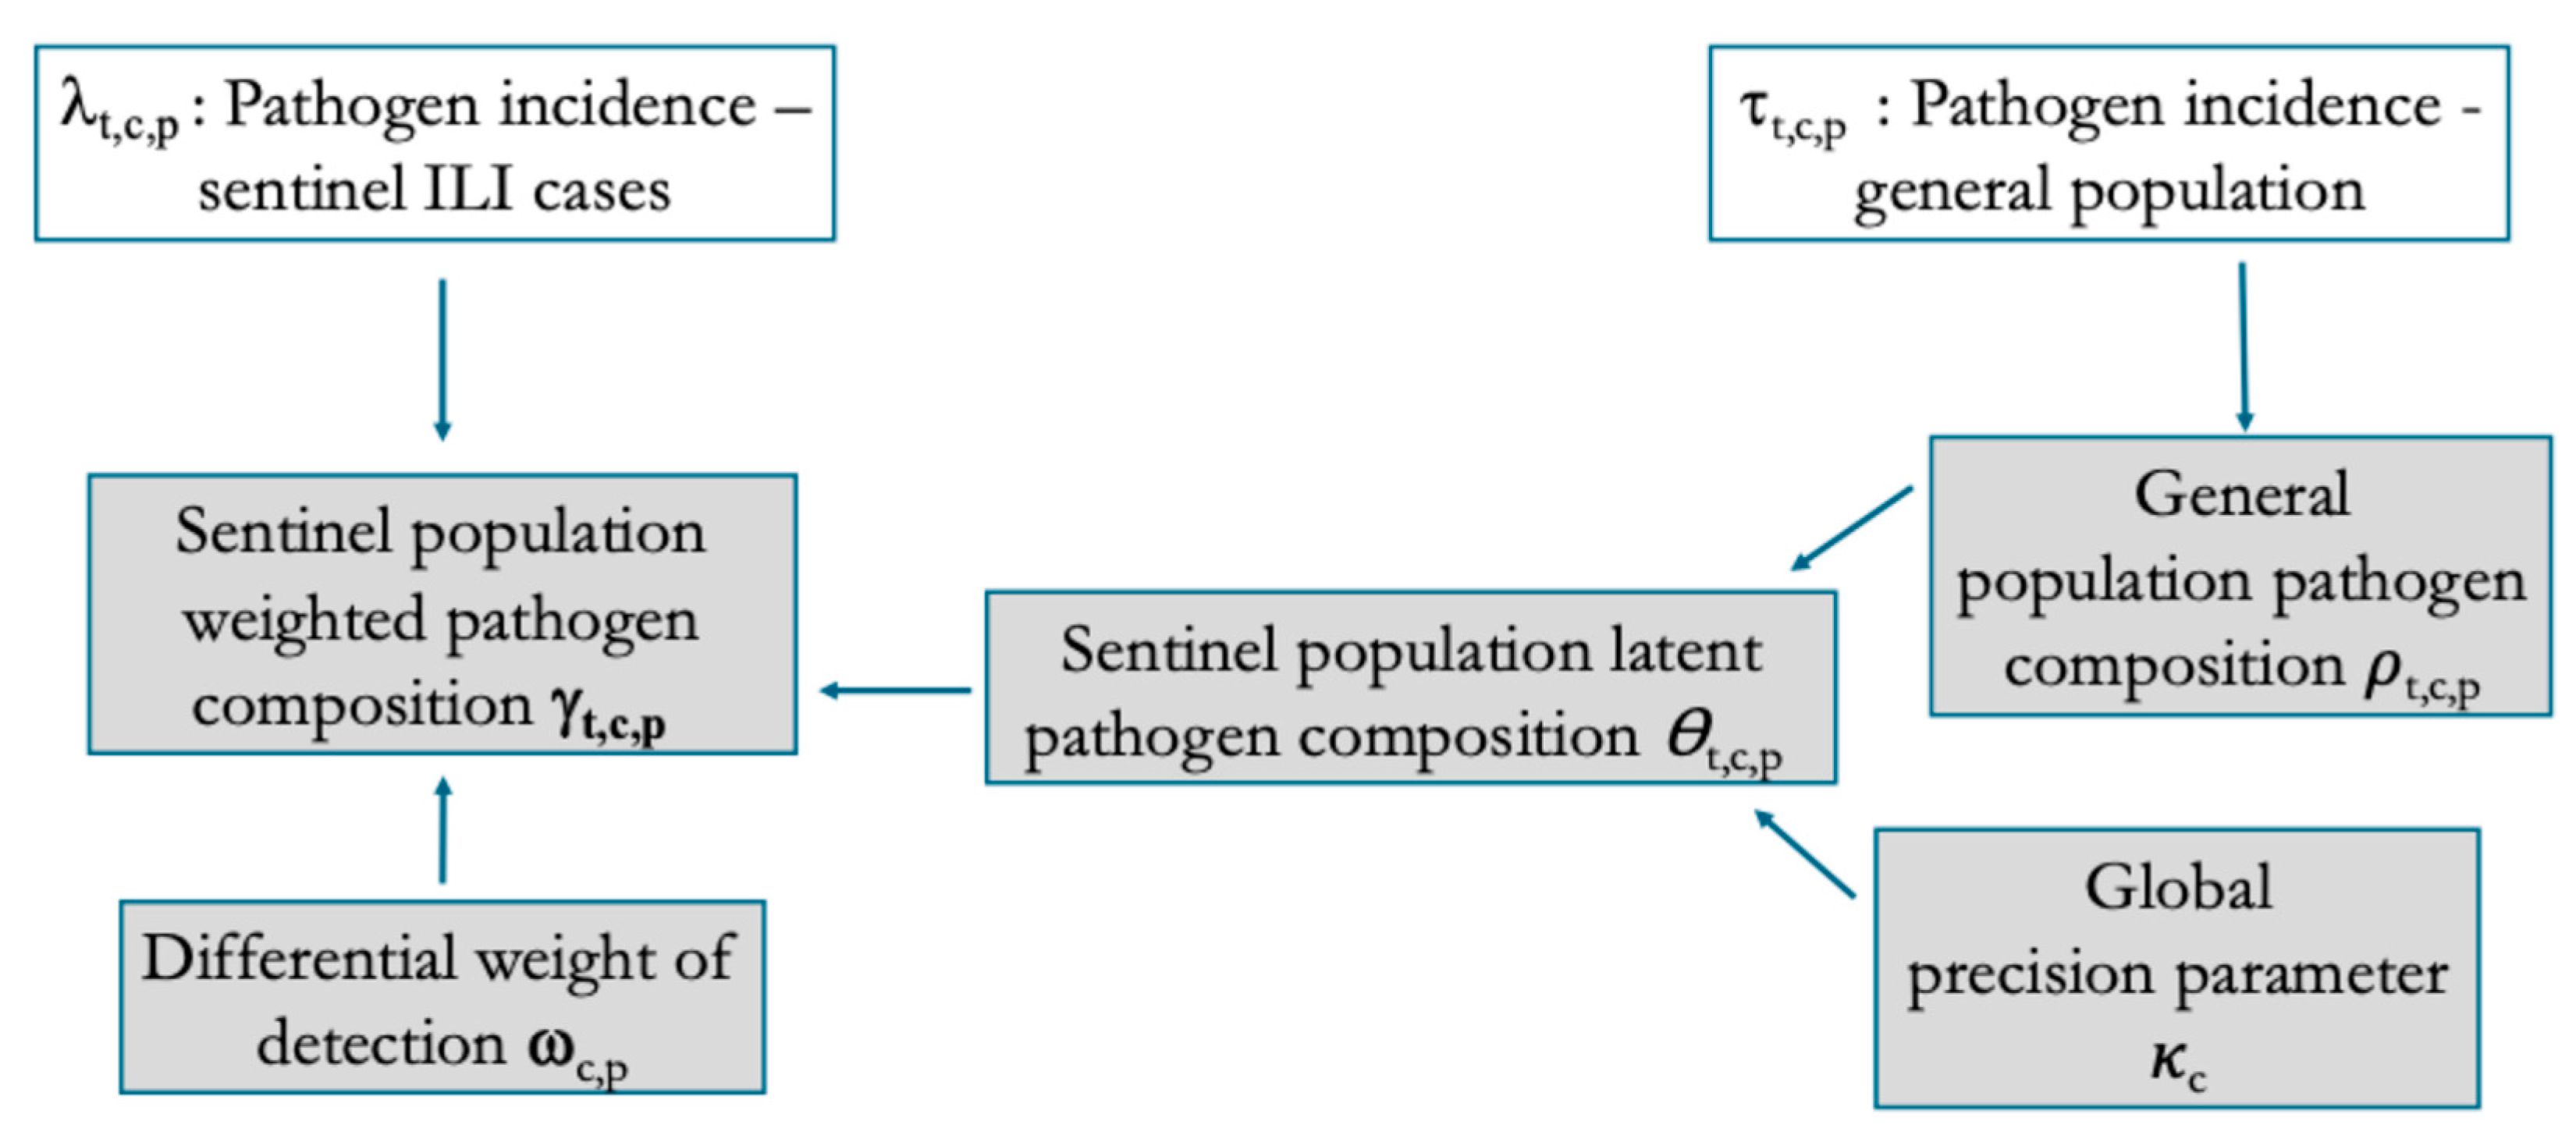
Figure 3.
Across countries our model was able to capture the pathogen dynamics of the general population, τt,c,p, although the small number of RSV cases in both Greece and Poland resulted in greater uncertainty.
Figure 3.
Across countries our model was able to capture the pathogen dynamics of the general population, τt,c,p, although the small number of RSV cases in both Greece and Poland resulted in greater uncertainty.
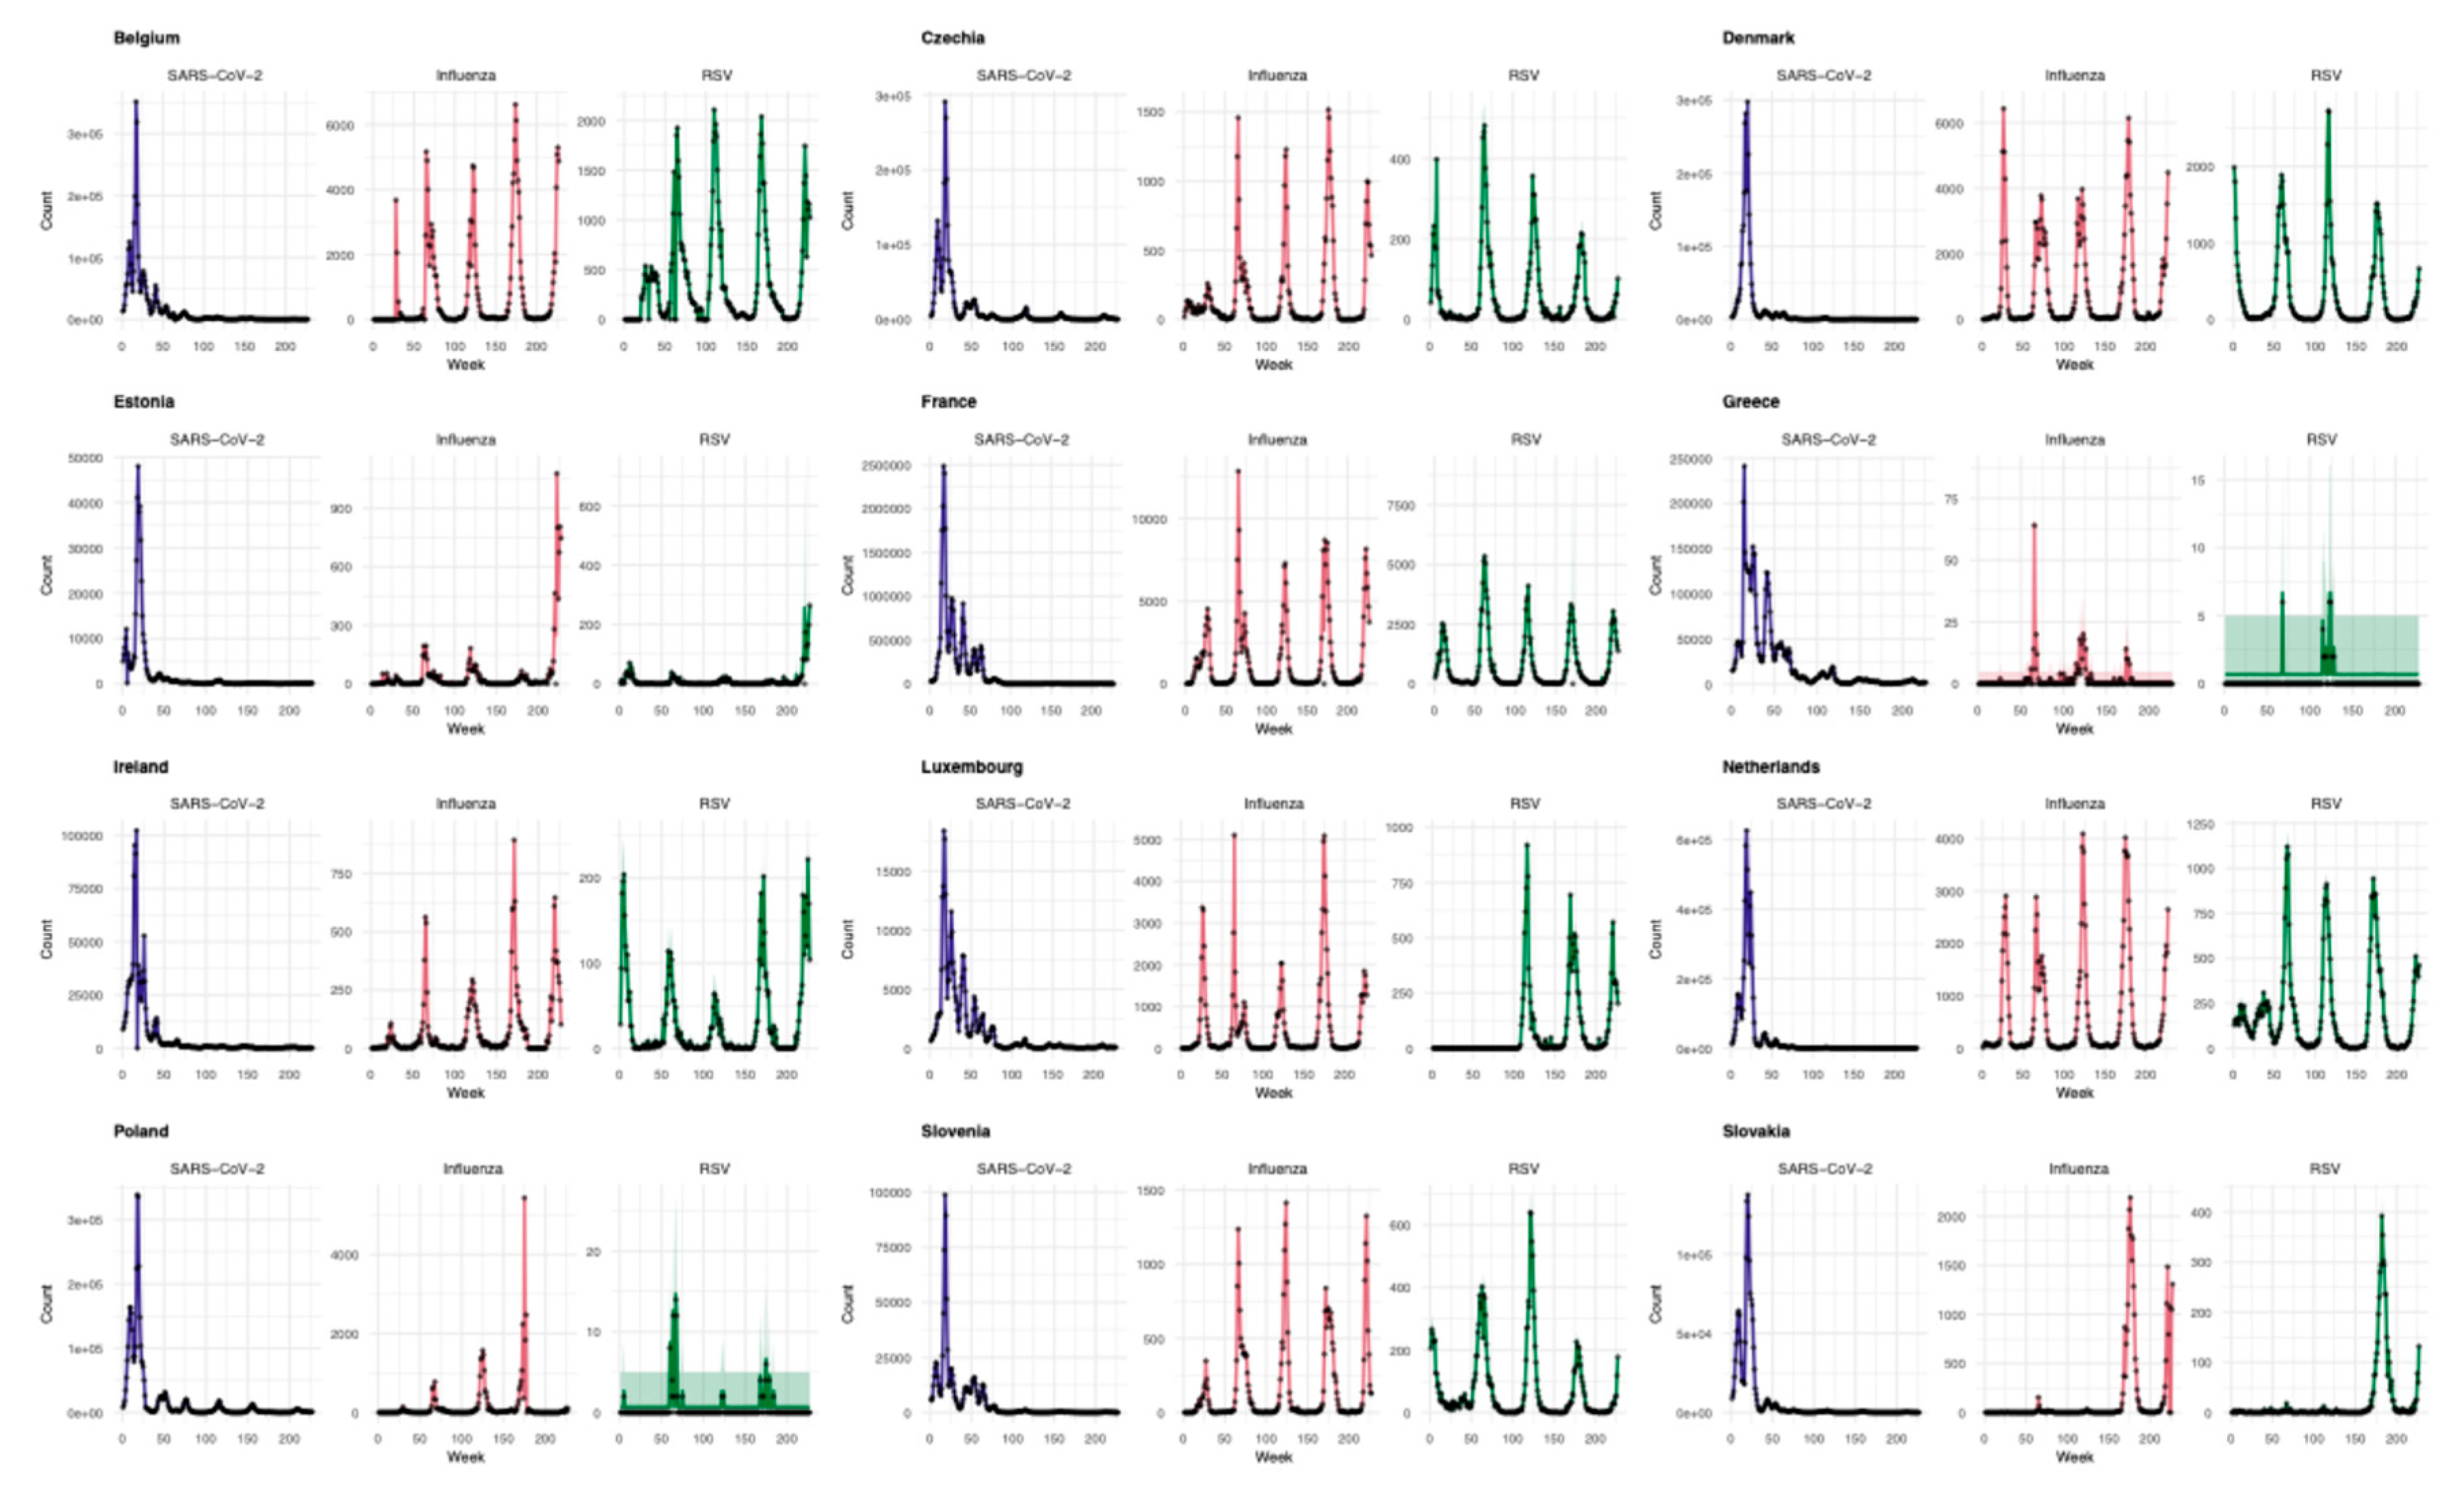
Figure 4.
Pathogen incidence in the ILI sentinel population.
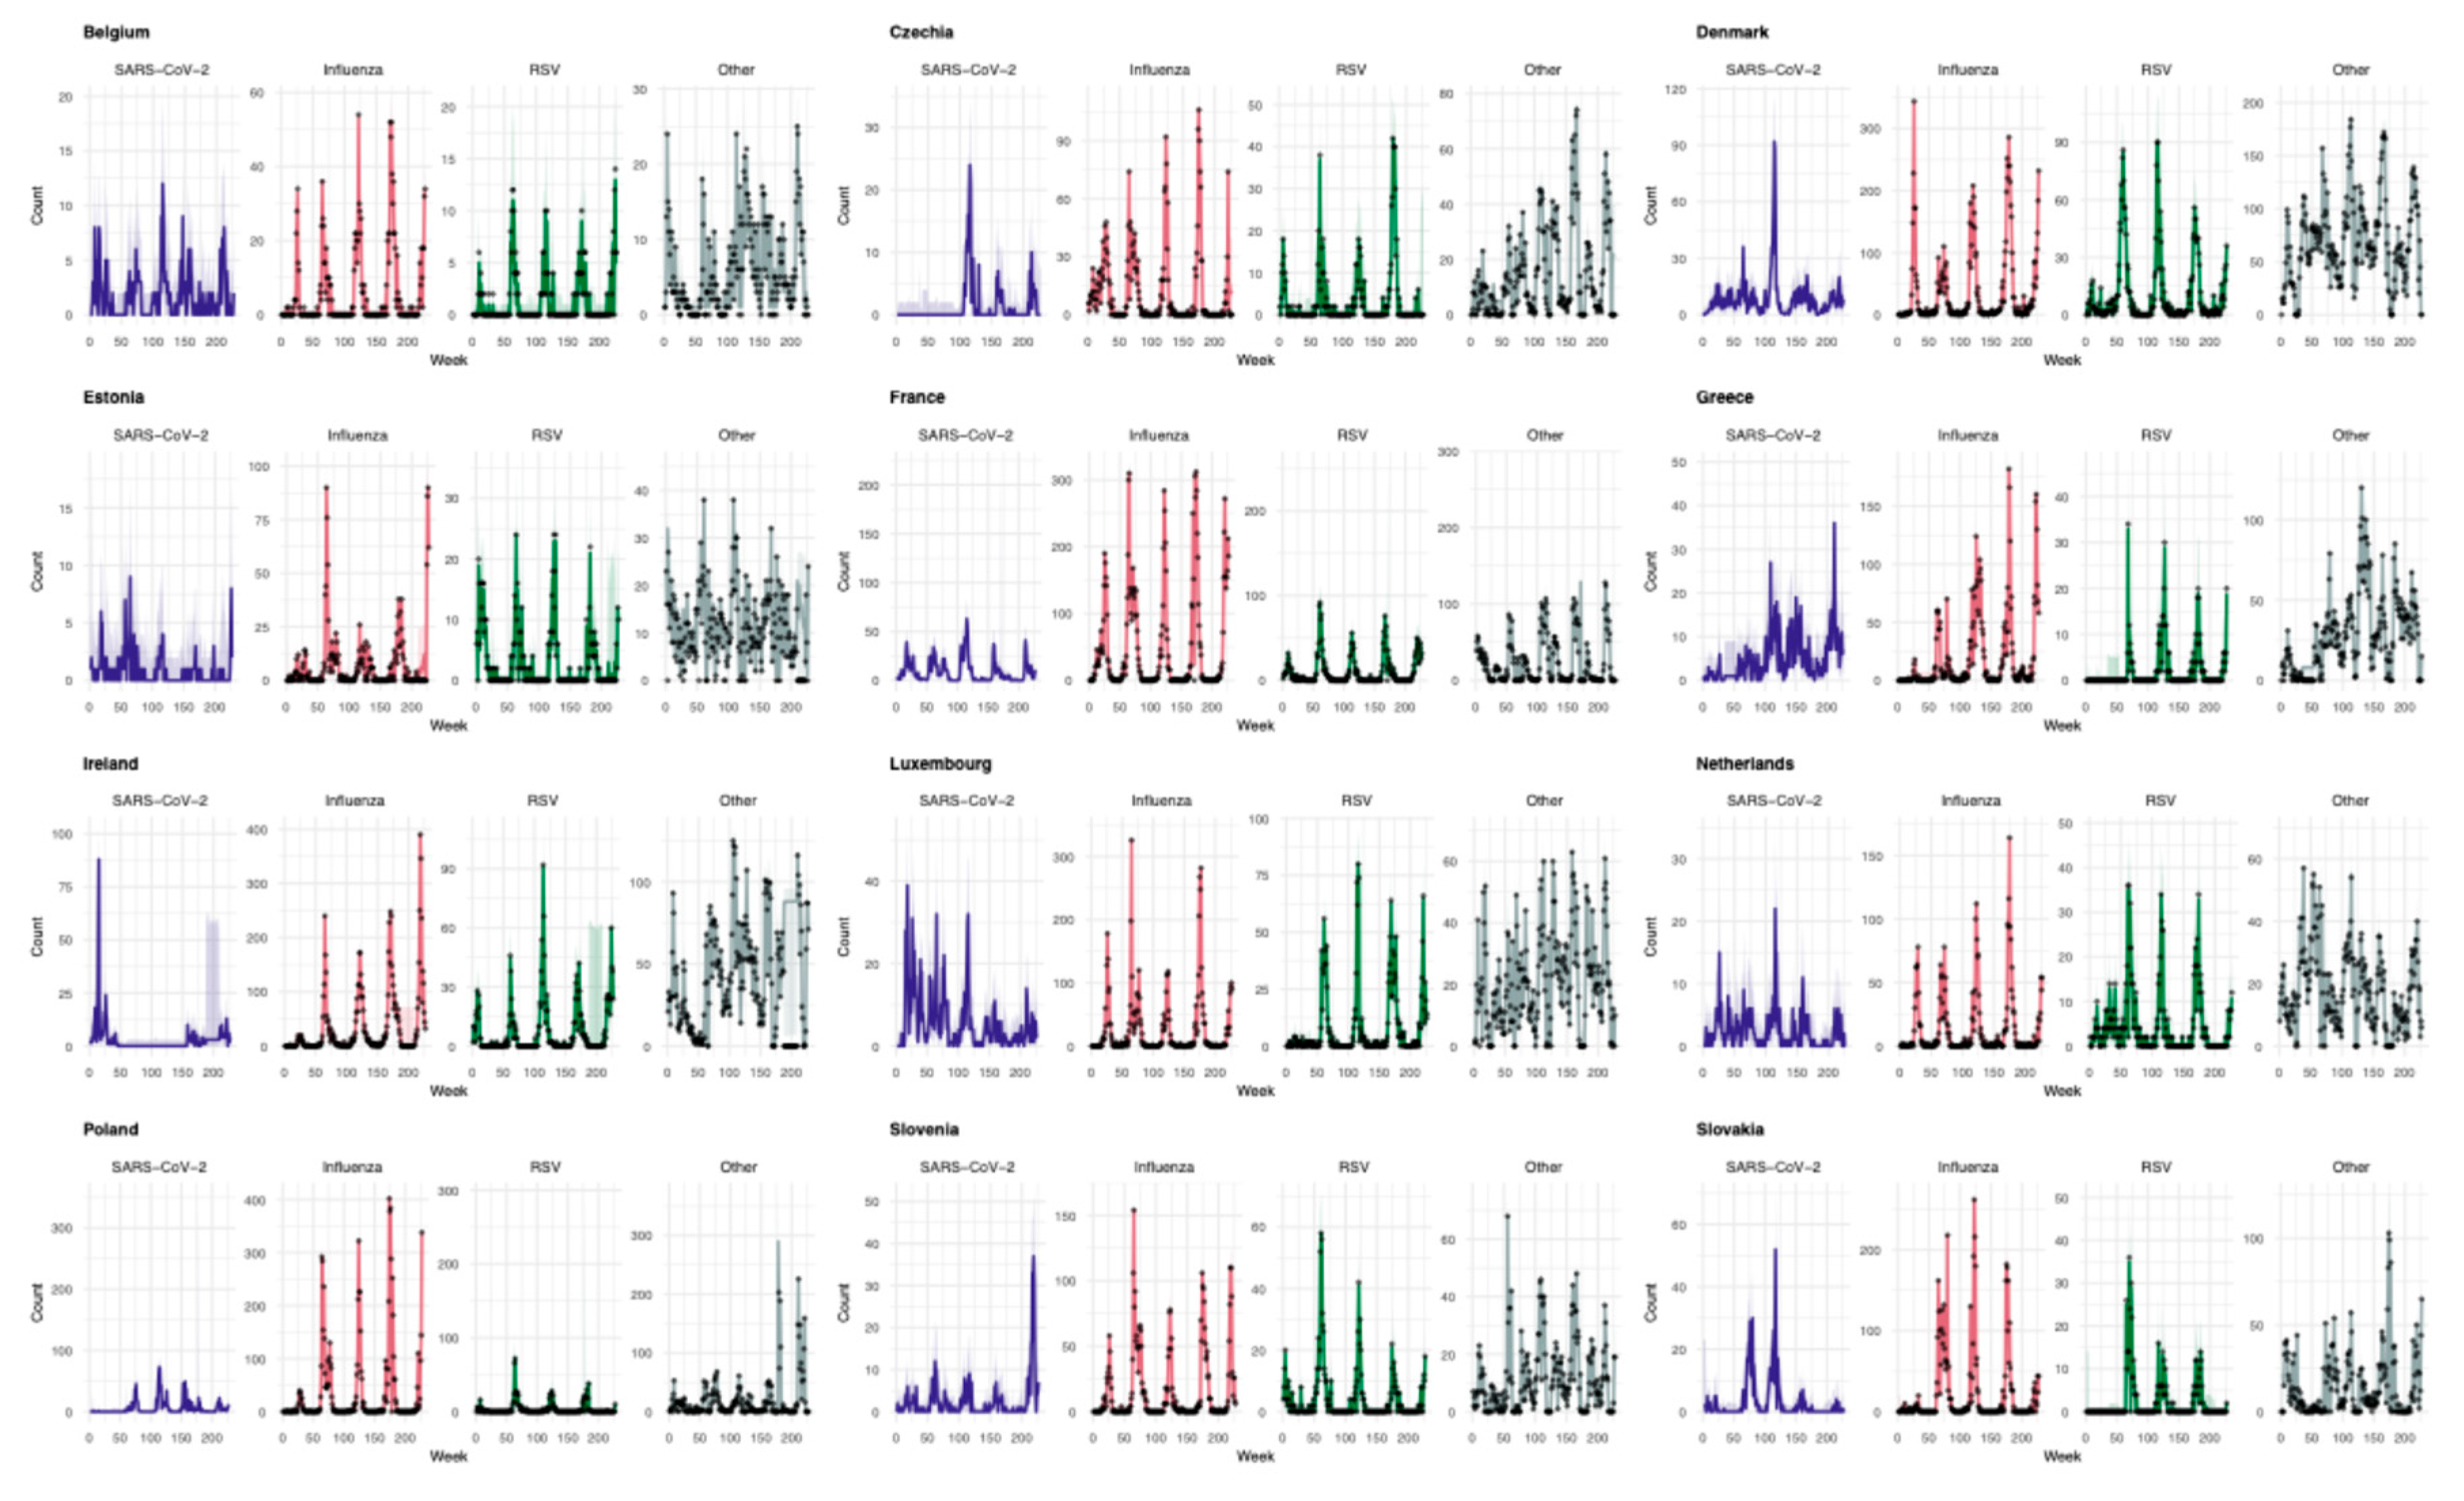
Figure 5.
The detection bias for pathogens in the ILI sentinel population. The red line at 1 indicates no bias in the sentinel population compared to the general population. Across countries, SARS-CoV-2 was underrepresented in the sentinel population compared to the general population, whereas influenza was overrepresented.
Figure 5.
The detection bias for pathogens in the ILI sentinel population. The red line at 1 indicates no bias in the sentinel population compared to the general population. Across countries, SARS-CoV-2 was underrepresented in the sentinel population compared to the general population, whereas influenza was overrepresented.
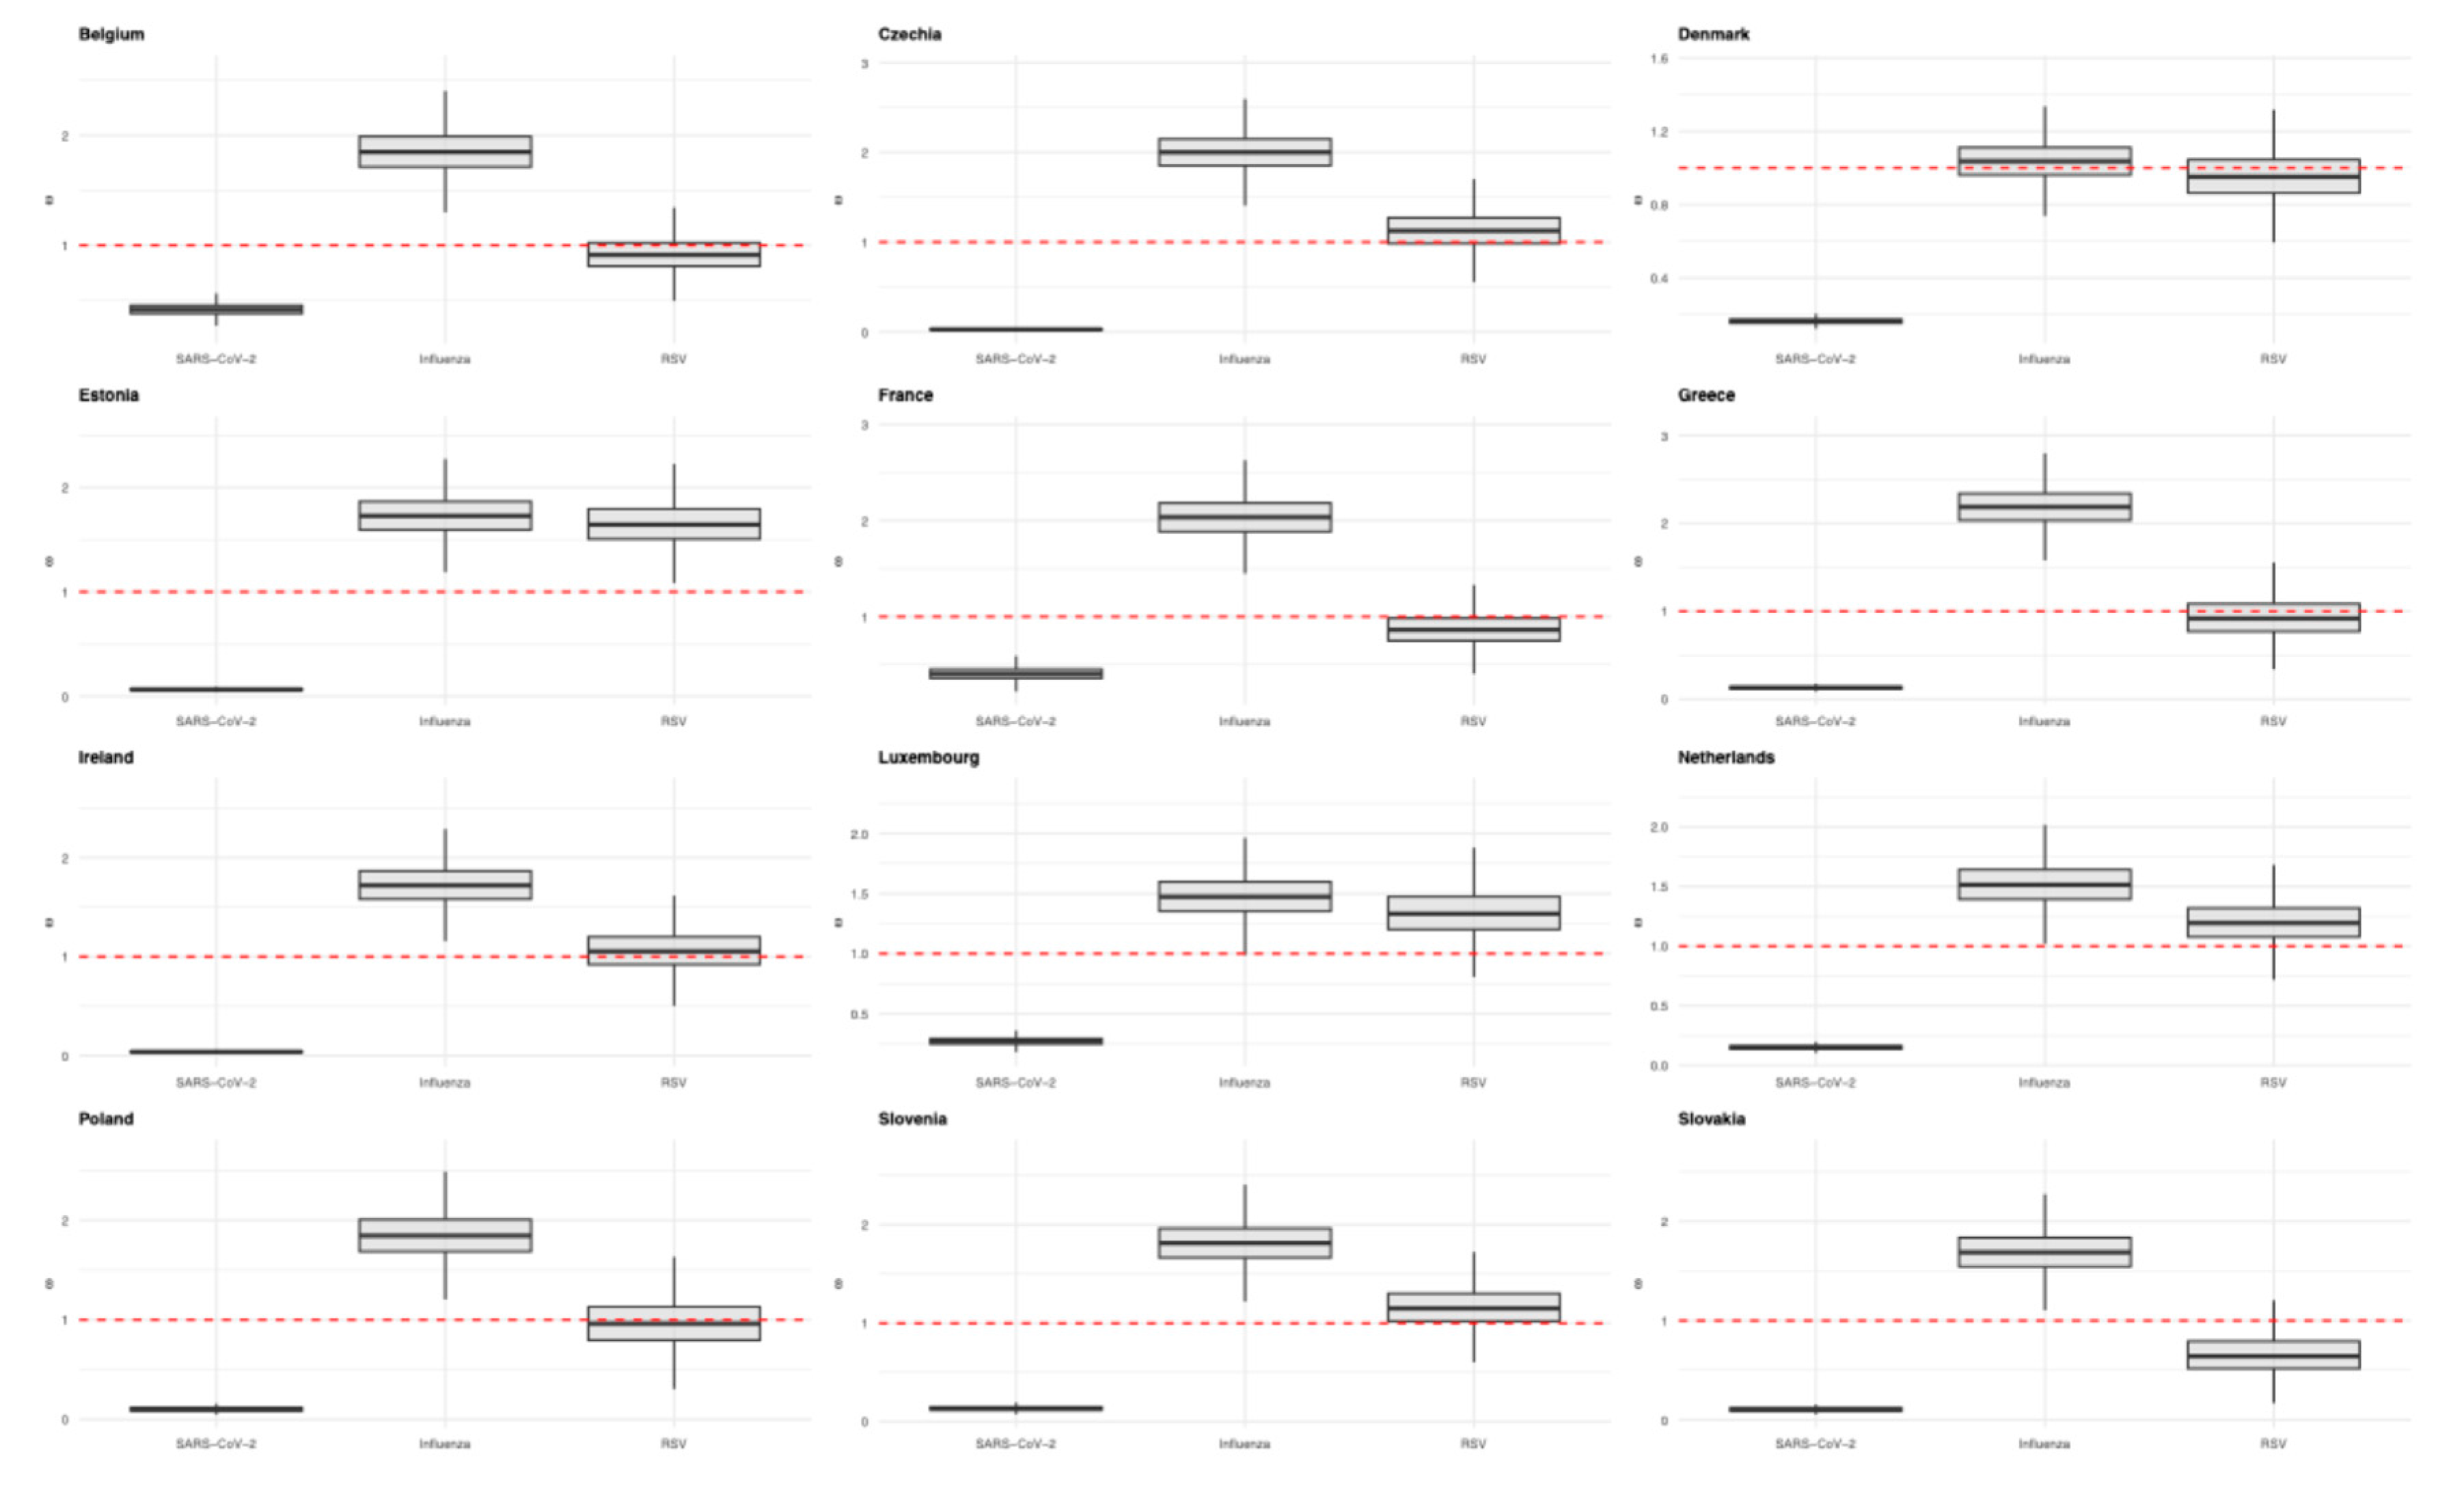
Figure 6.
The normalized median proportion of each pathogen in the sentinel ILI population over time. Influenza dominates episodically during its peak season, whereas SARS-CoV-2 and other pathogens ebb and flow more endemically. Smaller but distinct RSV peaks are also appreciable seasonally.
Figure 6.
The normalized median proportion of each pathogen in the sentinel ILI population over time. Influenza dominates episodically during its peak season, whereas SARS-CoV-2 and other pathogens ebb and flow more endemically. Smaller but distinct RSV peaks are also appreciable seasonally.
Disclaimer/Publisher’s Note: The statements, opinions and data contained in all publications are solely those of the individual author(s) and contributor(s) and not of MDPI and/or the editor(s). MDPI and/or the editor(s) disclaim responsibility for any injury to people or property resulting from any ideas, methods, instructions or products referred to in the content. |
© 2026 by the authors. Licensee MDPI, Basel, Switzerland. This article is an open access article distributed under the terms and conditions of the Creative Commons Attribution (CC BY) license (http://creativecommons.org/licenses/by/4.0/).
Copyright: This open access article is published under a Creative Commons CC BY 4.0 license, which permit the free download, distribution, and reuse, provided that the author and preprint are cited in any reuse.


