

Submitted:
29 June 2026
Posted:
30 June 2026
You are already at the latest version
Abstract
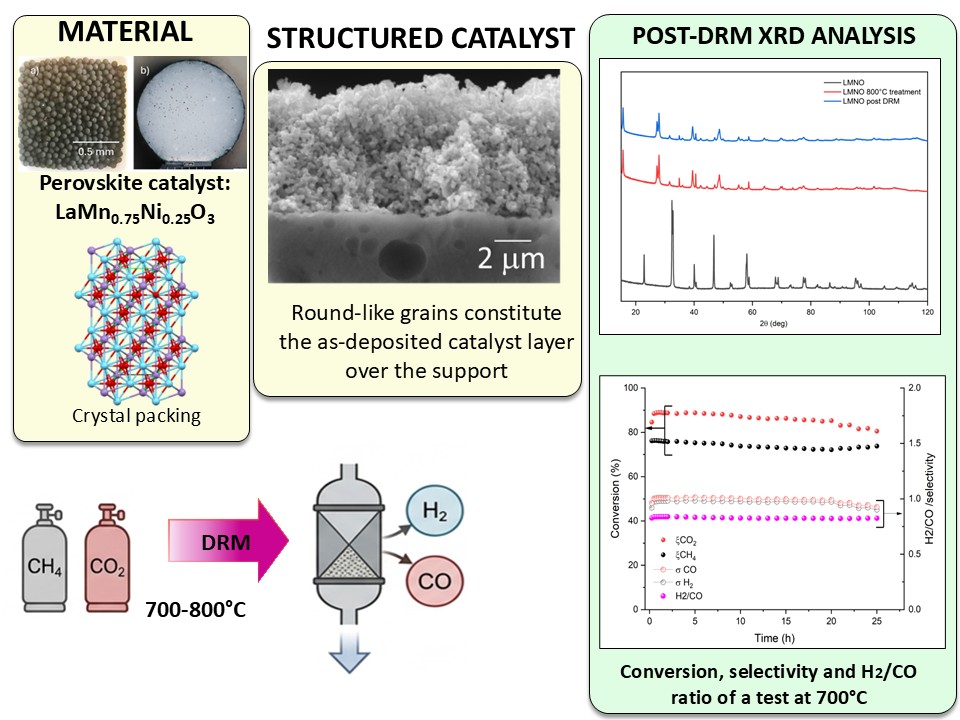
Dry reforming of methane represents a promising approach for the valorization of CO₂ captured from industrial emissions via a high-temperature catalytic process. To this aim, a LaMn1-xNixO3 catalyst with a perovskite structure (x=0.25) for dry reforming was obtained as ultrafine powder by solution combustion synthesis and then softly deposited over -alumina supports as structured catalyst. X-ray diffraction proved that the fresh catalyst exhibits the characteristic framework of corner-sharing BO6 oc-tahedra and Mn substitution in B site. Temperature programmed reduction in H2 showed two main peaks between 200 and 400 °C and between 700 and 900 °C, proving the strong reduction of Mn oxides in different oxidation states and Ni oxide even to the elemental state. Raman spectroscopy on fresh and spent catalyst showed that carbon deposition during reforming was negligible and lattice distortion occurred associated to oxygen vacancies or partial reduction. A 25-hour reforming test with LaMn1-xNixO3 proved conversion of CH4 equal to 75% at 700°C. Dry reforming tests with the struc-tured catalyst confirmed the results obtained with the catalyst powder on a larger scale and different conditions, such as temperature, residence time and CH4/CO2 feed ratio, achieving CH4 conversion of up to 94% at 800 °C.
Keywords:
LaMn1-xNixO3 perovskite
; solution combustion synthesis
; deposition over γ-Al₂O₃ supports
; oxygen vacancy formation
; dry reforming of methane
1. Introduction
The dry reforming of methane (DRM) occurring via reaction R1 is appealing because it can exploit CO2 from carbon capture processes, producing syngas with high heating value and suitable for conversion into valuable chemicals, e.g. methanol. The side reaction (R2) of thermal or catalytic decomposition can likely occur when CO2 is deficient, so that in the reactor the trade-off between the two reactions may take place [1].
CH4 + CO2 = 2 CO + 2 H2 ΔH0 = 247 kJ/mol
CH4 = C + 2 H2 ΔH0 = 74 kJ/mol
DRM requires temperatures over 600 °C for thermodynamic constraints and heat supply, owing to the endothermic character of reaction R1 [2]. In this respect, peak renewable energy could be exploited in electrified reactors via an easy scalable and intensified process strategy [3,4]. Since the heterogeneous catalysis is strictly necessary to improve DRM kinetics at temperature between 600 and 800 °C, tubular reactors represent the widely adopted option for catalytic reforming of hydrocarbons on a medium plant scale [5]. The catalyst deposited on suitable, mechanically resistant substrates forming a structured catalyst in the form of granules, monoliths or foams, should be effective in exchanging the heat required for chemical reactions. In more advanced systems, such as fluidized-bed, greater thermal performance and easiness in catalyst regeneration can be obtained [6], at the expense of certain back-mixing of reactants and products [7].
Nickel based catalysts are the most diffused for industrial processes, having low cost, large activity and good robustness toward deactivation and carbon deposition [8,9]. Depositing Ni-based catalysts onto structured supports such as honeycomb monoliths significantly improves heat and mass transfer, reduces deactivation, and enables operation near thermodynamic limits, making them highly promising for industrial DRM applications [9,10]. However, nickel oxides are even more reported as toxic and carcinogenic [11], suggesting their substitution with safer elements, such as Cu, Ce, Mn, and Fe, although they are less effective in catalysis [12].
In this context, the total or partial replacement of nickel in catalysts is a current topic of the research, aiming at mitigating the loss of performance using the alternative elements by introducing complex multi-oxide systems, for instance perovskites and high entropy oxides [13,14].
Perovskites are versatile, cost-effective, and thermally stable materials characterized by a tuneable molecular structure [15]. In particular, LaNiO₃ perovskites are valuable for their good thermal stability and ability to undergo controlled reduction under reaction conditions. Upon reduction, they form finely dispersed metallic Ni particles strongly anchored to a La₂O₃-rich matrix, which enhances resistance to sintering and coke deposition. These features make LaNiO₃-derived catalysts effective in DRM, where the in situ–generated Ni provides high activity for CH₄ and CO₂ activation while the lanthanum oxide component promotes CO₂ adsorption and contributes to coke mitigation [16]. Thus, Ni containing perovskites exhibit improved catalytic stability due to strong metal–support interactions and dynamic structural reconstruction under reaction conditions [17]. When Mn is incorporated by substituting Ni or partially occupying the B-site of a perovskite structure, the physicochemical and catalytic properties of the catalyst are improved, leading to formation of smaller and more stable Ni nanoparticles after preliminary reduction. Moreover, Mn increases oxygen mobility and favours carbon coke gasification [18]. Therefore, mixed LaMn1-xNixO3 perovskites co-doped with Mn and Ni at the B site, are excellent candidates as catalysts for the dry reforming. However, limited results are currently available in the literature on the use of mixed perovskites supported on structured catalysts.
The determination of the elements in the mixed perovskite, apart from chemical analysis, such as inductively coupled plasma (ICP) mass or optical spectroscopy, can be roughly inferred, rather than accurately determined, from X-ray diffraction data. This is due to the small difference in their atomic numbers (i.e., Z = 25 and Z = 28 for Mn and Ni, respectively), which results in similar scattering factors. Accurate determination of the Ni/Mn ratio typically requires neutron diffraction data, owing to the large difference in the neutron scattering lengths (i.e., -0.373·10-12 cm and 1.030·10-12 cm for Mn and Ni, respectively). For this reason, Blasco and co-workers studied this family of perovskites also by neutron diffraction [19].
In the present research a mixed LaMn1-xNixO3 perovskite catalyst having a Ni content less than 60%wt, and Mn as substitute in B site was produced by solution combustion synthesis (SCS). The experimental activities covered various levels of development, including: i) synthesis of a LaMn1-xNixO3 perovskite powder from pure reactants, ii) physicochemical analysis by chemical and X-ray techniques, iii) soft deposition of the catalyst on γ-alumina supports, and iv) testing in fixed bed reactor of dry reforming under different operating conditions. The results and their discussion provided new insights into the exploitation of catalytic DRM with mixed perovskite at the basic and applied levels.
2. Methods
2.1. Materials and Physicochemical Characterization
A perovskite powder with a nominal stoichiometry LaMn0.75Ni0.25O3 was synthesized via SCS starting from La(NO3)3·6H2O (99.99%, Sigma-Aldrich), Mn(NO3)2·4H2O (97%, Sigma-Aldrich) and Ni(NO3)2·6H20 (99.99%, Sigma-Aldrich) as metal precursors and citric acid as fuel. The combustion process was carried out with a molar ratio of fuel to total metal cations of 2 and a reducer-to-oxidizer ratio (φ) of 1.5. The pH of the solution was adjusted to 6 using a 28% (v/v) ammonia solution (Merck). NH4NO3 (98.0%, Sigma-Aldrich) was incorporated as an oxidizing agent. The mixture was stirred magnetically at 80 °C in a stainless-steel beaker until a uniform gel was obtained. Subsequently, the temperature was raised to around 350 °C, triggering a self-sustaining combustion reaction that yielded a dark-brown powder. The as-burned powder was calcined in static air at 900 °C for 5 h with a heating rate of 10 °C/min and sieved in the particle range dp=250-400 μm. The as-obtained fresh product is hereafter labelled LMNO, with nominal x=0.25.
Batches of structured catalyst was prepared by soft dry mechanical deposition of the calcined and sieved LMNO powder in a rotating jar for some tenths of hours without milling balls and dispersing wet medium, on γ-alumina porous spheres (1.8 mm outer diameter). The rolling of the jar was repeatedly paused and restarted till the preset loading of perovskite was reached.
X-ray powder diffraction data were collected using a Rigaku RINT2500 rotating-anode diffractometer operating at 50 kV and 200 mA, equipped with a Rigaku D/teX Ultra silicon strip detector. Monochromatic Cu Kα1 radiation (λ = 1.54056 Å) was selected using an asymmetric Johansson Ge(111) crystal, ensuring high angular resolution suitable for ab-initio structure solution. The powders were finely ground and loaded into Lindemann glass capillaries with a diameter of 0.5 mm. Data were collected in transmission mode by spinning the capillary to minimize preferred orientation effects. The diffraction patterns were recorded over the 2θ range of 6–100° with a step size of 0.02° and a counting time of 2 s per step. These conditions allowed collecting high-quality data, suitable for reliable structure solution and subsequent Rietveld refinement.
Temperature programmed reduction (TPR) of LMNO fresh catalyst powder was carried out with Autochem 2950 HP system (Micromeritics, Norcross, GA, USA) equipped with a TCD detector. Before analysis, 0.1 g of the sample was pre-treated with a mixture of 5% O2/He (v/v, 30mL/min) while heating up to 400 °C, 10 °C/min heating rate; afterwards, it was left at this temperature for 30 min. Upon cooling to room temperature, the gas mixture of 5%vol H2/Ar (30 mL/min) was introduced into the sample tube, and the temperature increased up to 900 °C, 10 °C/min heating rate. The hydrogen consumption associated with the TPR profile was determined by peak integration applying a calibration curve, obtained at different H2/Ar ratio. Specific surface area and pore volume were evaluated by N2 adsorption–desorption analysis at -196 °C using an ASAP 2020 instrument (Micromeritics, Norcross, GA, USA). Prior to analysis, LMNO sample was degassed at 250 °C for 2 h under vacuum. The Brunauer–Emmett–Teller (BET) method was applied over the relative pressure range 0.05–0.30 (P/P0), to calculate the specific surface area. Pore volume was determined from the desorption branch using the Barrett–Joyner–Halenda (BJH) method. ICP-IOS analyses were conducted with an Agilent 5100 instrument.
Thermogravimetric analysis (TGA) was performed using a TGA 1 Star System (Mettler Toledo, Schwerzenbach, CH). The sample was heated from room temperature to 100 °C and held at this temperature for 1 h. The temperature was then increased to 1100 °C at a heating rate of 10 °C/min under a constant air flow of 30 mL/min.
Raman spectra of the as-prepared fresh and spent catalysts were collected using a ThermoFisher Scientific (Waltham, MA, USA) DXR3 Raman spectrometer using a 532 nm laser at 0.8 mW power. A 50 μm slit and a 20× objective lens was used, with each spectrum acquired over 30 s and averaged from 10 scans. Microstructural characterization of the structured catalyst was carried out by means of a variable pressure SEM (Quanta 200, FEI): surface and fractured sections of the structured catalyst (as deposited and after DRM) were observed without conductive coating to prevent charging.
2.2. Dry Reforming of Methane
A simulation unit, consisting of an electrically heated fixed bed quartz microreactor, 12 mm ID and 200 mm length, was used for preliminary screening of DRM catalytic activity of LMNO powder with 40–60 mesh size diluted 1:5 by weight with silicon carbide of the same mesh size. To clean up the catalyst surface the sample was pre-treated in-situ under flowing O2 (5% vol. He, 3.0 L/h) at 350 °C for 30'. Upon cooling to room temperature, the sample was reduced under flowing H2 (5% vol. in He, 1.8 L/h) and increasing the temperature to 800 °C with a 10 °C/min ramp and a holding time of 60 min. The feed gas, consisting of 15% vol. of CH4 + 15% vol. CO2 in He, was led over the catalyst (100 mg) at a flow rate of 6.0 NL/h, and the catalytic test was carried out at 700 °C for 25 h on stream. The molar fraction Y of relevant species, were analyzed by GC (Agilent 7890B) equipped with a DB-1 capillary column and a molecular sieve, to follow the evolution of CH4, CO, CO2, H2 and O2 using Flame Ionization Detector (FID) and Thermal Conductivity Detector (TCD).
DRM tests with the structured catalyst were carried out in a laboratory plant consisting of a tubular reactor made in AISI 316 stainless steel, 21 mm ID, 300 mm length, 48 mL volume (Figure 1). The reactor was filled with 30 mL of structured catalyst comprised between two wads of ceramic wool at the ends. Electronic mass-flow controllers (Brooks SLA5850) supply gas streams from pressurized tanks of N2, CO2, CH4 and H2 to obtain the desired composition and flow rates of the feed flowing inside the reactor. A continuous gas analyser (Pollutek mod. 3160P) monitored and recorded the composition of the gas stream exiting the reactor, in terms of molar fraction Y of CH4, CO2, H2 and CO. Each test consists in heating the reactor at preset temperature in flowing N2, conditioning the structured catalyst at 800 °C in H2/N2 atmosphere (10%vol./90%vol.), starting the DRM test at fixed operating conditions, namely temperature, residence time and YCO2/YCH4 feed ratio. Before starting DRM, the reactor is purged with flowing N2.
Data acquired from the gas analyzer were subsequently elaborated. Conversion ξ and selectivity c of some gaseous species were computed via Equations 1-4.
Where ni,in and ni,out are, respectively, the number of moles of gaseous species i entering and getting out the tubular reactor. The residence time τ was computed as the ratio between empty reactor volume V and volumetric flow rate Q0 of the reactants at reactor temperature (Eq. 5).
ξCO2 = (nCO2,in - nCO2,out) / nCO2,in
ξCH4 = (nCH4,in - nCH4,out) / nCH4,in
τ = V / Q0
The gas hourly space velocity GHSV was computed based on LMNO mass deposited on the structured catalyst and volumetric flow rate of the mixture (Eq. 6).
GHSV = Q0 / mcat
The feeding ratio r0 was computed by Eq. 7, based on molar flow rate of CO2 and CH4 (Eq. 7).
r0 = nCO2 / nCH4
3. Results
3.1. Characterization of the LMNO Perovskite
A representative SEM micrograph of the calcined and sieved LMNO (Figure 2) clearly shows particle morphology of the synthetized powder along a rather submicron range.
Powder X-ray diffraction (PXRD) data of LMNO were collected to support further physicochemical and catalytic investigations. The crystal structure was determined via ab-initio structure solution process, while structural and microstructural parameters were optimized through Rietveld refinement. The crystal structure of fresh LMNO was successfully solved using the EXPO software package [20]. The structure model well agrees with literature on the La-Mn-Ni-O₃₊δ series [19], which crystallized in the rhombohedral symmetry (space group R-3c). Rietveld refinement led to optimized unit cell parameters (hexagonal axes), giving the final refined values a=5.5179(9) and c=13.308(5) Å. The refinement procedure also included the site occupancy factor (SOF) for Mn and Ni atoms sharing the B-site, starting from an initial value of 0.5 for both. A. Even though the SOF values for Mn and Ni could not be accurately estimated if refined using X-ray diffraction data (see §1), it was chosen to refine them anyway because the Rietveld results gave useful insights: i) they confirmed, as expected, that the B-site was preferentially occupied by Mn rather than Ni; ii) the refined SOF values (i.e, 0.11(2) and 0.89(2) for Ni and Mn, respectively), were closer to the expected values (i.e., 0.25, 0.75) than the unrefined SOF values (i.e., 0.5, 0.5).
A representation of the asymmetric unit and the crystal packing is shown in Figure 3. The crystal architecture exhibits the characteristic framework of corner-sharing BO6 octahedra. The Rietveld refinement results for LMNO are visualized in Figure 4, showing good agreement between observed and calculated profiles (the corresponding values of the agreement factors Rp and Rwp are 3.5%, 5.6%, respectively), which supports the reliability of the structural model.
The PXRD pattern of LMNO, as displayed in Figure 5, show the effect of reduction at 800 °C (red curve) and of the dry reforming of methane (post-DRM, blue curve), which is very similar to each other, while both patterns differ significantly from the fresh LMNO perovskite (black curve).
To have insights into the crystalline phase changes, a qualitative phase analysis of the diffraction patterns was carried out using the software QUALX2.0 [22], querying the database POW_COD and revealing the presence of the following three main phases in the reduced catalyst: (1) Lanthanum hydroxide (La(OH)₃, POW_COD entry #4031381), (2) Manganese oxide (MnO, POW_COD entry #1514105), (3) Nickel metal (Ni, POW_COD entry #2100646). The structure models for these phases were retrieved from the Crystallography Open Database (COD) as CIF files and used as starting models in EXPO for quantitative phase analysis. This approach allowed estimation of the weight fractions of the three phases in the sample (the majority phase was Lanthanum hydroxide). Additionally, the average crystallite size of each phase was estimated using the FullProf software package [22]. The fresh LMNO sample exhibited an average crystallite size of approximately 314 Å, whereas the quantitative phase analysis (QPA) results together with the average crystallite size of each phase for the LMNO at 800°C and after DRM are summarized in Table 1.
The phase identification results revealed the complete transformation of the perovskite structure upon high-temperature treatment at 800 °C and after DRM. These results are consistent with the expected structural transformations of LaNi–Mn perovskites under such reactive environments and provide important insight into the relationship between structural evolution and catalytic performance.
The weight fractions shown in Table 1, while providing a useful indication of the majority and minority phases among the main three identified ones, are probably affected by errors due to the possible presence of amorphous component(s) [23,24] and/or further unidentified minority crystalline phases that were not taken into account during QPA.
BET method gave a specific surface area of 11 m²/g for the LMNO powder, a low value typical for non-microporous materials. Pore volume, determined from the desorption branch using the Barrett–Joyner–Halenda (BJH) method, was about 0.05 cm³/g.
ICP analyses reported Mn and Ni content in the LMNO fresh powder equal to 17.1±0.7 and 5.6±0.3 %wt., respectively. Thus, the corresponding formula coefficient is x=0.23, very close to the nominal values 0.25.
In Figure 6 the reduction curve registered by TPR is displayed: the H₂-TPR profile of LMNO exhibits a multi-step reduction behavior characteristic of mixed B-site substituted perovskites, reflecting the progressive reduction of manganese and nickel species together with the removal of lattice oxygen. In the low-temperature region (≈200–400 °C), a broad reduction region with two main peaks was observed, which can be attributed to the reduction of higher oxidation states, namely Mn⁴⁺ to Mn³⁺ and Ni³⁺ to Ni²⁺, typically associated with surface or weakly bound oxygen species and more labile cation environments. Moreover, further reduction of Ni2⁺ to Ni0 likely occurred in this region [25]. The relatively low-temperature reducibility of Mn species, so far discussed, was enhanced by the presence of Ni which promotes oxygen mobility and defect formation within the perovskite lattice with respect to Ni-free LaMnO3 counterpart, previously reported [26]. At intermediate temperatures (≈500–700 °C), a less intense and asymmetric contribution, similar to a shoulder, was detected corresponding to the reduction to the metallic state of more stable Ni2+ species well stabilized within the bulk perovskite lattice. In that region reduction of Mn³⁺ to Mn²⁺ cations occupying the B-site of the perovskite with local structural distortions may also take place [27]. Finally, the high-temperature region (≈700–900 °C) was dominated by an intense reduction peak, assigned to the final reduction of all Mn³⁺ to Mn²⁺ species with a stable local environment, likely in the bulk of the perovskite structure, requiring significantly higher activation energy. This step involves the removal of strongly bound lattice oxygen and is accompanied by the structural collapse of the perovskite lattice [25]. The overall experimental hydrogen consumption (110 ±5 mL H2/g) was higher than the theoretical values expected for the complete reduction of Ni²⁺ to Ni⁰ (~25 mL/g) and Mn⁴⁺/Mn³⁺/Mn²⁺ (~76 mL/g) supporting the presence of some Ni3+ species along with the expected Ni²⁺ cations.
A DRM test was performed at 700°C for 25 h with LMNO powder in the simulation unit (Figure 7). The catalyst exhibited stable activity during the test duration, obtaining CO2 and CH4 conversion of around 80% and 70%, respectively. CO selectivity was 1.0 while H2 selectivity was 0.97 because of a small amount of H2O formation and congruently the H2/CO ratio was lower than 1.
The catalyst extracted from the reactor after the prolonged test was subjected to TGA characterization for assessing possible carbon deposition. Figure 8 displays the TGA weight change versus temperature in oxidizing atmosphere. No weight loss occurred in the temperature range 600-800 °C that is typical of carbon oxidation, whereas a small increase appeared due to oxidation of reduced phases.
Raman spectroscopy was employed to probe the vibrational modes of the perovskite catalyst and to identify carbon species formed after the DRM reaction. As shown in Figure 9, LMNO as- prepared catalyst exhibited two characteristic bands at 526 and 657 cm⁻¹, which are typical of LaMnO₃-type perovskites [28]. The band at 526 cm⁻¹ is attributed to the bending vibration of Mn(Ni)O6 octahedra, while the band at 657 cm⁻¹ corresponds to the stretching vibration of the Mn(Ni)–O bond associated with Jahn–Teller distortion of the Mn(Ni)O6 framework.
After the dry reforming reaction, the Raman spectrum of the spent catalyst showed two additional very weak bands located at 1347 cm⁻¹ and 1583 cm⁻¹, corresponding to the D and G bands typically associated with carbon species [29]. However, thermogravimetric analysis (TGA) of the spent catalyst did not reveal any significant weight loss related to carbon oxidation, suggesting that the amount of carbon deposited during the reaction was negligible. Moreover, the Mn–O stretching band shifted from 657 cm ⁻¹ in the as-prepared LMNO to 643 cm ⁻¹ in the spent catalyst, indicating modifications in the local lattice environment under DRM conditions. The observed shift can be attributed to changes in the manganese oxidation state induced by reduction process occurring during the H2 pre-treatment reduction, in agreement with the collapse of the original perovskite structure and the formation of MnO [30]. This interpretation is supported by both XRD results (Figure 5, Table 1) and H2-TPR analysis, evidencing the structural evolution and reducibility of the material, respectively.
3.2. Structured Catalyst: Soft Deposition and Dry Reforming
After the characterization of the as-prepared fresh LMNO powder, the structured catalyst was investigated. It consisted of regular and porous commercial γ-alumina spherules, 1.8 mm outer diameter, coated with the LMNO catalyst, as displayed in Figure 10a.
In Figure 11 an example of a γ-alumina support depleted of catalyst (Figure 11a), and of a coated support before (Figure 11b) and after reforming test (Figure 11c) are shown. The analysis by SEM of the coated support confirmed that the external surface of the spherule is almost fully covered by the LMNO catalyst. Zones of accumulation conferred a surface morphology resembling that of a golf ball, while at a finer inspection scale the partly pristine dimpled appearance gets a more homogeneous texture. The texture of the catalyst coating was studied by SEM, analyzing fractured cross sections of the ceramic support. The thickness of the deposited catalyst was estimated by SEM in the range of 5-10 μm. In particular, the pronounced 3D view of the support in Figure 11c allows to emphasize some zones where the catalyst coating slightly detached after testing.
Figure 12 shows the molar fraction of CO2, CH4, CO and H2 during a typical DRM test carried out at constant flow rate of reactants and three different temperatures. Stable values of all gas components were attained at each temperature; congruent increase of CO and H2 and decrease of CH4 and CO2 with temperature can be noted.
The comparison of the results of three structured catalysts having different nominal content of perovskite, i.e. X=2.5, 5.0 and 7.5%wt., is shown in Figure 13 in terms of CH4 conversion and H2 selectivity. Both variables largely increased from X=2.5wt% to X=5.0wt%, whilst the increase was less pronounced, in particular for σH2, moving to the largest value X=7.5wt%. The method used for powder deposition led to the formation of an external coating that likely covered the external surface of γ−alumina supports when X exceeded a certain value, making further deposition of the catalyst less effective, as the case of X=7.5%wt. Thus, the value X=5.0%wt. was selected for systematic investigation of DRM in the laboratory plant.
The operating conditions and the results of dry reforming tests, in terms of CH4 and CO2 conversion, CO and H2 selectivity are reported in Table 2. The tests were conducted at three temperatures (T = 700, 750 and 800 °C), different residence time τ and different CO2/CH4 feeding ratio r0. The trends are fairly consistent with the parameter variations: increasing temperature and residence time leads to greater conversion and, conversely, H2 selectivity increases with CO2 conversion. The variation in the CO2/CH4 feed ratio is also congruently reflected in the decrease in the H2/CO ratio produced when moving from catalytic decomposition to dry reforming conditions.
The trends of CH4 and CO2 conversion, and YH2/YCO ratio with the temperature are displayed in Figure 14, at constant residence time and CO2/CH4 feeding ratio. The increase in conversion of both reactants with T is well evident, and a slight parallel increase in the H2/CO ratio is noted, as the reduced availability of CO2 lowers the oxidation of H2 to H2O.
The increase of the residence time has a marked positive effect at T=800°C on the conversion of CO2 and CH4, as displayed in Figure 15, thanks to the decreased impact of kinetic and diffusion limits on the conversion of reactants at larger τ. In turn, the H2/CO ratio exhibits a clear increase with the residence time, the H2 oxidation being hindered as ξCO2 increases.
The tests carried out at increasing CO2/CH4 feeding ratio (r0), at constant T and τ, shown in Figure 16a exhibited rather stable conversion of CO2 close to 1.0, slight increase of CH4 conversion thanks to major contribution of reaction R1 and decrease of H2/CO ratio because in the investigated range r0 = 0 ÷ 1.5 the system moves from CH4 catalytic decomposition, in which no CO was produced, to dry reforming, with comparable production of H2 and CO. While the selectivity was practically equal to 1.0 in the tests relating to Figure 14 and Figure 15 (Table 2), in this case (Figure 16b) there is a change of both selectivity values with r0: σCO markedly increased and σH2 slightly decreased at larger r0, because the augmented availability of CO2 limited carbon deposition and conversely enhanced the oxidation of hydrogen to H2O.
3.3. SEM Microstructural Analysis of the Structured Catalyst
Figure 17 and Figure 18 display, respectively, SEM micrographs from the structured catalyst before and after DRM. In particular Figure 17 shows how the cross-section of the structured spent catalyst’s coating appears: compared to Figure 17a (i.e., fresh catalyst), the primary particles of the spent catalyst (Figure 16b) underwent a slight grain coarsening though the porous character of the layer was basically retained. The comparison in Figure 17 is representative of the changes in size and shape of the primary particles, where rounded grains in the as-deposited (fresh) catalyst layer on the support progressively evolve into faceted particles. The comparison in Figure 17 also highlights differences in the thickness of the as-deposited catalyst layer: the range of 5–10 μm shows a characteristic “golf ball-like” appearance. (see Figure 11b,c). The imaging mode of Figure 17 enhances the particle morphology more than the average atomic number and its local difference. The corresponding images (not shown) acquired using the back-scattered mode did not show clear signature of coating/substrate interaction. To gain insight into finer microstructures of the spent catalyst, higher magnification portions of the coating were analyzed by SEM (Figure 18).
In particular, special emphasis was put on tiny sub-micrometric dots which were not observed in the as-deposited catalyst layer: some examples of these dots are marked in Figure 18a. The same area was imaged using the backscattered electron mode (Figure 18b): this BSE-SEM micrograph replicates well the porous nature of the coating where dark features are located, but it was not conclusive to assess a possible different chemical nature of such tiny dots which decorate the external surfaces of grains forming its substrate whose typical size in turn tends to fall into a micrometric range.
4. Discussion
The comparison between the tests performed at different scales shows better performances in the case of the quartz microreactor, due to differences in operating conditions and fluid-dynamics of the set-up. The conversions of CH4 and CO2 in Figure 7 are around 0.75 and 0.85, respectively, resulting larger than the values achieved in the reforming plant, i.e. ξCH4 = 0.61 and ξCH4 = 0.79, although the residence time was slightly different. The reduced size of the quartz microreactor and the dispersion of the LMNO perovskite in inert bed of SiC contributed to more efficient reactor operation in terms of temperature control and catalyst availability to reactants. Conversely, the soft deposition of the perovskite on γ-alumina supports, though it is less favourable for a more effective contact between reacting feeds and catalyst occurring over the support surface, it allows to operate with a pressure drop in the bed lower by at least one order of magnitude, according to the Ergun equation [31], being more realistic for an industrial application. The deposition was labelled “soft” because the adopted set-up did not foresee hard mixing media to favour adhesion to the γ-Al2O3 support.
A decay of catalytic activity was noted in both cases of quartz reactor and reforming: ξCH4 declined from 0.76 to 0.73 (in 20 h) and from 0.73 to 0.72 (in 30 min), respectively. Again, the structured catalyst was likely affected by a temperature gradient inside the reactor in the order of about ±50 °C which however was negligible in the microreactor. To recover (part of) the catalytic activity after DRM, the regeneration by mild oxidation in O2 (10%vol.) at 800°C, followed by reduction under H2 (10%vol.) proved to be effective for the structured catalyst.
The microstructural analysis using FullProf software [32] performed on the fresh LMNO catalyst and the two powder samples obtained after reduction at 800 °C and DRM revealed that the MnO phase (i.e., one of the three main crystalline phases resulting from the complete degradation of the fresh LMNO perovskite, see Table 1) was characterized by an average crystallite size larger than that of the original fresh perovskite (~ 314 Å). The increase in the MnO crystallite size can be ascribed to thermally induced sintering and growth, causing partial deactivation of the catalyst. XRD analyses performed on the powder residue collected from the structured catalyst showed diffraction profile similar to that of the pristine LMNO perovskite, confirming that the deposition process onto the spherical γ-Al2O3 support does not alter the perovskite structure. In contrast, XRD measurements carried out on the powder residue recovered after DRM experiments in the steel reactor revealed qualitative phase compositions consistent with the complete transformation of the initial LaMn1-xNixO3 perovskite into new main crystalline phases reported in Table 1.
Table 3 reports CH₄ and CO₂ conversion data, H₂/CO ratios, and selectivity to H₂ based on recent literature articles for Ni supported over Al2O3 [33] and LaNi₁₋ₓMnₓO₃ catalysts [24,34,35,36,37,38,39] . Benguerba et al. [33] reported CH4 conversion equal to 0.91 at 650 °C during DRM in fixed bed reactor with Ni (33% wt.) supported over Al2O3, the better performance with respect to present catalyst (Table 2) being likely attributable to the much higher Ni content. As far as perovskites are concerned, although it is difficult to make a direct comparison, as the compositions of the reaction mixtures vary from case to case, a review of Table 3 shows that the LMNO catalyst under study exhibits CH₄ and CO₂ conversion values and an YH2/YCO ratio that compare very well or are even better than those of similar catalysts reported in literature.
A possible next stage of this research could involve a comprehensive evaluation of the developed structured catalyst for the dry reforming of heavier hydrocarbons and complex residual industrial streams. This line of research aligns closely with the principles of the circular economy, as it aims to transform waste materials into valuable products—such as hydrogen or synthesis gas—thereby reducing environmental impact and improving overall process sustainability. Attention could be paid to low-value by-products such as glycerol derived from biodiesel production, as well as other oxygenated or high-boiling compounds typically found in industrial waste streams [40]. Such an investigation would not only assess the catalyst’s activity, selectivity, and stability under more challenging operating conditions, but also explore its resistance to deactivation phenomena. By extending its application to these more demanding feedstocks, the catalyst’s versatility and robustness could be demonstrated.
5. Conclusions
Single phase LaMn1-xNixO3 perovskite catalyst was produced by solution combustion synthesis and subsequently treated in furnace at 900 °C. TPR characterization proved higher reducibility of the catalyst with overall hydrogen consumption higher than the theoretical values expected for the complete reduction of Ni²⁺ to Ni⁰ supporting the presence of some Ni3+ species along with the expected Ni²⁺ cations.
The structured catalyst obtained by soft mechanical deposition of LaMn1-xNixO3 perovskite powder over commercial γ-alumina spheres was effective in DRM, i) enabling an easy handling of the structured catalyst and its spatial distribution inside the reactor; ii) favouring the fluid-dynamics inside the reactor with limited pressure drop; and iii) achieving CH4 conversion and H2/CO ratio close to 1, at temperature of 800 °C with perovskite loading of 5.0%wt. The tests were performed in a tubular reactor, resembling real plug flow equipment with good reliability.
A decay of catalytic activity was noted after some hours of DRM operation. To restore the initial catalytic activity, the regeneration by mild oxidation in O2 at 800°C, followed by reduction under H2 atmosphere, proved to be quite effective. The phase identification results revealed the complete transformation of the perovskite structure upon high-temperature reduction at 800 °C and under DRM conditions.
Author Contributions
Conceptualization, F. Miccio, C. Giannini, and L.F. Liotta; methodology, F. Monteverde, V. La Parola, G. Pantaleo, L.F. Liotta; validation, A. Moliterni and C. Aliotta; L.F. Liotta; writing – review & editing, F. Miccio, T. Sibillano, F. Monteverde, L.F Liotta; visualization, L. Polchri, C. Calabrese; L.F. Liotta; funding acquisition, F. Miccio, L.F Liotta.
Funding
The research was by the Internal Project PYH2 -Catalysts for hydrogen rich syngas production from pyrolysis of non-recyclable plastic waste materials - under the National Recovery and Resilience Plan (NRRP), Mission 04 Component 2 Investment 1.5 – NextGenerationEU, ECOSISTER Award Number 0001052 dated 23/06/2022.
Data Availability Statement
Data will be made available upon request.
Acknowledgments
The authors are grateful to I. Zanoni (ISSMC) and M. Mazzocchi (ISSMC), respectively, for ICP and SEM analyses, and Francesco Baldassarre (CNR-IC) for collecting PXRD data.
Conflicts of Interest
The authors declare no conflicts of interest.
Abbreviations
The following abbreviations are used in this manuscript:
| dp | particle size, μm |
| m | mass, g |
| n | molar flow rate, mol/s |
| Q0 | volumetric flow rate, L/s |
| r0 | CO2/CH4 feeding ratio, - |
| Rp and Rwp | Rietveld factors |
| T | temperature, °C |
| V | reactor volume, L |
| x | Ni coefficient in chemical formula, - |
| X | mass content of LMNO in structured catalyst, % |
| Y | gas molar/volumetric fraction, - |
| Greek symbols | |
| ξ | conversion, - |
| ψ | yield, - |
| σ | selectivity, - |
| τ | residence time, s |
| Acronyms | |
| BET | Brunauer–Emmett–Teller |
| BJH | Barrett–Joyner–Halenda |
| DRM | dry reforming of methane |
| GHSV | gas hourly space velocity, mL g-1 h-1 |
| LMNO | lanthanum-manganese-nickel perovskite |
| PXRD | Power X-ray diffraction |
| QPA | quantitative phase analysis |
| SCS | solution combustion synthesis |
| SOF | site occupancy factor |
| TOS | time on stream, h |
References
- Osazuwa, O. U.; Ng, K. H. An overview on the carbon deposited during dry reforming of methane (DRM): Its formation, deposition, identification, and quantification. Results Eng. 2025, 25, 104328. [Google Scholar] [CrossRef]
- Jang, W.-J.; Shim, J.-O.; Kim, H.-M.; Yoo, S.-Y.; Roh, H.-S. A review on dry reforming of methane in aspect of catalytic properties. Catal. Today 2019, 324, 15–26. [Google Scholar] [CrossRef]
- Segovia-Hernández, J. G.; Núñez-López, J. M.; Cossío-Vargas, E.; Juárez-García, M.; Sánchez-Ramírez, E. Electrification in the chemical industry and its role in achieving carbon neutrality: areas, challenges, and opportunities for process intensification. RSC Sustain. 2025, 3((11)), 4955–4974. [Google Scholar] [CrossRef]
- Palma, V.; Ricca, A.; Martino, M.; Meloni, E. Innovative Catalytic Systems for Methane Steam Reforming Intensification. Chem. Eng. Trans. 2016, 52, 301–306. [Google Scholar]
- Alhassan, A. M.; Hussain, I.; Taialla, O. A.; Awad, M. M.; Tanimu, A.; Alhooshani, K.; Ganiyu, S. A. Advances in catalytic dry reforming of methane (DRM): Emerging trends, current challenges, and future perspectives. J. Clean. Prod. 2023, 423, 138638. [Google Scholar] [CrossRef]
- Yates, J. G.; Lettieri, P. Catalytic Processes. In Fluidized-Bed Reactors: Processes and Operating Conditions; Yates, J. G., Lettieri, P., Eds.; Springer International Publishing: Cham, 2016; pp. 23–65. [Google Scholar]
- Miccio, F.; Landi, E.; Murri, A. N.; Minelli, M.; Doghieri, F.; Storione, A. Fluidized bed reforming of methane by chemical looping with cerium oxide oxygen carriers. Chem. Eng. Res. Des. 2023, 191, 568–577. [Google Scholar] [CrossRef]
- Cai, T.; Tian, M.; Wang, L.; Lu, C.; Feng, F.; Zhang, Q.; Wang, Q.; Li, X. Recent Advances in Nickel-Based Catalysts for Hydrogenation Reactions: Deactivation Mechanisms and Design Principles. ACS Catalysis 2026. [Google Scholar] [CrossRef]
- Li, G.; Hao, H.; Jin, P.; Wang, M.; Yu, Y.; Zhang, C. Dry reforming of methane over Ni/Al2O3 catalysts: Support morphological effect on the coke resistance. Fuel 2024, 362, 130855. [Google Scholar]
- Agueniou, F.; Vidal, H.; Yeste, M. P.; Hernández-Garrido, J. C.; Cauqui, M. A.; Rodríguez-Izquierdo, J. M.; Calvino, J. J.; Gatica, J. M. Honeycomb monolithic design to enhance the performance of Ni-based catalysts for dry reforming of methane. Catal. Today 2022, 383, 226–235. [Google Scholar] [CrossRef]
- Begum, W.; Rai, S.; Banerjee, S.; Bhattacharjee, S.; Mondal, M. H.; Bhattarai, A.; Saha, B. A comprehensive review on the sources, essentiality and toxicological profile of nickel. RSC Adv. 2022, 12((15)), 9139–9153. [Google Scholar] [CrossRef] [PubMed]
- Boscherini, M.; Storione, A.; Minelli, M.; Miccio, F.; Doghieri, F. New Perspectives on Catalytic Hydrogen Production by the Reforming, Partial Oxidation and Decomposition of Methane and Biogas. Energies 2023, 16((17)), 6375. [Google Scholar] [CrossRef]
- Gangwar, B. P.; Tripathi, P.; Das, R.; Sarkar, S.; Kumar Singh, A.; Sekhar Tiwary, C.; Sharma, S. Low-temperature dry reforming using high entropy alloy (Co-Fe-Ga-Ni-Zn)-cerium oxide (CeO2) hybrid nanostructure. Chem. Eng. J. 2024, 495, 153291. [Google Scholar]
- Hossain, A.; Ghorai, K.; Bhunia, T.; Bera, P.; Bhaskaran, A.; Roy, S.; Seikh, M. M.; Gayen, A. Dry Reforming of Methane Mediated through In Situ Generated Molecular Level Nanocomposite Derived from Thermally Regenerable High-Entropy Spinel Oxide. J. Phys. Chem. C 2025, 129((43)), 19275–19291. [Google Scholar] [CrossRef]
- Zhang, C.; Park, N.-G. Materials and methods for cost-effective fabrication of perovskite photovoltaic devices. Commun. Mater. 2024, 5((1)), 194. [Google Scholar] [CrossRef]
- Consentino, L.; Deganello, F.; Guil-Lopez, R.; La Parola, V.; Liotta, L. F.; Pantaleo, G. Hydrogen production from chemical looping reforming of methane: A screening of Ni-based oxygen carriers. Appl. Catal. B Environ. Energy 2026, 381, 125819. [Google Scholar]
- Muñoz, H. J.; Korili, S. A.; Gil, A. Recent advances in the application of Ni-perovskite-based catalysts for the dry reforming of methane. Catal. Rev. 2026, 68((1)), 91–143. [Google Scholar]
- Shahnazi, A.; Firoozi, S. Improving the catalytic performance of LaNiO3 perovskite by manganese substitution via ultrasonic spray pyrolysis for dry reforming of methane. J. CO2 Util. 2021, 45, 101455. [Google Scholar]
- Blasco, J.; Sánchez, M. C.; Pérez-Cacho, J.; Garcı́a, J.; Subı́as, G.; Campo, J. Synthesis and structural study of LaNi1−xMnxO3+δ perovskites. J. Phys. Chem. Solids 2002, 63((5)), 781–792. [Google Scholar]
- Altomare, A.; Cuocci, C.; Giacovazzo, C.; Moliterni, A.; Rizzi, R.; Corriero, N.; Falcicchio, A. EXPO2013: a kit of tools for phasing crystal structures from powder data. J. Appl. Crystallogr. 2013, 46((4)), 1231–1235. [Google Scholar] [CrossRef]
- Macrae, C. F.; Sovago, I.; Cottrell, S. J.; Galek, P. T. A.; McCabe, P.; Pidcock, E.; Platings, M.; Shields, G. P.; Stevens, J. S.; Towler, M.; Wood, P. A. Mercury 4.0: from visualization to analysis, design and prediction. J. Appl. Crystallogr. 2020, 53 (Pt 1), 226–235. [Google Scholar] [CrossRef] [PubMed]
- Altomare, A.; Corriero, N.; Cuocci, C.; Falcicchio, A.; Moliterni, A.; Rizzi, R. QUALX2.0: a qualitative phase analysis software using the freely available database POW_COD. J. Appl. Crystallogr. 2015, 48((2)), 598–603. [Google Scholar] [CrossRef]
- Pereñiguez, R.; Gonzalez-delaCruz, V. M.; Caballero, A.; Holgado, J. P. LaNiO3 as a precursor of Ni/La2O3 for CO2 reforming of CH4: Effect of the presence of an amorphous NiO phase. Appl. Catal. B Environ. 2012, 123-124, 324–332. [Google Scholar]
- Shahnazi, A.; Firoozi, S. Mesoporous LaNi1-xMnxO3 perovskite with enhanced catalytic performance and coke resistance synthesized via glycine-assisted spray pyrolysis for methane dry reforming. Mol. Catal. 2023, 547, 113320. [Google Scholar]
- La Greca, E.; La Parola, V.; Fiorenza, R.; Pantaleo, G.; Consentino, L.; Herrera Beurnio, M. C.; Urbano, F. J.; Sciré, S.; Liotta, L. F. Ru-Ni modified LaMnO3 perovskites for H2 production via CH4-CO2 chemical looping: Structure-activity effect. Appl. Catal. B Environ. Energy 2026, 385, 126282. [Google Scholar]
- Sihaib, Z.; Puleo, F.; Garcia-Vargas, J. M.; Retailleau, L.; Descorme, C.; Liotta, L. F.; Valverde, J. L.; Gil, S.; Giroir-Fendler, A. Manganese oxide-based catalysts for toluene oxidation. Appl. Catal. B Environ. 2017, 209, 689–700. [Google Scholar] [CrossRef]
- Sihaib, Z.; Puleo, F.; Pantaleo, G.; La Parola, V.; Valverde, J. L.; Gil, S.; Liotta, L. F.; Giroir-Fendler, A. The Effect of Citric Acid Concentration on the Properties of LaMnO3 as a Catalyst for Hydrocarbon Oxidation. Catalysts 2019, 9((3)), 226. [Google Scholar]
- Zhang, W.; Li, Q.; Sun, B.; Duo, J.; Pei, L.; Ma, C.; Meng, J.; Su, G. Dual-strategy LaMn1-xNixO3-Nano perovskite catalysts via B-site doping and nanocasting for cost-effective mineralization of hazardous hexachlorobutadiene. J. Hazard. Mater. 2025(496), 139230.
- Szybowicz, M.; Nowicka, A. B.; Dychalska, A. Chapter 1 - Characterization of Carbon Nanomaterials by Raman Spectroscopy. In Characterization of Nanomaterials; Bhagyaraj Mohan, S., Oluwafemi, O. S., Kalarikkal, N., Thomas, S., Eds.; Woodhead Publishing, 2018; pp. 1–36. [Google Scholar]
- Buciuman, F.; Patcas, F.; Craciun, R.; R. T. Zahn, D. Vibrational spectroscopy of bulk and supported manganese oxides. Phys. Chem. Chem. Phys. 1999, 1((1)), 185–190. [Google Scholar] [CrossRef]
- Ergun, S. Fluid flow through packed columns. Chem. Eng. Prog. 1952, 48, 89–94. [Google Scholar]
- Rodríguez-Carvajal, J. Recent advances in magnetic structure determination by neutron powder diffraction. Phys. B Condens. Matter 1993, 192((1)), 55–69. [Google Scholar] [CrossRef]
- Benguerba, Y.; Dehimi, L.; Virginie, M.; Dumas, C.; Ernst, B. Modelling of methane dry reforming over Ni/Al2O3 catalyst in a fixed-bed catalytic reactor. React. Kinet. Mech. Catal. 2015, 114((1)), 109–119. [Google Scholar]
- Valderrama, G.; Kiennemann, A.; de Navarro, C. U.; Goldwasser, M. R. LaNi1-xMnxO3 perovskite-type oxides as catalysts precursors for dry reforming of methane. Appl. Catal. A General. 2018, 565, 26–33. [Google Scholar]
- Komarala, E. P.; Komissarov, I.; Rosen, B. A. Effect of Fe and Mn Substitution in LaNiO3 on Exsolution, Activity, and Stability for Methane Dry Reforming. Catalysts 2020, 10((1)), 27. [Google Scholar]
- Kwon, O.; Huang, R.; Cao, T.; Vohs, J. M.; Gorte, R. J. Dry reforming of methane over Ni supported on LaMnO3 thin films. Catal. Today 2021, 382, 142–147. [Google Scholar]
- Cao, D.; Luo, C.; Luo, T.; Shi, Z.; Wu, F.; Li, X.; Zheng, Y.; Zhang, L. Dry reforming of methane by La2NiO4 perovskite oxide, part I: Preparation and characterization of the samples. Fuel Process. Technol. 2023, 247, 107765. [Google Scholar]
- Cao, D.; Luo, C.; Luo, T.; Shi, Z.; Wu, F.; Li, X.; Zheng, Y.; Zhang, L. Dry reforming of methane by La2NiO4 perovskite oxide: B-site substitution improving reactivity and stability. Chem. Eng. J. 2024, 482, 148701. [Google Scholar]
- Kim, S.; Nam, S.; Jung, W.; Kim, H.; Choi, Y.; Kim, H. Designing Highly Active and Stable Ni-Exsolved LaMnO3 Perovskite Catalysts for Dry Reforming of Methane via Ca Substitution. ACS Catal. 2025, 15((9)), 6812–6825. [Google Scholar]
- Tomatis, M.; Kumar Jeswani, H.; Azapagic, A. Environmental impacts of valorisation of crude glycerol from biodiesel production – A life cycle perspective. Waste Manag. 2024, 179, 55–65. [Google Scholar] [CrossRef] [PubMed]
Figure 1.
Schematic of dry reforming laboratory plant.
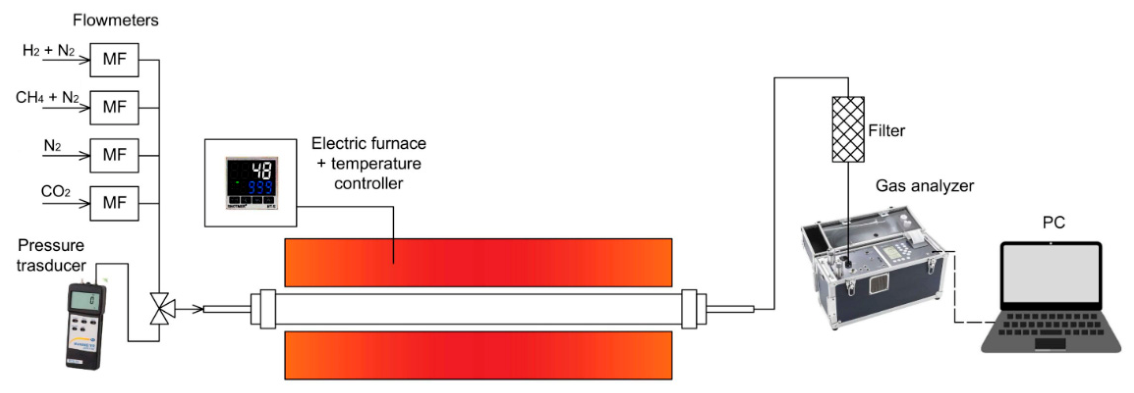
Figure 2.
SEM micrograph from the calcined and sieved LMNO powder.
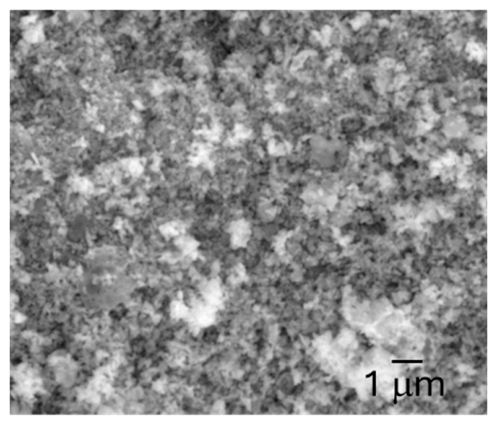
Figure 3.
A view along a of the asymmetric unit (on the left) and the crystal packing (on the right) of the LMNO perovskite. Software for molecular graphics: Mercury [21].
Figure 3.
A view along a of the asymmetric unit (on the left) and the crystal packing (on the right) of the LMNO perovskite. Software for molecular graphics: Mercury [21].
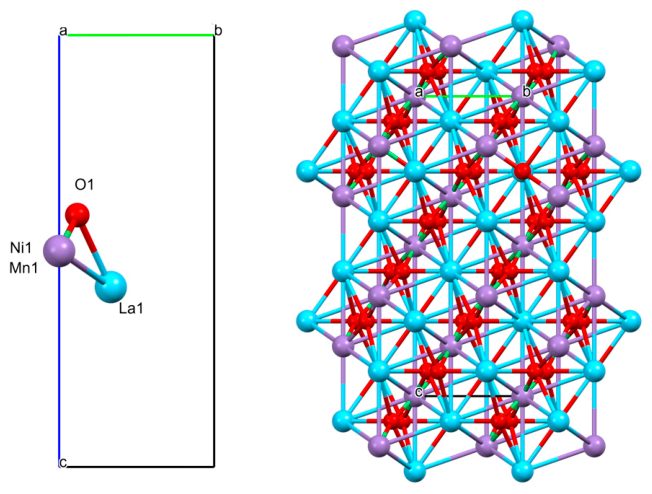
Figure 4.
Final Rietveld refinement results of LMNO showing the calculated (green), observed (blue), difference (red) pattern and the calculated 2θ-position of reflections (red vertical bars at the bottom); the agreement factors Rp and Rwp are 3.5% and 5.6%, respectively.
Figure 4.
Final Rietveld refinement results of LMNO showing the calculated (green), observed (blue), difference (red) pattern and the calculated 2θ-position of reflections (red vertical bars at the bottom); the agreement factors Rp and Rwp are 3.5% and 5.6%, respectively.
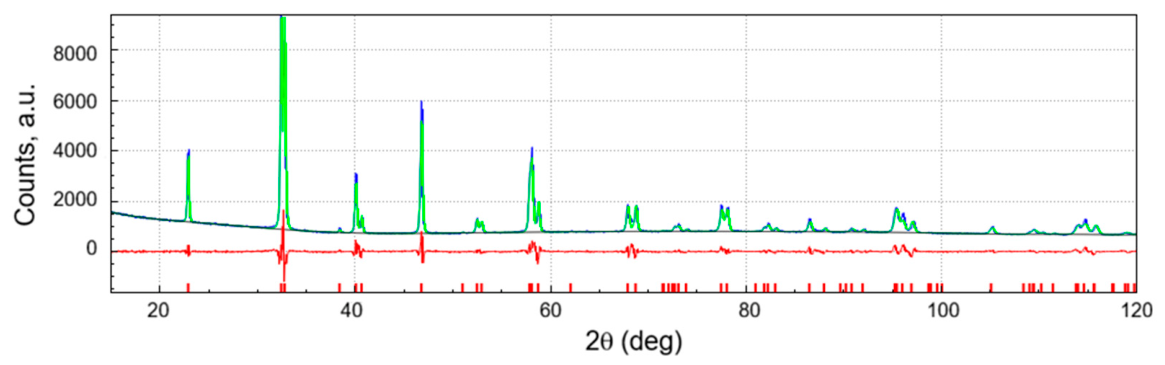
Figure 5.
X-ray diffraction (XRD) patterns of LMNO powder: fresh sample (black curve), after H2-reduction at 800 °C (red curve), and after dry reforming of methane (post-DRM, blue curve).
Figure 5.
X-ray diffraction (XRD) patterns of LMNO powder: fresh sample (black curve), after H2-reduction at 800 °C (red curve), and after dry reforming of methane (post-DRM, blue curve).
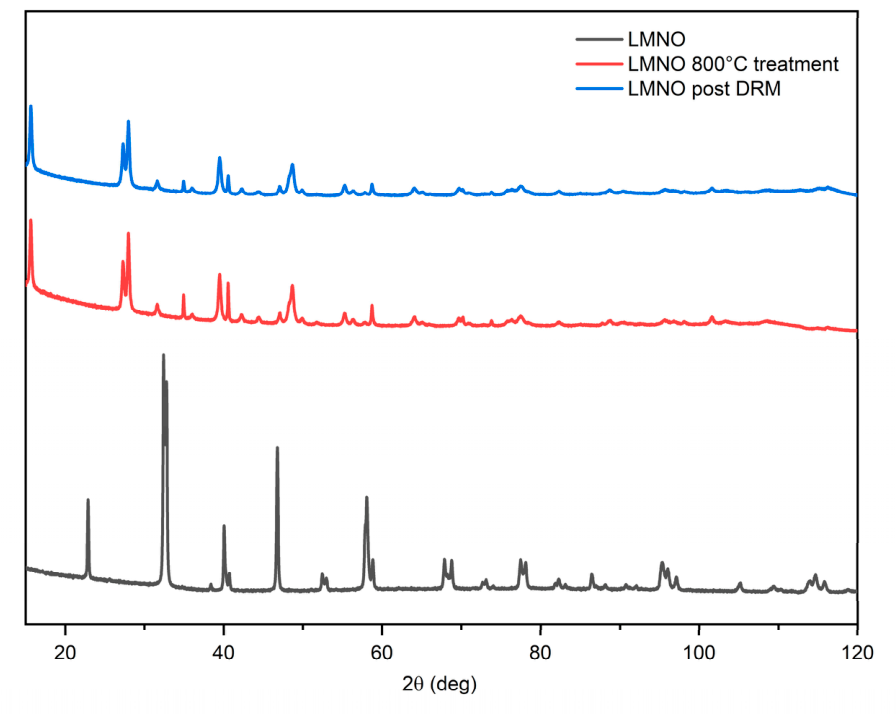
Figure 6.
TPR curve of LMNO powder.
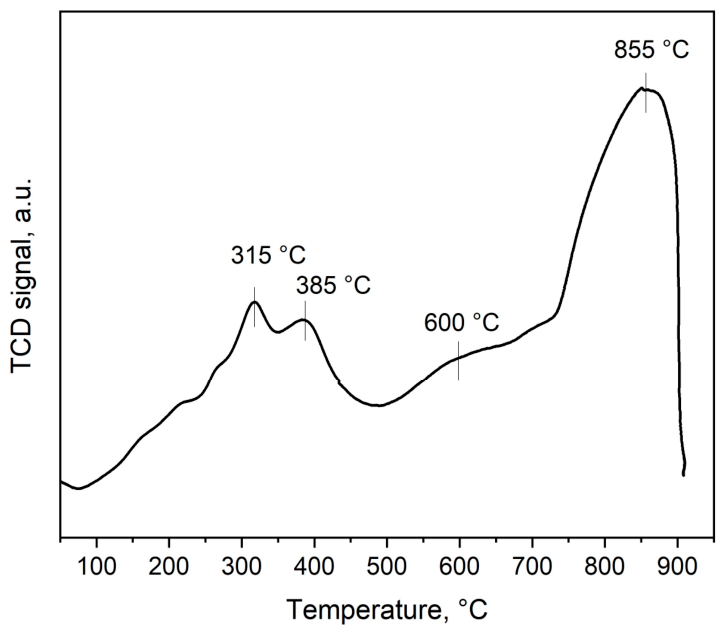
Figure 7.
Conversion (ξ), selectivity (σ) and YH2/YCO ratio of a prolonged dry reforming test at 700 °C in quartz microreactor with LMNO powder (YCH4,f =0.15, YCO2,f =0.15, τ=3.0 s, dp=350 μm).
Figure 7.
Conversion (ξ), selectivity (σ) and YH2/YCO ratio of a prolonged dry reforming test at 700 °C in quartz microreactor with LMNO powder (YCH4,f =0.15, YCO2,f =0.15, τ=3.0 s, dp=350 μm).
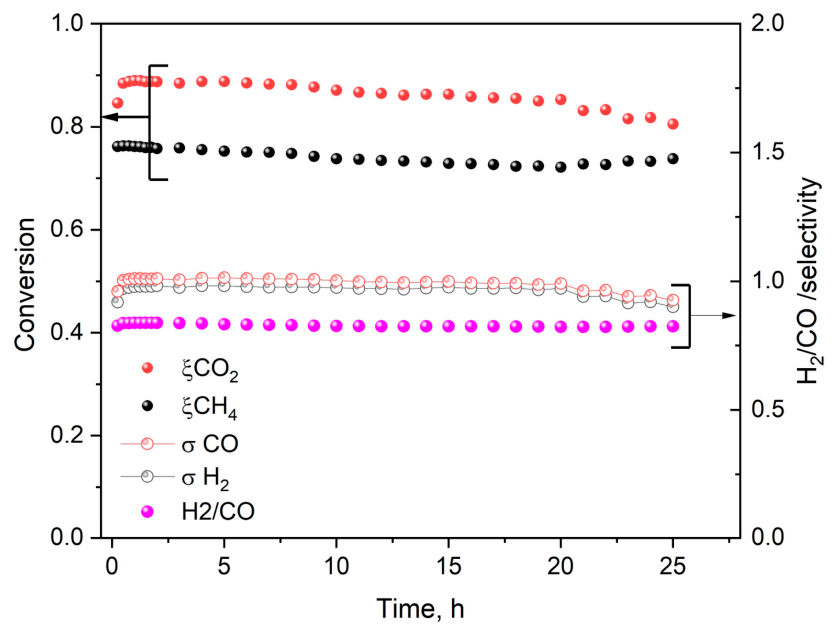
Figure 8.
Thermogravimetric analysis (TGA, solid line) and differential thermogravimetric analyses (DTG, dotted line) of LMNO after DRM.
Figure 8.
Thermogravimetric analysis (TGA, solid line) and differential thermogravimetric analyses (DTG, dotted line) of LMNO after DRM.
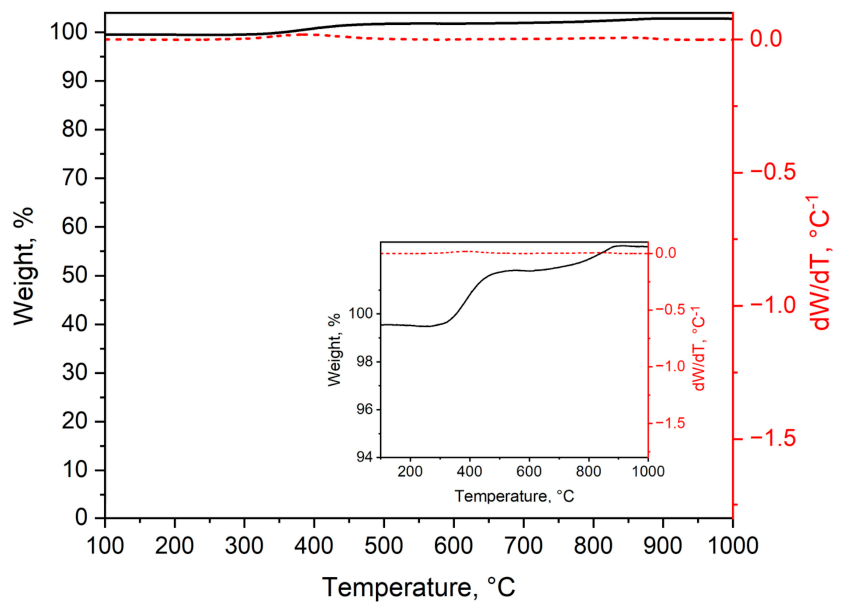
Figure 9.
Raman spectra of the as-prepared and spent LMNO.
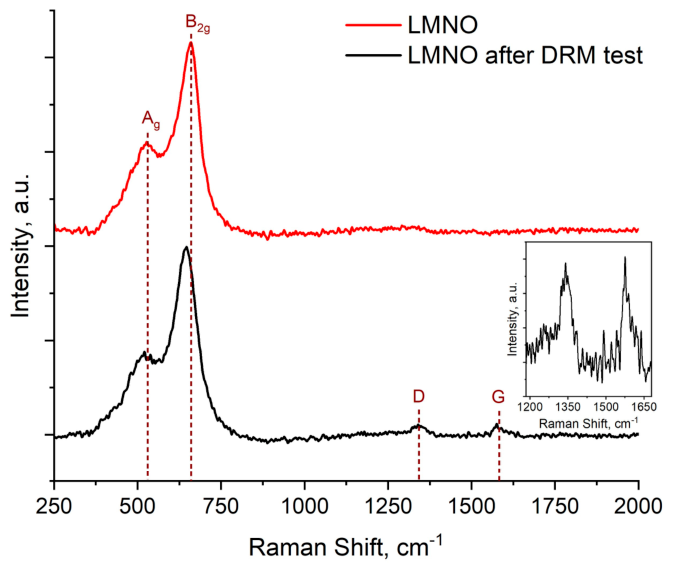
Figure 10.
Optical photograph of the as-coated structured catalyst: external view (a) and fractured cross section of one piece (b); catalyst loading X=5.0%wt.
Figure 10.
Optical photograph of the as-coated structured catalyst: external view (a) and fractured cross section of one piece (b); catalyst loading X=5.0%wt.
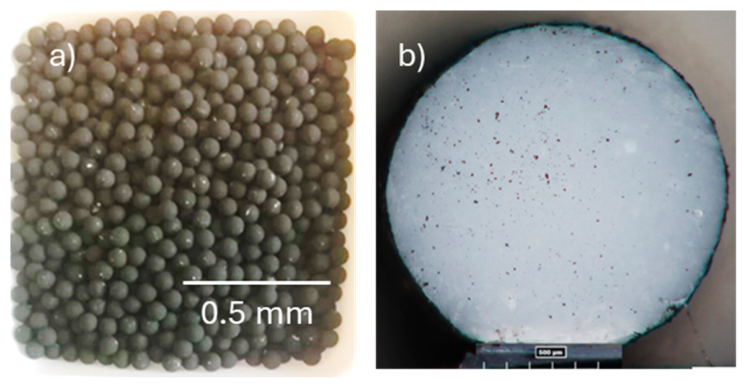
Figure 11.
SEM micrographs from the as-received γ-alumina support (a), and of a coated support before (b) and after dry reforming test (c); x=5.0%wt.
Figure 11.
SEM micrographs from the as-received γ-alumina support (a), and of a coated support before (b) and after dry reforming test (c); x=5.0%wt.
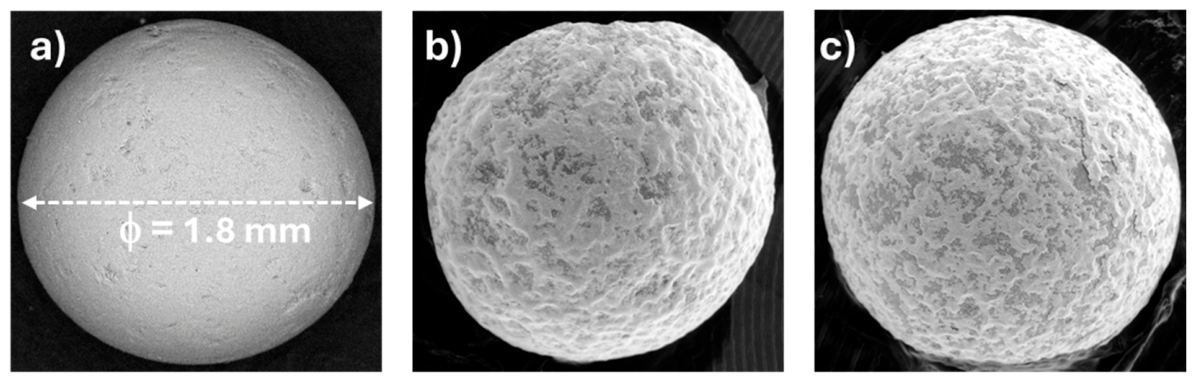
Figure 12.
CO, H2, CH4 and CO2 molar fraction along the time at different temperatures under constant feed of CH4 and CO2.
Figure 12.
CO, H2, CH4 and CO2 molar fraction along the time at different temperatures under constant feed of CH4 and CO2.
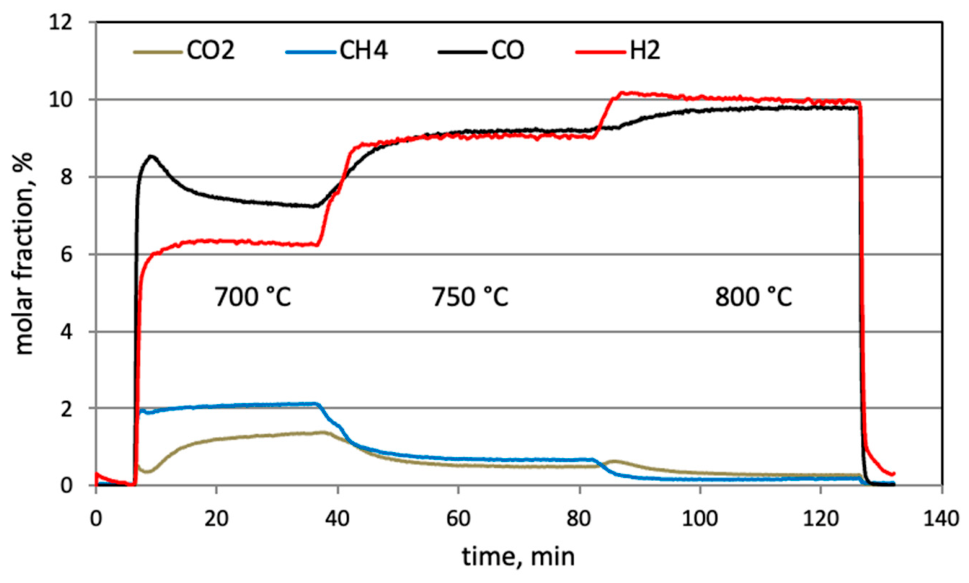
Figure 13.
CH4 conversion and H2 selectivity versus LMNO content in the structured catalyst during DRM tests carried out at T=800 °C, r0=1.0 and τ=1.3 s.
Figure 13.
CH4 conversion and H2 selectivity versus LMNO content in the structured catalyst during DRM tests carried out at T=800 °C, r0=1.0 and τ=1.3 s.
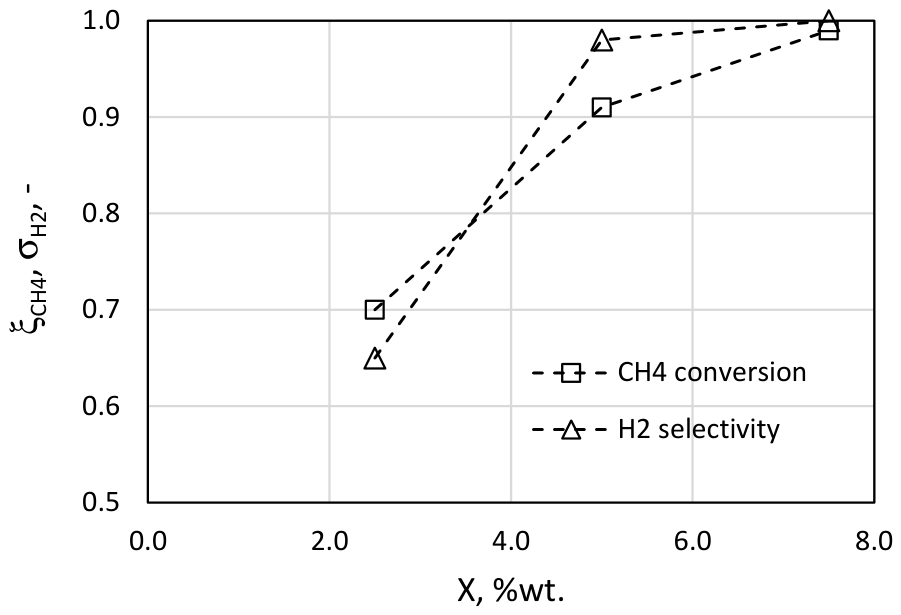
Figure 14.
CH4 and CO2 conversion, YH2/YCO ratio at different temperature under constant fed of CH4 and CO2 (τ=1.8 s, r0=1.0).
Figure 14.
CH4 and CO2 conversion, YH2/YCO ratio at different temperature under constant fed of CH4 and CO2 (τ=1.8 s, r0=1.0).
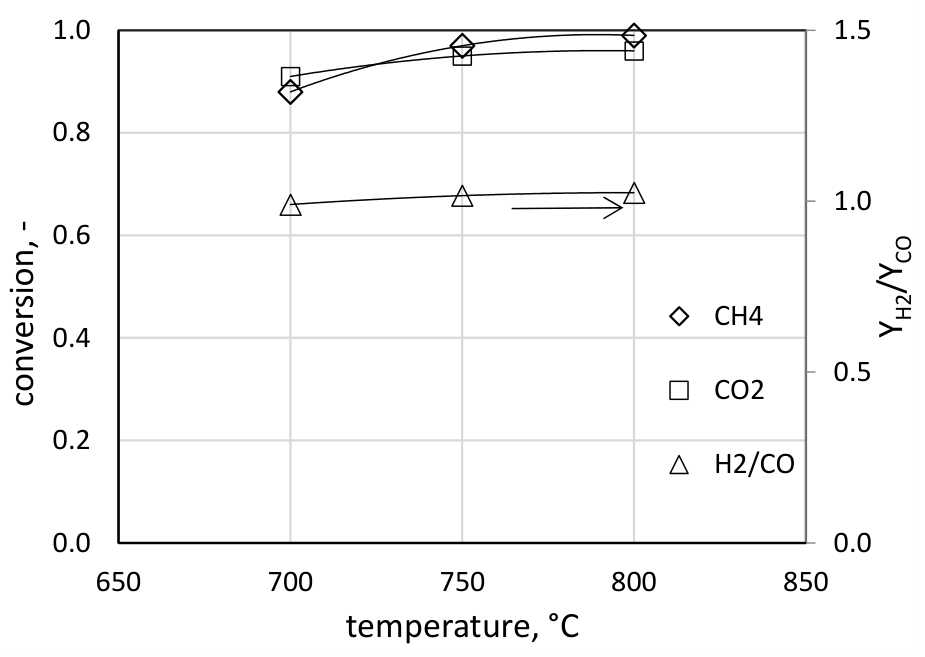
Figure 15.
CH4 and CO2 conversion, YH2/YCO ratio at different residence time under constant CH4/CO2 ratio in the fed (T = 800°C, r0 = 1.0).
Figure 15.
CH4 and CO2 conversion, YH2/YCO ratio at different residence time under constant CH4/CO2 ratio in the fed (T = 800°C, r0 = 1.0).
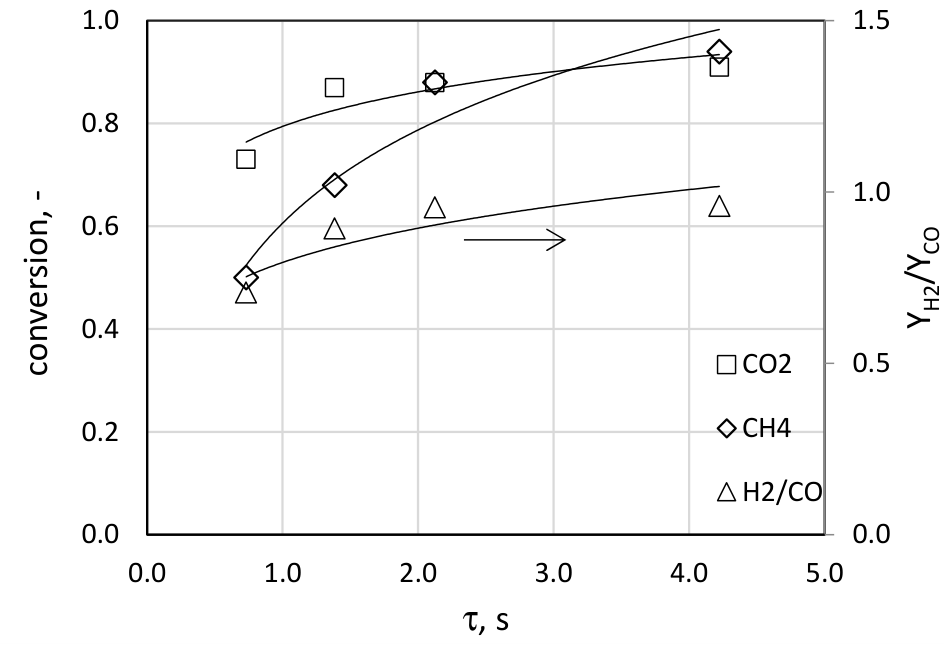
Figure 16.
CH4 and CO2 conversion and YH2/YCO ratio (a); CO and H2 selectivity (b) at different nCO2/nCH4 feeding ratio (T=800 °C, τ=1.3 s).
Figure 16.
CH4 and CO2 conversion and YH2/YCO ratio (a); CO and H2 selectivity (b) at different nCO2/nCH4 feeding ratio (T=800 °C, τ=1.3 s).
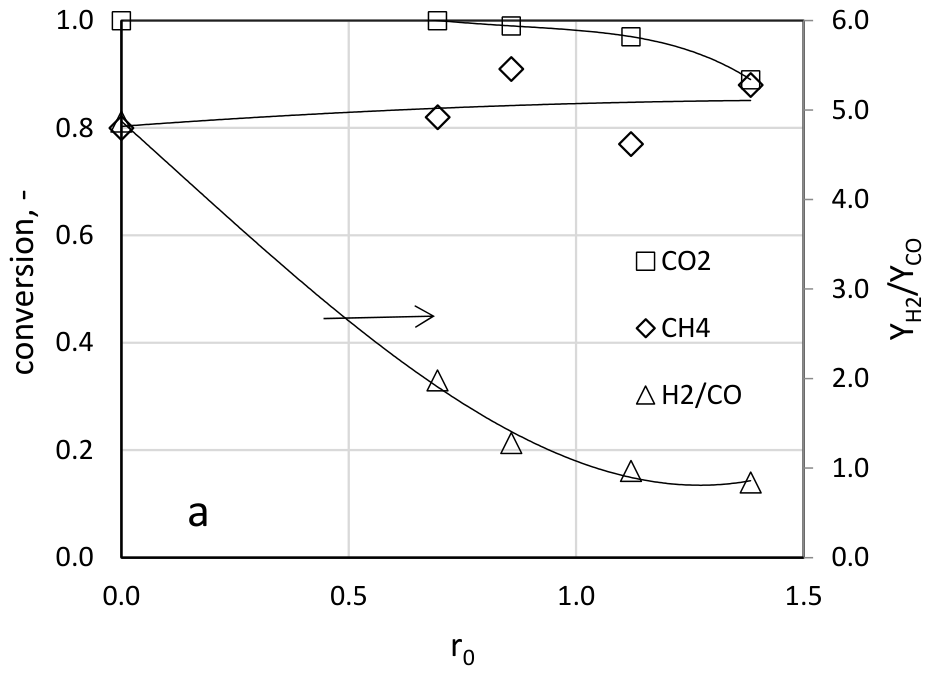
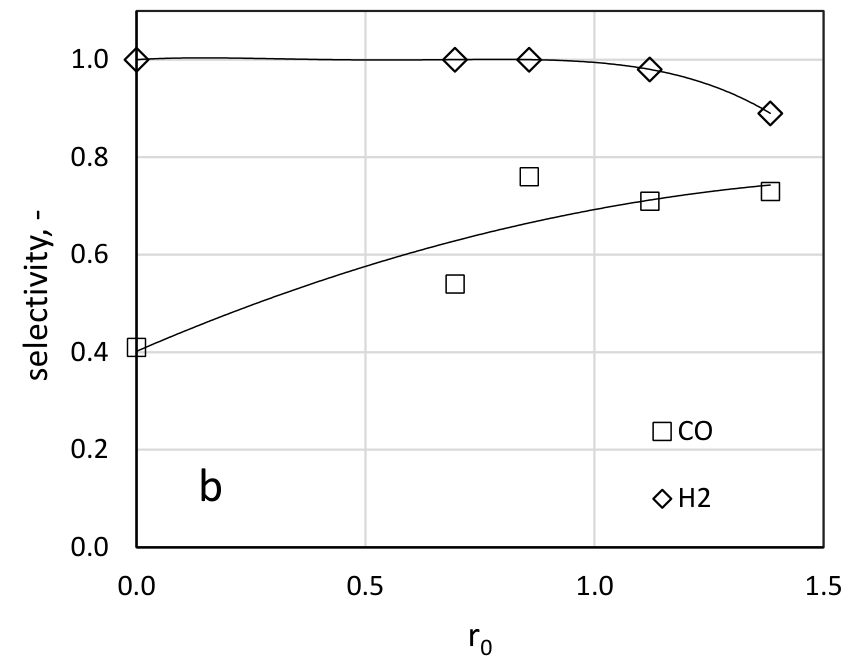
Figure 17.
Secondary electron SEM micrograph from a portion of the external layer: fresh (a) and post DRM coating (b).
Figure 17.
Secondary electron SEM micrograph from a portion of the external layer: fresh (a) and post DRM coating (b).
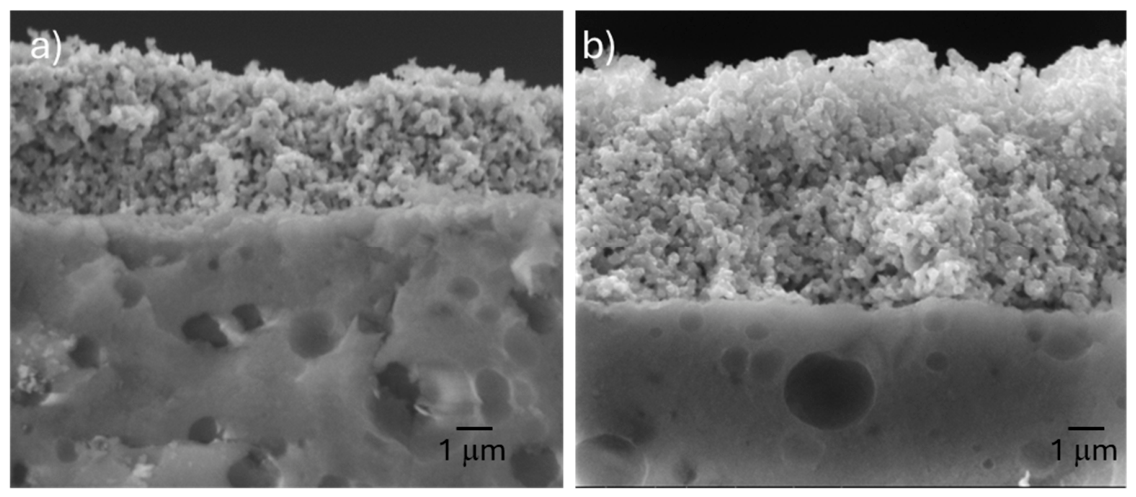
Figure 18.
Secondary (SE) and backscattered electron (BSE) SEM micrographs showing a compact portion of residual coating of a structured catalyst (a); back-scattered mode (b).
Figure 18.
Secondary (SE) and backscattered electron (BSE) SEM micrographs showing a compact portion of residual coating of a structured catalyst (a); back-scattered mode (b).
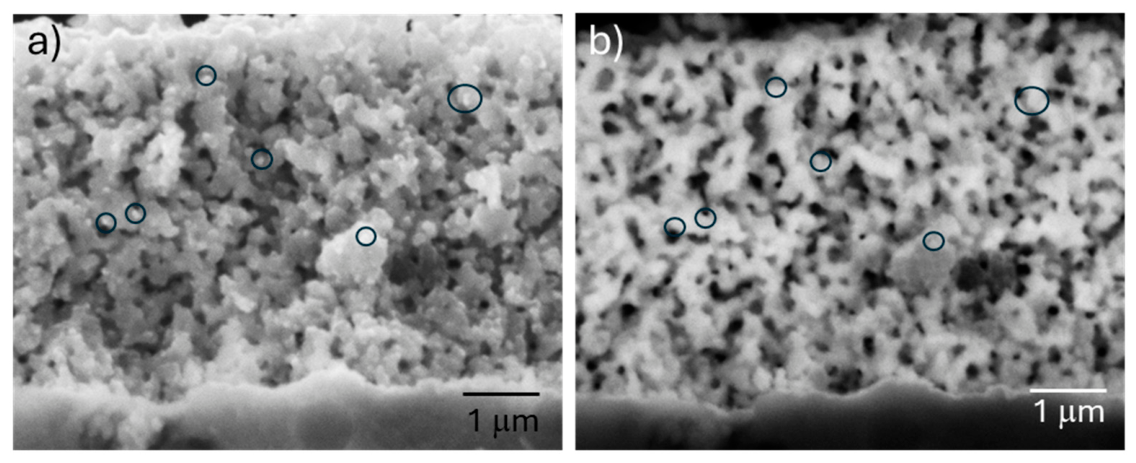

Table 1.
Quantitative phase analysis after reduction at 800 °C and postDRM treatment. The weight fractions (wt, %) of the identified phases and the corresponding average crystallite sizes (Å) were determined.
Table 1.
Quantitative phase analysis after reduction at 800 °C and postDRM treatment. The weight fractions (wt, %) of the identified phases and the corresponding average crystallite sizes (Å) were determined.
| Sample | Phase | wt (%) | average crystallite size (Å) |
|---|---|---|---|
| LMNO reduced at 800 °C | La(OH)3 | 72.7 | 202 |
| MnO | 22.7 | 449 | |
| Ni | 4.6 | 147 | |
| LMNO post-DRM | La(OH)3 | 76.0 | 186 |
| MnO | 16.3 | 365 | |
| Ni | 7.7 | 120 |
Table 2.
Operating conditions (T, τ and r0) and results (ξCH4, ξCO2, σCO, σH2, YH2/YCO) of dry reforming tests carried out with structured catalyst (x=5.0%wt.).
Table 2.
Operating conditions (T, τ and r0) and results (ξCH4, ξCO2, σCO, σH2, YH2/YCO) of dry reforming tests carried out with structured catalyst (x=5.0%wt.).
| test | T, °C | τ, s | r0 | ξCH4 | ξCO2 | σCO | σH2 | YH2/YCO |
|---|---|---|---|---|---|---|---|---|
| 1 | 700 | 3.6 | 1.0 | 0.61 | 0.71 | 1.0 | 0.95 | 0.82 |
| 2 | 700 | 4.9 | 1.0 | 0.76 | 0.61 | 0.99 | 0.97 | 0.86 |
| 3 | 750 | 2.3 | 1.1 | 0.35 | 0.51 | 0.95 | 0.84 | 0.67 |
| 4 | 750 | 3.4 | 1.1 | 0.81 | 0.84 | 1.00 | 0.96 | 0.90 |
| 5 | 750 | 4.7 | 1.0 | 0.97 | 0.95 | 0.99 | 1.00 | 0.99 |
| 6 | 800 | 3.3 | 0.0 | 0.82 | - | - | 1.00 | - |
| 7 | 800 | 3.3 | 1.0 | 0.80 | 0.94 | 0.84 | 0.94 | 0.97 |
| 8 | 800 | 3.2 | 1.5 | 0.90 | 0.85 | 0.86 | 0.87 | 0.84 |
| 9 | 800 | 3.4 | 0.7 | 0.84 | 0.99 | 0.55 | 0.99 | 1.98 |
| 10 | 800 | 3.4 | 0.8 | 0.92 | 0.98 | 0.85 | 1.00 | 1.28 |
| 11 | 800 | 3.2 | 1.0 | 0.88 | 0.88 | 1.00 | 1.00 | 0.96 |
| 12 | 800 | 6.35 | 1.0 | 0.94 | 0.91 | 1.00 | 0.97 | 1.0 |
Table 3.
Results of DRM from literature for LaNi-MnO catalysts: CH4 and CO2 conversion and YH2/YCO ratio.
Table 3.
Results of DRM from literature for LaNi-MnO catalysts: CH4 and CO2 conversion and YH2/YCO ratio.
| Catalyst | Form | T (°C) | GHSV (mL/g h) |
ξCH4 (%) |
ξCO2 (%) | YH2/YCO (-) |
|
|---|---|---|---|---|---|---|---|
| Ni | Al2O3 supported | 650 | 91 | [33] | |||
| LaNi1-xMnxO3 (x=0, 0.2, 0.4, 0.6, 0.8 and 1.0) | powder | 750 | 15000 | ~75-100 | ~80-100 | - | [34] |
| LaNi0.8Mn0.2O3 | powder | 800 | 13700 | ~ 50-80 | ~70-90 | ~0.8-1.2 | [35] |
| 5%wtNi/LaMnO3 | powder | 675 | 66000 | ~90 | - | - | [36] |
| LaNi1-xMnxO3 | powder | 700 | 15000 | ~60-90 | ~55-75 | - | [24] |
| La2NiO4 (sol-gel); La2NiO4 (HT) |
powder | 750 | 12000 | ~90 ~80-85 |
~90 ~85 |
- - |
[37] |
| La2Ni0.8Mn0.4O4 | powder | 750 | 12000 | < 40 | <60 | - | [38] |
| LaMn0.8Ni0.2O3 | Al2O3 supported | 800 | 6000 | ~ 20-55 | ~40-70 | - | [39] |
Disclaimer/Publisher’s Note: The statements, opinions and data contained in all publications are solely those of the individual author(s) and contributor(s) and not of MDPI and/or the editor(s). MDPI and/or the editor(s) disclaim responsibility for any injury to people or property resulting from any ideas, methods, instructions or products referred to in the content. |
© 2026 by the authors. Licensee MDPI, Basel, Switzerland. This article is an open access article distributed under the terms and conditions of the Creative Commons Attribution (CC BY) license (http://creativecommons.org/licenses/by/4.0/).
Copyright: This open access article is published under a Creative Commons CC BY 4.0 license, which permit the free download, distribution, and reuse, provided that the author and preprint are cited in any reuse.