

Submitted:
26 June 2026
Posted:
29 June 2026
You are already at the latest version
Abstract
Optimizing irrigation management is increasingly important for sustaining cassava production under changing climatic and water availability conditions. This study evaluated the effects of different irrigation regimes on growth traits and yield of cassava variety KM94 under field conditions in Hanoi city, Vietnam, from March 2023 to February 2026. The experiments utilized a randomized complete block design, which consisted of three irrigation treatments: I1 (Model-based), I2 (Farmer), and I3 (Rainfed). The results showed that the I1 treatment significantly promoted shoot biomass development during the early- to mid-growth stage (5-9 months after planting, MAP) and improved tuber morphological traits (tuber length and diameter). Specifically, the cassava yield under I1 ranged from 35.6 to 36.9 tonnes ha-1, exceeding I2 by 8-12 tonnes ha-1, and I3 by 10-12 tonnes ha-1. Correlation analysis indicated that at 5 MAP, fresh tuber weight was positively correlated with fresh leaf weight (r = 0.57; p < 0.01), tuber number and tuber diameter (r = 0.45 and 0.75; p < 0.001), but negatively correlated with plant height (r = -0.45). At 11 MAP, fresh tuber yield showed a positive correlation with fresh stem weight (r = 0.51) and a negative correlation with fresh leaf weight (r = -0.23), reflecting the pattern of efficient dry matter translocation from aboveground biomass to storage tubers during late growth stages. These findings suggest that proactive irrigation management based on water balance and crop models is a key strategy for optimizing the yield potential of cassava cultivar KM94 in the context of climate change and increasing water scarcity.
Keywords:
cassava cultivar
; irrigation regimes
; growth parameters
; biomass partitioning
; dry matter production
; tuber bulking
; water use efficiency
1. Introduction
Cassava (Manihot esculenta Crantz) is one of the most widely cultivated staple and industrial crops in tropical and sub-tropical regions, and has become an increasingly important export commodity in Vietnam. Despite its recognized drought tolerance - mediated through stomatal regulation, canopy leaf area adjustment, and a deep root system -cassava yield remains highly sensitive to water availability, particularly during the critical phases of storage root (tuber) initia-tion and bulking (2-6 months after planting, MAP). Water deficit during these stages can suppress stomatal conduct-ance, reduce photosynthetic rate and leaf area development, and impair assimilate partitioning toward storage roots, resulting in yield losses of 20-50% or more (El-Sharkawy, 2007; Howeler, 2012). Conversely, excessive or poorly timed irrigation can redirect photoassimilates to above-ground vegetative growth at the expense of tuber bulking, underscoring the importance of demand-responsive irrigation management (El-Sharkawy, 2007; Polthanee and Srisutham, 2018).
Physiological studies have consistently demonstrated that water availability directly regulates biomass partitioning and harvest index in cassava (Lenis et al. 2006; Misganaw & Bayou 2020). During the early vegetative phase, adequate soil moisture promotes canopy expansion and leaf area development, establishing a photosynthetic capacity that is critical for subsequent tuber formation (Ruangyos et al. 2024); (Ruangyos et al. 2023). As the crop matures, assimilate partition-ing progressively shifts from leaves and stems toward the tuber, and the efficiency of this transition is strongly influ-enced by the prevailing soil moisture regime (El-Sharkawy, 2004; Lenis et al., 2006). Tuber dimensions, particularly di-ameter and length, have been identified as the yield components most responsive to irrigation management, while tuber number per plant is largely determined early in the growth cycle and is less sensitive to post-establishment water inputs (El-Sharkawy, 2004; Misganaw and Bayou, 2020; Njoku and Mbah, 2020).
Experiments with drip and supplemental irrigation in Thailand and other tropical environments have demonstrated that maintaining stable root-zone soil moisture can increase shoot biomass, tuber weight, and water use efficiency without compromising starch content (Polthanee and Srisutham, 2018; Anan Polthanee and Srisutham, 2017). Recently, the LINTUL model was calibrated to predict cassava yield under drought conditions in Togo (Ezui et al. 2018) and un-der rainfed conditions in Nigeria (Adiele et al. 2021). In Vietnam, existing studies have largely focused on model ap-plicability for estimating cassava yield and/or evaluating the water use requirement of cassava crops across the rainfed cultivation regions (Lee & Dang 2019a, 2019b; Phung 2024). Cassava irrigation in northern Vietnam is still largely based on farmers’ experience, with limited consideration of soil moisture dynamics, crop water requirements at different growth stages, or forecasted rainfall. As a result, water deficits or excessive irrigation may occur during sensitive growth stages, reducing water-use efficiency and also the yield of the crop. Some studies on other crops have demonstrated that model-based irrigation systems integrating weather data, evapotranspiration and soil moisture simulations, together with crop growth models such as AquaCrop, can reduce irrigation water use by 10-50% while maintaining crop yield (Yin et al., 2023; Zhao et al., 2023; Rai & Dong, 2025). Limited experimental data exist on how specific irrigation regimes affect the complete growth cycle and yield of cassava, particularly for the widely cultivated cultivar KM94 under the agro-climatic conditions of Northern Vietnam. To date, no study has comprehensively applied model-based irrigation to cassava cultivation in Vietnam, creating both a scientific and practical gap that this study aims to address.
The objective of this study is to evaluate the effects of three distinct irrigation regimes: I1(Model-based)- automated mod-el-based drip irrigation; I2 (Farmer)- farmer-practice irrigation; I3 (rainfed)- rainfed control, no supplemental irrigation - on the growth dynamics, biomass partitioning, yield components, and yield of cassava cultivar KM94 over three consec-utive cropping seasons (2023-2026) at Hoa Lac, Hanoi. Real-time weather data were integrated, agronomic measure-ments at 5, 9, and 11 MAP, and correlation analysis among growth parameters and yield components across growth stages were further examined. These findings directly support the development of water-saving, high-yield cassava production systems applicable across water-scarce regions of Southeast Asia and worldwide.
2. Materials and Methods
2.1. Plant Material and Study Area
The cassava cultivar KM94, currently the dominant industrial cassava variety cultivated in Vietnam, was selected for this study due to its high yield potential and wide adaptation across diverse agro-ecological regions. KM94 originates from a cross between Rayong 1 and Rayong 90 and shares a genetic background with the Thai cultivar KU50 (Kasetsart University 50). The variety was provided by the Agricultural Genetics Institute.
The experiments were carried out at the Hoa Lac experimental zone of the Faculty of Agricultural Technology, University of Engineering and Technology, Vietnam National University, Hanoi, from March 2023 to February 2026. This site is located between latitudes 21.00°N and longitudes 105.52°E. The site is situated within the Red River Delta region and is characterized by a tropical monsoon climate with high humidity, a cold and relatively dry winter, and a hot and humid summer. Mean annual air temperature is 24.1 °C, with peak temperatures recorded in June and lowest temperatures recorded in January. Mean annual total rainfall is 1300.8 mm, and mean annual relative humidity is 86% (Data collected from 2023 to 2025 measured by the weather station at the experiment site). These environmental conditions are representative of lowland cassava growing areas in Northern Vietnam, where KM94 has been widely adopted as a predominant cultivar. Weather data were records realtime from the MaxiMet GMX240 Compact Weather Station, which was installed at the experiment site. Figure 1 depicts the web interface of our weather monitoring system for a cassava field. More details of the system described in our previous report (Duong et al. 2024).
2.2. Research Methods
2.2.1. Experimental Design
The field experiments were designed using a randomized complete block design with three irrigation treatments. Treatment 1 (I1 - Model-based): Irrigation was delivered via a drip irrigation system that automatically triggered watering based on real-time meteorological inputs and a soil water balance model combined with a crop model. Details of this method were described in our previous report (Duong et al. 2024). The model calculated soil water balance based on weather conditions, soil texture, and crop model to generate appropriate irrigation commands for each growth stage, targeting 70% field capacity (FC) during the first 5 months after planting, 50% FC up to 9 months after planting, and no supply irrigation thereafter. The irrigation system offers two irrigation control modes: automatic and manual. In automatic mode, it calculates the necessary water amount and duration on its own, then sends encoded instructions to the actuators. In manual mode, users have full control over when and how much water is delivered to the field. Both modes are illustrated through flowcharts in Figure 2. Treatment 2 (I2 - Farmer): Irrigation was applied using a manual mode of irrigation system or a hose system, with timing, frequency, and water volume determined by the farmer based on visual soil moisture assessment and weather forecast, following local traditional practice. Treatment 3 (I3 - Rainfed): Rainfed control (no supplemental irrigation). Cassava plants relied entirely on natural water supply (rainfall and inherent soil moisture), with no additional irrigation throughout the experimental period.
The experiments were conducted over three consecutive cropping seasons, each spanning from March of one year to February of the following year. In cropping season 1 (03/2023-02/2024), two treatments (I1 and I2) were applied with total irrigation amounts of 373.3 mm and 500 mm, respectively. Cropping season 2 (03/2024-02/2025) included I1 and I3, where I1 received 298.6 mm of irrigation, while I3 was maintained under rainfed conditions without supplemental irrigation. In cropping season 3 (03/2025-02/2026), all three treatments (I1, I2, and I3) were evaluated; total irrigation amounts were 245.3 mm for I1 and 464 mm for I2, whereas I3 again remained rainfed throughout the season. Before planting, mix soil samples were collected from two points within each replication at depths of 0-30 cm and 30-60 cm to evaluate the soil’s physical and chemical characteristics. Data of soil properties are shown in Table 1. The soil was classified as a sandy clay loam soil, with sand content ranging from 47.1-47.5%, limon content from 25.9-26.5%, and clay from 26.4-26.6%. Bulk density varied between 1.23 and 1.31 g cm-3, while porosity ranged from 46.6 to 52.4%. Soil pH was neutral to slightly alkaline (7.12-7.27). Organic matter and total nitrogen contents were relatively low, ranging from 1.20-1.25% and 0.08-0.1%, respectively. Meanwhile, P2O5 and K2O contents ranged from 0.54-0.63% and 1.42-1.43%, respectively. The dimension of each plot in each treatment was 4 × 4.5 m2. Within each plot, plants were arranged in four rows of 11 plants per row, with one drip irrigation lateral fitted with emitters rated at 1.6 L h-1. All treatments were established at a planting density of 12,500 plants ha-1 (0.8 m × 1.0 m spacing). The buffer distance between adjacent treatments was 1.5 m. All treatments received a uniform whole fertilizer application of 1.1 tonnes ha-1 of microbial organic fertilizer + 100 kg N + 40 kg P2O5 + 120 kg K2O per hectare. The total fertilizer amount was divided into three applications: one basal application and two additional applications at one month and three months after planting.
2.2.2. Data Collection and Assessment Methods
Agronomic measurements were conducted at three growth stages: 5, 9, and 11 months after planting (MAP). Growth parameters included plant height, number of nodes per stem, and fresh and dry weight of leaves and stems. Yield components and yield-related parameters assessed included the number of tubers per plant, tuber length, tuber diameter, fresh and dry tuber weight per plant, and the yield of tuber (storage root). Five plants per plot per growth stage were destructively sampled for measurement of growth parameters (agro-morphological traits), yield components, and yield. Data were subjected to statistical analysis using the Welch t-test, and ANOVA, and Python was used to evaluate correlations among cassava growth indices throughout the experimental period.
3. Results and Discussion
3.1. Real-Time Meteorological Conditions at Cassava Field During Experimental Period (03/2023-02/2026)
Meteorological data recorded at the experimental site showed considerable interannual variability over the three cropping seasons studied, as shown in Figure 3. Mean monthly air temperature ranged from 15.6 to 30.6 °C with no significant difference in seasonal patterns among years. The coolest period consistently occurred during the harvest phase (December-February, 16.3-18.3 oC), and peak temperatures were recorded in June-July (28.3-30.6 oC). Relative humidity was consistently high throughout all seasons (68.7-94%), while daily solar radiation averaged 2.6 -12.4 MJ m-2 d-1, with the 9MAP stage of cropping season 2024 recording anomalously low values (4.2 MJ m-2 d-1), approximately half that of seasons 2023 and 2025 (8.9 and 6.7 MJ m-2 d-1, respectively). Total rainfall in cropping seasons 2023-2024, 2024-2025, and 2025-2026 was recorded at 1,151.1, 1,245.3, and 1,506.2 mm, respectively, with 2023 being notably drier than the long-term mean. During the 5MAP vegetative phase, total rainfall was comparable between cropping season 2023-2024 (715.6 mm) and 2024-2025 (723.0 mm), while 2025-2026 received substantially more (827.5 mm). During the starch accumulation phase (9MAP), cropping season 2023-2024 received the lowest rainfall (425.4 mm) while simultaneously recording the highest mean daily solar radiation (9.55 MJ m-2 d-1), resulting in the greatest evapotranspiration and the highest water irrigation of the three seasons. In contrast, cropping season 2025-2026 benefited from both the highest rainfall during the 9MAP stage (607.3 mm) and moderate mean daily solar radiation (6.83 MJ m-2 d-1), generating the most favorable hydric conditions during tuber bulking. The progressive decrease in supplemental irrigation volume across the three seasons, from 373.3 mm in cropping season 2023-2024 to 298.6 mm in cropping season 2024-2025 and 245.3 mm in cropping season 2025-2026, closely followed the inter-seasonal pattern of mean daily solar radiation during the 5MAP and 9MAP phases rather than that of rainfall. This suggests that solar radiation-driven evaporative demand, rather than rainfall alone, was the primary determinant of crop water requirements and supplemental irrigation needs across the three cropping seasons.
3.2. Effects of Irrigation Regimes on Plant Height and Number of Stem Nodes
The growth parameters of cassava, including plant height and the number of stem nodes at different growth stages in the experiments, are presented in Table 2. At both sampling times (5 and 9 MAP), the mean plant height in treatment I1 was consistently higher than in I2 and I3. In the initial growth stage (5 MAP), the I1 treatment reached a mean height of 349.8 cm and a stem node number of 125.5 ± 46.7 in season 1, both of which were significantly greater than those of I2 (283.2 cm and 85.1 ± 12.6, respectively; p < 0.05). In season 2, these parameters of I1 were slightly higher than I3 (Table 2). I1 consistently maintained the greatest plant height throughout the mid-growth stages across all seasons. However, the differences became smaller toward the final stage as the plants entered senescence. During this period, plant height increased very little and was sometimes reduced by stem pruning or lodging. These results demonstrate that a consistent water supply significantly accelerated stem elongation, particularly during the initial months of establishment. At the 9MAP, treatment I1 exhibited a greater plant height compared to I2 and I3 (Table 2). From the 9MAP onwards, no significant differences in plant height and node number were observed between the treatments in all cropping seasons. This suggests that maintaining adequate soil moisture accelerated leaf initiation and stem elongation during the early growth stages, leading to earlier node formation. However, at the 9MAP of cropping season 2 and 3, the plant height in I1 was significantly different from I3 and I2, respectively (p < 0.05). Thus, plants under optimal irrigation continued to develop plant height during the mid-season, resulting in higher total leaf production throughout the growth cycle. This established a robust canopy, providing the physiological foundation for high tuber yield. By 11 MAP, neither plant height nor the number of stem nodes differed significantly among treatments in any of the cropping seasons. However, the I3 treatment maintained a slightly higher number of stem nodes compared to the remaining treatments. This small difference is related to the tendency of drought-stressed plants to shorten internode length, thereby increasing the number of nodes per unit stem length. Field observations showed that, toward the end of the season, plants in I1, after accumulating sufficient stem and root biomass, tended to shed older leaves earlier, whereas I3 plants maintained their canopy longer to compensate for the limited biomass accumulation under water deficit. Nevertheless, over the entire cycle, plants in I1 still exhibited a higher rate of node formation and a larger canopy area during the yield-determining period (5-9 MAP), which is consistent with the observed stem biomass and root weight.
3.3. Effects of Irrigation Regimes on Leaf and Stem Biomass
3.3.1. Effects of Irrigation Regimes on Leaf Fresh and Dry Matter Production
The fresh and dry aboveground biomass (leaf and stem) at different growth stages in the experiments are presented in Table 3. The leaf weight of cassava cultivar KM94 varied markedly over time: it reached its highest values during the early vegetative growth stage (5 MAP), then declined sharply at 9-11 MAP as the canopy senesced and the plant progressively shifted dry-matter allocation to the storage roots (tuber). This pattern can be explained by the vigorous canopy development in the early stage, when the leaf area reaches a maximum. Subsequently, older leaves are shed, and most assimilates are translocated to the roots, leading to a pronounced decline in leaf biomass towards the end of the season (Lenis et al. 2006). A cassava physiology study by (El-Sharkawy, 2007) similarly reported that tuber yield is generally affected by leaf biomass and canopy leaf area. Moreover, premature leaf abscission caused by water deficit reduces photosynthesis and starch accumulation in the tubers. At 11 MAP, fresh and dry leaf mass accounted for only a small fraction of their initial values, and notably, both fresh and dry leaf biomass in treatment I1 were consistently lower than in I2 and I3.
The influence of the irrigation regime on leaf biomass was more pronounced in the second cropping season. At 5 MAP, leaf fresh weight in I1 reached 1.04 ± 0.29 kg plant-1, significantly exceeding that of I3 (0.74 ± 0.31kg plant-1), indicating that supplemental irrigation promoted the early development of a larger canopy. A drip-irrigation experiment on cassava in Northeastern Thailand by (Mahakosee et al. 2019) also showed that irrigation treatments maintaining a larger leaf area and higher leaf biomass produced higher yields than the rainfed control. By 9 MAP, fresh leaf biomass in both treatments had declined sharply compared to the values recorded at 5MAP (Table 3). Statistically significant differences in fresh leaf weight were observed at 5 MAP during cropping seasons 1 and 3 (p < 0.05). Furthermore, by 9 MAP in cropping season 2, both fresh and dry leaf weights differed significantly between treatments I1 and I2. At 11MAP, fresh leaf mass declined to very low levels under all irrigation regimes, reflecting leaf aging and the shift of assimilate partitioning toward the tubers. Thus, the impact of irrigation regime on leaf biomass (both fresh and dry) was expressed mainly in the middle-growth stages, while differences became negligible at the final-growth stage.
3.3.2. Effects of Irrigation Regimes on Fresh and Dry Stem Matter Production
The stem biomass of cassava cultivar KM94 across all three cropping seasons increased sharply from 5 to 9 MAP and then tended to level off or slightly decline at 11MAP, reflecting a gradual shift in assimilate partitioning from stems and leaves to tubers (Table 3). These results align with (El-Sharkawy, 2004; 2007), confirming that cassava biomass and leaf area index peak during the vegetative phase before slowing as starch accumulation begins. At this stage, the shedding of older tissues serves as an adaptive mechanism to water availability, optimizing assimilate partitioning toward the tubers. Under moderate water deficit, cassava can maintain relatively stable stem biomass. However, once assimilate partitioning shifts in favor of storage roots, stem growth is no longer prioritized (El-Sharkawy, 2007; Silva et al. 2021).
At 5 MAP, treatment I1 recorded a fresh stem weight 22% and 34% higher than treatment I2 and I3 in seasons 1 and 2, respectively, demonstrating that supplemental irrigation promotes early stem development. While stem biomass increased across all treatments from 5 to 9MAP, differences became negligible by 11 MAP. Statistically, variations in cropping season 1 were non-significant from 9 MAP onward. However, cropping season 2 exhibited significant differences in stem fresh and dry weight (p < 0.05) at 9 months, with treatment I1 (3.32 kg plant-1 of fresh stem weight) substantially outpacing treatment I3 (2.41 kg plant-1 of fresh stem weight). These results align with previous studies in Nigeria and Thailand, where optimal irrigation significantly enhanced shoot and total plant biomass compared to rainfed conditions (Anan Polthanee & Srisutham 2017). Furthermore, research on deficit irrigation indicates that while moderate levels (~60% of requirement) sustain most of the stem biomass, severe restrictions (30-40%) trigger a sharp decline in whole-plant dry biomass, including stems (Wasonga et al. 2020).
3.4. Effects of Irrigation Regime on Yield Components and Yield of Cassava
The yield components considered were the number of tubers per plant, tuber length, and tuber diameter (Table 4). Results showed that the number of tubers per plant varied little throughout the seasons: at 5 MAP, the average number of tubers ranged from 8.8 to 14.6 tubers per plant, with no clear differences among irrigation regimes. By 9 and 11MAP, the number of tubers declined slightly by about 1-2 tubers per plant. The small differences in tuber number among treatments indicate that the irrigation regime did not significantly affect the number of tubers per plant. This can be explained by the characteristics of storage root formation in cassava: the number of tubers is set relatively early (2-3 MAP) and is weakly responsive to management interventions applied after 5 months of crop growth (El-Sharkawy, 2004).
Tuber size responded more clearly to the different irrigation regimes. Tuber length in all treatments increased over time, but treatment I1 consistently tended to outperform the other two treatments after 5MAP. By the end of the cropping season, the tubers in I1 were approximately 5-7 cm longer than those in I3. This indicates that supplemental irrigation created favorable conditions for tuber elongation, allowing roots to extend more vigorously under stable soil moisture conditions. Similarly, a study on cassava yield in the Fafen District of Ethiopia reported that tuber length is one of the yield components most strongly associated with tuber yield, and that varieties or management practices which increase tuber length and size generally result in higher yields (Misganaw & Bayou 2020).
Regarding tuber diameter, all cropping seasons showed an increasing trend from 9 to 11 MAP. At 5 MAP in the second season, tuber diameter was still small (around 3.3-3.5 cm), and the difference between the two treatments was almost negligible. By 9 MAP, treatment I1 produced a larger tuber diameter than I3, indicating that supplemental irrigation helped promote root thickening during the mid-season growth phase. At 11 MAP, tuber diameters in I1 and I3 were approximately equal at about 5.5 cm, whereas in the third season, I1 gave the largest tuber diameter compared with the other treatments. Consistently, the I1 regime in this study improved tuber yield by enhancing tuber morphological traits rather than increasing the number of tubers. This explains the superior yield in I1 despite the negligible differences in tuber count per plant compared to other treatments.
The observations of tuber biomass in this experiment indicate a typical response of the cassava cultivar KM-94 to contrasting irrigation regimes. Tuber fresh weight increased steadily from 5 to 11MAP across all treatments (Table 4). However, from 9 to 11 MAP, the increment in tuber fresh weight was smaller than during the earlier growth period, suggesting that proactive irrigation favored the earlier onset of storage root bulking. This result agrees with the previous studies, which reported that adequate soil moisture during the initial phase promotes early tuber initiation and greater tuber thickening in cassava (El-Sharkawy, 2007; Ittipong et al., 2025). The effects of irrigation regimes on tuber biomass were more pronounced in the second and third cropping seasons. Both tuber fresh and dry weight differed markedly in I1 compared with the other treatments, especially at 9-11 MAP (p < 0.05), when tubers were in the active bulking phase (Table 4), indicating that supplementary irrigation significantly improves both tuber fresh and dry yield and water use efficiency in humid tropical cassava systems (Mahakosee et al. 2019; Odubanjo et al. 2011). The KM-94 cultivar was able to maintain a certain level of tuber yield under the rainfed regime. However, when irrigated following the model-based regime with more stable soil moisture, KM-94 more fully expressed its growth potential in leaves and stems, resulting in higher tuber biomass, particularly in the 2024-2005 planting season when weather conditions were drier. These findings are consistent with studies on cassava irrigation technologies, which report that selective supplementary irrigation during the period of tuber formation and development can substantially increase tuber yield and quality, while still taking advantage of cassava’s inherent drought tolerance (Odubanjo et al. 2011; Anan Polthanee & Srisutham 2017; Wasonga et al. 2020).
The yields of cassava tuber across the three cropping seasons are illustrated in Figure 4, demonstrating a clear relationship between irrigation volumes and crop performance. In this experiment, treatment I1 received moderate, tailored irrigation amounts (373.3 mm in season 1; 298.6 mm in season 2; and 245.3 mm in season 3) and consistently achieved the highest yield, ranging from 35.6 to 36.9 tonnes ha-1. In contrast, the rainfed treatment I3, which received no supplemental irrigation (0 mm), recorded the lowest yields at 26 tonnes ha-1 in season 2 and 24.5 tonnes ha-1 in season 3 due to water deficits. Interestingly, treatment I2 received the highest irrigation volumes (500 mm in season 1 and 464 mm in season 3) but yielded 8-12 tonnes ha-1 lower than I1. These results indicate that providing excessive supplemental irrigation based on visual observation, rather than actual crop demand, negatively impacts tuber formation. As supported by previous studies (Polthanee and Srisutham, 2018; Silva et al., 2023). Irrigation schedules tailored to the cassava’s precise water requirements (I1) are significantly more effective for tuber fresh and dry yields than both rainfed conditions (I3) and over-irrigation (I2), which may induce waterlogging and suppress yield.
3.5. Correlation Analysis Between Growth Parameters and Yield Components
The correlations between growth parameters, including plant height, number of nodes per stem, fresh and dry weight of leaves, stems, and tuber fresh and dry weight, are presented in Figure 5. At 5 MAP, fresh and dry weight for stems, leaves, and tuber were all strongly and positively correlated (p < 0.01). Strong positive correlations were observed between tuber yield components (number and diameter) and biomass (fresh and dry weight). Notably, tuber diameter showed a high degree of correlation with fresh (r = 0.75) and dry (r = 0.69) tuber weight (p < 0.001). Tuber length, by contrast, showed only a weak, non-significant positive correlation with tuber weight. These results are consistent with findings that tuber diameter and weight are stronger determinants of tuber yield than tuber length (Njoku & Mbah 2020).
In addition, fresh and dry leaf weight at 5MAP showed strong positive correlations with yield components (tuber diameter and fresh and dry weight). Especially, tuber fresh weight exhibited specific correlations of r = 0.57 and 0.59 (p < 0.001) with fresh and dry leaf weights, respectively, suggesting that a robust canopy during early growth stage provides a critical source of photoassimilates. Conversely, plant height at this stage was negatively correlated with tuber length (r = -0.37, p < 0.05) and both fresh and dry tuber weight (r = -0.45 and -0.48, respectively; p < 0.01). This indicates that excessive stem elongation at the initial stage reduces assimilate allocation to the tuber. These results align with Phoncharoen et al. (2019), who reported that genotypes characterized by low branching, balanced canopy architecture, and moderate height achieved higher dry tuber yields than tall, late-branching types, due to more favorable partitioning of photoassimilates toward storage root development (Phoncharoen et al. 2019).
At 9 MAP, leaf fresh and dry indices remained positively correlated with tuber diameter (r = 0.35 and 0.40, respectively; p < 0.05). However, the strength of the correlation between leaf and tuber weight declined, while strong positive correlations emerged between stem weight and tuber weight (r = 0.59-0.68; p < 0.001). Stem height and number of stem also showed positive correlations with both fresh and dry tuber weight (r = 0.38-0.39; p < 0.05). These patterns indicate that, at 9MAP, shoot development, particularly stem growth, has a pronounced influence on tuber development and final yield.
At 11 MAP, correlation analysis (Figure 5) revealed that fresh tuber yield was primarily driven by tuber diameter (r = 0.73, p < 0.001) and tuber length ( r = 0.52, p < 0.01) rather than tuber number (r = 0.23). This indicates that tuber number is not the sole determinant of yield at the final stage. These findings align with Rao et al. (2017), who also reported that tuber number serves only as a secondary factor in determining overall yield (Rao et al. 2017).
Fresh and dry stem weight were positively correlated with tuber length (r = 0.55 and 0.45, respectively; p < 0.01), and with tuber fresh weight (r = 0.51; p < 0.01 and 0.34, respectively), indicating that stem biomass is one of the key determinants of cassava yield at the late growth stage. Conversely, the leaf-related indicator at 11MAP exhibited an inverse relationship with tuber weight. Fresh leaf weight was negatively correlated with tuber number and tuber length. Consequently, fresh leaf mass was slightly negatively correlated with fresh and dry tuber mass (r = -0.23 and -0.18, respectively). This suggests that plants that retained a higher leaf biomass at the final growth stage tended to have lower tuber biomass, because a considerable proportion of dry matter remained in the leaves instead of being strongly remobilized to the tubers. These patterns are consistent with the dry matter partitioning dynamics reported by Sagrilo et al. (2008) and Chipeta et al. (2016), whereby high-yielding cassava plants exhibit a progressive decline in leaf biomass allocation and a marked increase in assimilate channeling toward storage roots during the final stages of the growth cycle (Chipeta et al. 2016; Sagrilo et al. 2008). At 11 MAP, tubers become the dominant sink for dry matter accumulation, as evidenced by the positive correlation between stem weight and tuber weight alongside the negative association between fresh leaf weight and tuber weight, a partitioning pattern reflecting the physiological transition from vegetative growth to active tuber bulking. The persistent negative correlation between plant height and tuber number (r = -0.22) further confirms that excessive vertical growth tends to limit tuber formation, reinforcing the importance of balanced above-ground architecture for optimizing harvest index in cassava.
4. Conclusions
Model-based drip irrigation (I1) consistently promoted vegetative growth and improved yield components of cassava variety KM-94 compared to farmer-managed (I2) and rainfed (I3) treatments. Plant height, stem node number, and leaf and stem biomass were enhanced from early growth stages (5MAP) under treatment I1, supporting shoot development and canopy establishment. Although irrigation treatment did not significantly affect tuber number per plant, it improved tuber dimensions, particularly length and diameter, during the starch accumulation phase, resulting in yields of fresh tuber of 35.6-36.9 tonnes ha-1 under I1, exceeding I2 and I3 by 8-12 tonnes ha-1. Dry matter production was also increased under model-based irrigation, suggesting an important role of supplementary irrigation, appropriately aligned with crop water demand, in increasing the yield potential of cassava, especially under drought conditions and water scarcity. The correlations between growth parameters and yield components of cassava shifted across development stages. At 5 MAP, both fresh and dry tuber weight correlated positively with fresh and dry leaf weight (r = 0.55-0.61; p<0.001), tuber number (r = 0.45-0.50; p < 0.01), and tuber diameter (r = 0.69-0.75; p < 0.001), reflecting the dominant role of photosynthetic source capacity in early yield determination. By harvest (11 MAP), tuber fresh weight was positively correlated with fresh and dry stem weight (r = 0.51, p<0.01; r = 0.34, respectively, while leaf fresh weight showed a negative correlation with tuber fresh weight (r = -0.23), consistent with effective dry matter remobilization from vegetative organs to tuber at crop maturity. These findings suggest that model-based supplemental drip irrigation can improve the growth and yield performance of KM94 under northern Vietnam’s climatic conditions. These findings provide a scientific basis for developing water-saving irrigation strategies to optimize cassava KM94 yield potential under increasing water scarcity conditions in Southeast Asia and beyond.
Author Contributions
C-T. Pham. Research concept and design, data analysis, writing the article; L.K. Nguyen, T.Q. Ha, H.D. Chu, M.T. Vu, M.N. Duong and T.N.A. Nguyen: collection data and data analysis; G.H. Hoang, J.A. Postma: designed the experiments and reviewed the manuscript; T.T. Tran: reviewed and edited the manuscript.
Funding
This work has been supported by VNU University of Engineering and Technology under project number CN23.04.
Institutional Review Board Statement
Not applicable.
Informed Consent Statement
Not applicable.
Data Availability Statement
The original contributions presented in this study are included in the article. Further inquiries can be directed to the corresponding author.
Acknowledgments
The authors wish to acknowledge Assoc. Prof. Dr Tree Nut Saithong and all members of her Research group in King Mongku’s University of Technology Thonburi for supporting during our the field experiment.
Conflicts of Interest
The authors declare no competing interests.
Abbreviations
The following abbreviations are used in this manuscript:
| MAP | months after planting |
| DAP | Days after planting |
References
- Adiele, J.G.; Schut, A.G.T.; van den Beuken, R.P.M.; Ezui, K.S.; Pypers, P.; Ano, A.O.; Egesi, C.N.; Giller, K.E. A recalibrated and tested LINTUL-Cassava simulation model provides insight into the high yield potential of cassava under rainfed conditions. Eur. J. Agron. 2021, 124, 126242. [Google Scholar] [CrossRef]
- Caplan, B.A. Optimizing Carbon Dioxide Concentration and Daily Light Integral Combination in a Multi-Level Electrically Lighted Lettuce Production System. Master Thesis, Univ. Arizona, 2018. Available online: https://repository.arizona.edu/handle/10150/630127.
- Chipeta, M.M.; Shanahan, P.; Melis, R.; Sibiya, J.; Benesi, I.R.M. Early storage root bulking index and agronomic traits associated with early bulking in cassava. F. Crop. Res. 2016, 198, 171–178. [Google Scholar] [CrossRef]
- Duong, M.N.; Hoang, G.H.; Pham, C.T.; Nguyen, L.K.; Vu, M.T.; Ha, T.Q.; Pham, M.T.; Postma, J.A. Development of a Model-Based IoT System for Cassava Field Management. In Proceedings of the 2024 Int. Conf. Control. Robot. Informatics, 2024; pp. 80–85. [Google Scholar] [CrossRef]
- El-Sharkawy, A.M. Physiological characteristics of cassava tolerance to prolonged drought in the tropics: implications for breeding cultivars adapted to seasonally dry and semiarid environments. Braz. J. Plant Physiol. 2007, 19(4), 257–286. [Google Scholar] [CrossRef]
- El-Sharkawy, M.A. Cassava biology and physiology. Plant Mol. Biol. 2004, 56(4), 481–501. [Google Scholar] [CrossRef] [PubMed]
- Ezui, K.S.; Leffelaar, P.A.; Franke, A.C.; Mando, A.; Giller, K.E. Simulating drought impact and mitigation in cassava using the LINTUL model. F. Crop. Res. 2018, 219, 256–272. [Google Scholar] [CrossRef]
- Howeler, R.H. The cassava handbook: a reference manual based on the Asian regional cassava training course, held in Thailand Centro Internacional de Agricultura Tropical (CIAT). 2012. [Google Scholar] [CrossRef]
- Ittipong, P.; Santanoo, S.; Vorasoot, N.; Jogloy, S.; Vongcharoen, K.; Theerakulpisut, P.; Lawson, T.; Banterng, P. Soil Moisture and Growth Rates During Peak Yield Accumulation of Cassava Genotypes for Drought and Full Irrigation Conditions. Environments 2025, 12(11). [Google Scholar] [CrossRef]
- Lee, S.K.; Dang, T.A. Assessment of aquacrop model applicability for estimating cassava yield in the son hoa planting region of phu yen province, vietnam. Res. Crop. 2019a, 20(2), 438–444. [Google Scholar] [CrossRef]
- Lee, S.K.; Dang, T.A. Calibration and validation of the FAO-aquacrop model for cassava in the dong xuan cultivation area of phu yen province using irrigation rainfall. Res. Crop. 2019b, 20(3), 555–562. [Google Scholar] [CrossRef]
- Lenis, J.I.; Calle, F.; Jaramillo, G.; Perez, J.C.; Ceballos, H.; Cock, J.H. Leaf retention and cassava productivity. F. Crop. Res. 2006, 95(2-3), 126–134. [Google Scholar] [CrossRef]
- Mahakosee, S.; Jogloy, S.; Vorasoot, N.; Theerakulpisut, P.; Banterng, P.; Kesmala, T.; Holbrook, C.; Kvien, C. Seasonal Variations in Canopy Size and Yield of Rayong 9 Cassava Genotype under Rainfed and Irrigated Conditions. Agronomy 2019, 9(7). [Google Scholar] [CrossRef]
- Misganaw, C.D.; Bayou, W.D. Tuber Yield and Yield Component Performance of Cassava (Manihot esculenta) Varieties in Fafen District, Ethiopia. Int. J. Agron. 2020. [Google Scholar] [CrossRef]
- Njoku, D.N.; Mbah, E.U. Assessment of yield components of some cassava (Manihot esculenta Crantz) genotypes using multivariate analysis such as path coefficients. Open Agric. 2020, 5(1), 516–528. [Google Scholar] [CrossRef]
- Odubanjo, O.; Olufayo, A.; Oguntunde, P. Water use, growth, and yield of drip irrigated cassava in a humid tropical environment. Soil Water Res. 2011, 6(1), 10–20. [Google Scholar] [CrossRef]
- Phoncharoen, P.; Banterng, P.; Vorasoot, N.; Jogloy, S.; Theerakulpisut, P. Growth rates and yields of cassava at different planting dates in a tropical savanna climate. Sci. Agric. 2019, 76, 376–388. [Google Scholar] [CrossRef]
- Phung, T.D. Irrigation benefits for rainfed cassava cultivation regions in Vietnam based on LINTUL-Cassava model. Res. Crop. 2024, 25(1), 73–78. [Google Scholar] [CrossRef]
- Polthanee, A.; Srisutham, M. Growth, yield and water use of drip irrigated cassava planted in the late rainy season of Northeastern Thailand. Indian J. Agric. Res. 2018, 52(5), 554–559. [Google Scholar] [CrossRef]
- Anan, Polthanee; Srisutham, M. Supplementary irrigation for cassava planted in the late rainy season of Northeastern Thailand. Asian J. Crop Sci. 2017, 9(4), 100–108. [Google Scholar] [CrossRef]
- Rai, A.; Dong, Y. A scoping review of irrigation scheduling methods in potato (Solanum tuberosum L.) production. Am. J. Potato Res. 2025, 102(4), 348–371. [Google Scholar] [CrossRef]
- Rao, B.B.; Swami, D.V.; Ashok, P.; Babu, B.K.; Ramajayam, D.; Sasikala, K. Correlation and path coefficient analysis of cassava (Manihot esculenta Crantz) genotypes. Int. J. Curr. Microbiol. Appl. Sci. 2017, 6(9), 549–557. [Google Scholar] [CrossRef]
- Ruangyos, C.; Banterng, P.; Vorasoot, N.; Jogloy, S.; Theerakulpisut, P.; Vongcharoen, K.; And; Hoogenboom, G. Growth analysis of cassava genotypes planted under irrigation management practices during the early growth phase. J. Agric. Sc. 2024, 162(6), 596–606. [Google Scholar] [CrossRef]
- Ruangyos, C.; Banterng, P.; Vorasoot, N.; Jogloy, S.; Theerakulpisut, P.; Vongcharoen, K.; Hoogenboom, G. Variation in biomass of cassava genotypes grown under different irrigation levels during the early growth phase. Crop Sci. 2023, 64(1), 482–495. [Google Scholar] [CrossRef]
- Sagrilo, E.; Vidigal Filho, P.S.; Pequeno, M.G.; Gonçalves-Vidigal, M.C.; Kvitschal, M.V. Dry matter production and distribution in three cassava (Manihot esculenta Crantz) cultivars during the second vegetative plant cycle. Braz. Arch. Biol. Technol. 2008, 51(6), 1079–1087. [Google Scholar] [CrossRef]
- Silva, R.B.; Teodoro, I.; de Souza, J.L.; Ferreira, R.A.; dos Santos, M.A.; Martins, G.M.C. Water balance and technical-financial performance of irrigation in the cassava cultivation. Rev. Ceres 2023, 70(5). [Google Scholar] [CrossRef]
- Silva, R.B.; Teodoro, I.; de Souza, J.L.; Ferreira, R.A.; Magalhães, I.D.; dos Santos, M.A.; Lyra, G.B.; Lyra, G.B.; Filho, G.M.; de Souza, R.C.; dos Santos Silva, L.K.; Santos, J.V.; de Oliveira, J.D.S. Physiological and productive aspects of cassava under different irrigation levels. Bragantia 2021, 80, 1–14. [Google Scholar] [CrossRef]
- Wasonga, D.O.; Kleemola, J.; Alakukku, L.; Mäkelä, P.S.A. Growth Response of Cassava to Deficit Irrigation and Potassium Fertigation during the Early Growth Phase. Agronomy 2020, 10(3). [Google Scholar] [CrossRef]
- Wu, S.P.; Tao, S.; Zhang, Z.H.; Lan, T.; Zuo, Q. Characterization of TSP-bound n-alkanes and polycyclic aromatic hydrocarbons at rural and urban sites of Tianjin, China. Environ. Pollut. 2007, 147(1), 203–210. [Google Scholar] [CrossRef] [PubMed]
- Yin, J.; Yang, Y.; Eeswaran, R.; Yang, Z.; Ma, Z.; Sun, F. Irrigation scheduling for potatoes (Solanum tuberosum L.) under drip irrigation in an arid region using AquaCrop model. Front. Plant Sci. 2023, 14 (September), 1–12. [Google Scholar] [CrossRef] [PubMed]
- Zhao, H.; Di, L.; Guo, L.; Zhang, C.; Lin, L. An Automated Data-Driven Irrigation Scheduling Approach Using Model Simulated Soil Moisture and Evapotranspiration. Sustain 2023, 15(17). [Google Scholar] [CrossRef]
Figure 1.
Web interface displaying weather data in the study.
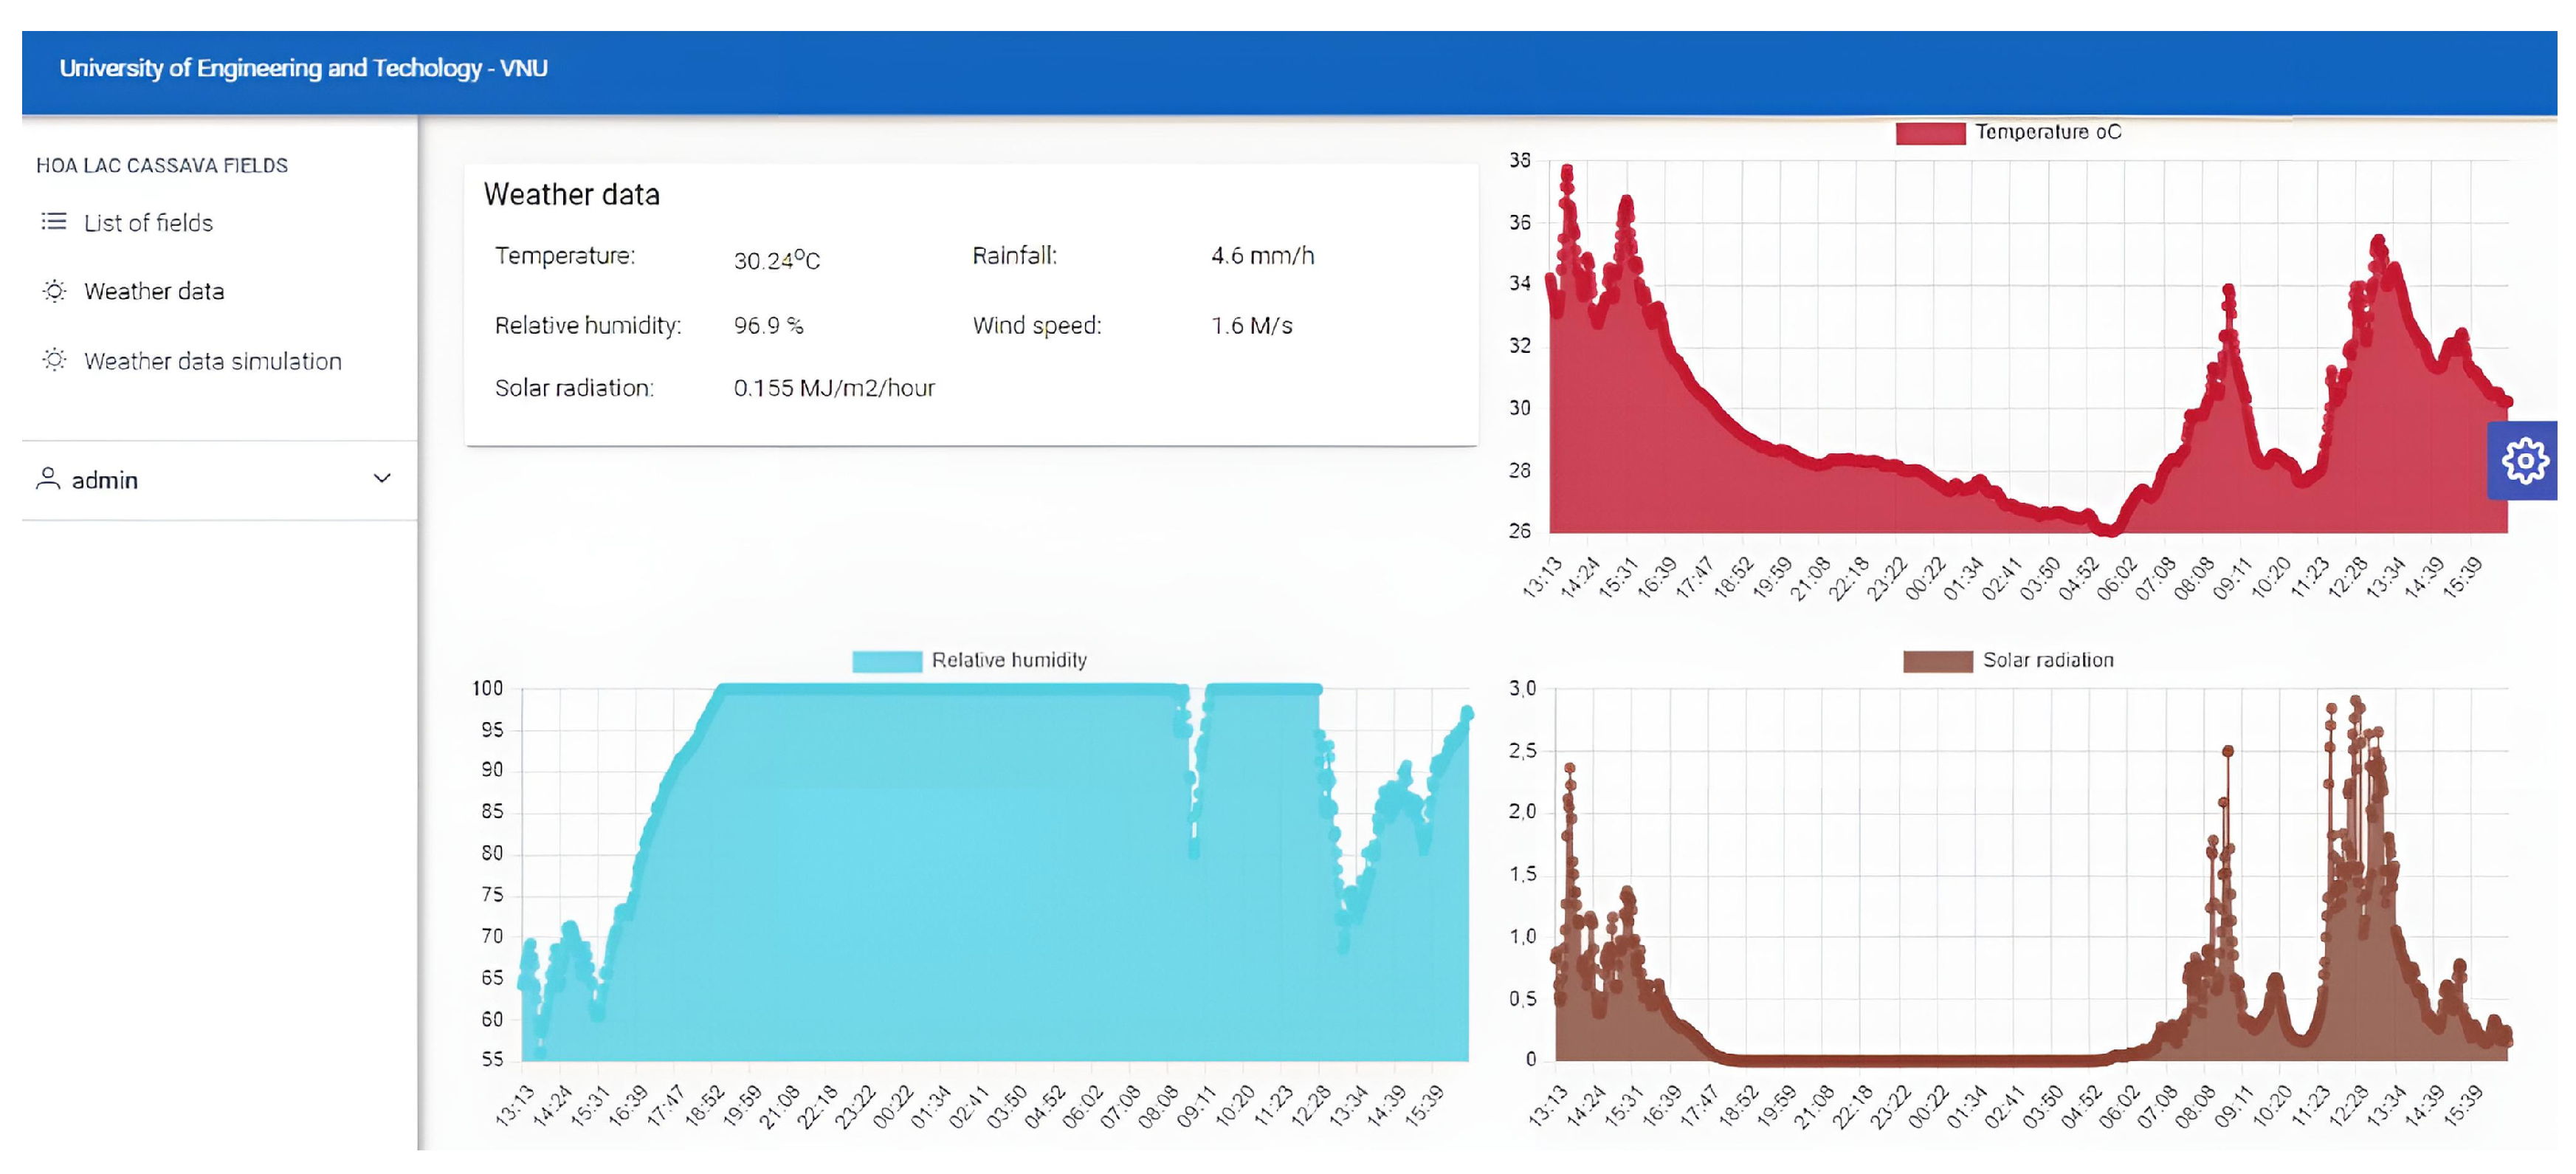
Figure 2.
Automatic and manual irrigation scheme of the study.
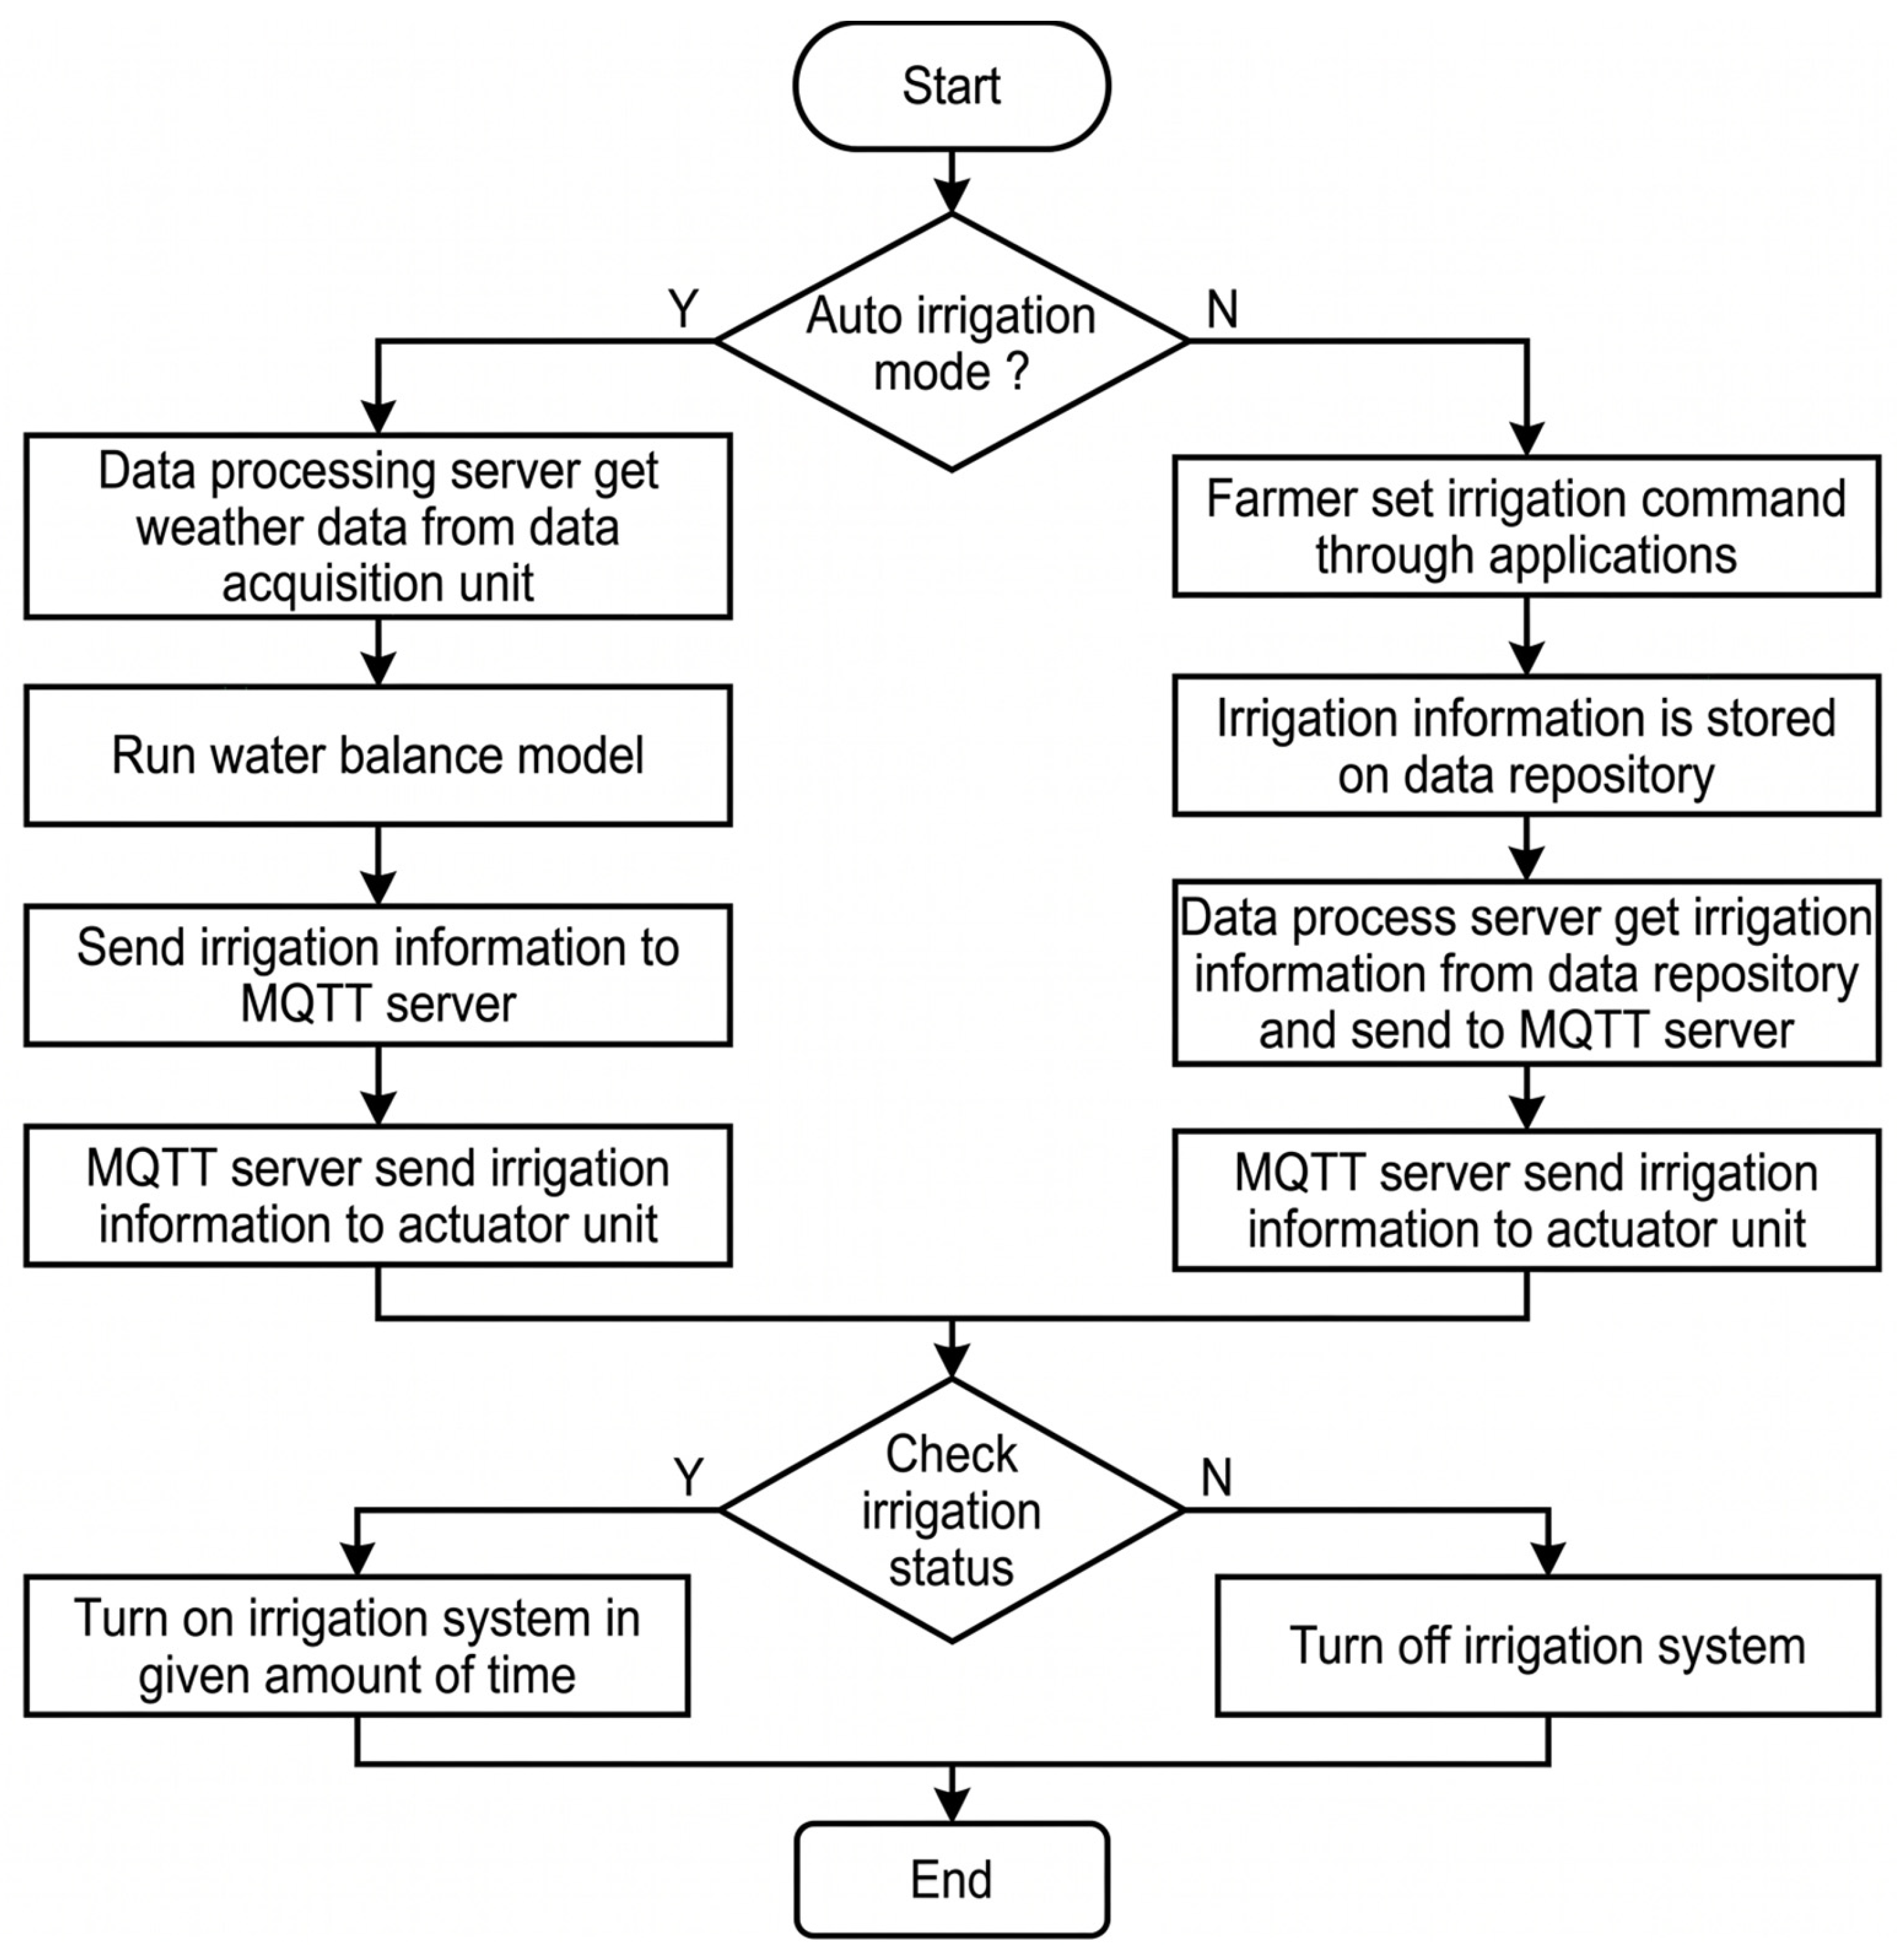
Figure 3.
Realtime meteorological conditions at the experiment site during experimental period (03/2023-02/2026). Data of Temperature, solar radiation (MJ m-2), Rainfall (mm), atmospheric moisture (%) were collected from weather station installed at the experiment site during three cropping seasons (03/2023-02/2026).
Figure 3.
Realtime meteorological conditions at the experiment site during experimental period (03/2023-02/2026). Data of Temperature, solar radiation (MJ m-2), Rainfall (mm), atmospheric moisture (%) were collected from weather station installed at the experiment site during three cropping seasons (03/2023-02/2026).
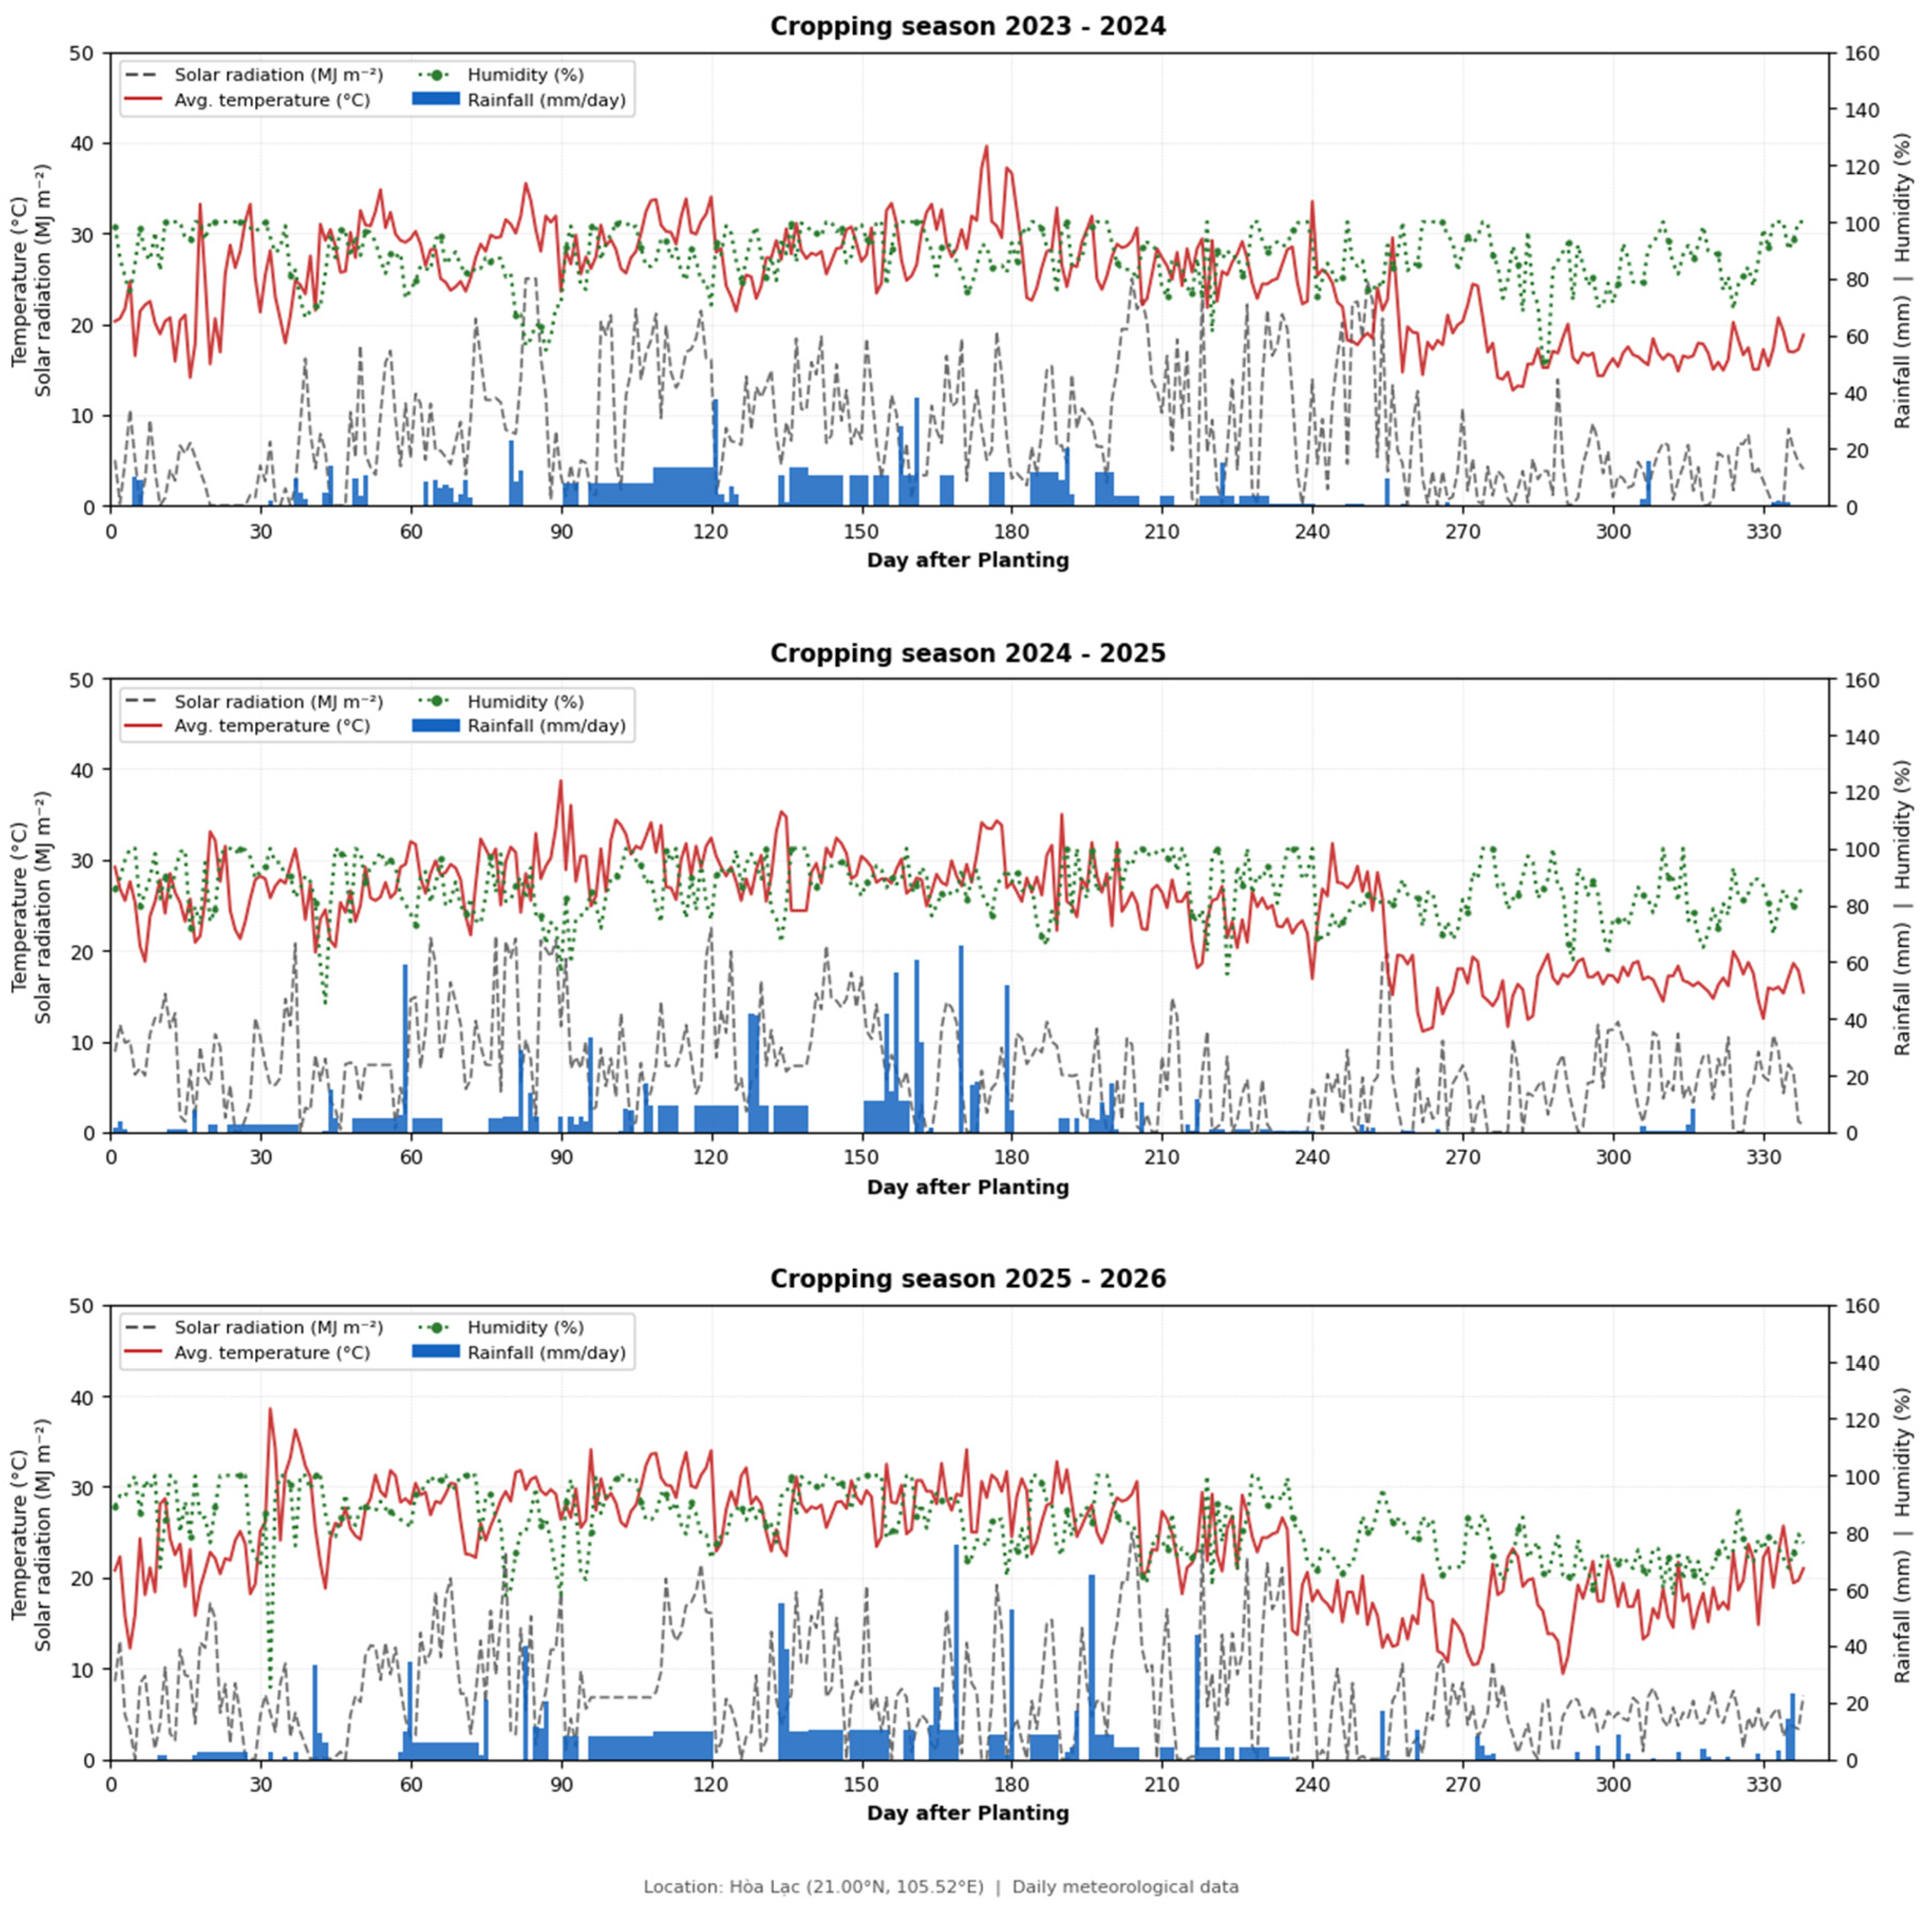
Figure 4.
Effects of irrigation treatments on cassava fresh tuber yield under different cropping seasons. Treatment I1: Model-based (automated model-based drip irrigation; Treatment I2: Farmer (farmer-practice irrigation); Treatment I3: Rainfed (rainfed control). Yield of cassava were caculated at the harvest time (11MAP). Bars show standard deviations of the average. Values with the different superscript small letters are significantly different at p ≤ 0.05 (ANOVA analysis and Welch t-test analysis).
Figure 4.
Effects of irrigation treatments on cassava fresh tuber yield under different cropping seasons. Treatment I1: Model-based (automated model-based drip irrigation; Treatment I2: Farmer (farmer-practice irrigation); Treatment I3: Rainfed (rainfed control). Yield of cassava were caculated at the harvest time (11MAP). Bars show standard deviations of the average. Values with the different superscript small letters are significantly different at p ≤ 0.05 (ANOVA analysis and Welch t-test analysis).
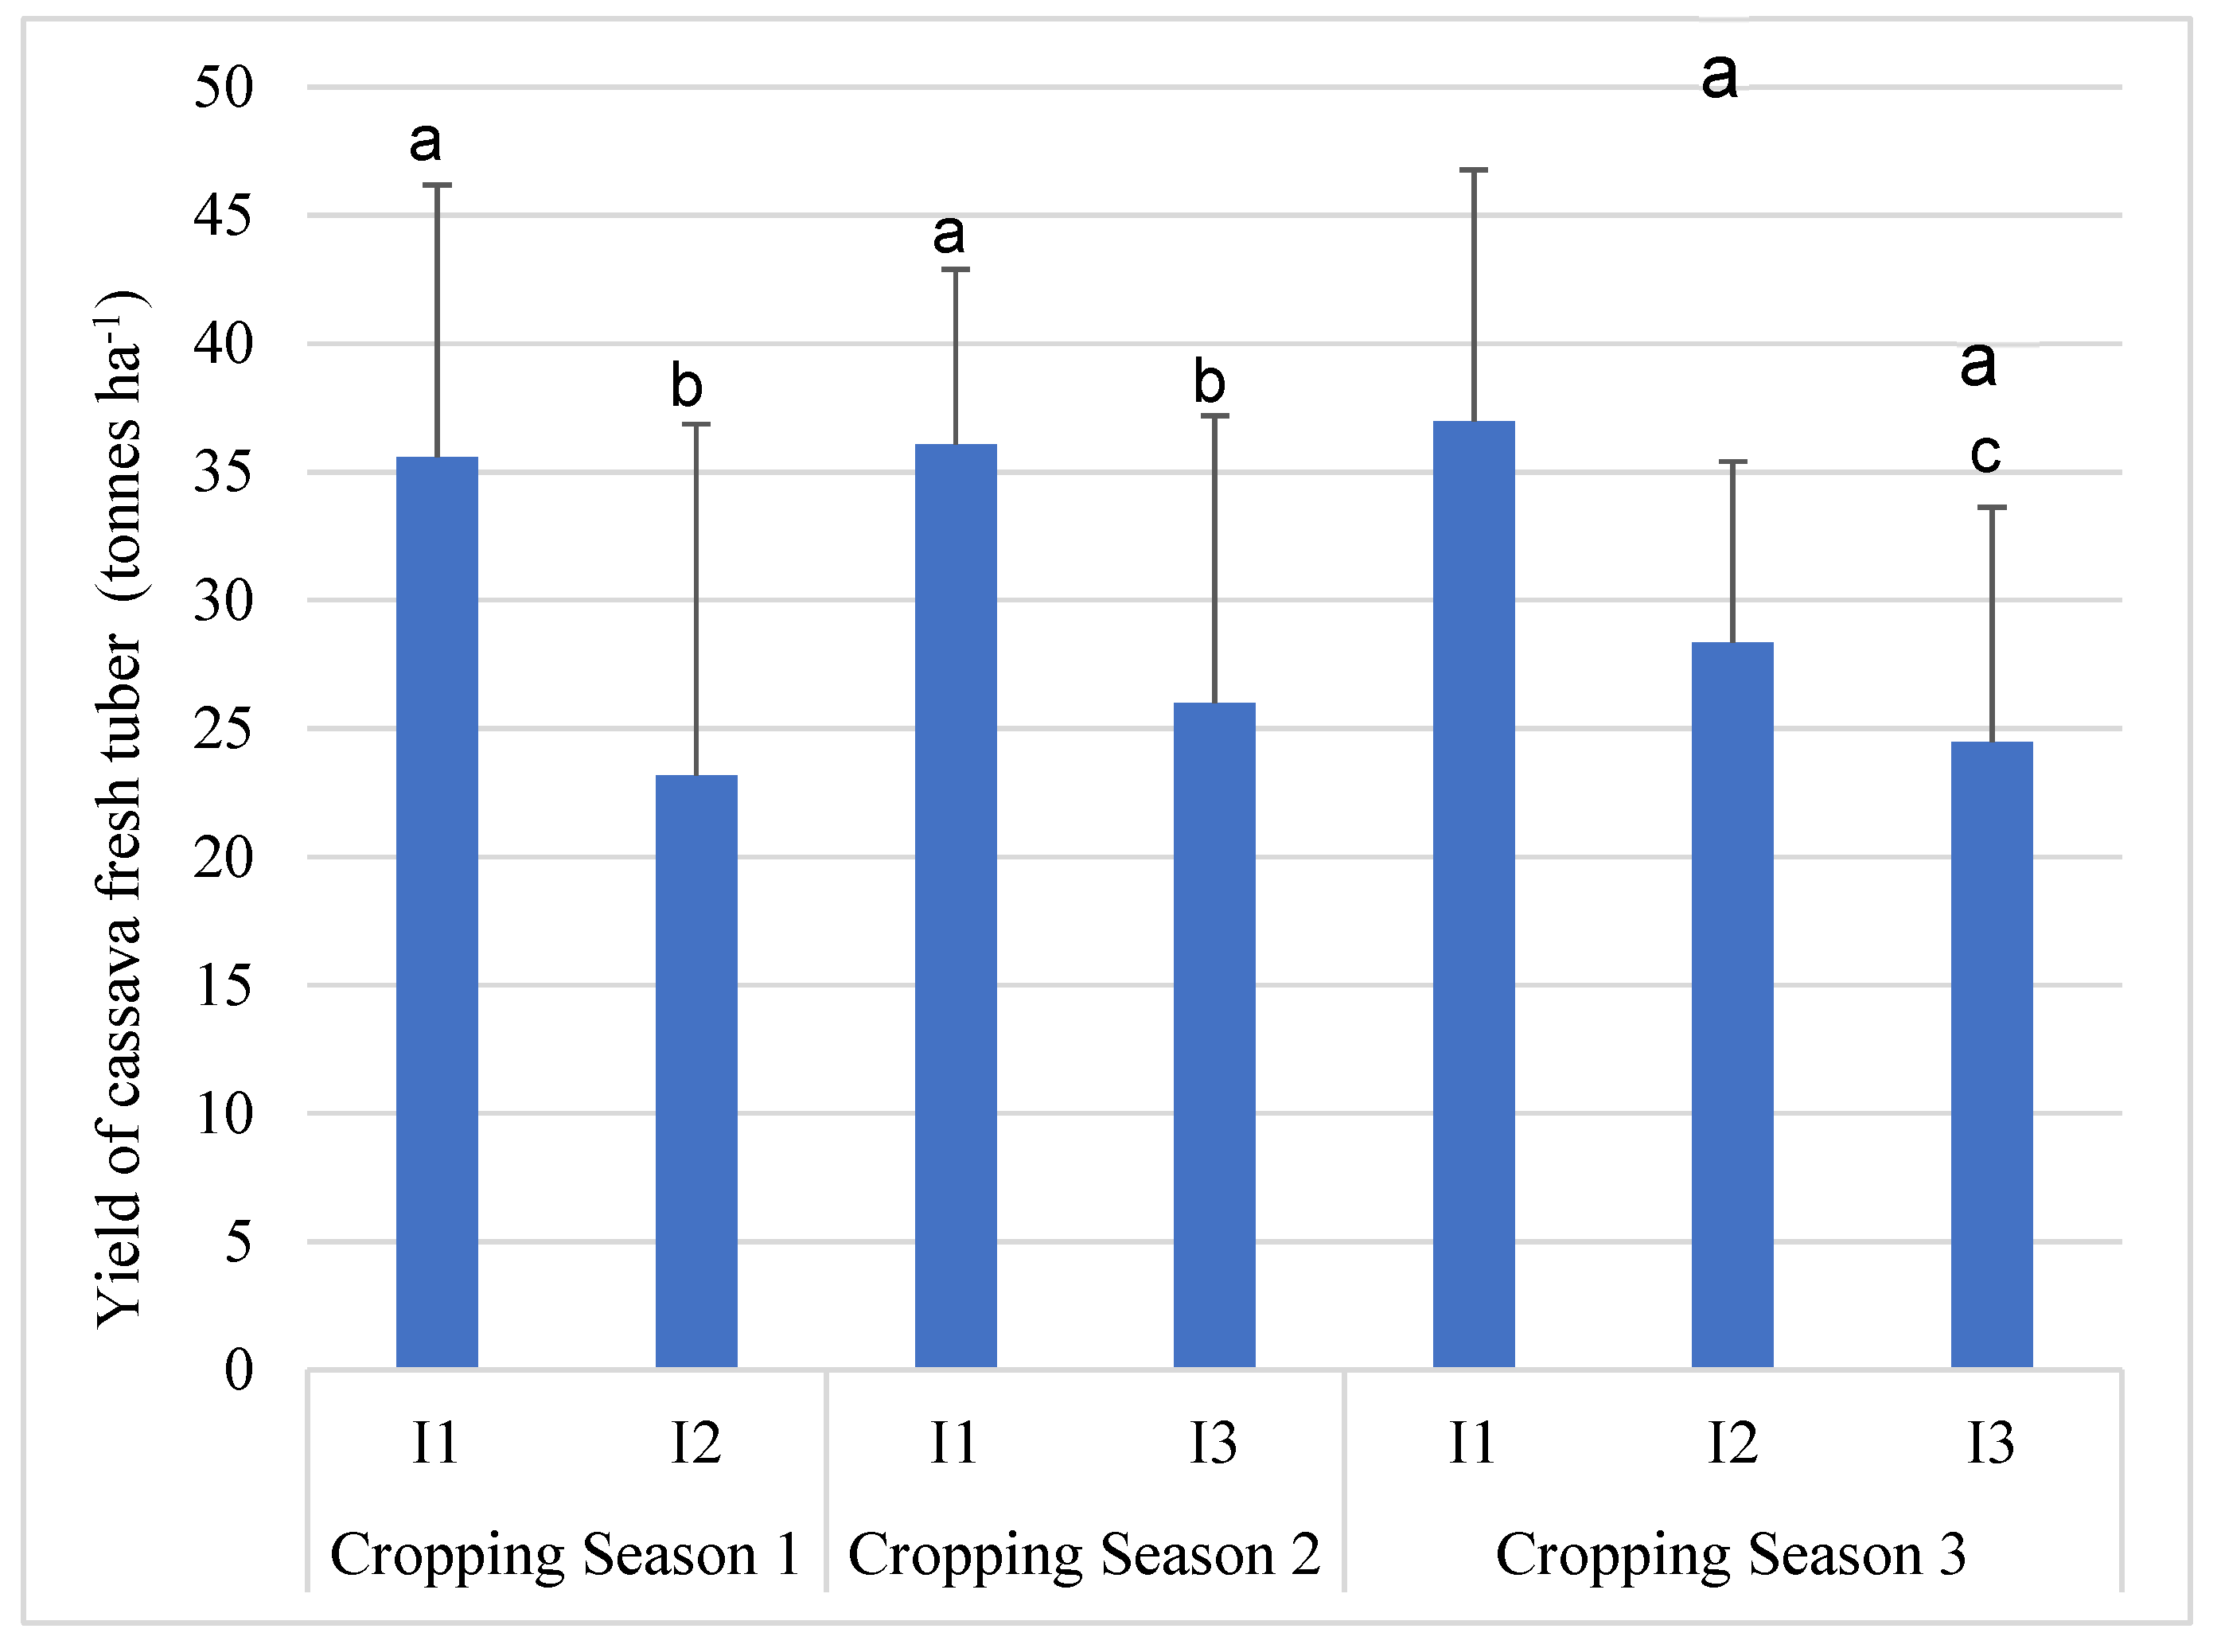
Figure 5.
Relationships among growth parameters and yield components at different growth stages of cassava KM94. Stem_Height: Stem height of plant; No_node: Number of stem node; L.FreshW: Leaf fresh weight; L.dryW: Leaf dry weight; St.freshW: Stem fresh weight; St.dryW: Stem dry weight; No_Tuber: Number of tuber; T.Length: Tuber length; T.Dia: Tuber diameter; T.freshW: Tuber fresh weight; T.dryW: Tuber dry weight. * significant at p < 0.05; ** significant at p < 0.01, *** significant at p < 0.001.
Figure 5.
Relationships among growth parameters and yield components at different growth stages of cassava KM94. Stem_Height: Stem height of plant; No_node: Number of stem node; L.FreshW: Leaf fresh weight; L.dryW: Leaf dry weight; St.freshW: Stem fresh weight; St.dryW: Stem dry weight; No_Tuber: Number of tuber; T.Length: Tuber length; T.Dia: Tuber diameter; T.freshW: Tuber fresh weight; T.dryW: Tuber dry weight. * significant at p < 0.05; ** significant at p < 0.01, *** significant at p < 0.001.
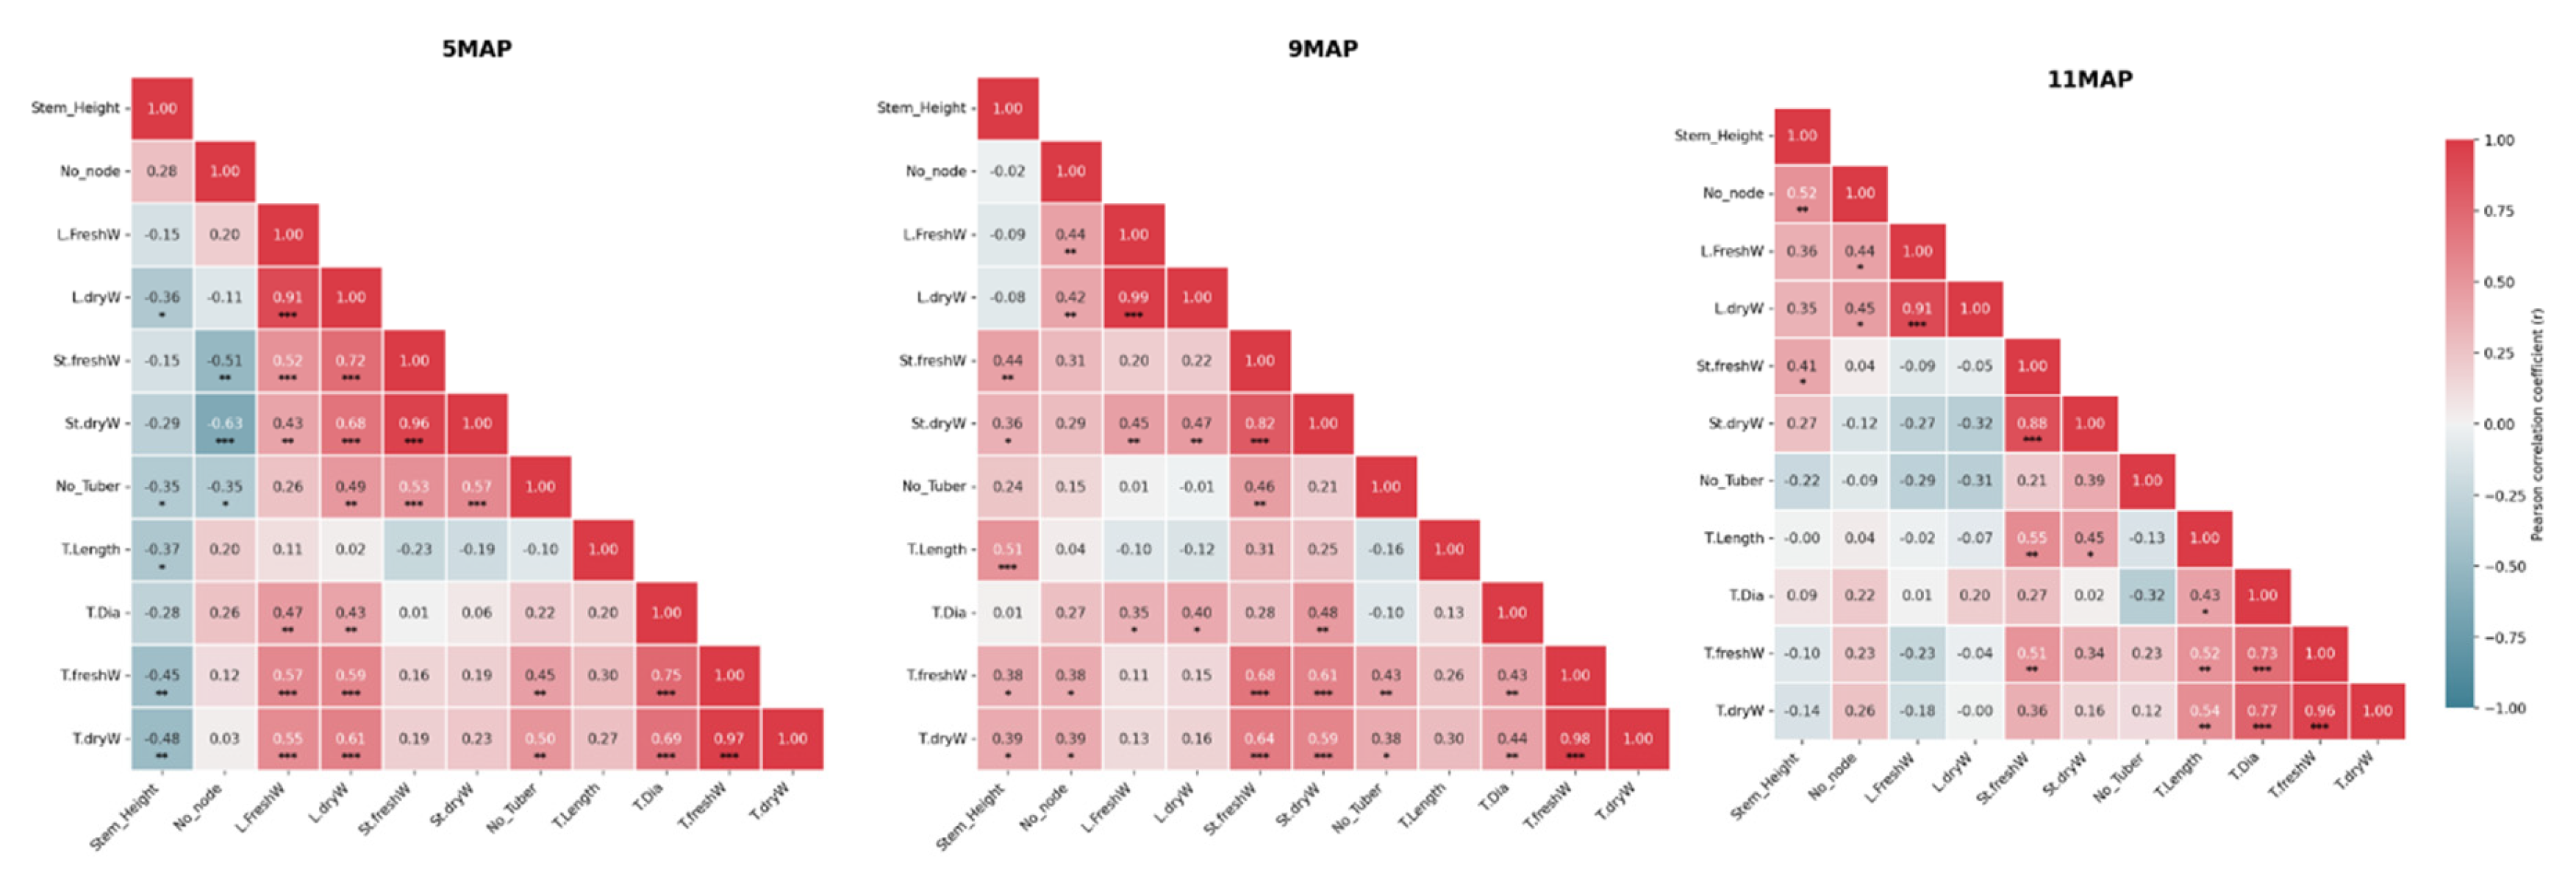

Table 1.
Soil properties of the experiment site before planting at 0-25 cm and 25-50 cm depth.
| # | Parameters/Time | 03/2023 | |
| 0-30 cm | 30-60 cm | ||
| 1 | Bulk density (g/cm3) | 1.23 | 1.31 |
| 2 | Porosity (%) | 52.4 | 46.6 |
| 3 | Clay (%) | 26.4 | 26.6 |
| 4 | Limon (%) | 26.5 | 25.9 |
| 5 | Sand (%) | 47.1 | 47.5 |
| 6 | pH H20 | 7.27 | 7.12 |
| 7 | OM (%) | 1.25 | 1.20 |
| 8 | N total (%) | 0.08 | 0.1 |
| 9 | P2O5 (%) | 0.63 | 0.54 |
| 10 | K2O (%) | 1.43 | 1.42 |
Note: OM: organic matter, N: nitrogen.
Table 2.
Effects of irrigation regimes on plant height and the number of nodes/stem of cassava.
| Parameters | Cropping season | 5 MAP | 9 MAP | 11 MAP | ||||||
|---|---|---|---|---|---|---|---|---|---|---|
| I1 | I2 | I3 | I1 | I2 | I3 | I1 | I2 | I3 | ||
| Plant height (cm) | Cropping season 1 | 349.80 ± 74.86* | 283.22 ± 92.44* | - | 491.00 ± 152.96ns | 458.78 ± 114.02ns | - | 453.10 ± 89.05ns | 435.70 ± 47.50ns | - |
| Cropping season 2 | 395.50 ± 73.34ns | 358.40 ± 52.61ns | 413.80 ± 39.34* | 349.40 ± 85.30* | 355.55 ± 32.80ns | 387.25 ± 64.14ns | ||||
| Cropping season 3 | 441.80 ± 73.11a | 453.00 ± 30.50a | 442.40 ± 83.86a | 408.40 ± 79.93a | 289.60 ± 16.38b | 255.20 ± 93.68b | 369.30 ± 44.50a | 317.20 ± 28.88a | 383.20 ± 42.87a | |
| Number nodes/stem | Cropping season 1 | 125.50 ± 46.73* | 85.11 ± 12.67* | - | 132.90 ± 41.63ns | 131.20 ± 21.31ns | - | 140.20 ± 21.68ns | 144.40 ± 31.56ns | - |
| Cropping season 2 | 69.50 ± 12.26ns | - | 67.90 ± 8.94ns | 86.40 ± 45.47ns | - | 61.70 ± 30.55ns | 113.00 ± 6.47ns | - | 116.60 ± 21.16ns | |
| Cropping season 3 | 91.50 ± 3.72a | 91.00 ± 10.22a | 91.40 ± 3.44a | 118.40 ± 12.93a | 105.00 ± 3.94a | 115.00 ± 24.20a | 128.30 ± 16.53a | 122.20 ± 17.36a | 134.00 ± 11.40a | |
Note: MAP: Month after planting; Treatment I1: Model-based (automated model-based drip irrigation); Treatment I2: Farmer (farmer-practice irrigation); Treatment I3: Rainfed (rainfed control- no supplemental irrigation). All data show mean ± SD. Values with the different superscript small letters are significantly different at p ≤ 0.05 (ANOVA analysis). * indicate significant effect at 0.05 (Welch t-test analysis). ns: not significant.
Table 3.
Effects of irrigation regimes on fresh and dry matter production of leaf and stem cassava.
| Parameters | Cropping seasons | 5 MAP | 9 MAP | 11 MAP | ||||||
| I1 | I2 | I3 | I1 | I2 | I3 | I1 | I2 | I3 | ||
| Leaf fresh weight (kg plant-1) | Cropping season 1 | 1.20 ± 0.26ns | 1.10 ± 0.51ns | - | 0.25 ± 0.18ns | 0.54 ± 0.19ns | - | 0.14 ± 0.09ns | 0.31 ± 0.27ns | - |
| Cropping season 2 | 1.04 ± 0.29* | - | 0.74 ± 0.31* | 0.21 ± 0.12ns | - | 0.28 ± 0.21ns | 0.02 ± 0.01ns | - | 0.05 ± 0.03ns | |
| Cropping season 3 | 0.92 ± 0.21a | 1.12 ± 0.19a | 0.87 ± 0.20a | 0.87 ± 0.20a | 0.60 ± 0.16b | 0.82 ± 0.09ab | 0.09 ± 0.07a | 0.04 ± 0.01a | 0.10 ± 0.06a | |
| Leaf dry weight (kg plant-1) | Cropping season 1 | 0.31 ± 0.05ns | 0.31 ± 0.03ns | - | 0.11 ± 0.06ns | 0.23 ± 0.08ns | - | 0.03 ± 0.02ns | 0.07 ± 0.05ns | - |
| Cropping season 2 | 0.30 ± 0.09ns | - | 0.23 ± 0.10ns | 0.05 ± 0.02ns | - | 0.08 ± 0.06ns | 0.01 ± 0.00ns | - | 0.02 ± 0.01ns | |
| Cropping season 3 | 0.22 ± 0.05a | 0.27 ± 0.05a | 0.20 ± 0.05a | 0.26 ± 0.06a | 0.18 ± 0.05b | 0.23 ± 0.03ab | 0.09 ± 0.07a | 0.03 ± 0.02a | 0.10 ± 0.08a | |
| Stem fresh weight (kg plant-1) | Cropping season 1 | 2.56 ± 0.80ns | 1.90 ± 0.93ns | - | 3.83 ± 1.54ns | 4.07 ± 1.21ns | - | 4.70 ± 2.04ns | 4.10 ± 1.29ns | - |
| Cropping season 2 | 2.14 ± 0.59ns | - | 1.75 ± 0.45ns | 3.32 ± 0.56* | - | 2.41 ± 0.80* | 3.02 ± 0.61ns | - | 2.91 ± 0.78ns | |
| Cropping season 3 | 1.32 ± 0.30a | 1.43 ± 0.17a | 1.17 ± 0.34a | 3.26 ± 0.60a | 2.53 ± 0.30a | 2.81 ± 0.58a | 2.54 ± 0.68a | 1.88 ± 0.29a | 2.09 ± 0.32a | |
| Stem dry weight (kg plant-1) | Cropping season 1 | 0.86 ± 0.32ns | 0.64 ± 0.39ns | - | 1.65 ± 1.28ns | 1.88 ± 0.53ns | - | 1.78 ± 0.73ns | 1.65 ± 0.51ns | - |
| Cropping season 2 | 0.70 ± 0.33ns | - | 0.65 ± 0.19ns | 1.23 ± 0.36* | - | 0.86 ± 0.30* | 1.57 ± 0.32ns | - | 1.55 ± 0.44ns | |
| Cropping season 3 | 0.37 ± 0.10a | 0.42 ± 0.09a | 0.30 ± 0.13a | 1.50 ± 0.30a | 1.16 ± 0.27a | 1.31 ± 0.45a | 0.84 ± 0.27a | 0.64 ± 0.14a | 0.61 ± 0.14a | |
Note: MAP: Month after planting; Treatment I1: Model-based (automated model-based drip irrigation); Treatment I2: Farmer (farmer-practice irrigation); Treatment I3: Rainfed (rainfed control- no supplemental irrigation). All data show mean ± SD; Values with the different superscript small letters are significantly different at p ≤ 0.05 (ANOVA analysis); * indicate significant effect at 0.05 (Welch t-test analysis); ns: not significant.
Table 4.
Effects of irrigation regimes on yield components of cassava.
| Parameters | Cropping seasons | 5 MAP | 9 MAP | 11 MAP | ||||||
|---|---|---|---|---|---|---|---|---|---|---|
| I1 | I2 | I3 | I1 | I2 | I3 | I1 | I2 | I3 | ||
| Tuber Number/plant | Cropping season 1 | 14.50 ± 2.0ns | 14.6 ± 1.84ns | 13.40 ± 4.65ns | 13.84 ± 4.99ns | 13.8 ± 2.78ns | 12.9 ± 2.85ns | |||
| Cropping season 2 | 13.80 ± 3.06ns | 14.20 ± 5.10ns | 13.30 ± 1.79ns | 12.4 ± 3.92ns | 15.10 ± 5.15ns | 13.30 ± 2.57ns | ||||
| Cropping season 3 | 12.10 ± 1.85a | 10.80 ± 3.11a | 8.80 ± 3.03b | 12.70 ± 1.89a | 11.40 ± 2.70a | 12.20 ± 2.28a | 11.20 ± 2.90a | 12.60 ± 2.79a | 9.40 ± 1.67a | |
| Tuber length (cm) | Cropping season 1 | |||||||||
| Cropping season 2 | 27.80 ± 5.00ns | 27.80 ± 4.67ns | 31.88 ± 2.94ns | 27.68 ± 7.53ns | 38.37 ± 7.21* | 31.26 ± 6.12* | ||||
| Cropping season 3 | 28.50 ± 7.21a | 30.20 ± 1.92a | 32.16 ± 15.77a | 29.58 ± 3.83a | 25.50 ± 5.22a | 26.30 ± 5.72a | 34.10 ± 5.67a | 30.40 ± 7.09a | 28.80 ± 3.70a | |
| Tuber Diameter (cm) | Cropping season 1 | |||||||||
| Cropping season 2 | 3.34 ± 0.89ns | 3.51 ± 0.89ns | 5.20 ± 0.73ns | 4.83 ± 1.19ns | 5.54 ± 0.81ns | 5.56 ± 1.15ns | ||||
| Cropping season 3 | 3.90 ± 0.78a | 4.42 ± 0.78a | 2.90 ± 0.23b | 6.06 ± 0.46ab | 6.54 ± 0.46a | 5.50 ± 0.43b | 7.83 ± 1.33a | 5.00 ± 0.00a | 6.00 ± 1.63a | |
| Tuber fresh weight (kg plant-1) | Cropping season 1 | 2.12 ± 0.83* | 0.85 ± 0.31* | 2.27 ± 0.72ns | 1.77 ± 0.89ns | 2.85 ± 0.85* | 1.85 ± 1.10* | |||
| Cropping season 2 | 1.02 ± 0.58ns | 0.83 ± 0.47ns | 2.53 ± 0.72* | 1.50 ± 0.87* | 2.89 ± 0.54* | 2.08 ± 0.89* | ||||
| Cropping season 3 | 1.04 ± 0.29a | 1.09 ± 0.37a | 0.56 ± 0.23b | 2.72 ± 0.31a | 2.10 ± 0.74ab | 1.58 ± 0.48b | 2.96 ± 0.78a | 2.27 ± 0.56ab | 1.96 ± 0.73b | |
| Tuber dry weight (kg plant-1) | Cropping season 1 | 0.92 ± 0.48* | 0.34 ± 0.18* | 1.04 ± 0.38ns | 0.73 ± 0.43ns | 1.20 ± 0.38* | 0.81 ± 467.76* | |||
| Cropping season 2 | 0.38 ± 0.24ns | 0.34 ± 0.20ns | 1.08 ± 0.34* | 0.63 ± 0.37* | 1.13 ± 0.32* | 0.80 ± 0.39* | ||||
| Cropping season 3 | 0.39 ± 0.10a | 0.39 ± 0.14a | 0.24 ± 0.09a | 1.22 ± 0.15a | 0.88 ± 0.27b | 0.72 ± 0.23b | 1.38 ± 0.36a | 1.07 ± 0.28ab | 0.89 ± 0.38b | |
Note: MAP: Month after planting. Treatment I1: Model-based (automated model-based drip irrigation); Treatment I2: Farmer (farmer-practice irrigation); Treatment I3: Rainfed (rainfed control- no supplemental irrigation). All data show mean ± SD; Values with the different superscript small letters are significantly different at p ≤ 0.05 (ANOVA analysis); * indicate significant effect at 0.05 (Welch t-test analysis). ns: not significant.
Disclaimer/Publisher’s Note: The statements, opinions and data contained in all publications are solely those of the individual author(s) and contributor(s) and not of MDPI and/or the editor(s). MDPI and/or the editor(s) disclaim responsibility for any injury to people or property resulting from any ideas, methods, instructions or products referred to in the content. |
© 2026 by the authors. Licensee MDPI, Basel, Switzerland. This article is an open access article distributed under the terms and conditions of the Creative Commons Attribution (CC BY) license.
Copyright: This open access article is published under a Creative Commons CC BY 4.0 license, which permit the free download, distribution, and reuse, provided that the author and preprint are cited in any reuse.


