

Submitted:
26 June 2026
Posted:
29 June 2026
You are already at the latest version
Abstract
Herein we report the synthesis and full characterisation of Ru(II)-based homobimetallic complexes bridged by diphosphines of the type [(p-cym)RuCl2]2(µ-dppx), where p-cym = η6-1-isopropyl-4-methylbenzene, dppx = dppe (1,2-bis(diphenylphosphino)ethane, 1), tdppe (trans-1,2-bis(diphenylphosphino)ethylene, 2), dppa (bis(diphenylphosphino)acetylene, 3), dcpe (1,2-bis(dicyclohexylphosphino)ethane, 4), and 1,4dppb (1,4-bis(diphenylphosphino)benzene, 5). We also report the mononuclear complexes [(p-cym)RuCl2(κ1-dppx)], where dppx = dppe (6) and tdppe (7). Complexes 2, 4, 5, 6 and 7 were further characterised via single crystal X-ray diffraction analysis. The bi-metallic complexes were synthesised in a straightforward fashion and isolated in good to excellent yields. The mononuclear complexes 6 and 7 are stable in air but exhibit reactions in solution, hindering their use as precursors for the synthesis of bimetallic complexes. The in vitro cytotoxic (anticancer) activities of complexes 1 – 5 were determined via cell vi-ability studies and their IC50 values were derived on HeLa and Ect1/E6E7 cell lines. All complexes displayed only low to moderate activity and selectivity. Strikingly, the cytotoxic profiles of the different complexes varied substantially, highlighting the importance of the bridging ligand itself in the cytotoxic behaviour of the complexes further demonstrating the importance of ligand design in bimetallic complexes.
Keywords:
diphosphine
; bridging ligands
; bimetallic
; cancer
; ruthenium
; cytotoxicity
1. Introduction
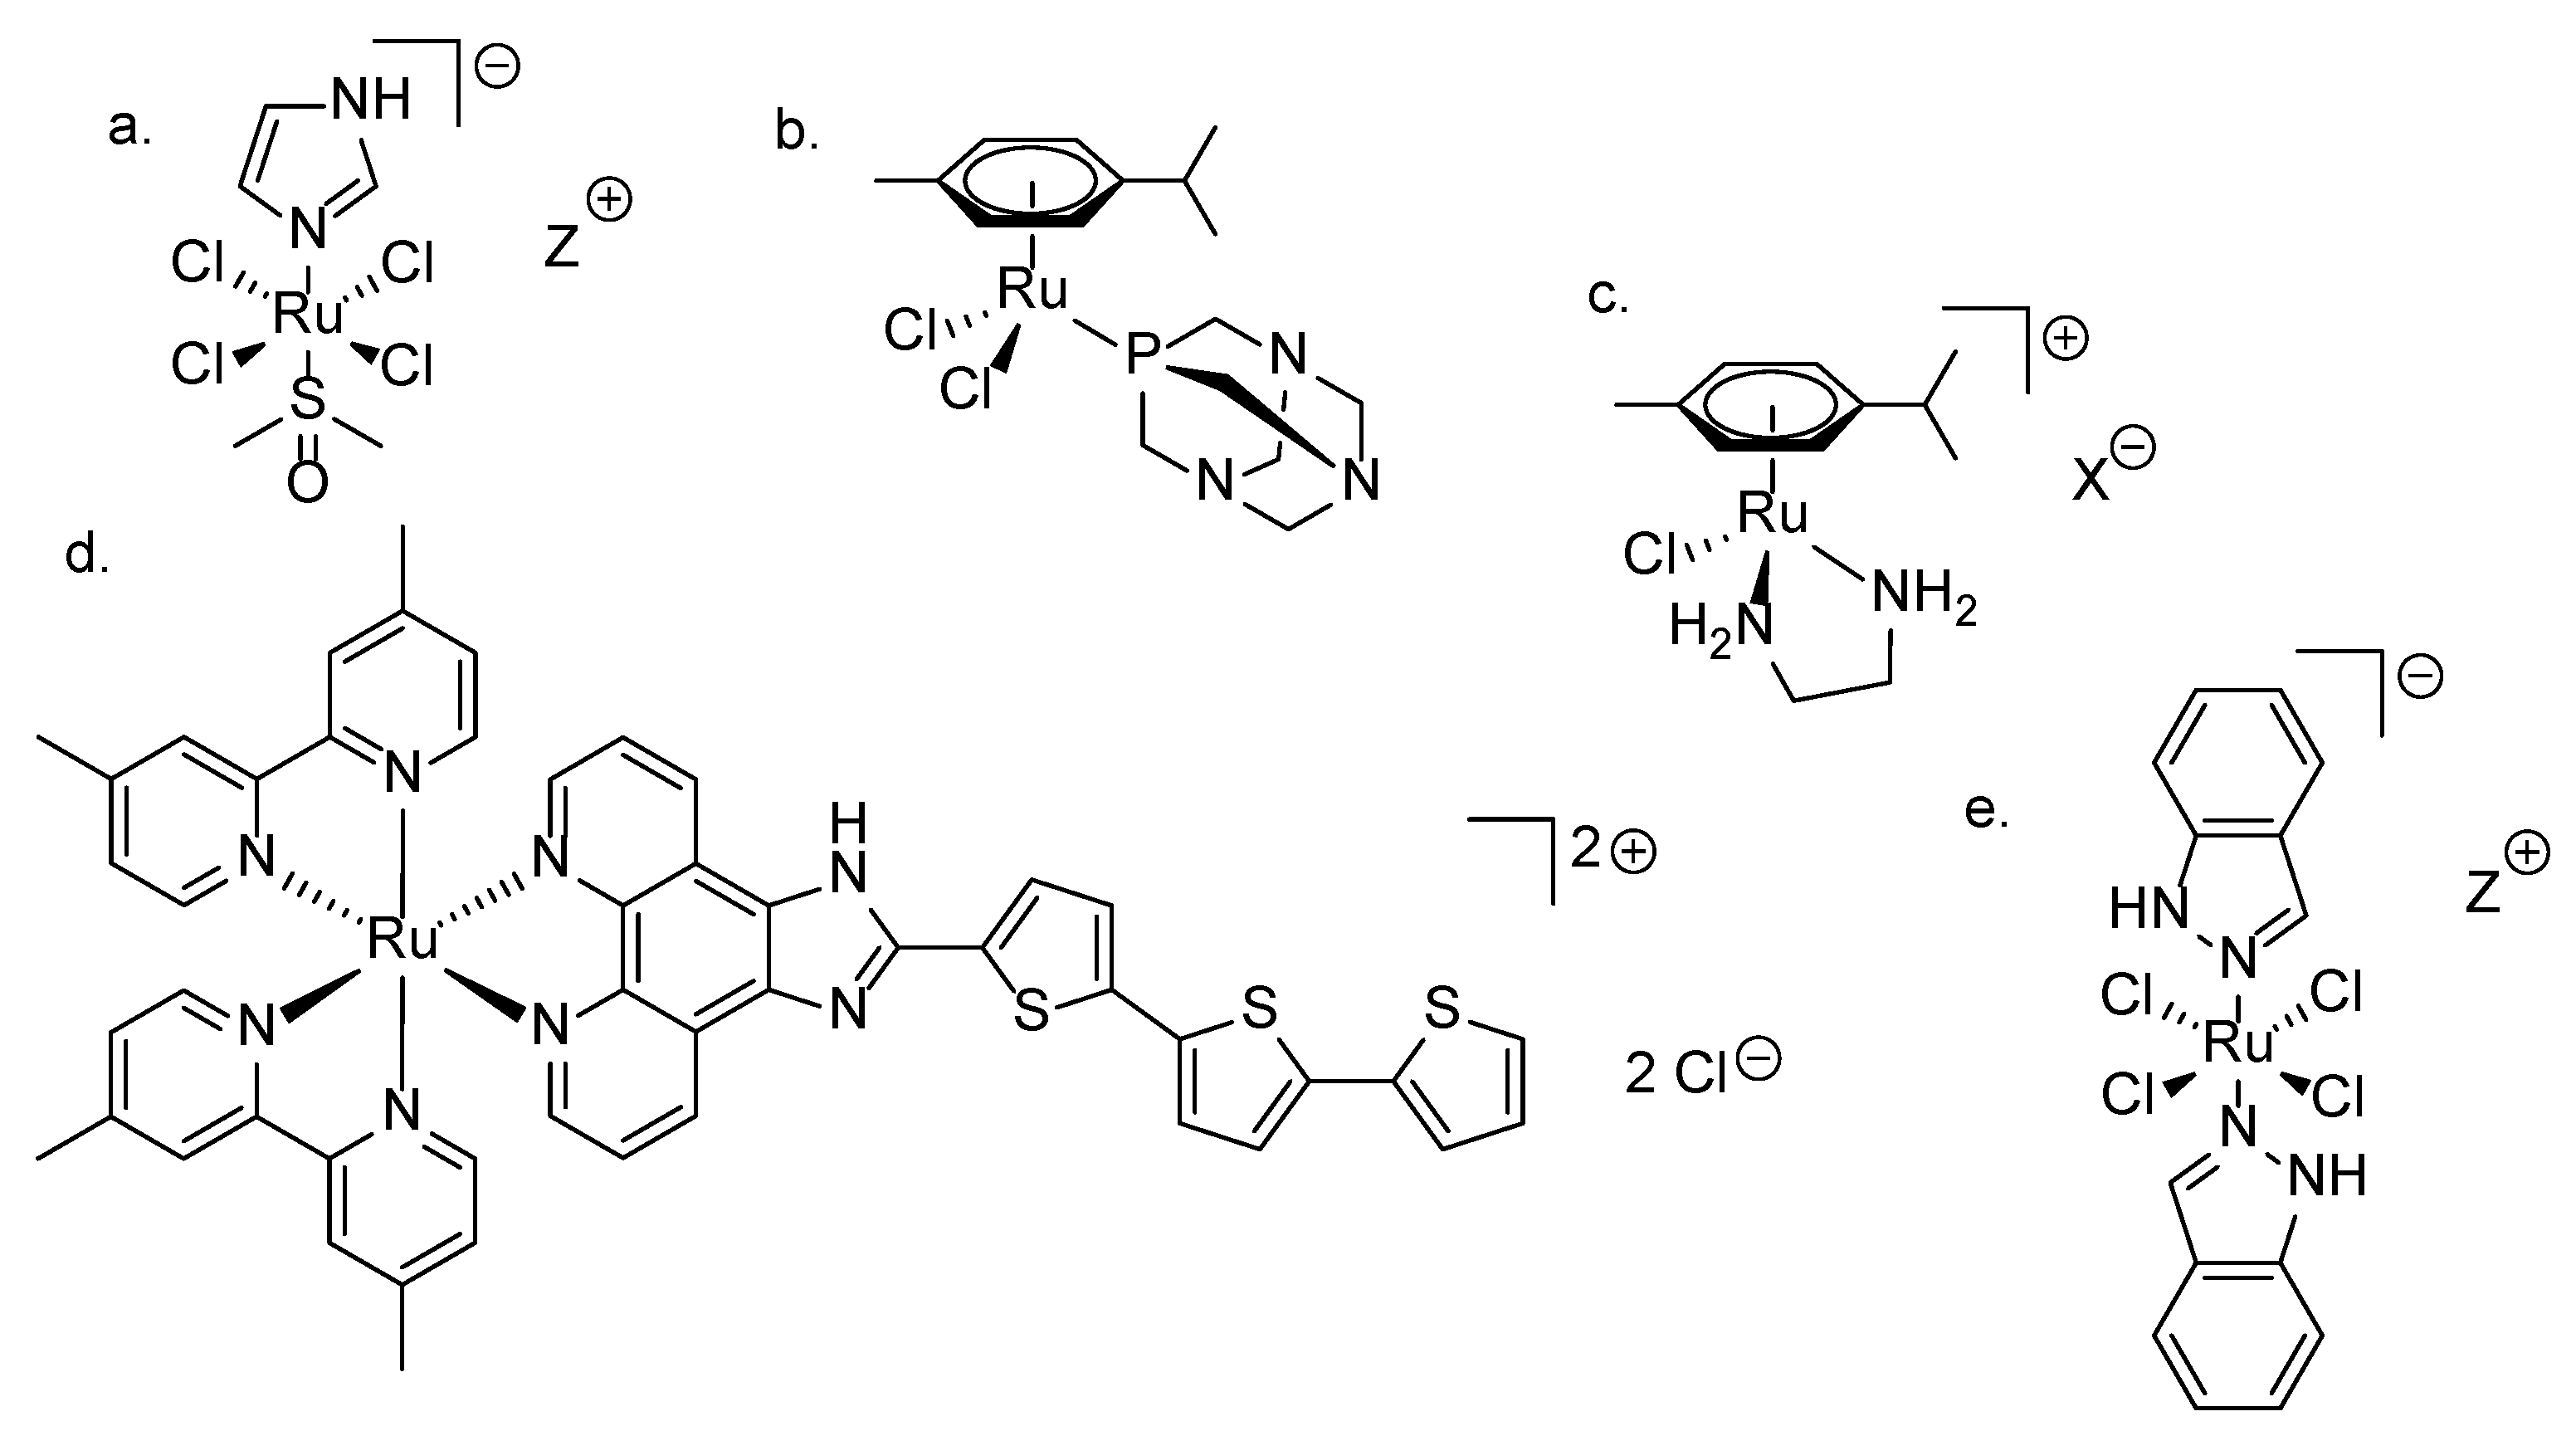
Since the discovery of the anticancer properties of NAMI by Sava et al. in 1992 (Scheme 1a) [1,2], a number of Ru-based complexes have been investigated for their anticancer properties. Some in-depth reviews highlight the predominance of Ru-based complexes as potential alternatives to the Pt-based drugs currently in use [3,4,5,6,7], and some of those Ru-based complexes have undergone (pre)clinical trials (Scheme 1b-e) [8,9,10,11,12,13,14].
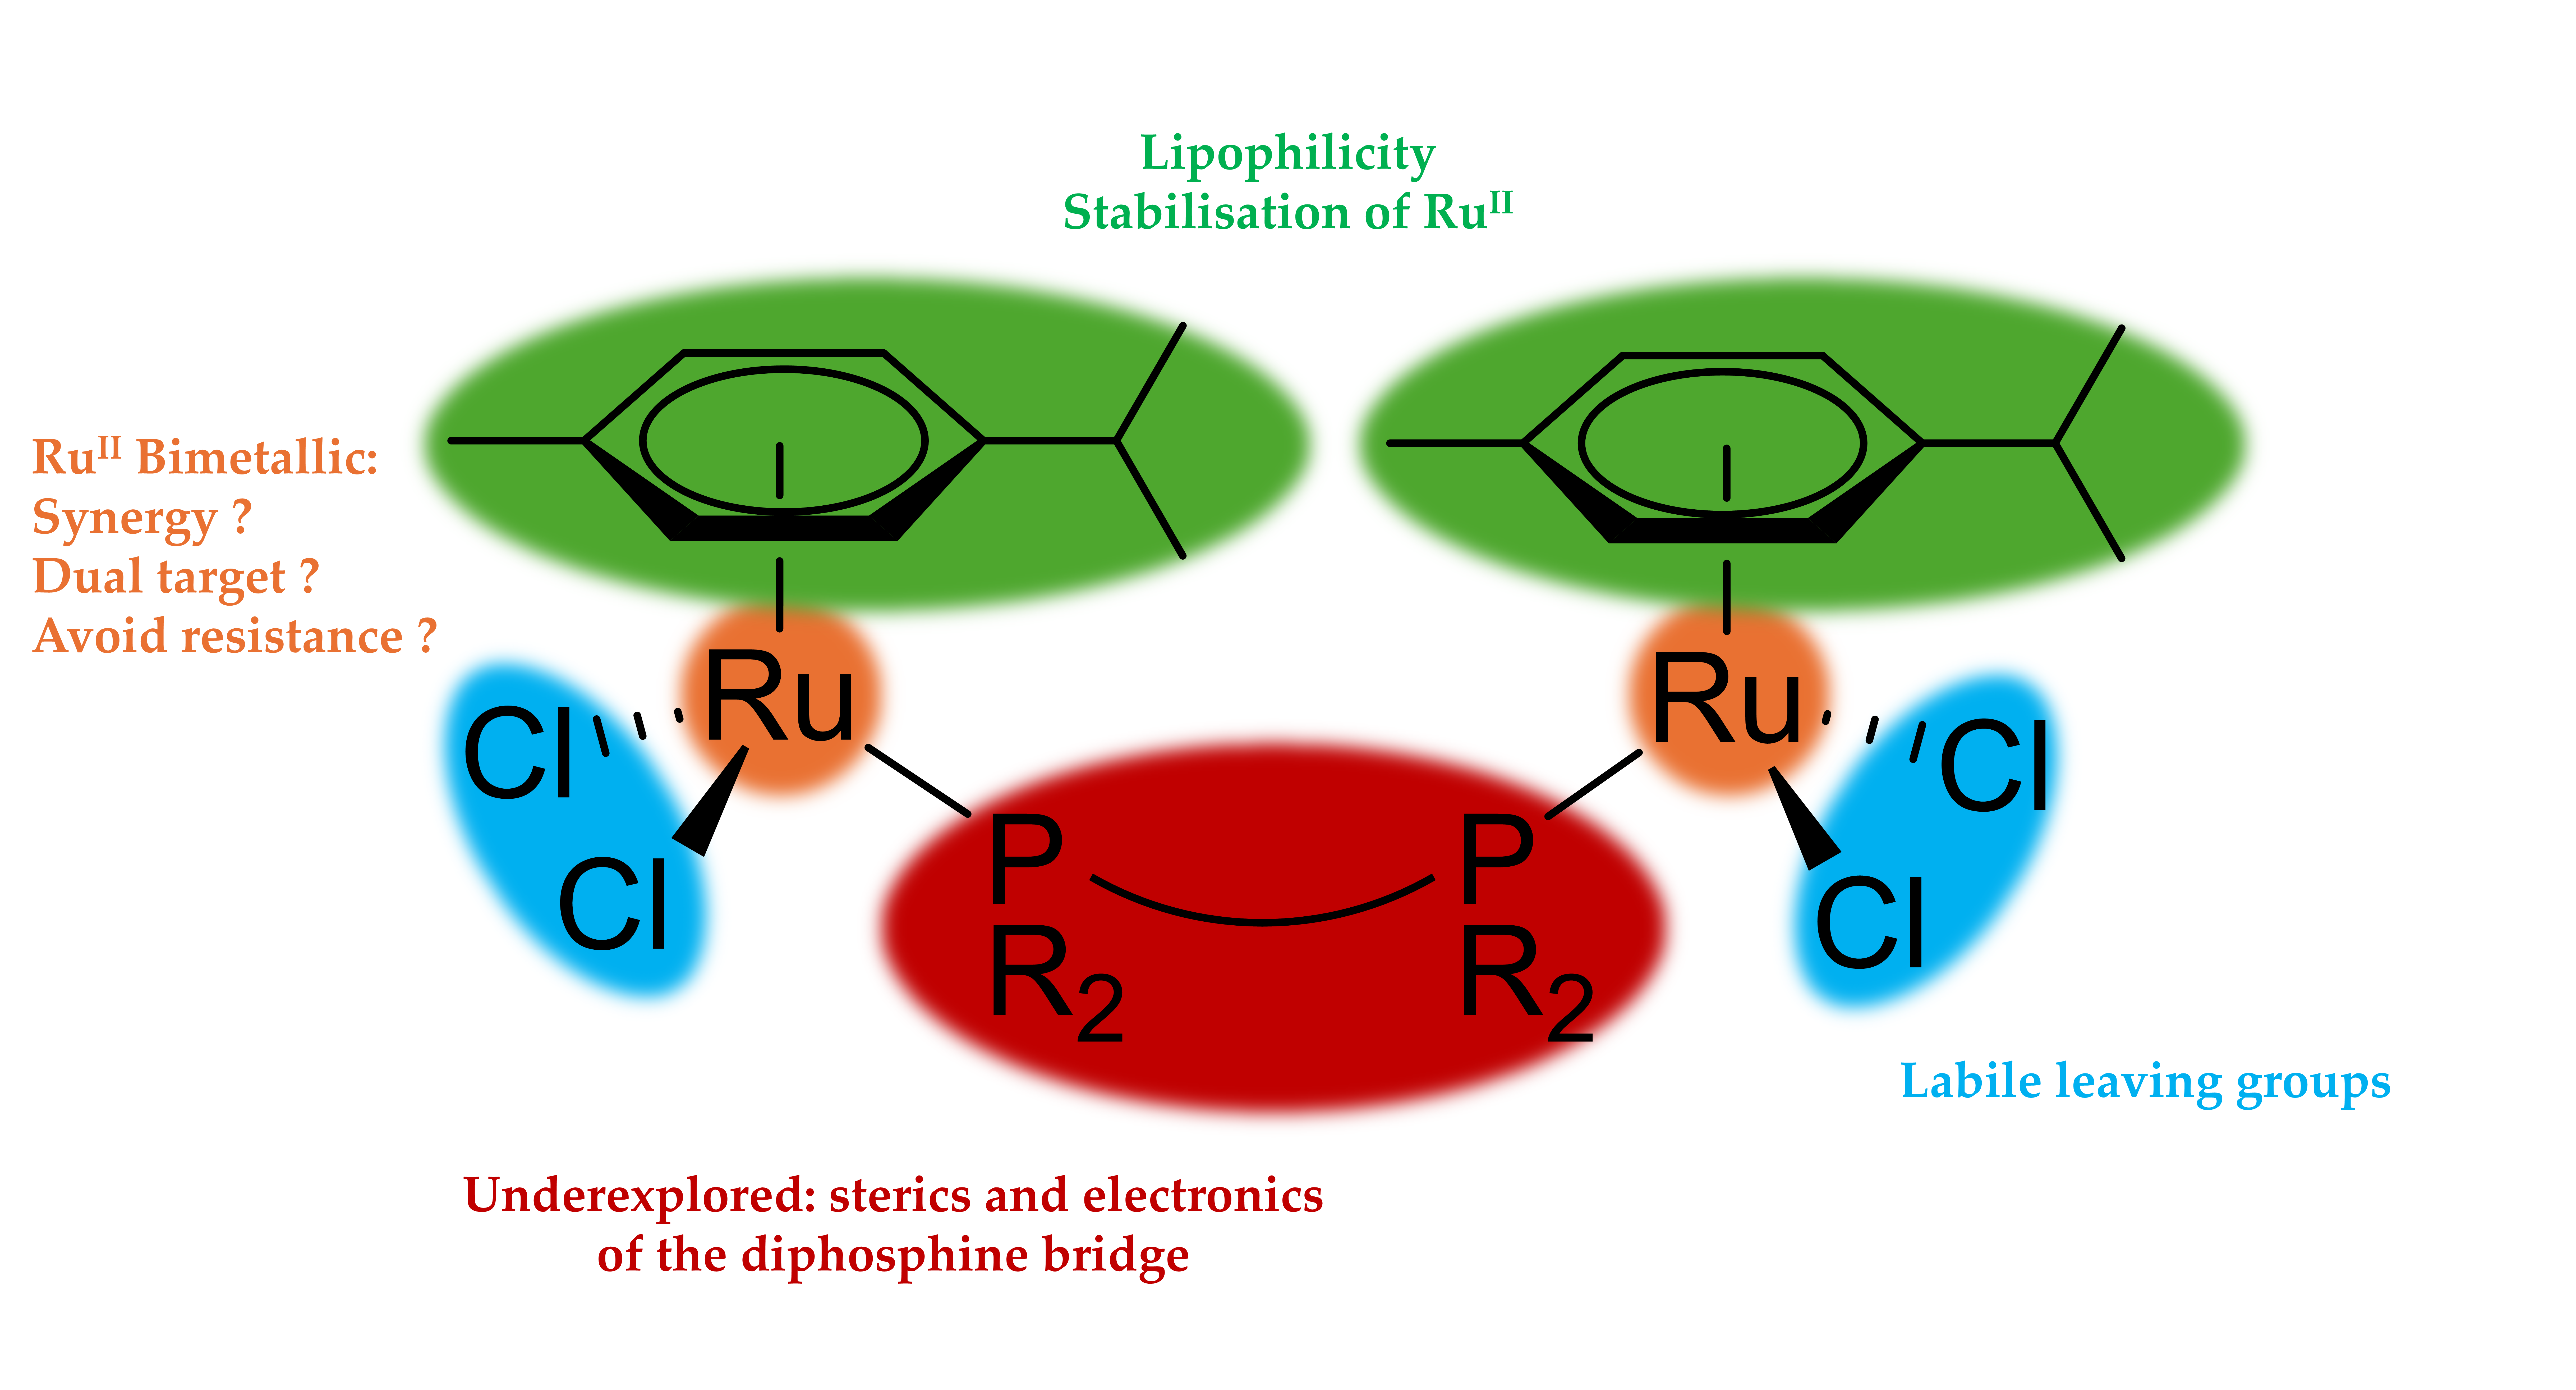
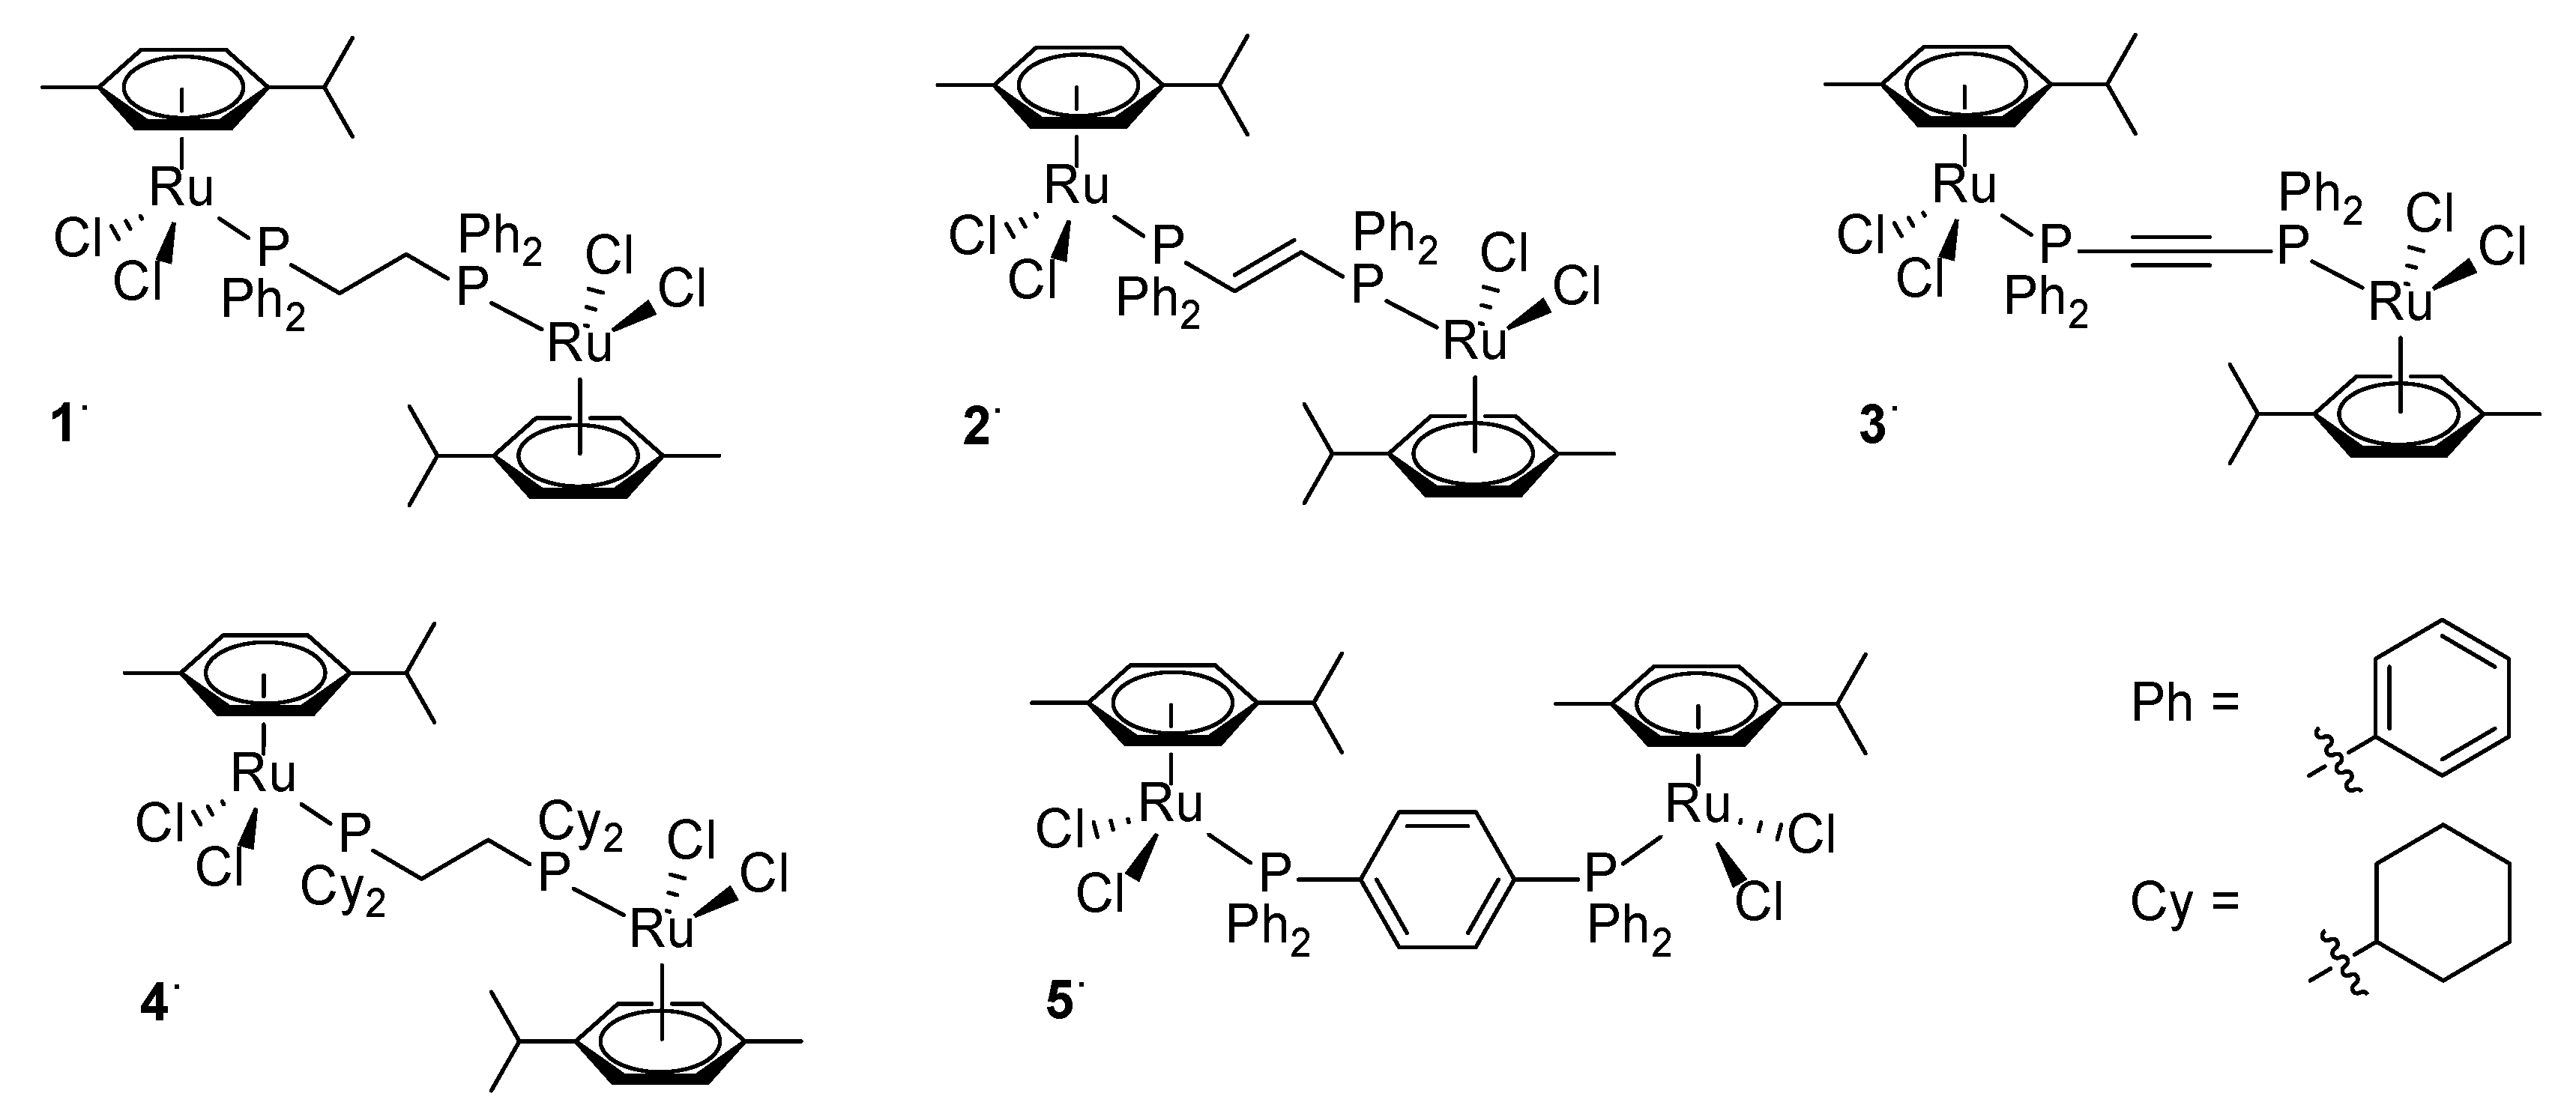
More recently, bimetallic candidates have been studied, with the rationale that the presence of two metal centres within a well-defined complex could enhance anticancer activity, by inter alia synergistic effects. A versatile synthetic strategy for such bimetallic molecular designs consists in using a µ-diphosphine bridging ligand, where each P atom can ligate to a different metal centre in k1 fashion, enabling facile access to a range of bimetallic complexes. We have recently reviewed all bimetallic complexes containing a group 8 metal (Fe, Ru, Os) and a bridging diphosphine ligand in the context of anticancer research, highlighting the relevance of these systems in the pursuit of the next generation of anticancer agents [15]. Within this scope, we noticed that several structural variations have been carefully studied regarding the ligand spheres around the metal atoms, however, few studies have highlighted the effects of the bridging ligands themselves on the biological (anticancer) activity of the complexes. In fact, only two reports studied complexes of the type [(p-cym)RuCl2]2(µ-dppx), where dppx is a µ-diphosphine bridging ligand in the context of anticancer studies [16,17] to date. In an attempt to delineate the effects the µ-bridging diphosphine ligand itself could have on cytotoxic profiles of complexes of this type, we hereby present a series of homodinuclear Ru(II)-based complexes of the general formula [(p-cym)RuCl2]2(µ-dppx), where the only structural differences lie within the µ-bridging diphosphine ligand (Scheme 2). These serve as model complexes to show the dramatic differences in the in vitro anticancer biological activity, which can solely be attributed to the nature of the ligand present.
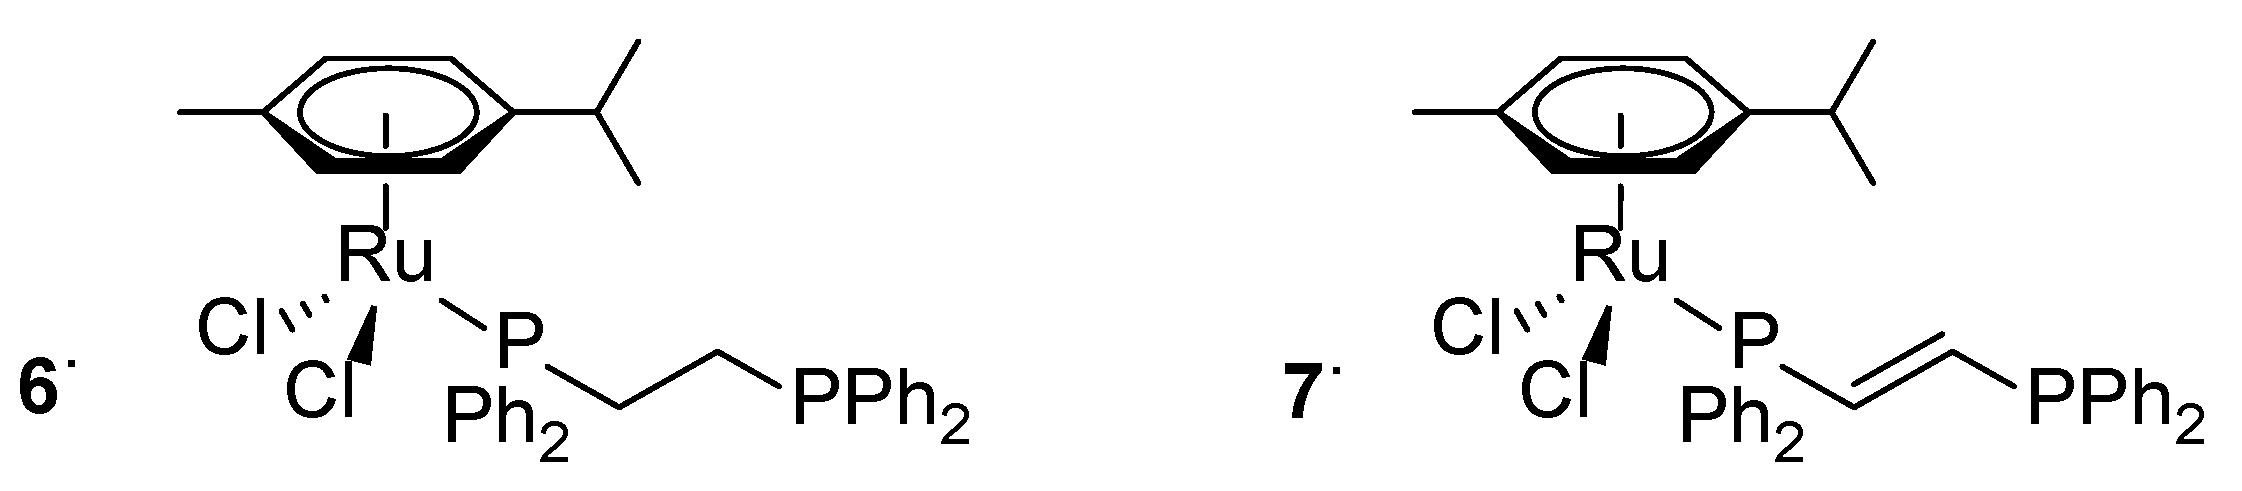
The synthesis of monometallic precursors has also been investigated, and the complexes [(p-cym)RuCl2(κ1-dppx)] (dppx = dppe (6) and tdppe (7)) are reported (Scheme 3) herein. These complexes undergo further reactions in solution, and hence their use as precursors towards heterobimetallic systems is impractical. Mechanistic studies of similar complexes have been described by Chaplin et al., where the Z-isomer of complex 7 is described and characterised [18,19]. Nevertheless, complexes 6 and 7 represent novel entities and were fully characterised, and their solid-state crystal structures are reported for the sake of completeness.
Scheme 3.
Schematic representation of the monometallic complexes 6 and 7 studied herein.
All complexes were fully characterised via (multinuclear) NMR, FT-IR and UV-Vis spectroscopy, as well as high resolution mass spectrometry (HRMS). The solid-state crystal structures of complexes 2, 4, 5, 6 and 7 were determined via means of single crystal X-ray diffraction analysis. Finally, in vitro anticancer cytotoxic studies were performed through multidose treatment of malignant cell line HeLa, and healthy cell line Ect1/E6E7 with complexes 1 – 5.
2. Results and Discussion
2.1. Synthesis and Spectroscopic Characterisation of the Bimetallic Complexes 1 - 5
The homobimetallic complexes were synthesised in a straightforward fashion, stirring equimolar amounts of [(p-cym)RuCl2]2 and the respective diphosphine in CH2Cl2 for 2 h at room temperature. Each P atom binds to a Ru(II) centre, thereby inducing dimer cleavage to form the homodinuclear complexes (Scheme 4). The products were obtained as orange/red powders in good to excellent yields ranging from 70 % to 90 %.
The FT-IR spectra of all complexes are, as expected, very similar, with the major difference being the much more pronounced C-H stretching vibrations in complex 4 between 2830 and 3040 cm-1 (Fig. S32-S36). Regarding UV-Vis, all spectra exhibit a strong absorption at around 225 nm, which is assigned to a π-π* LLCT transition. Complexes 1 and 5 exhibit a clearly defined absorption at 255 and 251 nm, respectively, whereas complex 2 exhibits an absorption in the form of a shoulder at 249 nm, which is absent in complexes 3 and 4. Seeing as the diphosphine bridging ligand is the only structural difference between the complexes, this electronic transition might be assigned to a diphosphine-centred LLCT, or a LMCT transition between the bridging ligand and the Ru centre. The minor absorption maxima, observed in all complexes presented the most wavelength shift (Table 1). These electronic transitions are tentatively assigned to MLCT transitions, more specifically electronic transitions between the Ru(II) centred molecular orbital (HOMO), and ligand-centred orbitals (LUMO) (Fig. S39-S48).
The 1H NMR spectra of all complexes, except for 4, display aromatic multiplets in the region d = 8 – 7 ppm, corresponding to the aromatic Ph substituents on both P atoms, integrating to 20 H. Complex 4, in contrast, exhibits cyclohexyl signals in the aliphatic region, integrating to the expected total of 44 H. Complex 1 has the bridging ethylene protons displayed as a doublet signal at d = 2.43 ppm integrating to 4 H, while complex 2 has the olefinic protons displayed as a triplet signal at d = 6.93 ppm due to coupling to both equivalent P atoms. The geminal H atoms do not couple to one another as they are magnetically equivalent. The aromatic protons on the η6-p-cymene moiety are observed as a pair of doublets in the region from δ = 5.5 – 5 ppm, integrating to 8 H in all cases, with the roofing effect observed. Finally, the expected septet, singlet and doublet resonance signals arising from the p-cymene substituents are observed in the aliphatic region and integrate to the expected values in all cases (Fig. S1-S5). The 31P{1H} NMR spectra further support the bimetallic nature of these complexes, as only one singlet resonance signal is observed in all cases, shifted downfield compared to the respective naked diphosphines due to the deshielding effect of Ru (Fig. S15-S19). The 13C{1H} NMR spectra display the expected signals, with the aromatic signals corresponding to the phenyl rings on P from δ = 140 – 130 ppm for 2 and 5, followed by four signals corresponding to the four C environments within the p-cymene aromatic ring. In all cases the signals corresponding to the aliphatic substituent on p-cymene were assigned unambiguously through two dimensional 1H-13C HSQC NMR spectroscopy. Complex 2 has the olefinic C downfield at 140 ppm, while complex 5 has the bridging aromatic C of the 1,4-dppb ligand at 136 and 133 ppm, within the phenyl region (Fig. S8-S12). Furthermore, high resolution mass spectrometry was performed and all molecular peaks were observed either as the Na adduct [M+Na]+ or the [M-Cl]+ fragment. The mass spectra and theoretical isotope patterns comparisons can be found in the supporting information (Fig. S49-S53).
2.2. Synthesis and Spectroscopic Characterisation of the Monometallic Complexes 6 and 7
Our initial starting point to access the dinuclear complexes was to first prepare and isolate the mononuclear complexes [(p-cym)RuCl2(κ1-dppx)] (dppx = dppe (6) or tdppe (7)) as building blocks for subsequent reactions to prepare the target dinuclear complexes. As it turns out, and as was observed by Chaplin et al.[18,19], complexes bearing κ1-diphosphines, tend to undergo further reactions in solution, thereby hindering their use as precursors. Nevertheless, we managed to isolate complexes 6 and 7 in pure form, albeit at very low yields, and we decided to include the synthesis and characterisation of these two monometallic complexes herein. Complex 6 was synthesised using a 1:2 ratio [(p-cym)RuCl2]2 : dppe in CH2Cl2 at -78 °C. A low temperature was utilised in order to minimise the dppe ligand to form a more stable bidentate salt complex with Cl as a counteranion, due to the flexibility of the ligand backbone, for which it is prone. After purification via column chromatography on silica gel, a yield of 10 % was obtained. Complex 7 was synthesised in a similar fashion, however room temperature was used due to the more rigid ligand backbone of tdppe, preventing κ2-product formation. The yield of this reaction was however even lower with 4 % desired product obtained. Similar to the bimetallic complexes discussed above, the 1H NMR spectra of complexes 6 and 7 display multiplet signals in the aromatic region integrating to 20 H, attributed to the Ph rings on both P atoms, as well as the pair of doublets from the p-cymene aromatic protons integrating to 4 H. In addition, the septet, singlet and doublet signals integrating to 1, 3 and 6 H, respectively, corresponding to the p-cymene methyl and isopropyl groups are observed in the aliphatic region. The main difference stems from the chemically inequivalent H within the bridging ligand. In complex 6, these are displayed as multiplets, due to each H atom coupling to both inequivalent P atoms, as well as the neighbouring H atoms, each signal integrating to 2 H in the aliphatic region. Complex 7 has the bridging olefinic H signals in the range 6.9 – 6.3 ppm region, displayed as two multiplets integrating to 1 H each (Fig. S6-S7). Both 31P{1H} spectra display two sets of doublets with equivalent coupling constants, as expected. The downfield doublet is attributed to the P atom coordinated to Ru, as it has a deshielding effect. The upfield signal corresponds to the pendant phosphine, which matches the typical chemical shift of free phosphines (Fig. S20-S21). The 13C{1H} NMR spectra resemble closely those of the bimetallic complexes discussed prior. The main difference being that each C atom within the diphosphine has a distinct signal, which is observed as a (pseudo) doublet of doublet, due to coupling to both chemically inequivalent P atoms. These bridging ligand signals in 7 were assigned through 1H-13C HSQC spectroscopy, as the corresponding signals were low intensity and within the aromatic signals of the Ph groups (Fig. S13-S14, S29 and S31). The [M - Cl]+ fragment with the expected isotope pattern was observed in both cases in the mass spectra (Fig. S54-S55).
2.3. X-Ray Diffraction Analyses
The solid-state crystal structures of complexes 2, 4 and 5 (Figure 1), as well as monomer complexes 6 and 7 (Figure 2) were determined via means of single crystal X-ray diffraction analyses (See Table 2 for selected metrical parameters, bond lengths and angles. See SI for complete data). Common to all complexes is the characteristic piano-stool configuration at Ru, where three binding sites are occupied by the η6-p-cymene moiety, whereas the remaining binding sites are occupied by two chlorides and a P atom from the bridging diphosphine. Complex 2 crystallised in the triclinic crystal system with the P-1 space group. A centre of inversion is observed between the two C atoms within the bridging tdppe. Two similar entities of 4 crystallised in the asymmetric unit, with the P21/c space group of the monoclinic crystal system. Each of the two independent entities also has a centre of inversion in between the two C atoms of the bridging diphosphine. Complex 5 does not have a centre of inversion and crystallised in the triclinic crystal system and P-1 space group. Interestingly, the Ru atoms in 5 are syn to one another and lie within the C6H4 plane of 14dppb, with a dihedral angle of 10.60° between the Ru2-P2-C26 and Ru1-P1-C23 planes (Fig. S48). In the case of the similar complex [(p-cym)RuCl2Ph2PCH2(p-C6H4)CH2Ph2P·BH3] reported by McQuade et al., which has extra methylene groups between p-C6H4 and P, the two P atoms are also syn to one another, and display a dihedral angle between the CC6H4-Cmethylene-P planes of 4.5°. However those planes are perpendicular to the C6H4 ring, which contrasts to complex 5, for which the Ru-P-C planes are coplanar with the C6H4 ring [20].
The average bond length between Ru and the six C of the η6-p-cymene unit is of 2.219 Å (2), 2.224 Å (4) and 2.220 Å (5), whereas the average Ru-Cl bond lengths are 2.410 (2), 2.419 (4) and 2.412 (5). The average Ru-P bond length is 2.340 (2), 2.395 (4) and 2.360 (5). The nature of the diphosphine bridge seems therefore to only influence the Ru-P bond length, which was expected, while having minimal effect on the other ligands bound to Ru.
Monometallic complex 6 crystallised in the monoclinic crystal system with a P21/n space group, while complex 7 crystallised in the monoclinic crystal system with P21/c space group. The geometry around Ru displays highly similar features as complexes 2, 4 and 5, with the characteristic piano-stool conformation. The main difference stems from the pendant P atom at the other end of the diphosphine, which shows the ability for this intermediate complex to bind another metal through the lone pair available on the pendant P. The borane-protected analogue 6·BH3 has been previously characterised by single crystal X-ray diffraction analysis [19], and present strikingly similar features as 6.
2.3. In Vitro Cell Viability in HeLa and Ect1/E6E7
The in vitro cytotoxic effects in HeLa and Ect1/E6E7 cells were investigated in the range of 0 - 80 µM for each of the five complexes and compared against cisplatin as positive control (Figure S56-S59). From this data, complex 3 and 5 showed the lowest cell survival at 32 µM concentration, while complex 4 required a higher concentration (80 µM) to produce the same effect.
Moreover, Ect1/E6E7 cells were included as non-malignant control cells due to their similarity to normal ectocervical tissue. Our aim was to identify the drug that has a higher specificity for cancer cells (HeLa) and less effect in the control cells (Ect1/Ect6) (Figure 3). Primarily we were concerned with studying the effect of changing the nature of the bridging ligand on the cytotoxicity of the different complexes.
IC50 values were calculated and are tabulated in Table 3. Complexes 3 and 5 displayed the most encouraging results against HeLa, with higher activity than cisplatin. On the other hand, these complexes also exhibit high cytotoxic activity against the Ect1/E6E7 healthy cell line, which is not desirable. Interestingly, complex 4, while exhibiting a two-fold lower activity against HeLa cells, displayed a much lower cytotoxic profile in Ect1/E6E7 cells compared to cisplatin.
In addition, a higher cell survival was observed in both cell lines after incubation with the five complexes at low concentration. This can be explained through the biphasic (hormetic) dose response effect, where low-dose stimulates and high-dose inhibits cell survival [21,22]. Furthermore, hormesis is reported as a cellular response to “drug stressors”, where at low concentration it can trigger transcription of proteins involved in cell proliferation, survival and adaptive oxidative response pathways such as MAPK/ERK1/2 and PI3K/AKT [23,24,25,26]. Nevertheless, the IC50 values of these diruthenium complexes are suboptimal. The disparities in their values, however, clearly indicate a significant structure-activity relationship, solely based on the changing µ-diphosphine ligand. Complex 1, as described by Das et al., was reported to have a suboptimal IC50 value of 61.3 µM against lung cancer H460 cell line [16]. The diruthenium complex [(η6-C6H6)RuCl2]2(µ-bis(diphenylphosphino)methane) was also reported to have a lower activity than cisplatin on ovarian cancer cell line A2780, even though it displayed slightly higher activity on cisplatin-resistant A2780cisR cell line [27]. The only complexes of the type [(p-cym)RuCl2]2(µ-dppx) that exhibited promising anticancer activities were reported by Klaimanee et al. Indeed, they exhibited much higher cytotoxic activity than cisplatin in the breast cancer cell lines MCF-7, HCC1937 and MDA-MB-231 [17]. These previously reported findings, in addition to the ones we report herein, highlight the great effect that the bridging diphosphine ligand itself has on the cytotoxic profile of the complexes.
To further investigate the potential mechanism of action of the complexes, HeLa cells were treated with complex 3 and then stained with Calcein AM (stains live cells), BOBO-3 iodide (stains dead cells) and CELLRox (stains Reactive Oxygen Species (ROS)) and visualised by fluorescence microscopy. For this experiment we selected complex 3 due to its apparent low-dose stimulating effect on cell viability of HeLa cells at concentrations lower than 8 µM and high-dose inhibition at concentrations above it. At concentrations above 8 µM, the number of dead cells does not rise substantially, but there is a decrease in live cells and an increase of ROS within the cells (Figure 4). Noteworthy, there is also ROS when the cells are exposed to only DMSO (0 µM: 5 % DMSO in 95 % cell medium) and their cell viability is slightly lower (~98 %) compared to the cells exposed to complex 3 (at 8 µM, cell viability ~110 %). This is consistent with predictions that ROS are produced in cells treated with complex 3 and may be responsible for inducing cellular stress. The observed higher cell count between 1-8 μM treatment compared to that of the control (0 µM) may be indicative of the hormetic effect. This is supported by data from the cell viability assays that at this concentration HeLa cells exhibit a hormetic response to the complexes. Based on the apparent cell shrinking morphology and high levels of ROS within the cells (Figure 4), it is tempting to speculate that complex 3 is inducing cytotoxicity by apoptosis [28]. Moreover, above 8 µM cisplatin treatment, HeLa cells exhibit an increased size morphology, reminiscent of cellular senescence rather than apoptosis and no hormetic effect was observed. Senescent cells cannot divide but are metabolically active and may be involved in accelerating tumorigenesis. Indeed, senescent cells secrete biomolecules that can modulate the tumour microenvironment, known as the senescence-associated secretory phenotype (SASP), giving rise to chemoresistant cancer cells [29]. In addition, chronic cellular senescence induced by low dose cisplatin has also been reported to induce renal fibrosis and nephrotoxicity in kidney tubules [30,31]. Therefore, we demonstrated that Ruthenium complex 3 contributes to cellular apoptosis and has the advantage of not inducing cellular senescence, a known shortcoming of cisplatin [31,32,33,34,35].
3. Conclusions
The synthesis and spectroscopic characterisation of five bimetallic complexes of the type [(p-cym)RuCl2]2(µ-dppx) have been reported, in addition to two novel monometallic analogous complexes . Five of those complexes were further characterised via single crystal X-ray diffraction analyses. The in vitro cytotoxic (anticancer) activity of all bimetallic complexes was tested against cervical cancer cell line HeLa, as well as healthy cell line Ect1/E6E7 to determine the potential change in activity and selectivity would be observed from modifying solely the bridging ligand structure of the complexes. Even though the complexes did not display encouraging anticancer activities or selectivities, fluctuations in IC50 values demonstrate that the bridging ligand itself plays a crucial role in the overall anticancer activity of these bimetallic complexes. These findings highlight the importance of careful ligand design for µ-bridging ligands in these and other bi- and multimetallic complexes.
4. Experimental Section
4.1. General Considerations
Standard Schlenk techniques were used unless otherwise stated. The chemicals: dichloromethane (99.8 %, extra dry over molecular sieves, Thermo Fisher), diethyl ether (99.5 %, extra dry over molecular sieves, stab BHT, Thermo Fisher), acetonitrile (LC-MS grade, Biosolve), ethyl acetate (AR grade, Biosolve), n-hexane (97 %, extra dry over molecular sieves, Acros), pentane (98 %, Aldrich), CDCl3 (99.8 % D + 0.03 % TMS v/v, VWR), [(p-cym)RuCl2]2 (Aldrich), 1,2-bis(diphenylphosphino)ethane (99 %, Aldrich), trans-1,2-bis(diphenylphosphino)ethylene (97 %, Aldrich), bis(diphenylphosphino)acetylene (97 %, Strem), 1,2-bis(dicyclohexylphosphino)ethane (98 %, Fisher), 1,4-bis(diphenylphosphino)benzene (98 %, BLD pharm), were used as received without further purification. The solvents used for synthetic procedures were degassed through N2(g) bubbling prior to use. NMR spectra were recorded on a JEOL JNM-ECZ400s FT NMR spectrometer. Raw NMR data was processed using Mnova version 14.3.0. The data is reported in ppm (parts per million) and referenced to TMS (1H and 13C) or phosphoric acid (31P). UV-Vis spectra were recorded on a Shimadzu UV-3600 iPlus-1 spectrometer, using 1 cm path length quartz cuvettes. FT-IR data was acquired on a Shimadzu IRSpirit FTIR spectrometer at 32 scans, 2 cm-1 resolution, Happ-Genzel apodization with a scan range of 4000 – 400 cm-1. FT-IR and UV-Vis data was processed using OriginPro 2018 SR1 b9.5.1.195. Abbreviations (NMR): s = singlet, d = doublet, t = triplet, sept = septet, m = multiplet, ps = pseudo, br = broad. Abbreviations (FT-IR): s = strong, m = medium, w = weak. Single crystal X-ray diffraction analysis was performed on a Rigaku XtaLAB Synergy, Dualflex, HyPix-Arc 100 diffractometer using Cu radiation (λ = 1.54184 Å). CrysAlisPro Software System (v1.171.43.92a, Rigaku Oxford Diffraction, 2026) was used to reduce data to Fo2 and corrected for absorption effects. Structures were solved using SHELXT [36] and refined with SHELXL [37] as implemented in OLEX2 [38].
4.2. General Procedure for the Synthesis of the Novel Homobimetallic Complexes [(p-cym)RuCl2](µ-diphosphine)
Complexes 1 - 5 were synthesised in an analogous manner. [(p-cym)RuCl2]2 and the respective diphosphine were dissolved in equimolar amounts in CH2Cl2 and stirred for 2 h at room temperature. The solvents were then evaporated in vacuo, and the resulting powder was washed with Et2O (5 x 5 mL). The product was subsequently dried in vacuo overnight. Characterisation of the known complexes 1 and 3 is included in the supporting information. The procedure used herein gives higher yields than previously reported methodologies for the synthesis of those known compounds [16,19,39,40,41,42].
4.2.1. Characterisation of [(p-cym)RuCl2]2(µ-tdppe) (2)
300 mg of [(p-cym)RuCl2]2 (0.490 mmol) and 194 mg of tdppe (0.490 mmol) used. 410 mg (0.406 mmol, 83 %) of dark red solid obtained, air stable. Crystals suitable for X-ray diffraction analysis were grown via slow evaporation of a concentrated CH2Cl2 solution. 1H NMR (400.130 MHz, CDCl3, 293 K): δ 7.73 – 7.65 (8H, m, PPh), 7.39 – 7.28 (12H, m, PPh), 6.94 (2H, t, JH-P = 18.9 Hz, PCH=CHP), 5.34 (4H, ps d, 3JH-H = 6.06 Hz, C2,6H, p-cym), 5.31 (4H, ps d, 3JH-H = 6.06 Hz, C3,5H, p-cym), 2.39 (2H, sept, 3JH-H = 6.96 Hz, CH(CH3)2), 1.72 (6H, s, CH3), 0.93 (12H, d, 3JH-H = 6.93 Hz, CH(CH3)2). 13C{1H} NMR (100.613 MHz, CDCl3, 293 K): δ 140.2 – 139.6 (m, PCH=CHP), 134.1 (t, 2JC-P = 4.6 Hz, C2, Ph), 133.0 – 132.4 (m, C1, Ph), 130.5 (s, C4, Ph), 128.3 (t, 3JC-P = 5.0 Hz, C3, Ph), 109.2 (s, C1, p-cym), 97.7 (s, C4, p-cym), 88.3 (s, C2,6, p-cym), 86.7 (s, C3,5, p-cym), 30.1 (s, CH(CH3)2), 21.9 (s, CH(CH3)2), 17.5 (s, CH3). 31P{1H} NMR (161.976 MHz, CDCl3, 293 K): δ 24.04 (s, tdppe-P). FT-IR (cm-1): ν 3036 (w), 2960 (w), 2863 (w), 1433 (m), 1191 (m), 1095 (m), 877 (m), 752 (m), 740 (m), 696 (s). UV-Vis λmax (dichloromethane): 225 nm (major, ϵ = 66171 M-1cm-1), 249 nm (shoulder, ϵ = 44362 M-1cm-1), 375 (minor, ϵ = 4438 M-1cm-1). ESI-TOF-MS (ACN): m/z calcd. for [M + Na]+, 1031.0131; expt., 1031.0393 (100 %). m/z calcd. for [M - Cl]+, 973.0549; expt., 973.0767 (1.3%).
4.2.2. Characterisation of [(p-cym)RuCl2]2(µ-dcpe) (4)
250 mg of [(p-cym)RuCl2]2 (0.410 mmol) and 172.5 mg of dcpe (0.410 mmol) used. 375 mg (0.362 mmol, 88 %) of dark orange powder obtained, air stable. Crystals suitable for X-ray diffraction analysis were grown via slow diffusion of pentane into a concentrated THF solution. 1H NMR (400.130 MHz, CDCl3, 293 K): δ 5.55 (4H, ps d, 3JH-H = 6.38 Hz, C2,6 or 3,5H, p-cym), 5.53 (4H, ps d, 3JH-H = 6.40 Hz, C2,6 or 3,5H, p-cym), 2.79 (2H, sept, 3JH-H = 6.95 Hz, CH(CH3)2), 2.30 (4H, d, 2JH-P = 3.69 Hz, PCH2CH2P), 2.26 – 2.09 (8H, m, Cy), 2.06 (6H, s, CH3, p-cym), 1.89 – 1.76 (12H, m, Cy), 1.69 (4H, br s, Cy), 1.63 – 1.48 (6H, m, Cy), 1.31 – 1.23 (14H, m, Cy), 1.26 (12H, d, 3JH-H = 6.96 Hz, CH(CH3)2). 13C{1H} NMR (100.613 MHz, CDCl3, 293 K): δ 108.9 (s, C1, p-cym), 94.2 (s, C4, p-cym), 88.5 (s, C2,6 or 3,5, p-cym), 82.6 (s, C2,6 or 3,5, p-cym), 37.6 (d, xJC-P = 21.5 Hz, Cy), 30.9 (s, CH(CH3)2), 29.5 (s, Cy), 28.6 (s, Cy), 27.7 – 27.4 (m, Cy), 26.6 (s, Cy), 22.5 (s, CH(CH3)2), 18.3 (s, CH3, p-cym), 14.5 (d, 1JC-P = 9.66 Hz, PCH2CH2P). 31P{1H} NMR (161.976 MHz, CDCl3, 293 K): δ 30.40 (s, dcpe-P). FT-IR (cm-1): ν 3035 (w), 2932 (s), 2917 (s), 2851 (m), 2841 (m), 1443 (m), 1003 (m), 885 (m), 862 (m), 849 (m), 739 (m), 668 (w), 517 (m). UV-Vis λmax (dichloromethane): 226 (major, ϵ = 32190 M-1cm-1), 359 (minor, ϵ = 2970 M-1cm-1). ESI-TOF-MS (ACN): m/z calcd. for [M - Cl]+, 999.2584; expt., 999.3219 (100%).
4.2.3. Characterisation of [(p-cym)RuCl2]2(µ-14dppb) (5)
100 mg of [(p-cym)RuCl2]2 (0.163 mmol) and 73 mg of 14dppb (0.163 mmol) used. 135 mg (0.128 mmol, 78 %) of brick-like powder obtained, air stable. Crystals suitable for X-ray diffraction analysis were grown via slow diffusion of Et2O into a concentrated CH2Cl2 solution. 1H NMR (400.130 MHz, CDCl3, 293 K): δ 7.84 – 7.76 (8H, m, PPh), 7.75 – 7.68 (4H, m, 14dppb), 7.43 – 7.32 (12H, m, PPh), 5.18 (4H, ps d, 3JH-H = 6.2 Hz, C3,5-H, p-cym), 4.97 (4H, ps d, 3JH-H = 6.1 Hz, C2,6-H, p-cym), 2.81 (2H, sept, 3JH-H = 7.1 Hz, CH(CH3)2), 1.82 (6H, s, CH3, p-cym), 1.09 (12H, d, 3JH-H = 7.0 Hz, CH(CH3)2). 13C{1H} NMR (100.613 MHz, CDCl3, 293 K): δ 136.3 (d, 1JC-P = 44.5 Hz, C1,4, 14dppb), 134.6 (d, 3JC-P = 9.8 Hz, C3, Ph), 133.4 – 132.8 (m, C1, Ph + C2,3,5,6, 14dppb), 130.6 (s, C4, Ph), 128.2 (d, 2JC-P = 16.1 Hz, C2, Ph), 111.3 (d, 2JC-P = 3 Hz, C1, p-cym), 96.3 (s, C4, p-cym), 89.2 (d, 2JC-P = 3 Hz, C3,5 or 2,6, p-cym), 87.3 (d, 2JC-P = 5,2 Hz, C3,5 or 2,6, p-cym), 30.4 (s, CH(CH3)2), 22.0 (s, CH(CH3)2), 17.9 (s, CH3). 31P{1H} NMR (161.976 MHz, CDCl3, 293 K): δ 25.2 (s, 14dppb-P). FT-IR (cm-1): ν 3049 (w), 2963 (w), 2924 (w), 2870 (w), 1482 (w), 1433 (m), 1377 (w), 1094 (m), 747 (m), 697 (m), 550 (s), 539 (s), 520 (s), 438 (m). UV-Vis λmax (dichloromethane): 225 (major, ϵ = n/a), 251 (major, ϵ = 34876 M-1cm-1), 379 (minor, ϵ = 3505 M-1cm-1). ESI-TOF-MS (ACN): m/z calcd. for [M + Na]+, 1081.0289; expt., 1081.0870 (0.7 %).
4.3. Synthesis of [(p-cym)RuCl2(κ1-dppe)] (6)
260 mg of dppe (0.653 mmol, 2 eq.) were dissolved in 10 mL of dichloromethane and cooled down to - 78°C. 200 mg of [(p-cym)RuCl2]2 (0.327 mmol, 1 eq.) were dissolved in 20 mL dichloromethane and added dropwise to the tdppe solution. The resulting solution was stirred for 5 mins after which the solvents were removed in vacuo. The monodentate product was purified by column chromatography on a silica column using a 1:1 solvent mixture of EtOAc : n-hexane. The solvents were evaporated and the product was dried in vacuo to yield 45.7 mg of orange powder (0.065 mmol, 10 %). Crystals suitable for X-ray diffraction analysis were grown via slow diffusion of degassed pentane in a concentrated degassed CH2Cl2 solution. Stability: stable in air, converts partially to dinuclear species 1 and bidentate species [(p-cym)RuCl(κ2-dppe)]+Cl- in solution over time. Crystals suitable for X-ray diffraction analysis were grown via slow diffusion of pentane into a concentrated degassed CH2Cl2 solution. 1H NMR (400.130 MHz, CDCl3, 293 K): δ 7.72 (4H, m, PPh), 7.49 – 7.37 (6H, m, PPh), 7.23 – 7.10 (10H, m, PPh), 5.18 (2H, dd, 3JH-H = 6.3, 1.5 Hz, C3,5H, p-cym), 5.02 (2H, d, 3JH-H = 6.1 Hz, C2,6H, p-cym), 2.68 – 2.58 (2H, m, PCH2CH2P), 2.51 (1H, p, 3JH-H = 6.9 Hz, p-cym CH(CH3)2), 1.84 (3H, s, CH3), 1.79 – 1.71 (2H, m, PCH2CH2P), 0.80 (6H, d, 3JH-H = 6.9 Hz, CH(CH3)2). 13C{1H} NMR (100.613 MHz, CDCl3, 293 K): δ 138.13 - 128.38 (m, PPh), 108.57 (s, C1, p-cym), 94.02 (C4, p-cym), 90.55 (d, 2JC-P = 4.36 Hz, C3,5, p-cym), 85.65 (d, 2JC-P = 5.96 Hz, C2,6, p-cym), 30.02 (s, CH(CH3)2), 21.71 (m, PCH2CH2P, assigned via 1H-13C HSQC), 21.45 (s, CH(CH3)2), 20.76 (m, PCH2CH2P, assigned via 1H-13C HSQC), 17.45 (s, CH3). 31P{1H} NMR (161.976 MHz, CDCl3, 293 K): δ 26.16 (d, 3JP-P = 34.98 Hz, RuPPh2), -12.05 (d, 3JP-P = 34.98 Hz, PPh2). FT-IR (cm-1): ν = 3047 (w), 2972 (w), 2949 (w), 2914 (w), 1483 (w), 1431 (m), 1414 (w), 1097 (m), 1029 (w), 885 (w), 868 (w), 742 (s), 696 (s), 673 (m), 523 (s), 477 (m), 454 (m). ESI-MS (ACN), m/z calculated for [M - Cl]+ 669.12. Found: 669.10.
4.4. Synthesis of [(p-cym)RuCl2(κ1-tdppe)] (7)
258.9 mg of tdppe (0.653 mmol, 2 eq.) and 200 mg of [(p-cym)RuCl2]2 (0.327 mmol, 1 eq.) were dissolved in 10 mL each in separate flasks. The [(p-cym)RuCl2]2 solution was added dropwise to the tdppe solution at room temperature and the resulting solution was stirred at room temperature for 1 h. The solvent was removed in vacuo and a column chromatography on silica gel was performed using a three solvent mixture of 5 : 3.5 : 1.5 mixture of dichloromethane : n-hexane : EtOAc. The solvents were removed in vacuo and the product was dried under reduced pressure to yield 17.7 mg (0.025 mmol, 8 %). Crystals suitable for X-ray diffraction analysis were grown via slow diffusion of degassed pentane in a concentrated degassed CH2Cl2 solution. Stability: stable in air, converts partially to dinuclear species 2 in solution over time. Crystals suitable for X-ray diffraction analysis were grown via slow diffusion of pentane into a concentrated degassed CH2Cl2 solution. 1H NMR (400.130 MHz, CDCl3, 293 K): δ 7.79 - 7.71 (4H, m, PPh), 7.46 – 7.35 (10H, m, PPh), 7.29 (6H, m, PPh), 6.76 (1H, m, PCH=CHP), 6.45 (1H, m, PCH=CHP), 5.16 (4H, d, 3JH-H = 6.7 Hz, C3,5 or 2,6H, p-cym), 2.56 (1H, sept, 3JH-H = 7.0 Hz, CH(CH3)2), 1.81 (3H, s, CH3), 0.95 (6H, d, 3JH-H = 7.0 Hz, CH(CH3)2). 13C{1H} NMR (100.613 MHz, CDCl3, 293 K): δ 145.69 - 128.29 (m, PPh + PCH=CHP (assigned via 1H-13C HSQC)), 109.14 (s, C1, p-cym), 95.33 (s, C4, p-cym), 89.44 (d, 2JC-P = 4.43 Hz, C3,5 or 2,6, p-cym), 85.83 (d, 2JC-P = 5.91 Hz, C3,5 or 2,6, p-cym), 30.20 (s, CH(CH3)2), 21.79 (s, CH(CH3)2), 17.59 (s, CH3) ppm. 31P{1H} NMR (161.976 MHz, CDCl3, 293 K): δ 22.65 (d, 3JP-P = 8.1 Hz, RuPPH2), - 4.86 (d, 3JP-P = 8.1 Hz, PPH2) ppm. FT-IR (cm-1): ν = 3052 (w), 3029 (w), 2960 (w), 2868 (w), 1730 (w), 1477 (w), 1431 (m), 1380 (w), 1242 (w), 1178 (w), 1098 (m), 1029 (w), 966 (w), 874 (w), 799 (w), 742 (s), 690 (s), 512 (s), 466 (s). ESI-MS (ACN), m/z calculated for [M - Cl]+ 667.10. Found: 667.10.
4.5. Cell Viability Assays
The two types of cells were cultured according to the ATCC protocols under aseptic conditions: Cervical Cancer Cells (HeLa) (ATCC CCL-2) and as a control an Ectocervix Epithelial Cell Line Ect1/E6E7 (ATCC CRL-2614). Cell viability assays were performed using Presto Blue HS cell viability reagent (Invitrogen, Cat# A13261, Thermo Fisher Scientific), following the manufacturer’s instructions.
Briefly, cells were seeded in 96-well plates at 5000 cells/mL density for HeLa and for was 7000 cells/mL density for Ect1/E6E7. To allow cell adhesion, cells were incubated 24 h prior to drug treatment. The cells were then incubated with the corresponding complexes and cisplatin for 72 h. Afterwards, Presto Blue HS cell viability reagent was used. After 20 min incubation with 10 μl Presto Blue, the fluorescence intensity was measured in a Tecan (Cat# 30050303) microplate well reader (excitation/emission= 560/590 nm). Wells containing only cell medium were used as controls to Normalize the Absorbance values during the different conditions. At least three independent measurements were performed to determine the IC50 concentration of the respective complexes. The IC50 values were calculated from the sigmoidal plots with Quest Graph™ IC50 Calculator. (2025, December 27). AAT Bioquest. https://www.aatbio.com/tools/ic50-calculator.
Cells prepared for fluorescence microscopy were seeded as mentioned above. Imaging was performed by Dr. Anne Gemmink using the FEI Munich CorrSight Cryo inverted microscope, located in the Microscopy Core laboratories, Maastricht University. Images were taken on live cells at 20X magnification and in the 2D optical slice plane for quick, high resolution images of the cell monolayer.
A Live/Dead cell staining kit was used (Invitrogen, Cat# R37601, Thermo Fisher Scientific) which included Calcein AM to stain live cells cytoplasm and BOBO-3 iodide was used to stain the nuclei of dead cells. In addition, CellROX™ deep red dye (Invitrogen, Cat# C10448, Thermo Fisher Scientific) was used in order to visualize ROS. Fluorescent imaging was observed using the following excitation/emission wavelengths; Calcein AM: 488 nm/515 nm, BOBO-3 iodide: 570 nm/602 nm, CellROX™deep red: 640 nm/665 nm. The CellROX™ deep red solution was prepared in a 5 μM solution by diluting the 2.5 mM stock solution with medium. After 72 h drug incubation, the medium was aspirated from the cells on the 96 well plate and 50 μL of the 5 μM dye solution was added to each well and left to incubate at 37°C for 30 minutes. In the meantime, the live/dead stain was prepared by pipetting 1 mL of the live green stain into the vial containing 1 μL of the dead red stain, and the solution was homogenized by gently pipetting.
Once the 30 minutes incubation was over the dye-containing medium was aspirated and the wells were gently washed with 1X PBS. The live/dead stain solution was then added again at 50 mL per well and left to incubate for 15 minutes at room temperature. Finally, the cells were carefully washed with 1X PBS three times before being left in 80 μL PBS. Plates were imaged within 2 hours of preparation.
Supplementary Materials
The following supporting information can be downloaded at: Preprints.org.
Author Contributions
Conceptualization, B.R. and B.B.; methodology, B.R., C.M. and K.J.M.; software, B.R., C.M. and K.J.M.; validation, B.R., B.B., K.J.M., J.vdL. and O.L.; formal analysis, B.R., B.B., C.M. and K.J.M.; investigation, B.R., C.M., K.J.M., J.vdL. and O.L.; resources, B.B., C.M., K.J.M., S.P. and T.J.C.; data curation, B.R., K.J.M, C.M., J.vdL. and O.L.; writing—original draft preparation, B.R., K.J.M. and J.vdL.; writing—review and editing, B.B., C.M., S.P. and T.J.C.; visualization, B.R., J.vdL., O.L. and K.J.M.; supervision, B.B., K.J.M., S.P. and T.J.C.; project administration, B.B., S.P. and T.J.C.; funding acquisition, B.B., S.P. and T.J.C. All authors have read and agreed to the published version of the manuscript.
Data Availability Statement
Supplementary information (SI): Experimental procedures and full characterisation of the complexes, including all spectra and X-ray data. See DOI: https://doi.org/xxx. CCDC 2521032-2521036 contain the supplementary crystallographic data for this paper.
Acknowledgments
Dr. Anne Gemmink from the Microscopy Core laboratories at Maastricht University for helping us use the Fluorescent Microscope. We also thank Prof Maarten Honing and his co-workers for use of the MS equipment.
Conflicts of Interest
The authors declare no conflicts of interest. The funders had no role in the design of the study; in the collection, analyses, or interpretation of data; in the writing of the manuscript; or in the decision to publish the results.
References
- Sava, G.; Pacor, S.; Mestroni, G.; Alessio, E. Na[trans-RuCl4(DMSO)Im], a metal complex of ruthenium with antimetastatic properties. Clin. Exp. Metastasis 1992, 10, 273–280. [Google Scholar] [PubMed]
- Sava, G.; Pacor, S.; Mestroni, G.; Alessio, E. Effects of the Ru(III) complexes [mer-RuCl3(DMSO)2Im]° and Na[trans-RuCl4(DMSO)Im] on solid mouse tumors. Anticancer Drugs 1992, 3. [Google Scholar] [PubMed]
- Singh, N. S. S.; Saleh, L. H.; PadmaPriya, G.; Ray, S.; Pal, A.; Arora, V.; Iliev, K.; Atamuratova, Z.; Yulchiev, D.; Smerat, A.; Qasim, S. M. Ruthenium-based anticancer agents: Focus on mononuclear Ru(II)–arene organometallic scaffolds and Ru(III) non-arene coordination compounds as clinical leads. J. Organomet. Chem. 2026, 1045, 123981. [Google Scholar]
- Bhattacharya, S.; Adon, T.; Dsouza, K.; Kumar, H. Y. Exploring the Future of Metal-Based Anticancer Agents: A Comprehensive Review of Ruthenium-Based Complexes. ChemistrySelect 2025, 10, e202404147. [Google Scholar]
- Sojka, M.; Gamez, P. Exploring the toxicity of mononuclear piano-stool Ru(II) anticancer agents: A comprehensive literature review. Coord. Chem. Rev. 2025, 543, 216902. [Google Scholar]
- Domínguez-Jurado, E.; Lara-Sánchez, A.; Bravo, I.; Ocaña, A.; Alonso-Moreno, C. State of the art in organometallic ruthenium metallodrugs for breast cancer treatment: Advances and innovations. Coord. Chem. Rev. 2025, 523, 216252. [Google Scholar]
- Dias, I. R. S. B.; Bezerra, D. P. Ruthenium-based drugs as cancer stem cell inhibitors. BioMed Pharmacother. 2025, 193, 118730. [Google Scholar] [CrossRef] [PubMed]
- Kulkarni, G. S.; Lilge, L.; Nesbitt, M.; Dumoulin-White, R. J.; Mandel, A.; Jewett, M. A. S. A Phase 1b Clinical Study of Intravesical Photodynamic Therapy in Patients with Bacillus Calmette-Guérin–unresponsive Non–muscle-invasive Bladder Cancer. Eur. Urol. Open Sci. 2022, 41, 105–111. [Google Scholar] [PubMed]
- Burris, H. A.; Bakewell, S.; Bendell, J. C.; Infante, J.; Jones, S. F.; Spigel, D. R.; Weiss, G. J.; Ramanathan, R. K.; Ogden, A.; Von Hoff, D. Safety and activity of IT-139, a ruthenium-based compound, in patients with advanced solid tumours: A first-in-human, open-label, dose-escalation phase I study with expansion cohort. ESMO Open 2016, 1, e000154. [Google Scholar] [PubMed]
- Henke, M. M.; Richly, H.; Drescher, A.; Grubert, M.; Alex, D.; Thyssen, D.; Jaehde, U.; Scheulen, M. E.; Hilger, R. A. Pharmacokinetic study of sodium trans[tetrachlorobis(1H-indazole)-ruthenate (III)]/-indazole hydrochloride (1:1.1) (FFC14A) in patients with solid tumors. Int. J. Clin. Pharmacol. Ther. 2009, 47, 58–60. [Google Scholar] [PubMed]
- Lentz, F.; Drescher, A.; Lindauer, A.; Henke, M.; Hilger, R. A.; Hartinger, C. G.; Scheulen, M. E.; Dittrich, C.; Keppler, B. K.; Jaehde, U. Pharmacokinetics of a novel anticancer ruthenium complex (KP1019, FFC14A) in a phase I dose-escalation study. Anticancer Drugs 2009, 20, 97–103. [Google Scholar] [CrossRef] [PubMed]
- Leijen, S.; Burgers, S. A.; Baas, P.; Pluim, D.; Tibben, M.; van Werkhoven, E.; Alessio, E.; Sava, G.; Beijnen, J. H.; Schellens, J. H. M. Phase I/II study with ruthenium compound NAMI-A and gemcitabine in patients with non-small cell lung cancer after first line therapy. Invest New Drugs 2015, 33, 201–214. [Google Scholar] [PubMed]
- Rademaker-Lakhai, J. M.; van den Bongard, D.; Pluim, D.; Beijnen, J. H.; Schellens, J. H. M. A Phase I and Pharmacological Study with Imidazolium-trans-DMSO-imidazole-tetrachlororuthenate, a Novel Ruthenium Anticancer Agent. Clin. Cancer Res. 2004, 10, 3717–3727. [Google Scholar] [PubMed]
- Spratlin, J. L.; O'Kane, G. M.; Oh, D.-Y.; Rha, S. Y.; McWhirter, E.; Elimova, E.; Kavan, P.; Choi, M. K.; Kim, D. W.; Goodwin, R. A.; Hecht, J. R.; Kim, S. T.; Koo, D.-H.; Halani, K.; McAllister, E. R.; Jones, M.; Snow, M.; Lemmerick, Y.; Spera, G.; Pankovich, J. BOLD-100-001 (TRIO039): A phase 2 study of BOLD-100 in combination with FOLFOX in patients with advanced mCRC previously treated with FOLFOX/CAPOX—Efficacy and safety analysis. J. Clin. Oncol. 2024, 42, 143–143. [Google Scholar]
- Roufosse, B.; Serbu, C.; Marschner, C.; Prince, S.; Blom, B. Homo and heteromultimetallic complexes containing a group 8 transition metal and μ-diphosphine bridging ligands involved in anticancer research: A review. Eur. J. Med. Chem. 2024, 274, 116528. [Google Scholar] [CrossRef] [PubMed]
- Das, S.; Sinha, S.; Britto, R.; Somasundaram, K.; Samuelson, A. G. Cytotoxicity of half sandwich ruthenium(II) complexes with strong hydrogen bond acceptor ligands and their mechanism of action. J. Inorg. Biochem 2010, 104, 93–104. [Google Scholar] [CrossRef] [PubMed]
- Klaimanee, E.; Nhukeaw, T.; Saithong, S.; Ratanaphan, A.; Phongpaichit, S.; Tantirungrotechai, Y.; Leesakul, N. Half-sandwich ruthenium (II) p-cymene complexes based on organophosphorus ligands: Structure determination, computational investigation, in vitro antiproliferative effect in breast cancer cells and antimicrobial activity. Polyhedron 2021, 204, 115244. [Google Scholar]
- Chaplin, A. B.; Fellay, C.; Laurenczy, G.; Dyson, P. J. Mechanistic Studies on the Formation of η2-Diphosphine (η6-p-cymene)ruthenium(II) Compounds. Organometallics 2007, 26, 586–593. [Google Scholar]
- Chaplin, A. B.; Scopelliti, R.; Dyson, P. J. The Synthesis and Characterisation of Bis(phosphane)-Linked (6-p-Cymene)ruthenium(II)–Borane Compounds. Eur. J. Inorg. Chem. 2005, 2005, 4762–4774. [Google Scholar]
- McQuade, 20 P.; Rath, N. P.; Barton, L. [BH3·PPh2CH2C6H4CH2PPh2·Ru(p-cym)Cl2]: A New Bifunctional Compound and Prototype of a Linked Borane/Metal Cluster Species. Inorg. Chem. 1999, 38, 5468–5470. [Google Scholar]
- Calabrese, E. J. Cancer Biology and Hormesis: Human Tumor Cell Lines Commonly Display Hormetic (Biphasic) Dose Responses. Crit. Rev. Toxicol. 2005, 35, 463–582. [Google Scholar] [CrossRef] [PubMed]
- Calabrese, E. J.; Baldwin, L. A. Chemotherapeutics and Hormesis. Crit. Rev. Toxicol. 2008, 33, 305–353. [Google Scholar]
- Mattson, M. P. Hormesis defined. Ageing Res. Rev. 2008, 7, 1–7. [Google Scholar] [CrossRef] [PubMed]
- Brunet, A.; Bonni, A.; Zigmond, M. J.; Lin, M. Z.; Juo, P.; Hu, L. S.; Anderson, M. J.; Arden, K. C.; Blenis, J.; Greenberg, M. E. Akt promotes cell survival by phosphorylating and inhibiting a Forkhead transcription factor. Cell 1999, 96, 857–868. [Google Scholar] [CrossRef] [PubMed]
- Zhang, W.; Liu, H. T. MAPK signal pathways in the regulation of cell proliferation in mammalian cells. Cell Res. 2002, 12, 9–18. [Google Scholar] [CrossRef] [PubMed]
- Bao, J.; Huang, B.; Zou, L.; Chen, S.; Zhang, C.; Zhang, Y.; Chen, M.; Wan, J.-B.; Su, H.; Wang, Y.; He, C. Hormetic effect of berberine attenuates the anticancer activity of chemotherapeutic agents. PLoS ONE 2015, 10, e0139298. [Google Scholar] [CrossRef] [PubMed]
- Herry, B.; Batchelor, L. K.; Roufosse, B.; Romano, D.; Baumgartner, J.; Borzova, M.; Reifenstahl, T.; Collins, T.; Benamrane, A.; Weggelaar, J.; Correia, M. C.; Dyson, P. J.; Blom, B. Heterobimetallic Ru(μ-dppm)Fe and homobimetallic Ru(μ-dppm)Ru complexes as potential anti-cancer agents. J. Organomet. Chem. 2019, 901, 120934. [Google Scholar]
- Mamat, N.; Abdullah, H.; Hapidin, H.; Mokhtar, N. F. Combination effect of cisplatin and gallic acid on apoptosis and antioxidant enzymes level in cervical cancer (HeLa) cells. J. Appl. Pharm. Sci. 2021, 11, 092–099. [Google Scholar] [CrossRef]
- Demir, Y. D. Şimay; Ahmed, I. Mohammed; Özdemir, A.; Ark, M. Caveolae and Rho Kinase: Their implication of the senescent cell morphology and the secretion of the SASP in HeLa and A549 cancer cells. Med. Oncol. 2025, 42, 475. [Google Scholar] [CrossRef]
- Nakao, Y.; Mori, M.; Sekiguchi, Y.; Morita, I.; Shindoh, R.; Mandai, S.; Fujiki, T.; Kikuchi, H.; Ando, F.; Susa, K.; Mori, T.; Suzuki, A.; Nashimoto, Y.; Kaji, H.; Waseda, Y.; Yoshida, S.; Fujii, Y.; Sohara, E.; Uchida, S.; Miyake, K.; Mori, Y. A Human Kidney Tubuloid Model of Repeated Cisplatin-Induced Cellular Senescence and Fibrosis for Drug Screening. Adv. Healthc. Mater. 2026, 15, e01795. [Google Scholar] [PubMed]
- Li, S.; Livingston, M. J.; Ma, Z.; Hu, X.; Wen, L.; Ding, H.-F.; Zhou, D.; Dong, Z. Tubular cell senescence promotes maladaptive kidney repair and chronic kidney disease after cisplatin nephrotoxicity. JCI Insight 2023, 8. [Google Scholar] [CrossRef] [PubMed]
- Nam, D.; Park, J.; Lee, J.; Son, J.; Kim, J.-E. mTOR potentiates senescent phenotypes and primary cilia formation after cisplatin-induced G2 arrest in retinal pigment epithelial cells. Cell Signal 2024, 124, 111402. [Google Scholar] [PubMed]
- Li, W.; Wang, W.; Dong, H.; Li, Y.; Li, L.; Han, L.; Han, Z.; Wang, S.; Ma, D.; Wang, H. Cisplatin-induced senescence in ovarian cancer cells is mediated by GRP78. Oncol. Rep. 2014, 31, 2525–2534. [Google Scholar] [CrossRef] [PubMed]
- Coppé, J.-P.; Patil, C. K.; Rodier, F.; Krtolica, A.; Beauséjour, C. M.; Parrinello, S.; Hodgson, J. G.; Chin, K.; Desprez, P.-Y.; Campisi, J. A human-like senescence-associated secretory phenotype is conserved in mouse cells dependent on physiological oxygen. PLoS ONE 2010, 5, e9188. [Google Scholar] [PubMed]
- Bharadwaj, D.; Mandal, M. Senescence in polyploid giant cancer cells: A road that leads to chemoresistance. Cytokine Growth Factor Rev. 2020, 52, 68–75. [Google Scholar] [CrossRef] [PubMed]
- Sheldrick, G. SHELXT - Integrated space-group and crystal-structure determination. Acta Crystallogr. A 2015, 71, 3–8. [Google Scholar]
- Sheldrick, G. Crystal structure refinement with SHELXL. Acta Crystallogr. C 2015, 71, 3–8. [Google Scholar] [CrossRef]
- Dolomanov, 38 O. V.; Bourhis, L. J.; Gildea, R. J.; Howard, J. A. K.; Puschmann, H. OLEX2: A complete structure solution, refinement and analysis program. J. Appl. Crystallogr. 2009, 42, 339–341. [Google Scholar] [CrossRef]
- Coleman, A. W.; Jones, D. F.; Dixneuf, P. H.; Brisson, C.; Bonnet, J. J.; Lavigne, G. Dehalogenation of binuclear arene-ruthenium complexes: A new route to homonuclear triruthenium and heteronuclear ruthenium-iron cluster complexes containing chelating phosphorus ligands. Crystal structure of Ru3(CO)10(Ph2PCH2PPh2). Inorg. Chem. 1984, 23, 952–956. [Google Scholar]
- Estevan, F.; Lahuerta, P.; Latorre, J.; Sanchez, A.; Sieiro, C. Electrochemical study of dinuclear ruthenium(II)—Arene compounds: Electrogeneration of Ru(II)—Ru(I) species. Polyhedron 1987, 6, 473–478. [Google Scholar]
- Daguenet, C.; Dyson, P. J. The effect of pH on the hydrogenation of benzene in an aqueous biphase using a ruthenium catalyst. Catal. Commun. 2003, 4, 153–157. [Google Scholar] [CrossRef]
- Moldes, I.; de la Encarnación, E.; Ros, J.; Alvarez-Larena, Á.; Piniella, J. F. Ruthenium(II) complexes containing both arene and functionalized phosphines. Synthesis and catalytic activity for the hydrogenation of styrene and phenylacetylene. J. Organomet. Chem. 1998, 566, 165–174. [Google Scholar] [CrossRef]
Scheme 1.
Some Ru-based complexes which reached (pre)clinical trials. a: NAMI (Z = Na+) or NAMI-A (Z = imidazoleH+), b: RAPTA-C, c: RAED-C, d: TLD1433 and e: KP1339 (Z = Na+) or KP1019 (Z = indazoleH+).
Scheme 1.
Some Ru-based complexes which reached (pre)clinical trials. a: NAMI (Z = Na+) or NAMI-A (Z = imidazoleH+), b: RAPTA-C, c: RAED-C, d: TLD1433 and e: KP1339 (Z = Na+) or KP1019 (Z = indazoleH+).
Scheme 2.
Schematic representation of the bimetallic complexes 1 – 5 studied herein.
Scheme 4.
Synthesis of the bimetallic complexes 1 – 5.

Figure 1.
ORTEP representation of 2 (top left), 4 (top right) and 5 (bottom) in the solid state, determined by X-ray diffraction analyses. Thermal ellipsoids represented at the 30 % probability level. H atoms and solvent molecules omitted for clarity.
Figure 1.
ORTEP representation of 2 (top left), 4 (top right) and 5 (bottom) in the solid state, determined by X-ray diffraction analyses. Thermal ellipsoids represented at the 30 % probability level. H atoms and solvent molecules omitted for clarity.
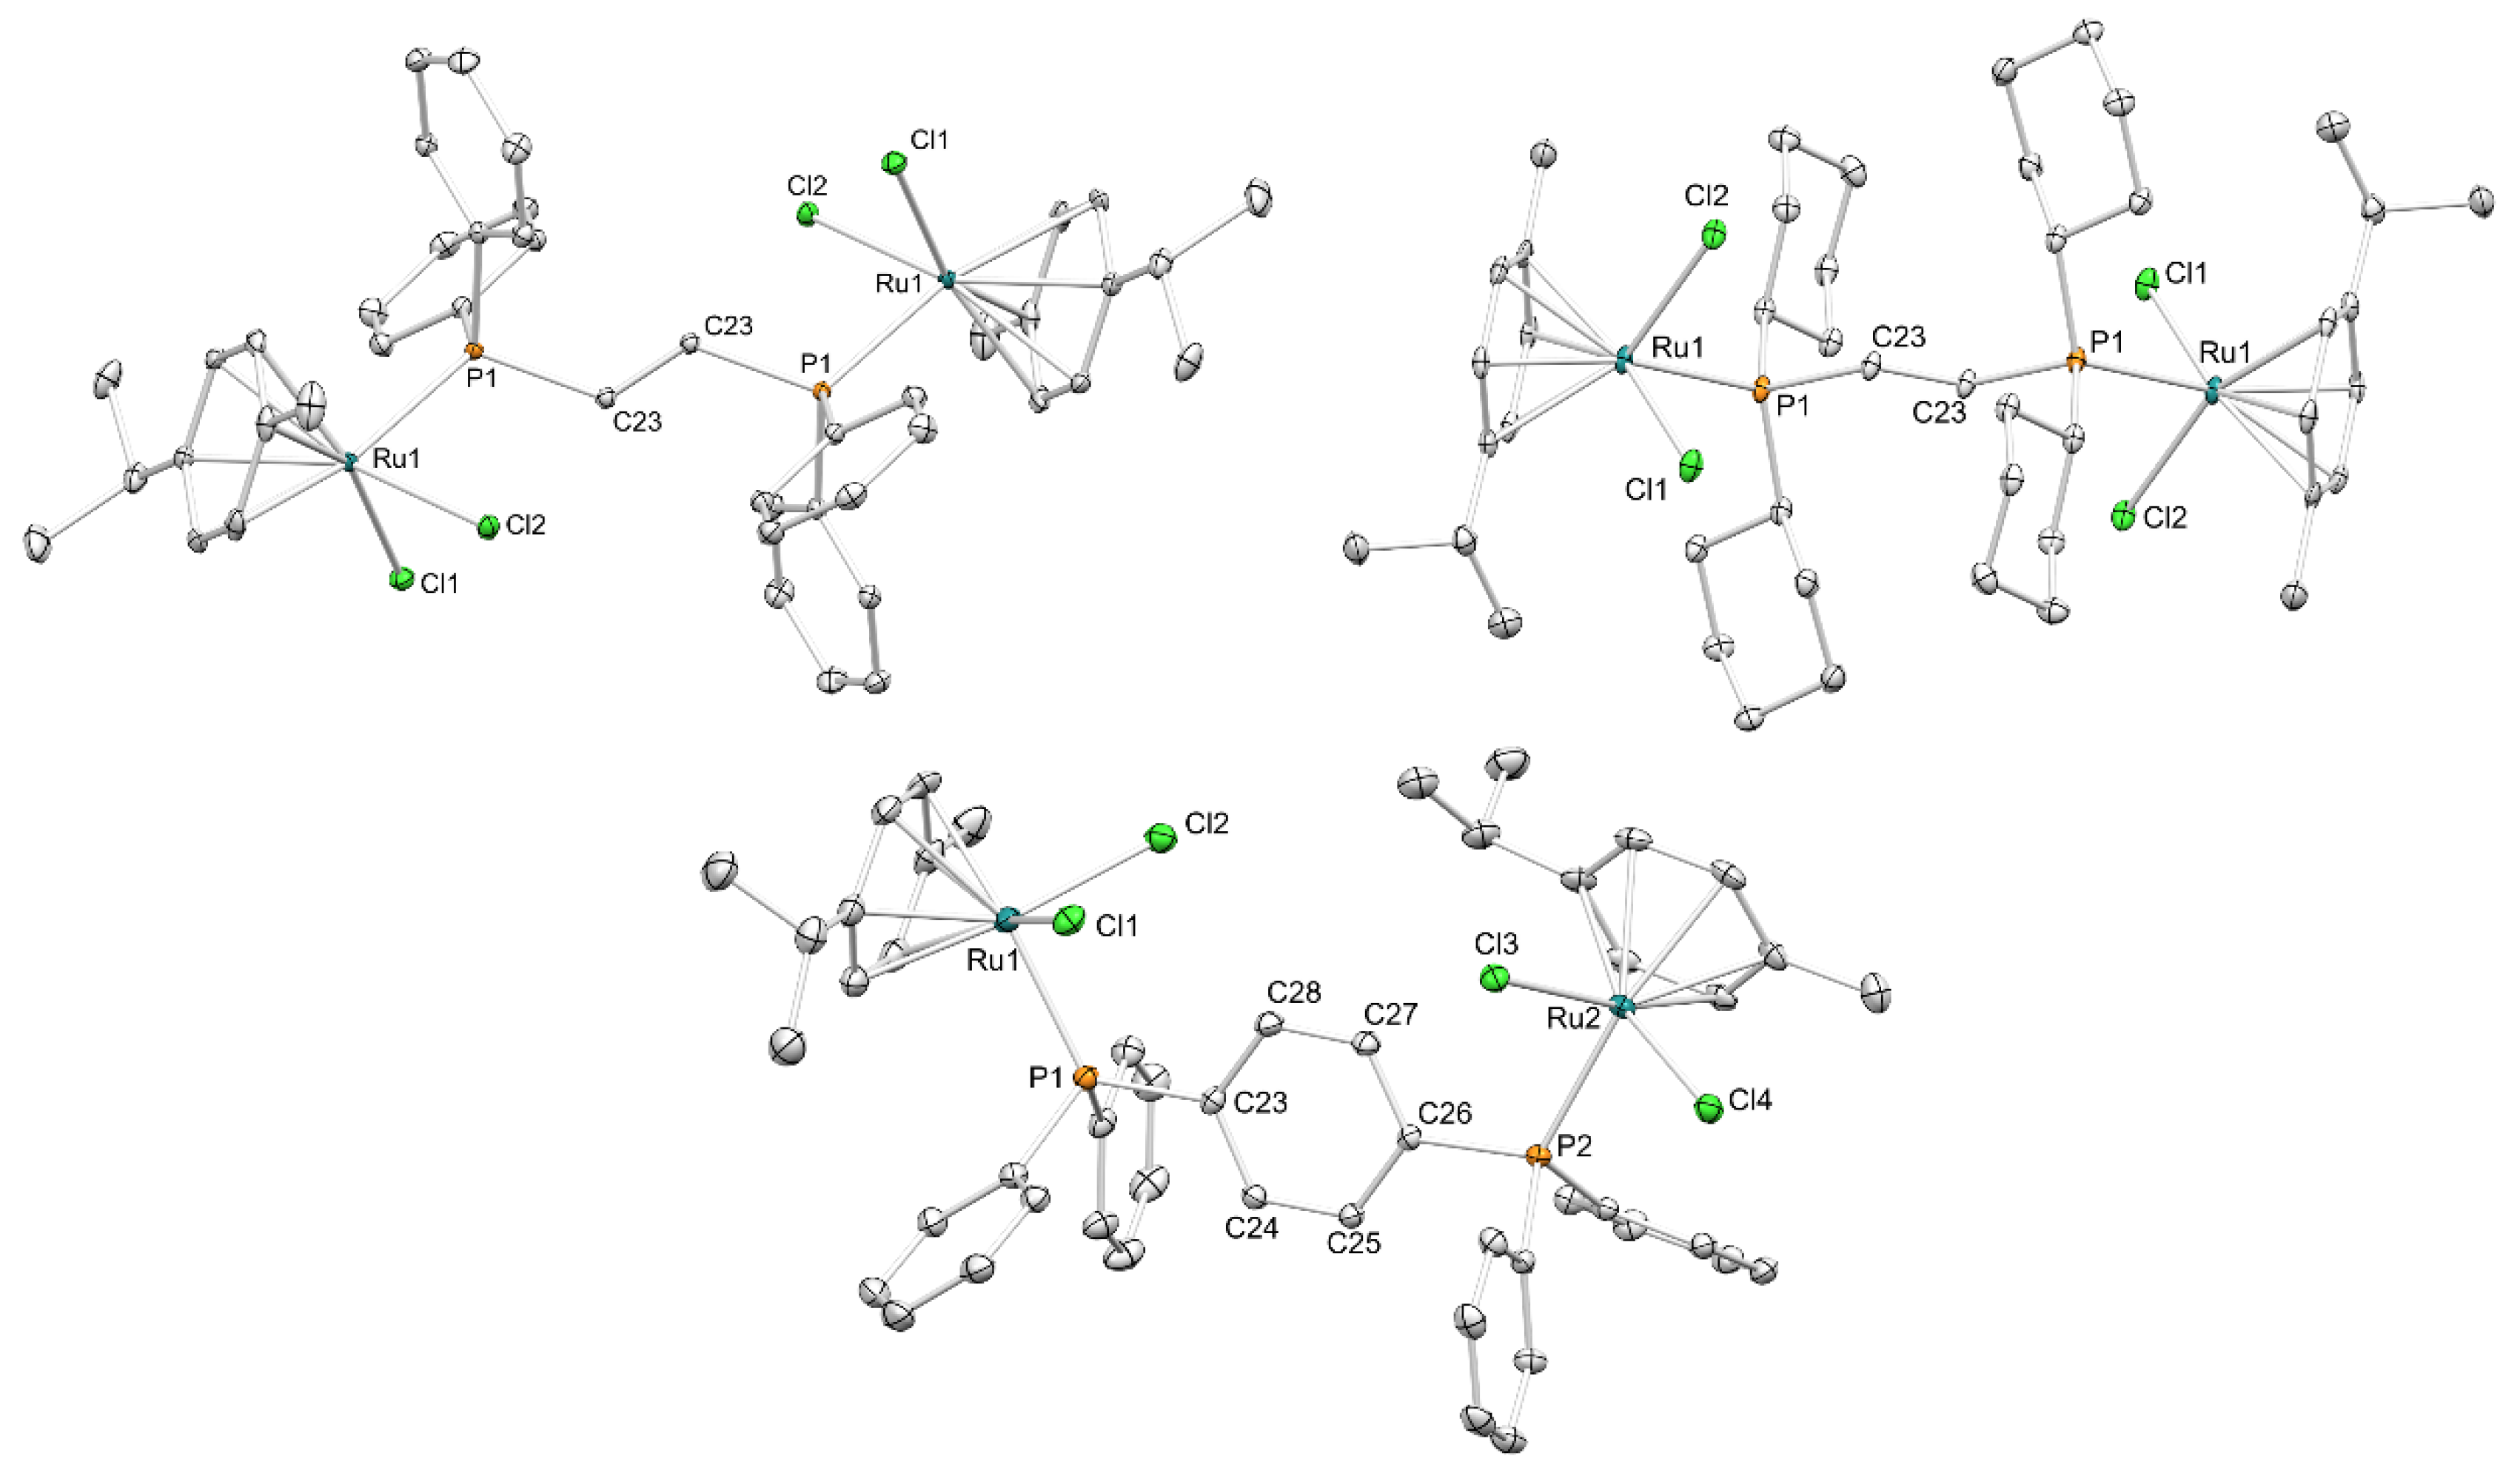
Figure 2.
ORTEP representation of 6 (left), and 7 (right) in the solid state determined by X-ray diffraction analyses. Thermal ellipsoids represented at the 30 % probability level. H atoms omitted for clarity.
Figure 2.
ORTEP representation of 6 (left), and 7 (right) in the solid state determined by X-ray diffraction analyses. Thermal ellipsoids represented at the 30 % probability level. H atoms omitted for clarity.
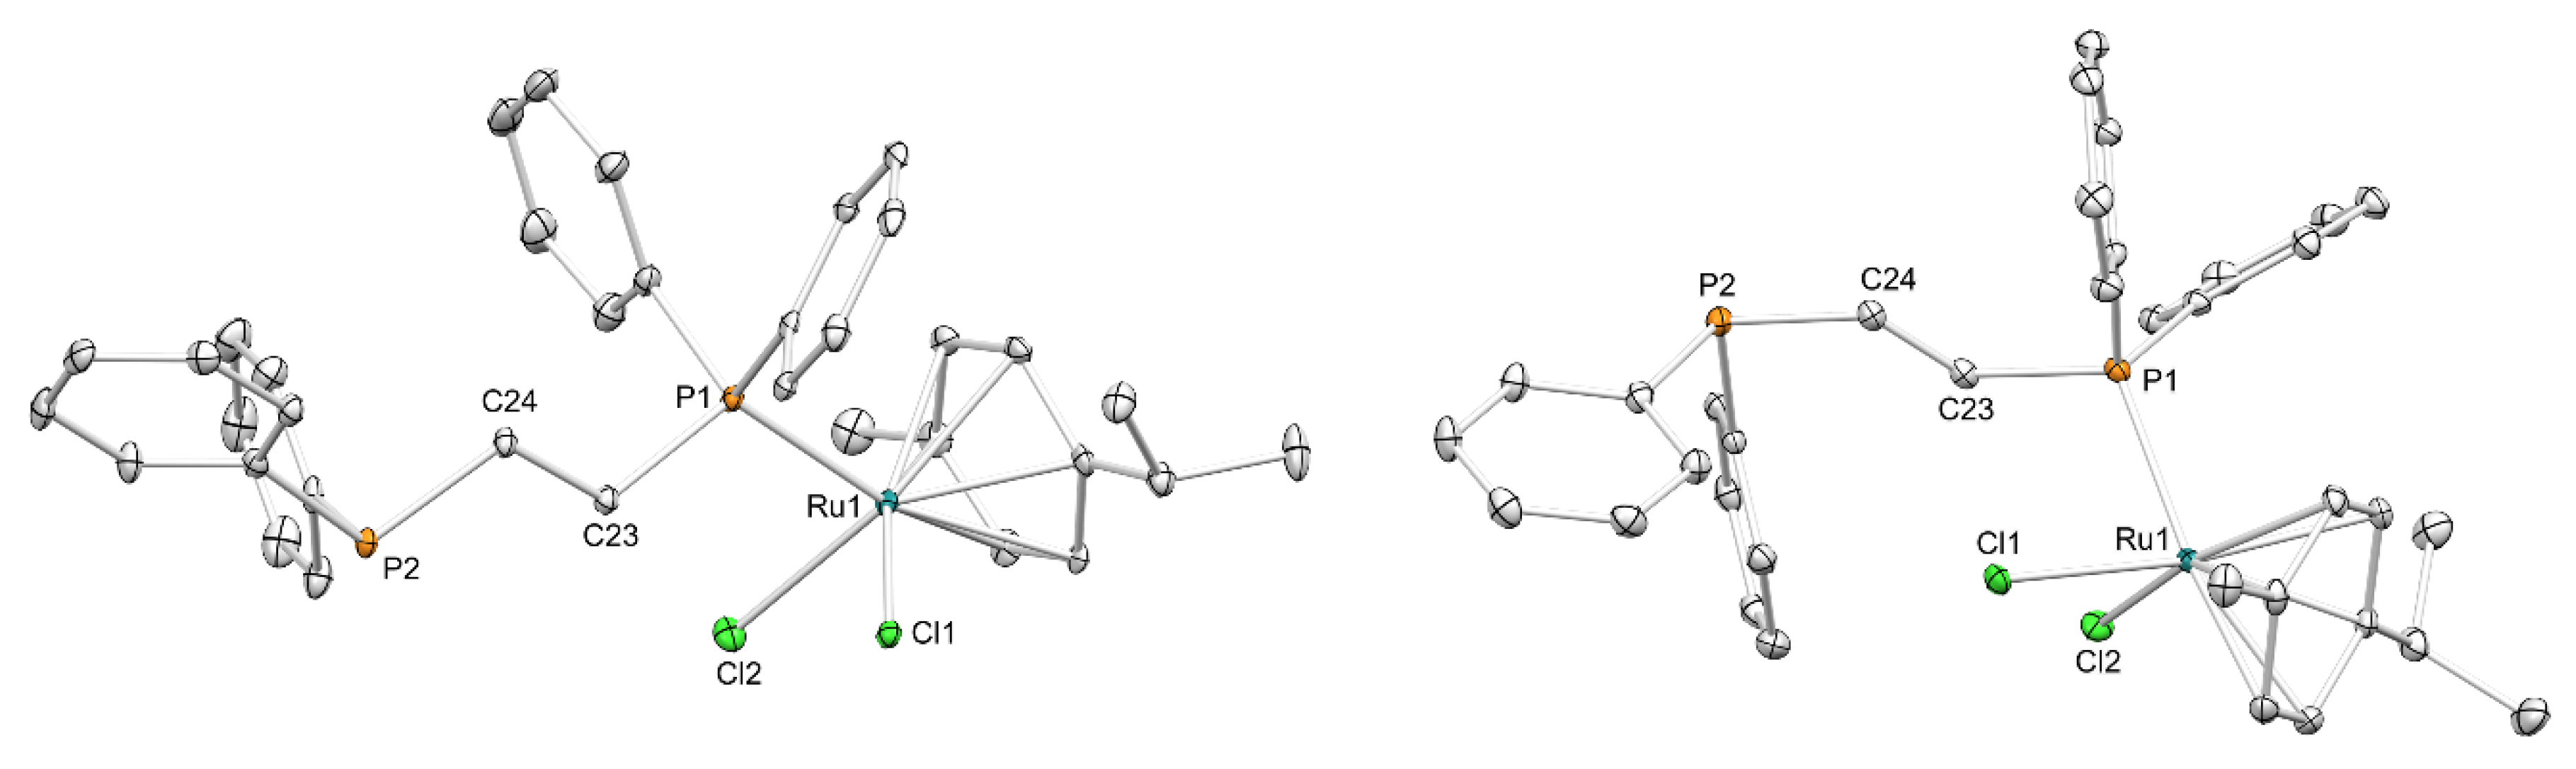
Figure 3.
Presto blue cell cytotoxicity assay for Hela (red column) and Ect1/Ect6 (blue column) cells in presence of complex 3 (left graph) and complex 4 (right graph). Data are presented as mean ± SD (standard deviation) (n = 3).
Figure 3.
Presto blue cell cytotoxicity assay for Hela (red column) and Ect1/Ect6 (blue column) cells in presence of complex 3 (left graph) and complex 4 (right graph). Data are presented as mean ± SD (standard deviation) (n = 3).
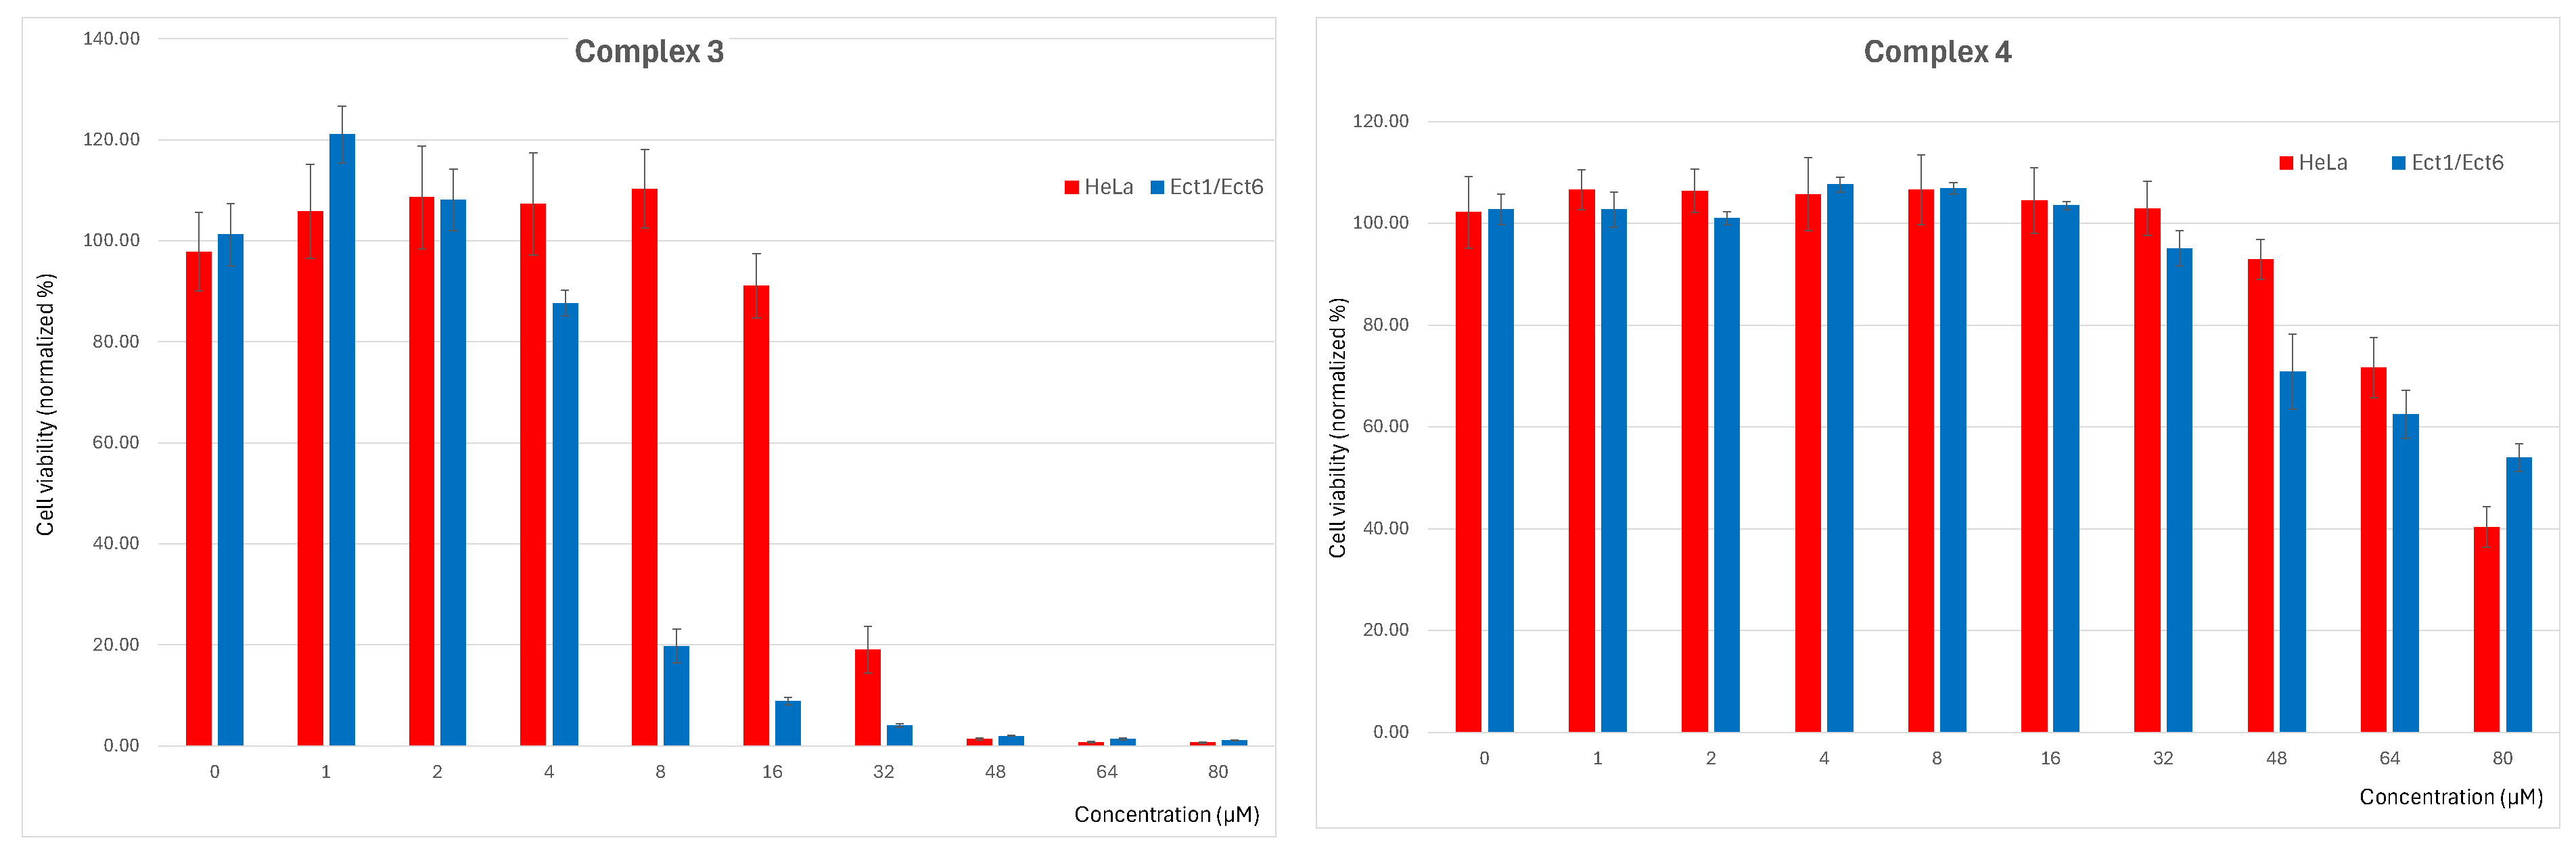
Figure 4.
Fluorescence microscope imaging (Objective magnification of 20x) for cells treated with complex 3 (left) and cisplatin (right) at various drug concentrations. HeLa cells were stained with Calcein AM (Live cells), BOBO-3 Iodide (Dead cells) and CellROX Deep Red (Reactive Oxygen Species, ROS). Each stain is individually observed for each condition and a composite (merge) image is presented of all stains in the Merge column.
Figure 4.
Fluorescence microscope imaging (Objective magnification of 20x) for cells treated with complex 3 (left) and cisplatin (right) at various drug concentrations. HeLa cells were stained with Calcein AM (Live cells), BOBO-3 Iodide (Dead cells) and CellROX Deep Red (Reactive Oxygen Species, ROS). Each stain is individually observed for each condition and a composite (merge) image is presented of all stains in the Merge column.
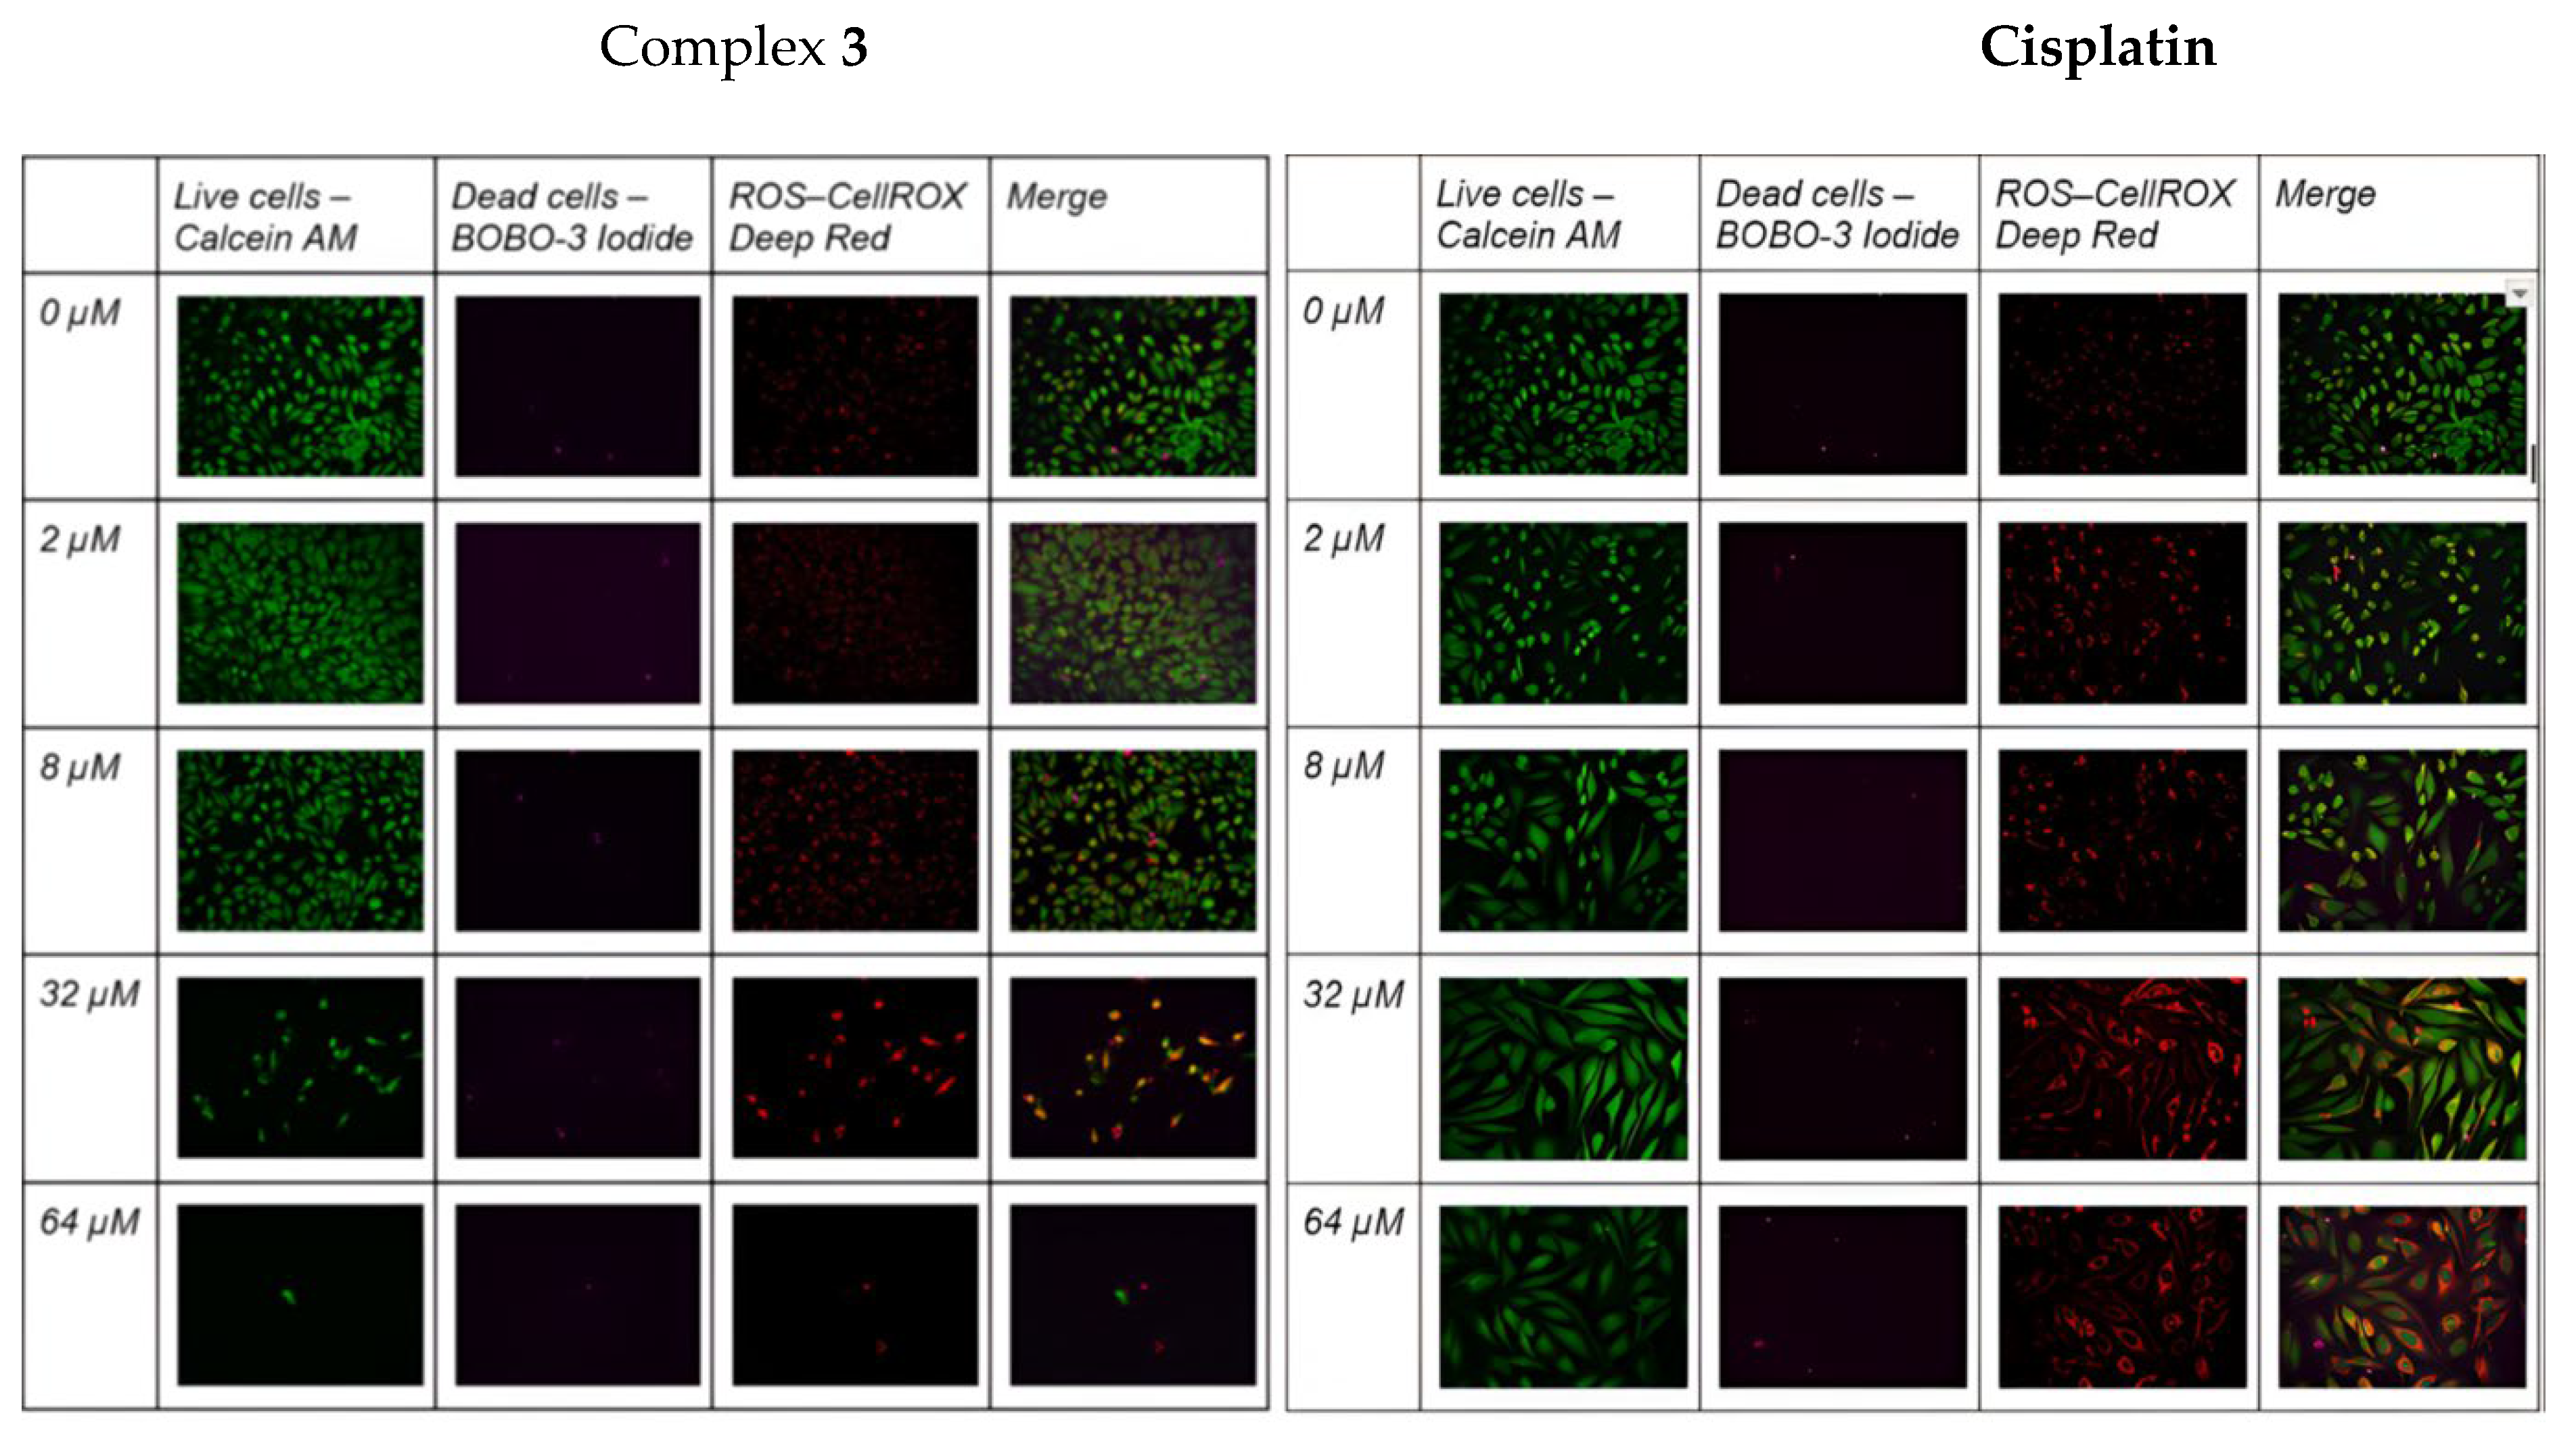

Table 1.
UV-Vis absorption maxima and related molar extinction coefficients of complexes 1-5.
| Complex | Absorption maxima λmax in nm (molar extinction coefficients ε in L.mol-1.cm-1) | ||
|---|---|---|---|
| λ1 | λ2 | λ3 | |
| 1 | 226 (49238) | 245 (34229) | 370 (3619) |
| 2 | 225 (66171) | 249 (44362) | 375 (4438) |
| 3 | 226 (49810) | n/a | 384 (3248) |
| 4 | 226 (32190) | n/a | 361 (2971) |
| 5 | 225 (n.d.) | 251 (34876) | 378 (3505) |
Table 2.
Crystallographic data, selected bond lengths and angles for complexes 2, 4, 5, 6 and 7.
| Complex label | 2 | 4 | 5 | 6 | 7 |
|---|---|---|---|---|---|
| Empirical formula | C24H27Cl4PRu | C46H76Cl4P2Ru2 | C50.5H53Cl5.06P2Ru2 | C72H76Cl4P4Ru2 | C72H72Cl4P4Ru2 |
| Temperature/K | 100.00(10) | 100.0(3) | 100.00(10) | 100.00 | 101(1) |
| Crystal system | triclinic | monoclinic | triclinic | monoclinic | monoclinic |
| Space group | P-1 | P21/c | P-1 | P21/n | P21/c |
| a/Å | 11.0487(3) | 21.3803(2) | 10.09180(10) | 12.59299(10) | 9.93542(4) |
| b/Å | 11.3414(3) | 15.64630(10) | 14.2482(2) | 17.95904(15) | 15.54235(7) |
| c/Å | 11.9805(3) | 13.87320(10) | 18.8810(3) | 15.11860(15) | 20.93213(10) |
| α/° | 80.712(2) | 90 | 73.7490(10) | 90 | 90 |
| β/° | 64.941(2) | 96.8390(10) | 85.0770(10) | 106.4350(9) | 98.6808(4) |
| γ/° | 63.925(2) | 90 | 87.0960(10) | 90 | 90 |
| Volume/Å3 | 1220.96(6) | 4607.88(6) | 2595.80(6) | 3279.49(5) | 3195.31(3) |
| Z | 2 | 4 | 2 | 2 | 2 |
| ρcalcg/cm3 | 1.603 | 1.492 | 1.412 | 1.427 | 1.460 |
| F(000) | 596.0 | 2152.0 | 1120.0 | 1448.0 | 1440.0 |
| Radiation | Mo Kα (λ = 0.71073) | Cu Kα (λ = 1.54184) | Cu Kα (λ = 1.54184) | Cu Kα (λ = 1.54184) | Cu Kα (λ = 1.54184) |
| 2Θ range for data collection/° | 5.404 to 66.184 | 7.018 to 159.982 | 6.464 to 160.496 | 7.836 to 159.388 | 8.546 to 160.628 |
| Index ranges | -16 ≤ h ≤ 16, -17 ≤ k ≤ 16, -18 ≤ l ≤ 17 | -19 ≤ h ≤ 26, -19 ≤ k ≤ 19, -17 ≤ l ≤ 17 | -12 ≤ h ≤ 12, -16 ≤ k ≤ 18, -23 ≤ l ≤ 24 | -11 ≤ h ≤ 15, -22 ≤ k ≤ 22, -19 ≤ l ≤ 18 | -11 ≤ h ≤ 12, -19 ≤ k ≤ 18, -26 ≤ l ≤ 26 |
| Reflections collected | 44250 | 80964 | 67005 | 70878 | 71850 |
| Independent reflections | 8266 [Rint = 0.0391, Rsigma = 0.0320] | 9882 [Rint = 0.0417, Rsigma = 0.0231] | 11124 [Rint = 0.0396, Rsigma = 0.0283] | 7093 [Rint = 0.0577, Rsigma = 0.0250] | 6989 [Rint = 0.0473, Rsigma = 0.0233] |
| Data/restraints/parameters | 8266/0/278 | 9882/0/493 | 11124/0/567 | 7093/0/374 | 6989/0/374 |
| Goodness-of-fit on F2 | 1.051 | 1.056 | 1.045 | 1.125 | 1.057 |
| Final R indexes [I>=2σ (I)] | R1 = 0.0273, wR2 = 0.0586 | R1 = 0.0378, wR2 = 0.0976 | R1 = 0.0360, wR2 = 0.0914 | R1 = 0.0363, wR2 = 0.0916 | R1 = 0.0261, wR2 = 0.0649 |
| Final R indexes [all data] | R1 = 0.0327, wR2 = 0.0602 | R1 = 0.0401, wR2 = 0.0989 | R1 = 0.0386, wR2 = 0.0930 | R1 = 0.0367, wR2 = 0.0919 | R1 = 0.0264, wR2 = 0.0651 |
| Largest diff. peak/hole / eÅ-3 | 0.90/-0.73 | 1.09/-1.59 | 1.95/-1.08 | 1.30/-1.42 | 0.84/-0.49 |
| Selected bond lengths (Å) | |||||
| Ru1-Cl1 | 2.4070(4) | 2.4181(7) | 2.4043(8) | 2.4157(6) | 2.4027(4) |
| Ru1-Cl2 | 2.4121(4) | 2.4266(7) | 2.4177(8) | 2.4157(6) | 2.4103(4) |
| Ru1-P1 | 2.3404(4) | 2.3946(7) | 2.3578(7) | 2.3537(6) | 2.3490(4) |
| P1-C23 | 1.8189(14) | 1.852(3) | 1.835(3) | 1.834(3) | 1.8113(18) |
| C23-C231 a | 1.334(3) | 1.522(5) | n/a | n/a | n/a |
| C23-C24 b | n/a | n/a | n/a | 1.532(3) | 1.324(3) |
| C24-P2 b | n/a | n/a | n/a | 1.860(3) | 1.8244(18) |
| Selected bond angles (°) | |||||
| Cl1-Ru1-Cl2 | 87.967(13) | 86.48(3) | 89.30(3) | 88.36(2) | 88.846(15) |
| Cl2-Ru1-P1 | 83.734(12) | 87.38(2) | 90.07(3) | 88.69(2) | 84.707(15) |
| P1-Ru1-Cl1 | 85.914(13) | 87.88(2) | 85.44(3) | 82.97(2) | 83.944(14) |
| Ru1-P1-C23 | 116.33(5) | 110.53(9) | 121.75(9) | 113.35(8) | 112.60(6) |
a Applicable to complexes 2 and 4 only. b Applicable to complexes 6 and 7 only.
Table 3.
IC50 values (µM) for cisplatin and complexes 1 – 5 calculated in Hela and Ect1/E6E7cells using Presto Blue assays after 72 h exposure. Data are presented as mean ± SD (standard deviation) (n = 3).
Table 3.
IC50 values (µM) for cisplatin and complexes 1 – 5 calculated in Hela and Ect1/E6E7cells using Presto Blue assays after 72 h exposure. Data are presented as mean ± SD (standard deviation) (n = 3).
| Drug | HeLa | Ect1/E6E7 |
|---|---|---|
| Cisplatin | 35.62 ± 7.47 | 8.46 ± 0.32 |
| 1 | > 80 | > 80 |
| 2 | 73.73 ± 16.05 | 38.95 ± 1.89 |
| 3 | 23.32 ± 1.27 | 5.55 ± 0.16 |
| 4 | 73.34 ± 5.21 | 77.92 ± 9.50 |
| 5 | 27.59 ± 0.61 | 7.98 ± 0.31 |
Disclaimer/Publisher’s Note: The statements, opinions and data contained in all publications are solely those of the individual author(s) and contributor(s) and not of MDPI and/or the editor(s). MDPI and/or the editor(s) disclaim responsibility for any injury to people or property resulting from any ideas, methods, instructions or products referred to in the content. |
© 2026 by the authors. Licensee MDPI, Basel, Switzerland. This article is an open access article distributed under the terms and conditions of the Creative Commons Attribution (CC BY) license (http://creativecommons.org/licenses/by/4.0/).
Copyright: This open access article is published under a Creative Commons CC BY 4.0 license, which permit the free download, distribution, and reuse, provided that the author and preprint are cited in any reuse.


