

Submitted:
27 June 2026
Posted:
29 June 2026
You are already at the latest version
Abstract
(1) Background: Climate change is reducing the climatic windows in which outdoor sport and physical activity can be safely practised. Yet it remains unclear whether this emerging burden is distributed evenly across countries, or whether it is concentrated on populations with lower adaptive capacity. Here we assess the country-level distribution of sport-relevant heat stress along the socio-economic vulnerability gradient. (2) Methods: Within an explicit hazard--exposure--vulnerability framework, we combine reconstructed afternoon Wet-Bulb Globe Temperature (WBGT) exceedance from bias-corrected CMIP6 projections (NEX-GDDP, five-model ensemble) with SSP-consistent gridded population and a published national vulnerability index (GVI). Two internally coherent futures (SSP1-2.6 and SSP2-4.5, each paired with its corresponding socio-economic pathway) are evaluated at mid-century (2055) and late century (2085). Population-weighted exposure is aggregated at country level, and its concentration along the vulnerability gradient is quantified using a concentration index (CI). (3) Results: The exposure burden is concentrated on more vulnerable countries in all scenario--horizon--threshold combinations (CI $>$ 0; 0.09–0.25). At mid-century, heat severity further amplifies this inequity: under SSP1-2.6 in 2055, the CI rises from 0.17 for WBGT \(\geq\) 28~$^\circ$C to 0.25 for WBGT \(\geq\) 32~$^\circ\(C, indicating that the most severe sport-relevant heat is disproportionately located in vulnerable countries. By 2085, about 4.5 billion people live in cells experiencing at least 30 days yr\)^{-1}$ with WBGT \(\geq\) 32~$^\circ$C under SSP2-4.5, compared with 2.3 billion under SSP1-2.6. (4) Conclusions: The climatic erosion of safe outdoor sport and physical activity is structurally inequitable. The sustainable pathway reduces both heat hazard and population exposure, highlighting the joint importance of mitigation, development and equity-aware adaptation for preserving access to safe outdoor activity.
Keywords:
heat stress
; wet-bulb globe temperature
; outdoor sport
; climate vulnerability
; CMIP6
; population exposure
; environmental justice
; concentration index
; SSP
; adaptation
1. Introduction
Heat is a first-order constraint on outdoor sport and physical activity. Elevated air temperature and humidity impair thermoregulation, degrade performance and, beyond critical thresholds, become life-threatening: weather conditions measurably slow endurance events [1], heatwaves strain the cardiovascular system [2], and exertional heat illness remains a recurrent cause of death among athletes [3], and major sporting events are increasingly planned around extreme-heat risk for athletes and spectators alike [4,5]. As the climate warms, the conditions under which outdoor sport can be safely practised are therefore being eroded—not as an occasional disruption, but as a progressively structural feature of the sporting calendar.
To represent this combined thermal load, the Wet-Bulb Globe Temperature (WBGT) has become the reference index in occupational, military and athletic guidelines, because it integrates temperature, humidity, radiation and wind into a single operationally meaningful quantity [6]. WBGT underpins the heat-policy thresholds of major sport federations, which escalate from activity modification to outright suspension as conditions worsen, and the index responds differently in hot–dry versus warm–humid environments, so that the same air temperature can carry very different physiological cost [7]; beyond a point, heat stress becomes uncompensable even for fit individuals exercising at moderate intensity [8]. Crucially, WBGT-based constraints are projected to expand markedly under future warming, pushing outdoor conditions toward physiologically hazardous regimes across large parts of the globe [9,10].
A large literature has quantified how many people will be exposed to extreme heat as the climate warms. Global assessments project a rapid rise in humid-heat stress [11], sharp increases in population exposure in the United States [12] and Africa [13], and—most strikingly—that a majority of the urban world will face dangerous heat within decades [14]. These studies establish the magnitude of the exposed population, but they treat that population as an undifferentiated total: they answer “how many”, not “who”.
Yet exposure to heat is not borne equally. At the city scale, a now-substantial body of work shows that heat falls disproportionately on disadvantaged populations: urban heat-island intensity is systematically higher in lower-income and historically marginalised neighbourhoods [15,16], and extreme humid-heat events disproportionately affect the most exposed communities [17], and exposure rises fastest for demographically vulnerable groups such as older adults [18]. This unequal distribution has been framed as a matter of climate justice and human rights [19]. At the international scale, the capacity to cope with such hazards is itself unevenly distributed, and is captured by national-level determinants of vulnerability and adaptive capacity [20,21]. To date, however, this distributional lens has been applied to mortality, labour and urban heat—not to the loss of safe conditions for sport and outdoor physical activity, and not at the global, country-resolved scale.
The intersection of sport, heat and climate projections remains comparatively sparse, and where it exists it has focused on where activity should be located: recent work asks where major sporting events should be held under global warming, using WBGT from downscaled CMIP6 projections [22]. That question is logically prior to, but distinct from, the one we pose here. We do not ask where a single event should go; we ask how the emerging burden of sport-relevant heat is distributed across countries of differing socio-economic vulnerability, and whether that distribution is equitable. In other words, we move from the magnitude of exposure to its concentration along the vulnerability gradient.
Importantly, the sport lens used here is population-based rather than event- or athlete-based. We do not estimate the realised exposure of elite athletes, organised competitions or specific sport calendars. Instead, we quantify the resident population potentially exposed to climatic conditions that constrain safe outdoor sport and physical activity, using WBGT thresholds that are operationally meaningful for heat management in outdoor exercise. This distinction matters for equity: in countries with lower adaptive capacity, the same heat-stress hazard may translate more directly into lost opportunities for school sport, youth sport, community sport and everyday physical activity, because protective infrastructure, medical supervision, shaded or indoor facilities, and scheduling flexibility are less widely available.
Here we couple this sport-relevant heat hazard—afternoon WBGT exceedance from bias-corrected CMIP6 projections—with gridded population and with a published, externally validated national vulnerability index, within an explicit hazard–exposure–vulnerability framework. Working at country level under two internally coherent Shared Socioeconomic Pathways and two future horizons, we ask three questions. First, is the exposure burden concentrated on the more vulnerable countries, and by how much? Second, does the severity of the heat threshold itself modulate that concentration—that is, does a more dangerous level of heat fall disproportionately on the vulnerable, independently of how vulnerability is measured? Third, to what extent does the sustainable pathway relieve hazard and exposure jointly? By answering these, we provide a transparent, reproducible and equity-aware basis for adaptation planning in sport and outdoor physical activity.
2. Materials and Methods
2.1. Overview: A Hazard–Exposure–Vulnerability Framework
We quantify the socio-economic distribution of sport-relevant heat exposure within an explicit hazard (A) × exposure (E) × vulnerability (V) framework. The hazard is the annual frequency of afternoon Wet-Bulb Globe Temperature (WBGT) exceedance derived from bias-corrected CMIP6 projections; exposure is the gridded population coincident with that hazard; and vulnerability is a published, externally validated national index. The single grid-cell operation is the product of population and hazard, yielding a person-days burden that is summed to country level; vulnerability is then introduced as the axis along which that burden is ranked, never as a third multiplicative grid layer. Two internally coherent futures (SSP1-2.6 and SSP2-4.5, each combining a climate forcing with its own socio-economic pathway) are assessed at a mid-century (2055) and a late-century (2085) horizon.
2.2. Climate Hazard (A)
The afternoon WBGT hazard is computed following the multi-hazard framework established in our companion global assessment of climate risks for outdoor sport [23]. In brief, daily fields are taken from the bias-corrected, statistically downscaled NASA NEX-GDDP-CMIP6 archive at 0.25° resolution [24], and afternoon WBGT is reconstructed from daily maximum temperature with relative humidity made consistent with the temperature peak, combining the wet-bulb approximation of Stull [25] with a radiative globe-temperature term. A five-model ensemble (GFDL-ESM4, IPSL-CM6A-LR, MPI-ESM1-2-HR, MRI-ESM2-0, UKESM1-0-LL) is used, selected to span the documented range of climate sensitivity following the ISIMIP protocol; we refer the reader to [23] for the full WBGT formulation, model-selection rationale and ensemble evaluation.
Two features are specific to the present study. First, we use the reconstructed afternoon WBGT, defined around the daily thermodynamic peak, as a globally consistent screening metric for the period of the day when heat policies most commonly become operationally relevant. This choice avoids introducing additional assumptions about local event schedules or solar-time reconstruction, while retaining the heat-stress conditions most relevant to outdoor sport and physical activity. Second, rather than a single threshold, we sweep three WBGT severity levels: ≥28, ≥30 and ≥32 ∘C. Their sport-policy interpretation is detailed in Section 2.3. These thresholds are not interpreted as universal physiological limits for all sports or all individuals. Rather, they provide harmonised severity levels that approximate the escalation from heat-management conditions to high-risk and suspension-level outdoor activity constraints across sport heat policies. For each ensemble-mean field the hazard in grid cell i is the annual-mean number of exceedance days, obtained as the sum of the monthly exceedance counts over each 30-year window divided by the number of years. Hazard is evaluated over two climatological windows, 2041–2070 and 2071–2100, hereafter referred to by their central years 2055 and 2085.
We analyse two emission pathways, SSP1-2.6 and SSP2-4.5. SSP5-8.5 is deliberately excluded: the socio-economic vulnerability projections used below (Section 2.5) are not provided for SSP5, and restricting the analysis to the low and intermediate pathways keeps each future internally consistent across hazard, exposure and vulnerability while remaining within the range of plausible emission trajectories.
2.3. Sport Relevance of the WBGT Thresholds
WBGT is used here as an environmental severity metric for outdoor sport and physical activity, not as a direct prediction of individual heat strain. Its relevance comes from its operational use in sport heat policies, because it integrates air temperature, humidity, radiation and wind into a single index that can be linked to activity modification, additional rest, cooling strategies, rescheduling or cancellation [5,6,26]. Recent reviews of International Federation policies show that WBGT, or closely related thermal indices, are widely used to assess heat-related risk in outdoor and endurance sports [26]. In professional football, for example, proposed heat-protection guidance recommends cooling breaks above WBGT 26 ∘C and delay or postponement of matches above WBGT 28 ∘C [27]. Other sport organisations use comparable WBGT-based triggers for operational mitigation, such as mandatory hydration breaks around WBGT 30 ∘C in collegiate football/soccer contexts [28].
The thresholds used in this study should therefore be interpreted as harmonised severity levels rather than universal medical cut-offs. WBGT ≥ 28 ∘C marks conditions under which heat management becomes operationally relevant in several sport policies; WBGT ≥ 30 ∘C represents a high heat-stress level where substantial modification of outdoor activity may be required; and WBGT ≥ 32 ∘C is used as a severe, suspension-level screening threshold for many outdoor activities. This harmonised threshold set is appropriate for a global country-level assessment, but it does not imply that the same physiological limit applies to all sports, ages, acclimatisation states or environmental contexts. Indeed, sport-specific modelling indicates that upper thermal thresholds may differ substantially across activities and may need to be revised for some sports [29]. The purpose of the thresholds here is therefore to compare the geographical and socio-economic concentration of increasingly severe sport-relevant heat, not to prescribe event-specific cancellation rules.
2.4. Population Exposure (E)
Exposure is quantified from SSP-consistent gridded population projections at 1 km resolution [30]. We use the population counts of the SSP matching each climate pathway (SSP1 with SSP1-2.6, SSP2 with SSP2-4.5), sampled at the central year of each hazard window (2055, 2085), so that demography and climate co-evolve. Population counts are aggregated from their native 1 km grid up to the 0.25° hazard grid by summation; the coarser hazard grid is never downscaled, so no sub-grid precision is introduced. The exposure layer therefore gives, for every 0.25° cell, the number of people coincident with the hazard .
2.5. Socio-Economic Vulnerability (V)
Vulnerability is taken from the Global Vulnerability Index (GVI) Projections Database [31], which provides national values of a composite socio-economic vulnerability index (pgvi, 0–100, increasing with vulnerability) projected in five-year steps under the Shared Socioeconomic Pathways. The GVI summarises seven major socio-economic dimensions of vulnerability into a single number through an additive formula [31], building on the GDL Vulnerability Index, and is designed as a transparent, reproducible measure of the human components of vulnerability to climate change and other shocks. We deliberately adopt this published, validated index rather than constructing a bespoke one: it is broader and more transparent than an ad-hoc composite, and using an external reference avoids circularity between the vulnerability construct and our findings. The database provides projections in five-year steps for SSP1, SSP2 and SSP3; we use SSP1 and SSP2 to match our two climate pathways, matching national GVI values to each future by pathway and by horizon (2055, 2085). Because the GVI is national, it is joined to the analysis at country level only and is never projected onto the grid.
2.6. A×E×V Coupling and Country Aggregation
The hazard and exposure layers are combined through a single grid-cell multiplication,
where is the exposure burden in cell i, in person-days per year. Population is summed and the hazard is never summed; this product is the only multiplication in the workflow. Cells are then assigned to countries by rasterising national boundaries (Natural Earth, ADM0_A3 codes) onto the 0.25° grid, and the burden is aggregated to each country c,
where is the total burden (person-days) and the population-weighted per-capita exposure (days yr−1). As a complementary, threshold-based summary we also report the population in an “unsafe regime”, defined as residing in cells where days yr−1; the persistence threshold is set to 30 with 15 and 45 reported for sensitivity. Each country then carries two independent numbers, its exposure burden (from the grid) and its GVI (national), which are crossed in the following step.
2.7. Concentration of the Burden Along the Vulnerability Gradient
To measure how the exposure burden is distributed across socio-economic vulnerability we use a population-weighted concentration index (CI). Countries are ranked by GVI in ascending order (least to most vulnerable); each individual is assigned the GVI of their country, and we compare the cumulative share of the burden against the cumulative share of population along this ranking. The corresponding concentration curve lies on the 45° line under perfect proportionality and below it when the burden is disproportionately borne by the more vulnerable. The index is computed as
where is the per-capita exposure of country c, its population-weighted fractional rank in the GVI distribution, the population-weighted mean exposure, and the population-weighted covariance. By construction , with indicating that the burden is concentrated on the more vulnerable populations. The CI is computed for each scenario, horizon and WBGT severity level (28, 30, 32 °C), allowing us to test whether a more severe heat threshold concentrates the burden further on the vulnerable—a question that bears on the hazard itself and is independent of the vulnerability index.
All processing is implemented as a reproducible workflow; data sources, code and archived outputs are listed in the Data Availability Statement.
3. Results
3.1. Where Exposure and Vulnerability Coincide
Figure 1 crosses per-capita exposure (afternoon WBGT ≥ 32 °C) with national vulnerability across the two scenarios and horizons. Two gradients emerge: down each column the maps darken from mid- to late-century as exposure intensifies, and across the rows they lighten from SSP2-4.5 to SSP1-2.6. The darkest class—countries both highly exposed and highly vulnerable—concentrates in South Asia, the Sahel and sub-Saharan Africa. Under SSP2-4.5 at 2085, 32 countries fall jointly in the top exposure and top vulnerability terciles (India, Pakistan, Nigeria, Sudan, Niger, Bangladesh and a broad Sahelian belt), whereas the high-exposure Gulf and parts of East Asia carry lower vulnerability and the temperate high-income world remains in the lightest classes throughout.
The aggregate burden is dominated by the most populous exposed countries: under SSP2-4.5 at 2085, India alone accounts for ∼102 billion person-days yr−1 (mean 69 days yr−1 across 1.49 billion people), ahead of Pakistan (∼48 billion, 101 days yr−1) and Nigeria (∼39 billion). The vulnerability contrast within this group is itself informative (Table 1): several top-burden countries combine high exposure with high vulnerability (Sudan, Niger, GVI > 38), whereas others reach the list through population size at low vulnerability (the United States, GVI 16.7), illustrating why the concentration is strong but not total.
3.2. The Burden Is Concentrated on the More Vulnerable
Ranking the world’s population from the least to the most vulnerable country and accumulating the exposure burden yields the concentration curves of Figure 2. In all In all scenario–horizon–threshold combinations, the concentration index (CI) is positive, from 0.09 to 0.25 (Table 2), so that the burden of sport-relevant heat is concentrated on socio-economically vulnerable countries. For most futures the concentration curve lies below the line of equality throughout. The clear exception is the sustainable pathway at late century (SSP1-2.6, 2085), whose curve crosses the diagonal at all three severity levels: there the most vulnerable countries bear slightly less than their population share of the burden over part of the distribution, so that the low net CI (≈0.09) reflects partially offsetting segments rather than uniform proportionality. We therefore read the CI for that case alongside its curve rather than in isolation; the crossing is itself a consequence of the socio-economic trajectory discussed in Section 3.4. (A marginal crossing also occurs for SSP2-4.5 at 2055 under the most severe threshold, without materially affecting its positive CI.)
3.3. Severity Concentrates the Burden Further on the Vulnerable
At mid-century, and most clearly under the sustainable pathway, the concentration index rises with the severity of the WBGT threshold (Figure 3): under SSP1-2.6 at 2055, CI increases from 0.17 at WBGT ≥ 28 °C to 0.25 at ≥ 32 °C (a 44% increase), with the same direction under SSP2-4.5 (0.17 to 0.20). Because this gradient is produced by the physical hazard—the most extreme heat falling on the already-hot, already-vulnerable tropics—and not by any property of the vulnerability index, it is independent of the latter’s assumptions. The effect is horizon-dependent: by 2085 it flattens under SSP2-4.5 and reverses under SSP1-2.6 (CI from 0.10 to 0.09), where late-century development has lowered the vulnerability of the most-exposed countries so far that severe heat no longer coincides with the highest vulnerability (Table 2).
3.4. The Sustainable Pathway Relieves Hazard and Exposure Jointly
Figure 4 plots, per country, the reduction in hazard against the reduction in vulnerability obtained by moving from SSP2-4.5 to SSP1-2.6 at 2085. Most countries, and the largest populations in particular, lie in the upper-right quadrant: the sustainable pathway relieves both the climatic hazard and socio-economic vulnerability in the same country. The exposure difference is large—at 30 days yr−1 with WBGT ≥ 32 °C, about 4.5 billion people fall in an unsafe regime under SSP2-4.5 by 2085 versus 2.3 billion under SSP1-2.6—and robust to the persistence threshold (Figure 5): the ordering and the magnitude of the gap are preserved at 15 and 45 days yr−1.
4. Discussion
4.1. The Erosion of Safe Outdoor Activity Is Structurally Inequitable
Most assessments of future heat exposure quantify how many people will face dangerous conditions [12,13,14]; our results show that, for sport-relevant heat, this burden is not distributed at random but follows the socio-economic vulnerability gradient. In every scenario and horizon the concentration index is positive: the countries least equipped to adapt bear more than their demographic share of the exposure. This reframes the climatic erosion of safe outdoor activity as a distributional, not merely a quantitative, problem—an instance of the broader pattern documented for urban heat and mortality, where exposure falls disproportionately on disadvantaged populations [15,16,17], and consistent with framings of climate change as a matter of justice and human rights [19]. To our knowledge this is the first global, country-resolved demonstration of that inequity for outdoor sport and physical activity.
4.2. A Hazard-Driven Mechanism, Independent of the Vulnerability Metric
The most novel result is that the severity of the heat threshold itself modulates the concentration. At mid-century the burden concentrates further on the vulnerable as the WBGT threshold rises from 28 to 32 °C. This gradient is generated by the physical hazard rather than by the vulnerability construct: the most extreme afternoon WBGT values occur preferentially in the humid tropics, where near-surface moisture rises with temperature following approximately Clausius–Clapeyron scaling [32], and where work capacity collapses fastest as WBGT increases [10]. Because the most severe, federation-relevant heat [26] selects precisely the already-hot, already-vulnerable regions, the concentration sharpens with severity for reasons that are external to the index used to measure vulnerability. This independence matters: a recurring critique of vulnerability-weighted risk assessments is that the socio-economic input drives the result; here the severity gradient is robust to that concern because it is a property of the hazard.
4.3. Development Can Decouple Exposure from Vulnerability
The severity effect is not universal: by late century it flattens under the intermediate pathway and reverses under the sustainable one, where the concentration curve crosses the line of equality. This reversal is not an artefact but a meaningful signal. Under SSP1, the socio-economic trajectory embedded in the vulnerability projections lowers the vulnerability of the most-exposed tropical countries so far that the most severe heat no longer coincides with the highest vulnerability. In other words, sufficiently rapid and equitable development can decouple the physical exposure from socio-economic vulnerability, breaking the very concentration that the hazard would otherwise produce. The persistence of a high, stable concentration under SSP2-4.5, by contrast, indicates that middle-of-the-road development does not lower vulnerability fast enough to offset the intensifying hazard.
4.4. A Double Dividend of the Sustainable Pathway
These two levers—mitigation and development—act together rather than in competition. The country-level co-location of hazard relief and vulnerability relief under SSP1-2.6 shows that, for most of the world’s population, the sustainable pathway reduces both the climatic hazard and socio-economic vulnerability in the same place. The exposure difference is large: roughly 2.2 billion fewer people in an unsafe regime by 2085 relative to SSP2-4.5. This is consistent with evidence that limiting warming substantially lowers the rise in heat-related inequalities [33], and it reframes mitigation not as a trade-off against development but as a co-benefit for the populations whose adaptive capacity is lowest [20,21]. For sport and outdoor physical activity specifically, the implication is that the feasibility of safe outdoor practice in the most vulnerable countries is far more sensitive to the emission and development pathway than aggregate exposure counts alone would suggest.
4.5. What This Study Adds, and What It Does Not Claim
Our hazard and exposure layers are, deliberately, not sport-specific: afternoon WBGT exceedance and gridded population are also relevant to outdoor labour and to outdoor life in general, and relate to broader human-relevant thermal constraints addressed elsewhere [34]. What makes the present framing one of sport and physical activity is the use of federation suspension thresholds as the hazard levels [23,26], and the focus on the general population’s access to safe outdoor practice, in line with the universal public-health rationale for physical activity, rather than on elite athletes. This population-based reading is a strength for an equity question—it asks who loses access to safe outdoor activity—but it should not be read as an estimate of athlete exposure. Our contribution is also distinct from the prior sport–climate literature, which has asked where events should be located under warming [22]: we ask instead how the emerging burden is distributed across countries of differing vulnerability, and whether that distribution is equitable. It builds on, rather than repeats, our multi-hazard mapping of outdoor sport risk [23] by adding the distributional, vulnerability-ranked dimension.
4.6. Limitations
Several limitations bound these results. First, the vulnerability index is national, so within-country inequality—which can be large—is not resolved; a wealthy and a poor resident of the same country share its GVI, and the concentration we report is therefore a between-country lower bound on total inequity. Second, the WBGT hazard is reconstructed from daily-resolution CMIP6 variables using the radiative WBGT approximation described and evaluated in Defrance and Lescure [23], rather than computed from fully hourly, site-specific meteorological observations. Absolute exceedance counts should therefore be interpreted as screening-level estimates, especially where sub-daily radiation, wind and humidity cycles are important, although the relative, rank-based concentration results are less sensitive to a systematic reconstruction bias that shifts countries in a broadly comparable way. Third, exposure is computed for the resident population coincident with the hazard, not for actual participants in outdoor sport or physical activity; it measures potential exposure to unsafe outdoor conditions, not realised athletic exposure. Fourth, the analysis is restricted to SSP1-2.6 and SSP2-4.5 because the vulnerability projections are not available for SSP5, so the high-end pathway is not assessed. Finally, where the concentration curve crosses the line of equality (SSP1-2.6, late century), the single concentration index nets offsetting segments and must be read together with its curve rather than in isolation.
5. Conclusions
This study shows that the climatic erosion of safe conditions for outdoor sport and physical activity is not only increasing in magnitude, but is also distributed inequitably. By combining a sport-relevant afternoon WBGT hazard with gridded population and a published national vulnerability index, we show that future heat-stress exposure is systematically concentrated on countries with higher socio-economic vulnerability. This concentration is observed across scenarios, horizons and WBGT thresholds, indicating that the emerging burden is not randomly distributed across the global population.
A central result is that heat severity matters for inequality. At mid-century, the burden becomes more concentrated on vulnerable countries as the WBGT threshold rises from moderate to severe levels. This pattern is driven by the physical geography of the hazard itself: the most dangerous heat-stress regimes increasingly select already-hot regions where vulnerability and adaptive constraints remain high. The inequity documented here is therefore not simply an artefact of applying a vulnerability index after the fact; it is partly produced by where the most severe sport-relevant heat emerges.
For sport and physical activity, the implication is that climate change threatens more than the scheduling of elite events. It also threatens everyday access to safe outdoor practice, including school sport, youth sport, community sport and informal physical activity. Countries with lower adaptive capacity are less able to buffer heat exposure through shaded or indoor facilities, medical supervision, cooling infrastructure, formal heat policies or flexible scheduling. The same WBGT exceedance may therefore translate into a greater loss of practicable outdoor conditions where sport and public-health co-benefits are already least protected.
The comparison between SSP1-2.6 and SSP2-4.5 further shows that mitigation and development are complementary levers. The sustainable pathway reduces both the physical hazard and socio-economic vulnerability in many of the same countries, and substantially lowers the population living in unsafe heat-stress regimes by late century. Conversely, the intermediate pathway leaves a larger population exposed and maintains a stronger concentration of the burden on vulnerable countries. Preserving safe outdoor sport and physical activity therefore requires not only local heat adaptation, but also broader mitigation and development pathways that reduce the structural conditions under which heat becomes inequitable.
Funding
This research received no external funding.
Data Availability Statement
The code used to produce the WBGT exceedance fields, country-level exposure tables and concentration indices is archived on GitHub/Zenodo at https://doi.org/10.5281/zenodo.20932321. The derived data used in this article are archived on Zenodo at DOI: https://doi.org/10.5281/zenodo.20944348. The data archive includes gridded WBGT exceedance climatologies for thresholds of 28, 30 and 32 ∘C under SSP1-2.6 and SSP2-4.5 for the 2041–2070 and 2071–2100 windows, reported as five-model ensemble mean, minimum and maximum, together with the country-level exposure and concentration-index tables required to reproduce the main figures and tables.
Acknowledgments
The author acknowledges the data providers whose open datasets made this analysis possible, including the NASA NEX-GDDP-CMIP6 archive, the SSP-consistent gridded population projections, the Global Vulnerability Index Projections Database, and Natural Earth country boundary data. The author also acknowledges the developers and maintainers of the open-source software used for climate-data processing, spatial analysis and visualisation. During the preparation of this manuscript, the author used OpenAI’s ChatGPT for language editing and
editorial assistance. The author reviewed and edited all outputs and takes full responsibility for the content of the
manuscript.
Conflicts of Interest
The author declares no conflicts of interest.
References
- Ely, M.R.; Cheuvront, S.N.; Roberts, W.O.; Montain, S.J. Impact of weather on marathon-running performance. Med. Sci. SPORTS Exerc. 2007, 39, 487–493. [Google Scholar] [CrossRef] [PubMed]
- Kenney, W.L.; Craighead, D.H.; Alexander, L.M. Heat Waves, Aging, and Human Cardiovascular Health. Med. Sci. SPORTS Exerc. 2014, 46, 1891–1899. [Google Scholar] [CrossRef] [PubMed]
- Grundstein, A.J.; Ramseyer, C.; Zhao, F.; Pesses, J.L.; Akers, P.; Qureshi, A.; Becker, L.; Knox, J.A.; Petro, M. A retrospective analysis of American football hyperthermia deaths in the United States. Int. J. Biometeorol. 2012, 56, 11–20. [Google Scholar] [CrossRef] [PubMed]
- Kakamu, T.; Wada, K.; Smith, D.R.; Endo, S.; Fukushima, T. Preventing heat illness in the anticipated hot climate of the Tokyo 2020 Summer Olympic Games. Environ. HEALTH Prev. Med. 2017, 22. [Google Scholar] [CrossRef] [PubMed]
- Vanos, J.K.; Kosaka, E.; Iida, A.; Yokohari, M.; Middel, A.; Scott-Fleming, J.; Brown, R.D. Planning for spectator thermal comfort and health in the face of extreme heat: The Tokyo 2020 Olympic marathons. Sci. Total. Environ. 2019, 657, 904–917. [Google Scholar] [CrossRef] [PubMed]
- Epstein, Y.; Moran, D.S. Thermal comfort and the heat stress indices. Ind. HEALTH 2006, 44, 388–398. [Google Scholar] [CrossRef] [PubMed]
- Vanos, J.K.; Grundstein, A.J. Variations in Athlete Heat-Loss Potential Between Hot-Dry and Warm-Humid Environments at Equivalent Wet-Bulb Globe Temperature Thresholds. J. Athl. Train. 2020, 55, 1190–1198. [Google Scholar] [CrossRef] [PubMed]
- Montain, S.; Sawka, M.; Cadarette, B.; Quigley, M.; McKay, J. PHYSIOLOGICAL TOLERANCE TO UNCOMPENSABLE HEAT-STRESS - EFFECTS OF EXERCISE INTENSITY, PROTECTIVE CLOTHING, AND CLIMATE. J. Appl. Physiol. 1994, 77, 216–222. [Google Scholar] [CrossRef] [PubMed]
- Hall, A.; Horta, A.; Khan, M.R.; Crabbe, R.A. Spatial analysis of outdoor wet bulb globe temperature under RCP4.5 and RCP8.5 scenarios for 2041-2080 across a range of temperate to hot climates. WEATHER Clim. Extrem. 2022, 35. [Google Scholar] [CrossRef]
- Foster, J.; Smallcombe, J.W.; Hodder, S.; Jay, O.; Flouris, A.D.; Havenith, G. Quantifying the impact of heat on human physical work capacity; part II: The observed interaction of air velocity with temperature, humidity, sweat rate, and clothing is not captured by most heat stress indices. Int. J. Biometeorol. 2022, 66, 507–520. [Google Scholar] [CrossRef] [PubMed]
- Coffel, E.D.; Horton, R.M.; de Sherbinin, A. Temperature and humidity based projections of a rapid rise in global heat stress exposure during the 21st century. Environ. Res. Lett. 2018, 13. [Google Scholar] [CrossRef] [PubMed]
- Jones, B.; O’Neill, B.C.; McDaniel, L.; McGinnis, S.; Mearns, L.O.; Tebaldi, C. Future population exposure to US heat extremes. Nat. Clim. Chang. 2015, 5, 652–655. [Google Scholar] [CrossRef]
- Iyakaremye, V.; Zeng, G.; Yang, X.; Zhang, G.; Ullah, I.; Gahigi, A.; Vuguziga, F.; Asfaw, T.G.; Ayugi, B. Increased high-temperature extremes and associated population exposure in Africa by the mid-21st century. Sci. TOTAL Environ. 2021, 790. [Google Scholar] [CrossRef] [PubMed]
- Tuholske, C.; Caylor, K.; Funk, C.; Verdin, A.; Sweeney, S.; Grace, K.; Peterson, P.; Evans, T. Global urban population exposure to extreme heat. PROCEEDINGS OF THE NATIONAL ACADEMY OF SCIENCES OF THE UNITED STATES OF AMERICA 2021, 118. [Google Scholar] [CrossRef] [PubMed]
- Hsu, A.; Sheriff, G.; Chakraborty, T.; Manya, D. Disproportionate exposure to urban heat island intensity across major US cities. Nat. Commun. 2021, 12. [Google Scholar] [CrossRef] [PubMed]
- Chakraborty, T.; Hsu, A.; Manya, D.; Sheriff, G. Disproportionately higher exposure to urban heat in lower-income neighborhoods: A multi-city perspective. Environ. Res. Lett. 2019, 14. [Google Scholar] [CrossRef]
- Rogers, C.D.W.; Ting, M.; Li, C.; Kornhuber, K.; Coffel, E.D.; Horton, R.M.; Raymond, C.; Singh, D. Recent Increases in Exposure to Extreme Humid-Heat Events Disproportionately Affect Populated Regions. Geophys. Res. Lett. 2021, 48. [Google Scholar] [CrossRef]
- Falchetta, G.; De Cian, E.; Wing, I.S.; Carr, D. Global projections of heat exposure of older adults. Nat. Commun. 2024, 15. [Google Scholar] [CrossRef] [PubMed]
- Levy, B.S.; Patz, J.A. Climate Change, Human Rights, and Social Justice. Ann. Glob. HEALTH 2015, 81, 310–322. [Google Scholar] [CrossRef] [PubMed]
- Brooks, N.; Adger, W.; Kelly, P. The determinants of vulnerability and adaptive capacity at the national level and the implications for adaptation. Glob. Environ. CHANGE-Hum. POLICY Dimens. 2005, 15, 151–163. [Google Scholar] [CrossRef]
- Adger, W. Social capital, collective action, and adaptation to climate change. ECONOMIC GEOGRAPHY Biennial Congress of the International-Society-for-Ecological-Economics, SOUSSE, TUNISIA, MAR, 2003; 79, pp. 387–404. [Google Scholar]
- Sawadogo, W.; Bliefernicht, J.; Faye, A.; Kunstmann, H. Where should sports events be held under global warming? A case study of the African Cup of Nations. Sustain. CITIES Soc. 2025, 119. [Google Scholar] [CrossRef]
- Defrance, D.; Lescure, T. Global climate risks for outdoor sports under CMIP6 scenarios: A multi-indicator assessment based on WBGT, Heat Index, heavy rainfall, and heatwaves. PLoS Clim. 2026, 5, e0000969. [Google Scholar] [CrossRef]
- Thrasher, B.; Wang, W.; Michaelis, A.; Melton, F.; Lee, T.; Nemani, R. NASA Global Daily Downscaled Projections, CMIP6. Sci. Data 2022, 9, 262. [Google Scholar] [CrossRef] [PubMed]
- Stull, R. Wet-Bulb Temperature from Relative Humidity and Air Temperature. J. Appl. Meteorol. Climatol. 2011, 50, 2267–2269. [Google Scholar] [CrossRef]
- Bandiera, D.; Racinais, S.; Garrandes, F.; Adami, P.E.; Bermon, S.; Pitsiladis, Y.P.; Tessitore, A. Heat-related risk at Paris 2024: A proposal for classification and review of International Federations policies. Br. J. Sports Med. 2024, 58, 860–869. [Google Scholar] [CrossRef] [PubMed]
- Gouttebarge, V.; Duffield, R.; den Hollander, S.; Maughan, R. Protective guidelines and mitigation strategies for hot conditions in professional football: Starting 11 Hot Tips for consideration. BMJ Open Sport Exerc. Med. 2023, 9, e001608. [Google Scholar] [CrossRef] [PubMed]
- NCAA. Hydration breaks approved in men’s and women’s soccer, 2019. NCAA Playing Rules Oversight Panel rule announcement. 23 April 2019. [Google Scholar] [PubMed]
- Oyama, T.; Fujii, M.; Nakajima, K.; Takakura, J.; Hijioka, Y. Validation of upper thermal thresholds for outdoor sports using thermal physiology modelling. Temperature 2024, 11, 92–106. [Google Scholar] [CrossRef] [PubMed]
- Bondarenko, M.; Tejedor-Garavito, N.; Priyatikanto, R.; Zhang, W.; Fang, W.; Nosatiuk, B.; Gaskell, J.; McKeen, T.; Noi, E.; Hilton, J.; et al. Global 1km-grid population projections for 2025–2100 consistent with the Shared Socioeconomic Pathways national population projections, version 0.2, 2025. Dataset. [CrossRef]
- Huisman, J.; Martyr, R.; Rott, R.; Smits, J. Projections of climate change vulnerability along the Shared Socioeconomic Pathways 2020–2100. Sci. Data 2025, 12, 1527. [Google Scholar] [CrossRef] [PubMed]
- Buzan, J.R.; Huber, M. Moist Heat Stress on a Hotter Earth. Annu. Rev. Earth Planet. Sci. 2020, 48, 623–655. [Google Scholar] [CrossRef]
- Shiogama, H.; Hasegawa, T.; Fujimori, S.; Murakami, D.; Takahashi, K.; Tanaka, K.; Emori, S.; Kubota, I.; Abe, M.; Imada, Y.; et al. Limiting global warming to 1.5 °C will lower increases in inequalities of four hazard indicators of climate change. Environ. Res. Lett. 2019, 14. [Google Scholar] [CrossRef]
- Lescure, T.; Defrance, D. Future heat-stress regimes under CMIP6: A multi-index assessment of persistence and human-relevant thermal constraints, 2026. Preprint, Version 1; Research Square. [CrossRef] [PubMed]
Figure 1.
Bivariate maps crossing per-capita exposure (afternoon WBGT ≥ 32 °C, days yr−1) with the national vulnerability index (GVI), by scenario (columns) and horizon (rows). The darkest class denotes countries both highly exposed and highly vulnerable.
Figure 1.
Bivariate maps crossing per-capita exposure (afternoon WBGT ≥ 32 °C, days yr−1) with the national vulnerability index (GVI), by scenario (columns) and horizon (rows). The darkest class denotes countries both highly exposed and highly vulnerable.
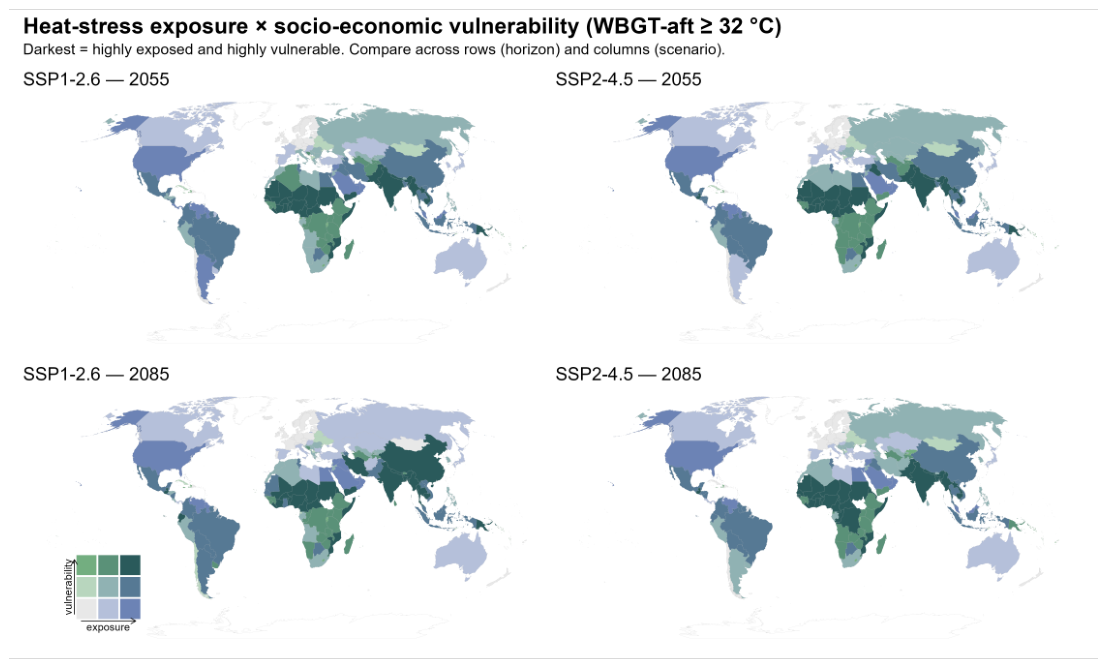
Figure 2.
Concentration curves of the exposure burden against population ranked by national vulnerability (least to most vulnerable), faceted by WBGT severity level. A curve below the dashed line of equality indicates a burden concentrated on the more vulnerable.
Figure 2.
Concentration curves of the exposure burden against population ranked by national vulnerability (least to most vulnerable), faceted by WBGT severity level. A curve below the dashed line of equality indicates a burden concentrated on the more vulnerable.
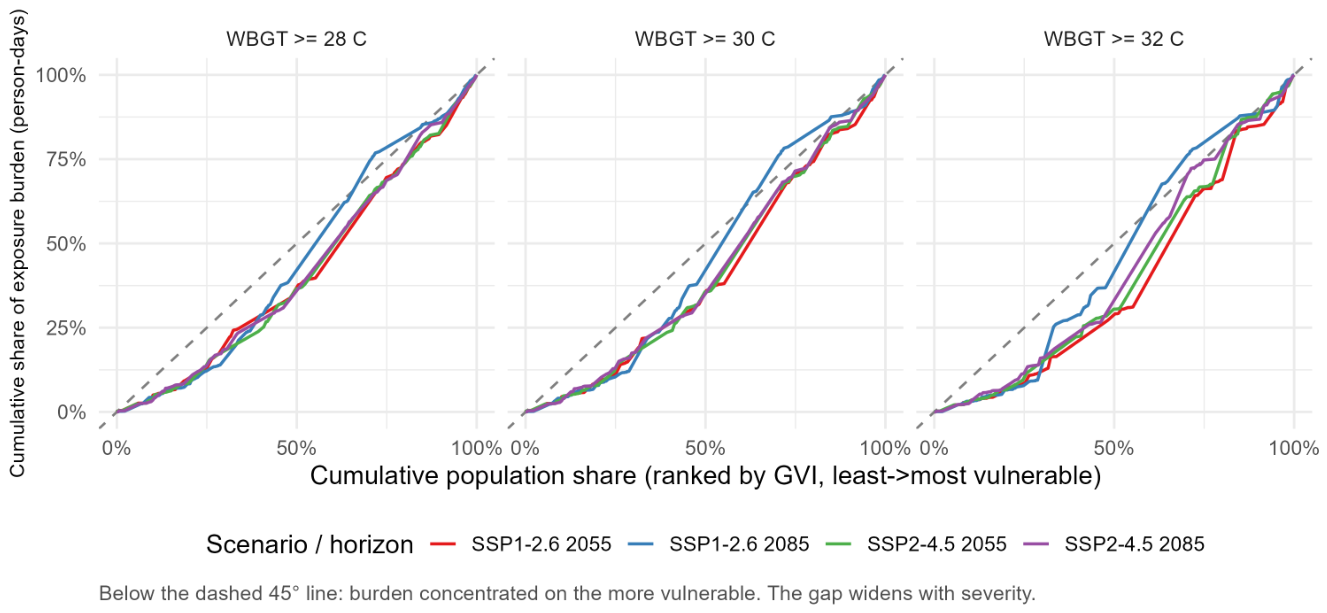
Figure 3.
Concentration index as a function of WBGT severity level, by scenario and horizon. A rising index with severity indicates a burden driven onto the vulnerable by the hazard itself, independent of the vulnerability index.
Figure 3.
Concentration index as a function of WBGT severity level, by scenario and horizon. A rising index with severity indicates a burden driven onto the vulnerable by the hazard itself, independent of the vulnerability index.
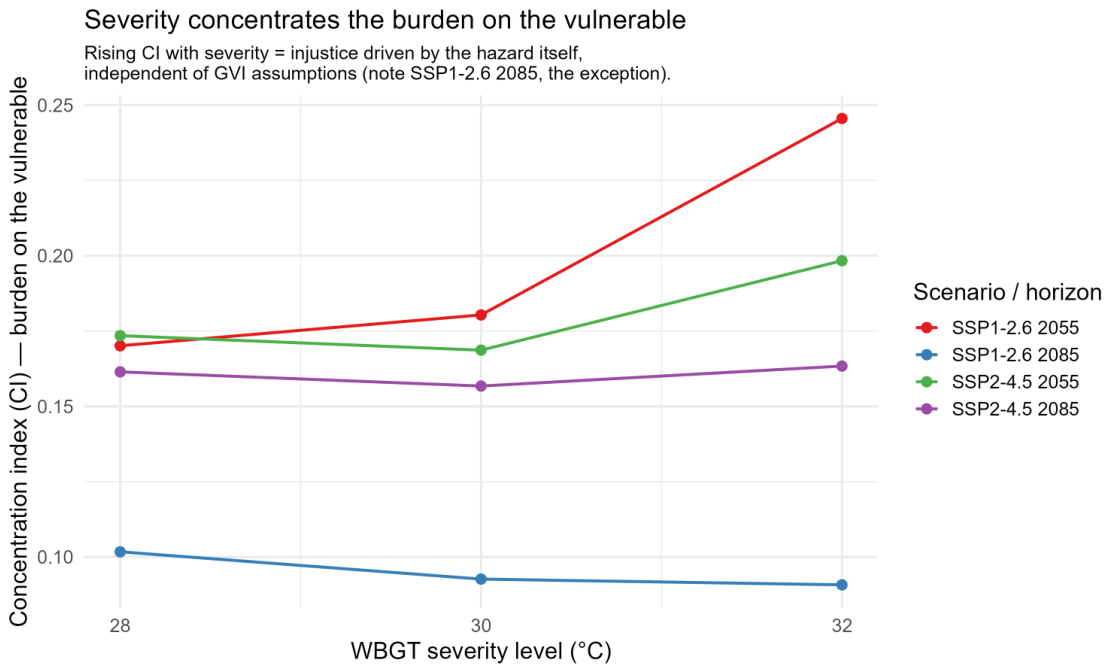
Figure 4.
Per-country reduction in hazard (afternoon WBGT ≥ 32 °C, days yr−1) versus reduction in vulnerability (GVI) from SSP2-4.5 to SSP1-2.6 at 2085. Points in the upper-right quadrant denote countries where the sustainable pathway relieves both; marker size is population.
Figure 4.
Per-country reduction in hazard (afternoon WBGT ≥ 32 °C, days yr−1) versus reduction in vulnerability (GVI) from SSP2-4.5 to SSP1-2.6 at 2085. Points in the upper-right quadrant denote countries where the sustainable pathway relieves both; marker size is population.
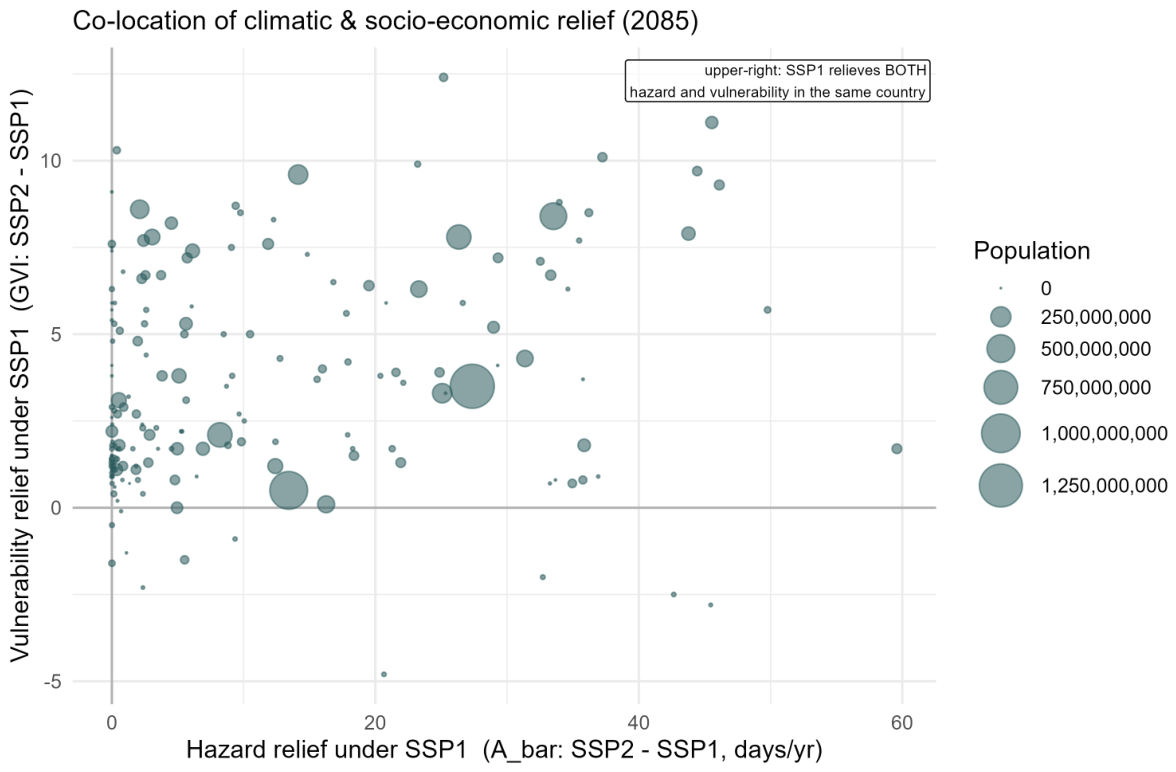
Figure 5.
Global population in an unsafe regime (WBGT ≥ 32 °C) as a function of the persistence threshold (15, 30, 45 days yr−1), by scenario and horizon.
Figure 5.
Global population in an unsafe regime (WBGT ≥ 32 °C) as a function of the persistence threshold (15, 30, 45 days yr−1), by scenario and horizon.
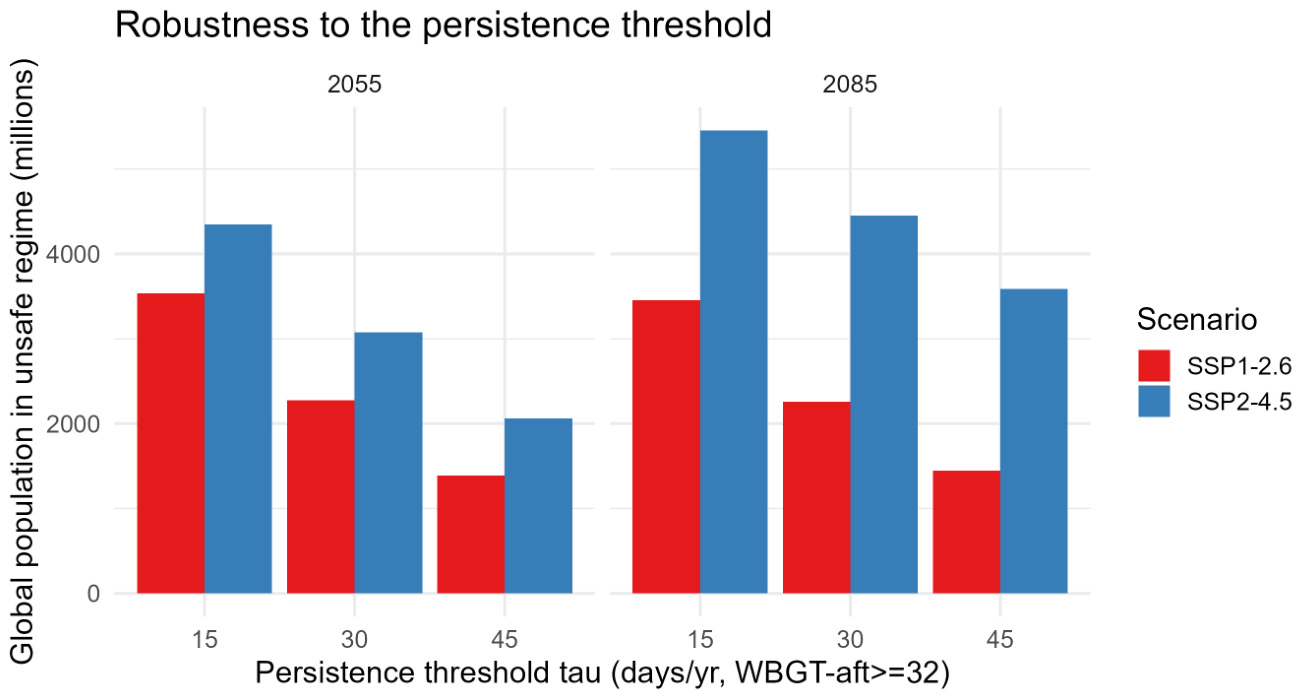

Table 1.
The twelve countries with the largest total exposure burden under SSP2-4.5 at 2085 (afternoon WBGT ≥ 32 °C). Burden is in billion person-days per year; per-capita exposure () in days yr−1; GVI is the national vulnerability index (0–100, higher = more vulnerable); population in millions.
Table 1.
The twelve countries with the largest total exposure burden under SSP2-4.5 at 2085 (afternoon WBGT ≥ 32 °C). Burden is in billion person-days per year; per-capita exposure () in days yr−1; GVI is the national vulnerability index (0–100, higher = more vulnerable); population in millions.
| Country | Burden | GVI | Pop. | |
|---|---|---|---|---|
| India | 102.3 | 69 | 31.6 | 1489 |
| Pakistan | 47.8 | 101 | 33.3 | 473 |
| Nigeria | 39.1 | 63 | 37.0 | 616 |
| China | 27.3 | 30 | 30.0 | 922 |
| Sudan | 15.6 | 137 | 38.6 | 114 |
| Niger | 11.2 | 90 | 42.9 | 124 |
| Bangladesh | 9.8 | 55 | 32.0 | 179 |
| Indonesia | 9.5 | 36 | 29.7 | 262 |
| Thailand | 7.9 | 157 | 29.2 | 51 |
| Vietnam | 7.4 | 79 | 28.5 | 94 |
| United States | 7.0 | 18 | 16.7 | 389 |
| Egypt | 6.6 | 34 | 22.0 | 191 |
Table 2.
Concentration index (CI) of the exposure burden along the national vulnerability gradient. Positive values indicate concentration on the more vulnerable countries.
Table 2.
Concentration index (CI) of the exposure burden along the national vulnerability gradient. Positive values indicate concentration on the more vulnerable countries.
| Scenario | Horizon | WBGT ≥ 28 | WBGT ≥ 30 | WBGT ≥ 32 |
|---|---|---|---|---|
| SSP1-2.6 | 2055 | 0.170 | 0.180 | 0.246 |
| SSP1-2.6 | 2085 | 0.102 | 0.093 | 0.091 |
| SSP2-4.5 | 2055 | 0.173 | 0.169 | 0.198 |
| SSP2-4.5 | 2085 | 0.161 | 0.157 | 0.163 |
Disclaimer/Publisher’s Note: The statements, opinions and data contained in all publications are solely those of the individual author(s) and contributor(s) and not of MDPI and/or the editor(s). MDPI and/or the editor(s) disclaim responsibility for any injury to people or property resulting from any ideas, methods, instructions or products referred to in the content. |
© 2026 by the author. Licensee MDPI, Basel, Switzerland. This article is an open access article distributed under the terms and conditions of the Creative Commons Attribution (CC BY) license.
Copyright: This open access article is published under a Creative Commons CC BY 4.0 license, which permit the free download, distribution, and reuse, provided that the author and preprint are cited in any reuse.


