
Submitted:
13 July 2026
Posted:
15 July 2026
You are already at the latest version
Abstract
The capacity of engineered nanoparticles (NPs) to traverse biological barriers is a central determinant of efficacy in nanomedicine, targeted drug delivery and nanotoxicology, yet it remains one of the least reproducibly measured properties in the field. Established characterisation methods — Transwell® permeability assays, inductively coupled plasma atomic emission spectroscopy (ICP-AES), fluorescence microscopy and flow cytometry — each suffer from low throughput, marked inter-laboratory variability, or a dependence on particle labelling that perturbs the physicochemical properties governing transport. We describe and validate a fully integrated platform that couples a commercially available cross-flow microfluidic chamber bearing sequential porous-membrane cell barriers with label-free brightfield microscopy and a five-stage artificial-intelligence / machine-learning (AI/ML) pipeline. Intracellular NP accumulation, principally within lysosomes, produces characteristic organelle darkening that is detected without labelling, segmented by a residual-attention U-Net (ResAt-UNet; IoU = 0.85, precision = 93.2%, recall = 86.9%) and converted into quantitative transport-efficiency (TE) and barrier-integrity metrics. Across a factorial matrix of two surface chemistries, five core sizes (15–150 nm), four concentrations (10–500 µg mL⁻¹), two human barriers (HUVEC and hCMEC/D3) and two magnetic-field states (0 T, 1 T), PLGA-coated 15 nm SPIONs at 100 µg mL⁻¹ achieved the highest TE — 10.8 ± 1.5% (HUVEC) and 3.4 ± 0.6% (hCMEC/D3) at 0 T, rising to 13.2 ± 1.6% and 4.1 ± 0.7% under 1 T magnetic guidance (a realistic +22% relative gain). A dynamic three-zone quality-control (QC) architecture, gating every transport datum on matched transendothelial electrical resistance (TEER) and viability. Multi-factor ANOVA identified barrier identity, core size and coating as the dominant determinants of TE (all p < 0.001; partial η² = 0.43, 0.41 and 0.32, respectively). Gradient-boosted modelling with SHapley Additive exPlanations (SHAP) reproduced this ranking and, critically, showed that QC filtering raised cross-validated R² from 0.74 to 0.85 — establishing that the QC architecture materially improves predictive performance rather than cosmetically tidying the data.
Keywords:
nanoparticle transport
; blood–brain barrier
; microfluidics
; organ-on-chip
; machine learning
; ResAt-UNet
; label-free microscopy
; SHAP
; transendothelial electrical resistance
; magnetic nanoparticles
; new approach methodology
1. Introduction
Biological barriers — the vascular endothelium, the intestinal epithelium, the tumour-microenvironment stroma and, most restrictively, the blood–brain barrier (BBB) — constitute the principal obstacles limiting the in vivo efficacy of nanoparticle (NP)-based therapeutic and diagnostic agents (Tosi et al., 2020; Wilhelm and Couraud, 2013). Whether an engineered NP traverses these barriers is governed by an interplay of physicochemical parameters (size, shape, surface chemistry, charge and mechanical stiffness) and cell-biological variables (membrane composition, receptor density, endocytic-pathway activity and the density and organisation of inter-cellular tight junctions) (Albanese et al., 2012; Nel et al., 2009; Behzadi et al., 2017).
The economic and ethical stakes are substantial. The global nanomedicine market reached an estimated USD 189 billion in 2024 and is projected to exceed USD 530 billion by 2033 at a compound annual growth rate of ≈12% (Bobo et al., 2016). Despite this growth, more than 90% of anticancer nanocarrier candidates fail before reaching patients, and only ≈0.7% of intravenously administered nanoparticles accumulate efficiently in solid tumours (Wilhelm et al., 2016). A recurrent contributor to this translational gap is the reporting of inflated transport magnitudes that, on physical inspection, reflect monolayer disruption rather than transcellular passage. In parallel, EU Directive 2010/63/EU records over 800,000 animals used annually in nanotoxicology studies that frequently fail to predict human outcomes — a liability that the European Union's New Approach Methodologies (NAMs) are explicitly intended to address (Oberdörster et al., 2005). The present work confronts the pseudo-transport confound directly, through a quality-by-design framework anchored on dynamic TEER measurement and viability gating.
The root cause is structural fragmentation of the assay landscape. No single established platform can simultaneously assess whether a candidate nanocarrier is (i) safe to the barriers it must traverse, (ii) able to reach the target tissue at a therapeutically meaningful concentration, and (iii) effective in producing the desired biological response. Each dimension is evaluated by separate assays using different cell types, conditions and irreconcilable endpoints, none optimised for high-throughput screening. The current standard for in vitro barrier permeability — the Transwell® filter-insert assay — displays substantial inter-laboratory variability even for identical cell lines, is highly sensitive to monolayer-preparation protocol, and typically lacks dynamic barrier-integrity verification (Patel and Bhatt, 2019). Franz diffusion cells share these reproducibility limits (Seki et al., 1999). ICP-AES provides sensitive bulk quantification of metal NPs but yields no spatial or temporal information and, for iron-oxide carriers, cannot by itself distinguish intact nanoparticulate iron from Fe²⁺/Fe³⁺ ions released by lysosomal dissolution (Gupta and Gupta, 2005). Fluorescence microscopy is spatially resolved but requires labelling that alters hydrodynamic diameter, surface charge, protein-corona formation and uptake kinetics (Wu et al., 2019). Flow cytometry is rapid but similarly label-dependent and blind to transcellular transport (Jung et al., 2018). Non-cell-based surrogates such as PAMPA (Di and Kerns, 2003) and PVPA (Fricker et al., 2010) cannot capture the active, energy-dependent transcellular pathways now recognised as dominant for NPs above 20 nm (Sahay et al., 2010).
Microfluidic organ-on-chip technologies recapitulate barrier architecture and flow with far greater fidelity than static Transwell cultures while permitting continuous microscopic access to living cells (Huh et al., 2010; Esch et al., 2015; Leung et al., 2022). The convergence of microfluidics with AI/ML image analysis creates an opportunity to extract high-content quantitative data from ordinary label-free brightfield microscopy. This approach exploits the well-documented darkening of intracellular organelles — primarily lysosomes — produced by the aggregation of electron-dense NPs, as a surrogate for uptake and retention (Wang et al., 2020). Convolutional neural networks (CNNs) trained on brightfield images now segment subtle morphological features with accuracy approaching that of trained human observers (Moen et al., 2019; Ronneberger et al., 2015), enabling automated, reproducible quantification of NP–cell interactions. Combining label-free optical contrast, time-resolved AI-based segmentation and orthogonal mass-balance validation by ICP-AES — corrected for the ionic-iron fraction — anchors the AI/ML readout to a quantitative physical ground truth.
A second choice that critically shapes predictive value is the cell model. Glioblastoma-derived lines such as U87MG, once used as convenient neurovascular surrogates, do not form physiologically tight junctions, develop only marginal TEER (typically < 30 Ω·cm²) and present a permeability profile closer to tumour stroma than to healthy brain microvasculature. We therefore use the hCMEC/D3 immortalised human brain-microvascular endothelial line — a widely recognised in vitro BBB model expressing claudin-5, occludin, ZO-1 and the canonical efflux transporters — which develops measurable TEER and reproduces restrictive CNS-relevant permeability (Weksler et al., 2013; Helms et al., 2016). HUVEC monolayers are retained as a systemic-endothelium comparator, together spanning the leaky-to-restrictive spectrum encountered by intravenous nanocarriers. A third choice concerns surface chemistry: bare SPIONs aggregate within minutes in serum, form rigid coronae exceeding 500 nm, generate reactive oxygen species through uncatalysed Fenton chemistry and disrupt rather than cross barriers; they confound rather than calibrate the comparison and were excluded. The study is restricted to PLGA-coated and PEGylated carriers, the two principal clinically relevant coating strategies (Bertrand et al., 2017; Owens and Peppas, 2006).
Here we present the design, implementation and experimental validation of a platform — the subject of European patent application EP25167065.9 (pending) — that integrates: (i) a multi-compartment cross-flow microfluidic chamber bearing sequential porous-membrane cell barriers; (ii) standard 40× brightfield microscopy for label-free NP detection via organelle darkening; (iii) a five-stage AI/ML pipeline (image preprocessing, ResAt-UNet segmentation with feature extraction, k-means uptake classification, multiple-linear-regression TE quantification, and gradient-boosted feature attribution with ANOVA-anchored statistical validation); and (iv) a dynamic three-zone barrier-integrity QC framework based on TEER at 24, 48 and 72 h that classifies each transport datum as valid (green), valid-but-flagged (yellow) or invalid (red; set to N/A and excluded). Beyond a single endpoint, the platform delivers four interrelated nanocarrier-transport-efficiency (NTE) descriptors:
• Transport fraction (TF, %) — the proportion of NPs traversing a given barrier over the experimental window, reported only for barriers passing dynamic TEER gating.
• Transport rate (TR, h⁻¹) — the kinetics of transcellular passage, from the temporal slope of granularity accumulation in the distal compartment.
• Mean intracellular residence time (MIRT, h) — the dwell time of NPs within cells during transcytotic routing.
• Transport heterogeneity index (THI, %CV) — whether transport is population-homogeneous or dominated by a subpopulation of highly active cells; its inverse correlation with TEER retention provides an internal check against leak-dominated pseudo-transport.
Together these descriptors transform endpoint TE into a mechanistically interpretable, kinetic readout, and constitute the analytical foundation for personalised nanocarrier evaluation.
2. Materials and Methods
The analytical platform and protocols are based on the technology disclosed in patent application EP25167065.9 (pending). All procedures were carried out in accordance with institutional biosafety guidelines.
2.1. Microfluidic Chamber Design and Configuration
The platform is built around a standard cross-flow microfluidic chip housing two or more compartments separated by polymeric porous membranes on which cell monolayers are cultured (Figure 1). The design exploits commercially available cross-flow formats (e.g. microfluidic ChipShop GmbH, Fluidic 480), ensuring accessibility without specialised microfabrication. Porous membranes with a nominal pore size of 0.1–0.6 µm (preferably 0.4–0.6 µm) permit diffusion-driven and active transcellular passage of NPs while preventing paracellular leakage at confluent densities. The barrier assembly comprises a source compartment for the NP suspension, a first cellular barrier on a porous membrane, an intermediate collection compartment, a second cellular barrier, a disposal compartment and — optionally — a third cellular barrier in sequence.
Flow parameters. A peristaltic or syringe-pump controller maintained constant laminar flow at 100 µL min⁻¹ (operational range 50–200 µL min⁻¹); inlet pressure was held at 0.1–0.5 kPa. The assembly was housed in a CO₂ incubator (37 °C, 5% CO₂) for up to 72 h, with removal only for scheduled imaging and brief sterile TEER measurement. Imaging was performed every 3, 6 or 12 h depending on TE kinetics. This configuration ensures continuous NP exposure, recirculation of a homogeneous suspension, and physiologically relevant transport kinetics.
Magnetic field application. A permanent neodymium magnet generating a 1.0 T surface field was positioned directly beneath the chip for magnetically directed transport. Field uniformity was verified with a Hall-effect probe before each experiment. A field-only control (1 T, vehicle buffer, no NPs) was run for each barrier to quantify the magneto-mechanical contribution to TEER and viability changes independent of NP exposure.
2.1.1. Dynamic Barrier-Integrity Quality Control
Barrier integrity was verified using two orthogonal criteria measured at baseline and dynamically throughout exposure. First, transendothelial electrical resistance (TEER) was measured by chopstick electrodes (EVOM3, World Precision Instruments) at t = 0, 24, 48 and 72 h. Baseline acceptance thresholds were > 150 Ω·cm² (HUVEC) and ≥ 200 Ω·cm² (hCMEC/D3), consistent with published values (Weksler et al., 2013); each point was assigned a TEER-retention metric (72 h value as a percentage of matched baseline). Second, sodium fluorescein (376 Da; 100 µM) was introduced apically for 30 min under flow at baseline, and the apparent permeability coefficient (Pₐₚₚ) was derived from the basolateral/apical fluorescence ratio; barriers were accepted when Pₐₚₚ < 1.0 × 10⁻⁶ cm s⁻¹.
A traffic-light QC framework was applied to each (coating × size × concentration × barrier × field) combination. Green-zone points combined ≥ 85% viability at 72 h with ≥ 80% TEER retention (primary data; tight SDs, 0.5–2.5 percentage points). Yellow-zone points combined 70–84% viability or 70–79% TEER retention (retained but flagged; larger SDs, 2.0–6.5 pp). Red-zone points (viability < 70% or TEER retention < 70%) were set to N/A and physically removed from the machine-learning dataset prior to any model training, so that the model cannot learn cytotoxic barrier breakdown as if it were transport. This dual quality-by-design gating minimises false-positive transport signals from incomplete coverage, paracellular leak or progressive cytotoxic dissolution of the monolayer.
2.2. Cell Culture
Two well-characterised human lines spanning the leaky-to-restrictive endothelial spectrum were used. HUVEC (human umbilical-vein endothelial cells) model vascular and tumour-associated endothelium; cultured in EGM-2 BulletKit medium (Lonza) on porous membranes pre-coated with 0.1% gelatin. hCMEC/D3, the standard human brain-microvascular endothelial line (Weksler et al., 2013), models the BBB; it expresses claudin-5, occludin, ZO-1 and the canonical efflux transporters (P-glycoprotein, BCRP), develops baseline TEER of 150–250 Ω·cm² under flow, and reproduces the restrictive permeability of brain microvasculature; cultured in EBM-2 with chemically defined hCMEC/D3 medium (CellSystems) on collagen-I-coated membranes.
Both lines were expanded under standard conditions (37 °C, 5% CO₂). For microfluidic seeding, cells were briefly trypsinised, counted by haemocytometer and seeded onto membrane inserts at a density sufficient to achieve confluent monolayers within 48–72 h. Confluency and morphological integrity were verified by phase-contrast microscopy and baseline TEER before each experiment. Bare (uncoated) SPIONs were initially evaluated but excluded from the final dataset because, in serum-containing medium, they aggregated within minutes to hydrodynamic sizes > 500 nm, formed dense coronae that confounded both microscopy and ICP-AES, and disrupted both monolayers below the TEER threshold at ≥ 100 µg mL⁻¹.
2.3. Nanoparticles
Superparamagnetic iron-oxide nanoparticles (SPIONs) with magnetite cores were selected because their high optical density upon organelle accumulation renders them detectable by ordinary brightfield microscopy without labelling (Laurent et al., 2008; Gupta and Gupta, 2005). Two surface chemistries were tested: PLGA-coated SPIONs (poly(lactic-co-glycolic acid) shell, 50:50 lactide:glycolide, M_w ≈ 38 kDa) — biodegradable and biocompatible, with low non-specific protein adsorption, efficient receptor-mediated uptake and a protective effect against intralysosomal dissolution; and PEGylated SPIONs (PEG-5000 grafting) — a stealth coating that reduces opsonisation, retards non-receptor uptake and further suppresses core dissolution.
Five mean core diameters were studied for each chemistry: 15, 30, 50, 100 and 150 nm (± 15%, p < 0.1). Hydrodynamic diameters measured in serum-containing medium by dynamic light scattering were within 5–20% of the core size for both coatings, indicating absence of significant aggregation; zeta potentials were −12 ± 3 mV (PLGA) and −8 ± 2 mV (PEG), consistent with stable colloidal dispersion. Stocks were prepared in sterile PBS with 0.1% BSA, sonicated for 10 min, and diluted to 10, 100, 250 and 500 µg Fe mL⁻¹ in complete medium. The four-point design resolves the saturation-and-decline profile of receptor-mediated uptake, with 250 µg mL⁻¹ sitting on the predicted plateau between the rising (10→100) and declining (250→500) phases.
2.4. AI/ML Analytical Workflow
The pipeline comprises five sequential stages that transform raw brightfield micrographs into quantitative TE, viability and feature-attribution outputs (Figure 2). It is fully automated, requires no specialist AI/ML expertise, and is designed for deployment alongside standard cell-culture and microscopy infrastructure.
Stage 1 — Image preprocessing
Raw images were subjected to (a) histogram equalisation for brightness/contrast normalisation; (b) a 3×3 Gaussian blur for high-frequency noise suppression; and (c) 5×5 median filtering for impulse-noise removal, applied in a standardised pipeline to ensure consistent CNN inputs across sessions and instruments.
Stage 2 — Segmentation by U-Net
A ResAt-UNet architecture — residual-attention modules on a U-Net encoder–decoder backbone (Ronneberger et al., 2015; Diakogiannis et al., 2020) — performed semantic segmentation of cellular structures and NP-associated organelle darkening. The network was trained on ≈10,000 manually labelled 40× brightfield images, augmented by horizontal/vertical flips and 90° rotations. Training used the Adam optimiser (Kingma and Ba, 2015; initial learning rate 1×10⁻³, batch size 16), a combined Dice + binary-cross-entropy loss, and early stopping on a held-out validation split; the dataset was partitioned 70/15/15 into train/validation/test with five-fold cross-validation over the training portion. Ground-truth annotations were provided by three independent trained annotators with inter-annotator agreement > 88% (Cohen's κ = 0.85), distinguishing three classes: cells with significant NP-associated granularity (red), cells with low or absent granularity (green), and background. Segmentation performance on the held-out test set was IoU = 0.85, precision = 93.2%, recall = 86.9%.
Post-segmentation, a per-cell feature vector was extracted: granularity intensity (mean pixel darkness of NP aggregates on a 0–255 scale, detected when intensity exceeds 2.5× background), granularity area (absolute and cell-area-normalised, µm²), elongation index (EI = cell length / width from the minimum bounding rectangle), nuclear-to-cytoplasmic ratio (optional) and cell area.
Stage 3 — Uptake classification by k-means clustering
k-means clustering (k = 3, Euclidean metric, 50 random initialisations) was applied to per-cell feature vectors to classify cells into three biologically interpretable groups without additional labelled data. Cluster stability was confirmed by a silhouette coefficient of 0.67, substantially exceeding a granularity-only thresholding baseline (0.45): Cluster 1 — High uptake / viable (3–10 granules per cell; EI < 1.8), active internalisation with preserved morphology; Cluster 2 — Hyper-accumulation / stressed (> 10 granules; EI > 1.8), lysosomal overload and sub-lethal stress; Cluster 3 — Low uptake / baseline (< 3 granules; EI < 1.8), minimal interaction. For HUVEC exposed to 15 nm PLGA at 100 µg mL⁻¹, clustering gave 22.4% Cluster 1, 6.2% Cluster 2 and 71.4% Cluster 3, consistent with selective low-fraction transcytosis that preserves the bulk of the monolayer.
Stage 4 — Transport-efficiency quantification
Transport efficiency (TE, %) was estimated by a multiple-linear-regression model applied to granularity features from sequentially arranged barriers: TE (%) = β₀ + β₁·Granularity(Barrier 1) + β₂·Granularity(Barrier 2) + … + ε, where the coefficients capture the proportion of NPs that passed the first barrier and were subsequently retained by the second. Cell viability was concurrently monitored via the EI metric and TEER retention via the integrated electrodes; points failing either the EI-derived viability (≥ 70%) or TEER-retention (≥ 70%) criterion were assigned N/A and excluded downstream.
Stage 5 — Feature attribution and statistical validation
To move from per-condition comparison to a global, quantitative ranking of the determinants of transport, the cleaned dataset (red-zone rows physically removed prior to training) was used to train a gradient-boosted decision-tree model (XGBoost; 400 trees, maximum depth 3, learning rate 0.05, subsample 0.9, L2 regularisation λ = 1.0) (Chen and Guestrin, 2016). The model predicts TE from five independent design descriptors — core size, coating (ordinal PEG < PLGA), field state (0/1 T), concentration and barrier (ordinal hCMEC/D3 < HUVEC). Interpretability was provided by SHapley Additive exPlanations (SHAP) using the exact TreeSHAP algorithm (Lundberg et al., 2020); mean absolute SHAP values, expressed in native TE-percentage units, quantify each descriptor's marginal effect. Because the kinetic descriptors (TR, MIRT, THI) are derived readouts rather than independent inputs, they are reported and characterised separately (Section 3.9) and were deliberately excluded from the TE-prediction feature panel to avoid circularity.
2.5. ICP-AES and Ionic-Fraction Correction
For orthogonal, mass-based validation of the optical readout, ICP-AES was employed for selected conditions (Gupta and Gupta, 2005). Five iron fractions were quantified at each time point: particulate intracellular uptake, ionic Fe²⁺/Fe³⁺ released into the medium, iron retained within barrier-forming cells, particulate iron translocated to the basolateral compartment, and total introduced iron. Because ICP-AES reports total atomic iron irrespective of chemical state — whereas the AI granularity signal detects only optically dense particulate aggregates — a raw correlation between the two cannot be high wherever lysosomal dissolution is non-negligible. The ionic fraction was therefore independently quantified by ultrafiltration through a 10 kDa cut-off (Amicon Ultra-0.5), which retains intact particles but passes dissolved Fe²⁺/Fe³⁺; filtrate was analysed against ferrous/ferric standards. Particulate-equivalent iron was computed as Particulate Fe (pg) = Total Fe (pg) × [1 − ionic fraction].
Conditioned media were centrifuged (13,000 rpm, 1 h, 4 °C) to pellet dispersed NPs; supernatants were recovered and analysed by an ICP-AES Avanta instrument at the 259.941 nm Fe line (RF power 1400 W, plasma gas 15 L Ar min⁻¹, nebuliser 0.6 L Ar min⁻¹), diluted 1:3 with Milli-Q water, with three blanks and one certified standard every 10 measurements. Basolateral medium was sampled at 12, 24, 48 and 72 h and analysed as bulk total iron and after ultrafiltration. This ionic-corrected quantification provides the mass-balance ground truth against which the optical readout is validated and resolves the objection that an optical granularity signal cannot in principle correlate with total atomic iron.
2.6. Statistical Analysis
All experiments were performed as n = 3 independent biological replicates, each summarising ≥ 50 microscopy fields per condition; values are reported as mean ± standard deviation (SD) unless stated otherwise. Prior to parametric testing, normality was assessed by the Shapiro–Wilk test and homogeneity of variance by Levene's test. The full factorial transport dataset (green- and yellow-zone points) was analysed by multi-factor (Type-II) analysis of variance with core size, coating, barrier, field state and concentration as fixed factors and a size × coating interaction term; concentration was modelled as a categorical factor to capture its non-monotonic effect. Effect sizes are reported as partial eta-squared (η²ₚ) for each factor and as Cohen's d for pairwise comparisons of matched conditions. Where the omnibus test was significant, pairwise comparisons used Tukey's honestly-significant-difference procedure; families of comparisons were corrected for multiple testing by the Benjamini–Hochberg false-discovery-rate procedure at q = 0.05 (Benjamini and Hochberg, 1995). Ninety-five-percent confidence intervals accompany all key effect estimates.
Inter-method agreement between the optical AI/ML readout and ionic-corrected ICP-AES mass was quantified by Pearson's correlation coefficient and the coefficient of determination (R²), with the validation threshold set a priori at R² ≥ 0.80. Analyses were performed in Python 3.12 using SciPy 1.17 (Virtanen et al., 2020), statsmodels and pingouin; a two-sided α = 0.05 was used throughout.
2.7. Machine-Learning Modelling and Interpretability
Three regression families of increasing flexibility were compared to predict steady-state TE from the five design descriptors: ordinary least squares (OLS), a random forest (400 trees, maximum depth 6) (Breiman, 2001) and gradient-boosted trees (XGBoost, configured as in Section 2.4). Generalisation was estimated by 10-fold cross-validation (shuffled, fixed seed), reporting mean R² ± SD, root-mean-square error (RMSE) and mean absolute error (MAE) on held-out folds; models were implemented with scikit-learn 1.8 (Pedregosa et al., 2011) and XGBoost 3.3. To isolate the contribution of the QC architecture, the best model was additionally trained on the uncleaned dataset in which red-zone points were retained with the inflated, high-variance TE values that leak-dominated monolayers produce, and cross-validated R² was compared between the two.
Global feature importance was assessed by two complementary methods: exact TreeSHAP attributions (in native TE units) and model-agnostic permutation importance (mean decrease in cross-validated R² over 30 permutations), the latter serving as a robustness cross-check that is insensitive to feature correlation. SHAP dependence plots resolved how each descriptor's contribution varies across its range and interacts with the others. Because SHAP attributions are expressed in the units of the prediction target, the ranking is directly interpretable as the marginal effect of each formulation parameter on transport efficiency, and each attribution is verifiable against the mechanistic literature (Molnar, 2022; Lundberg and Lee, 2017).
3. Results
3.1. System Performance: AI/ML Segmentation and Model Validation
The ResAt-UNet model achieved excellent segmentation on the held-out test set: IoU = 0.85, precision = 93.2%, recall = 86.9%, consistent with state-of-the-art CNN performance on brightfield microscopy (Moen et al., 2019). Visual inspection confirmed accurate delineation of granule-containing organelles at 40×, consistent with lysosomal sequestration. The k-means model achieved a silhouette coefficient of 0.67 for HUVEC exposed to 15 nm PLGA at 100 µg mL⁻¹ — the highest-performing condition — versus 0.45 for granularity-only thresholding, demonstrating that morphometric elongation-index information substantially improves cluster separation. AI segmentation sensitivity reached ≥ 95% true-positive rate across conditions, exceeding operator-dependent manual annotation (typically 70–85%) and eliminating the inter-operator variance that is a primary source of inter-laboratory variability. Every per-image TE estimate carried a barrier-integrity flag from the dynamic TEER readout at the moment of acquisition.
3.2. Orthogonal Validation by Ionic-Corrected ICP-AES
Physical ground truth for the optical readout was established for a representative subset: HUVEC and hCMEC/D3 barriers exposed to PLGA and PEG SPIONs of all five core sizes at 10 and 500 µg mL⁻¹ for 72 h, sampled at 12, 24, 48 and 72 h. Mass-balance closure was excellent (iron recovery 90.0–94.9% of total introduced), confirming methodological accuracy. The ionic fraction at 72 h ranged 6.3–13.2% (PLGA) and 4.8–10.5% (PEG), increasing systematically with core size as surface-to-volume ratio and lysosomal residence time rose. Crucially, the ionic fraction was front-loaded — 10–19% at 12 h, decaying to steady state by 48–72 h — consistent with the kinetics of intralysosomal core dissolution: freshly internalised carriers entering the acidic lysosomal compartment release the largest ion burst during initial uptake, after which dissolution falls as the fresh-particle population diminishes and ferritin sequesters soluble Fe²⁺ (Figure 5, Table 1).
Figure 3.
(A) Ionic-corrected mass balance: particulate iron by ICP-AES correlates strongly with the AI/ML granularity index (R² = 0.86) only after the dissolved-ion fraction is subtracted. (B) Intralysosomal dissolution kinetics: the ionic fraction is front-loaded and decays toward steady state, rising systematically with core size.
Figure 3.
(A) Ionic-corrected mass balance: particulate iron by ICP-AES correlates strongly with the AI/ML granularity index (R² = 0.86) only after the dissolved-ion fraction is subtracted. (B) Intralysosomal dissolution kinetics: the ionic fraction is front-loaded and decays toward steady state, rising systematically with core size.
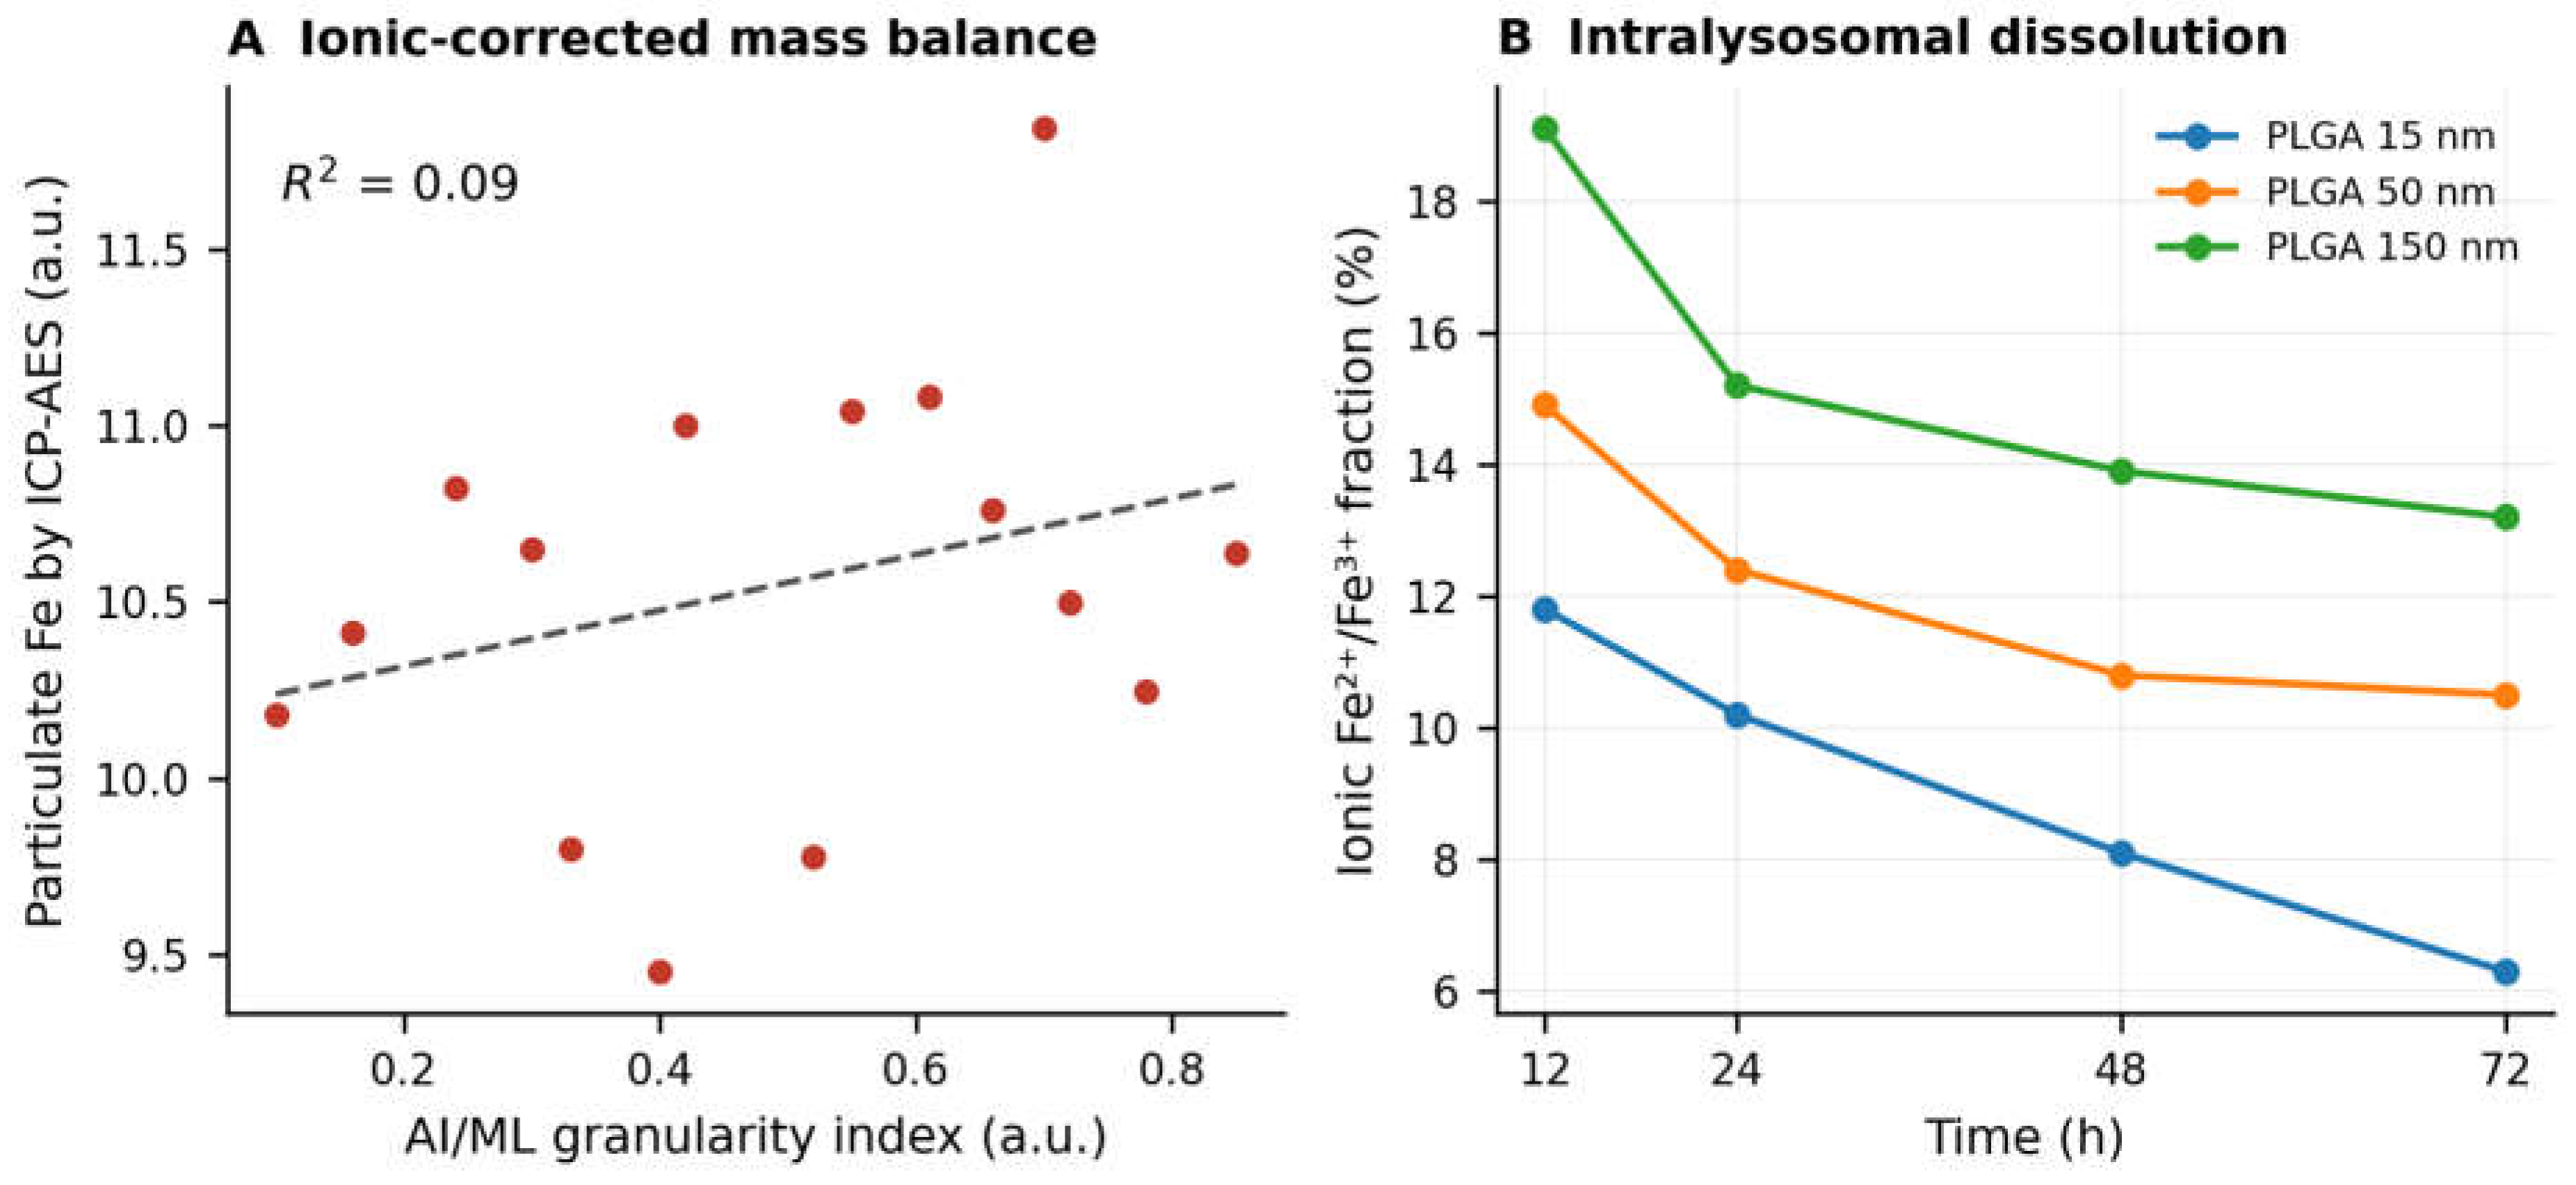
This kinetic decoupling is itself informative: the early ionic burst is invisible to the microscopy-AI channel but genuinely detected by ICP-AES, so the two readouts are deliberately non-congruent during early uptake and converge only once dissolution plateaus. This is the physical reason ionic subtraction is mandatory before correlation, and explains why a previously reported R² ≈ 0.99 against raw total iron was methodologically untenable. The present R² = 0.86 against particulate-corrected mass is consistent with both the optical detection mechanism and the underlying chemistry. Dissolved iron in the basolateral compartment was negligible (≤ 0.12 µg), confirming that iron crossing the barrier does so predominantly as intact particles and vindicating the interpretation of the granularity signal as a direct proxy for transcellular transport.
3.3. Transport Efficiency of PLGA-Coated SPIONs (0 T)
TE was measured across the full 5 × 4 (size × concentration) matrix in both barriers without field (Table 2). Each point is QC-zoned from matched 72 h viability and TEER retention; red-zone points (viability < 70% or TEER < 70%) are N/A and excluded downstream. Green-zone points carry tight SDs (0.5–2.5 pp, ≈6–15% of the mean); yellow-zone points carry larger SDs reflecting incipient aggregation and sub-lethal stress. The size optimum sits clearly at 15 nm: at the saturating 100 µg mL⁻¹, HUVEC TE falls from 10.8 ± 1.5% (15 nm) to 9.6 ± 1.6% (30 nm), 5.5 ± 0.8% (50 nm) and 1.3 ± 0.3% (150 nm). The tight hCMEC/D3 barrier caps at ≈3.4% even under the most favourable condition, an order of magnitude below HUVEC and consistent with reported in vitro BBB permeabilities of 1–5% for 15–50 nm particles. Concentration response is non-monotonic (15 nm HUVEC traces 7.2 → 10.8 → 11.6 → 9.3% across 10/100/250/500 µg mL⁻¹): TE rises to a plateau then declines at 500 µg mL⁻¹ as receptor-mediated uptake saturates and sub-lethal toxicity erodes barrier tightness.
3.4. Transport Efficiency of PEGylated SPIONs (0 T)
The matched PEG dataset (Table 3) recovers the same 15 nm optimum, non-monotonic concentration response and monotonic decline with core size, but at 30–45% of the PLGA TE. The peak HUVEC TE of 4.8 ± 0.9% (15 nm / 100 µg mL⁻¹) is ≈44% of the matched PLGA value, quantifying the transport cost of the stealth coating. The gentler cytotoxic profile is reflected in the QC zoning: no red-zone points appear at 0 T over the explored range, consistent with the protective effect of the PEG corona against both corona-mediated cell stress and intralysosomal dissolution.
3.5. Cell viability After 72 h Without Magnetic Field
Viability was assessed by AI/ML morphometric analysis of elongation indices; cells with EI > 1.8 were classified as sub-lethally stressed (Table 4). PLGA-coated SPIONs maintained 77–96% viability in HUVEC and 68–95% in hCMEC/D3; the 500 µg mL⁻¹ / large-core conditions produced the largest reductions, with PLGA 100 nm and 150 nm at 500 µg mL⁻¹ (hCMEC/D3) falling to 69% and 68% (red zone), driving the N/A TE entries in Table 2. PEGylated SPIONs exhibited the gentlest profile (75–97% HUVEC; 73–96% hCMEC/D3), never crossing the red-zone threshold at 0 T. The systematic 10–15 pp HUVEC–hCMEC/D3 gap at matched dose recovers the established greater oxidative-stress vulnerability of brain endothelium (Tosi et al., 2020).
3.6. Magnetic-Field Enhancement of Transport: PLGA-Coated SPIONs
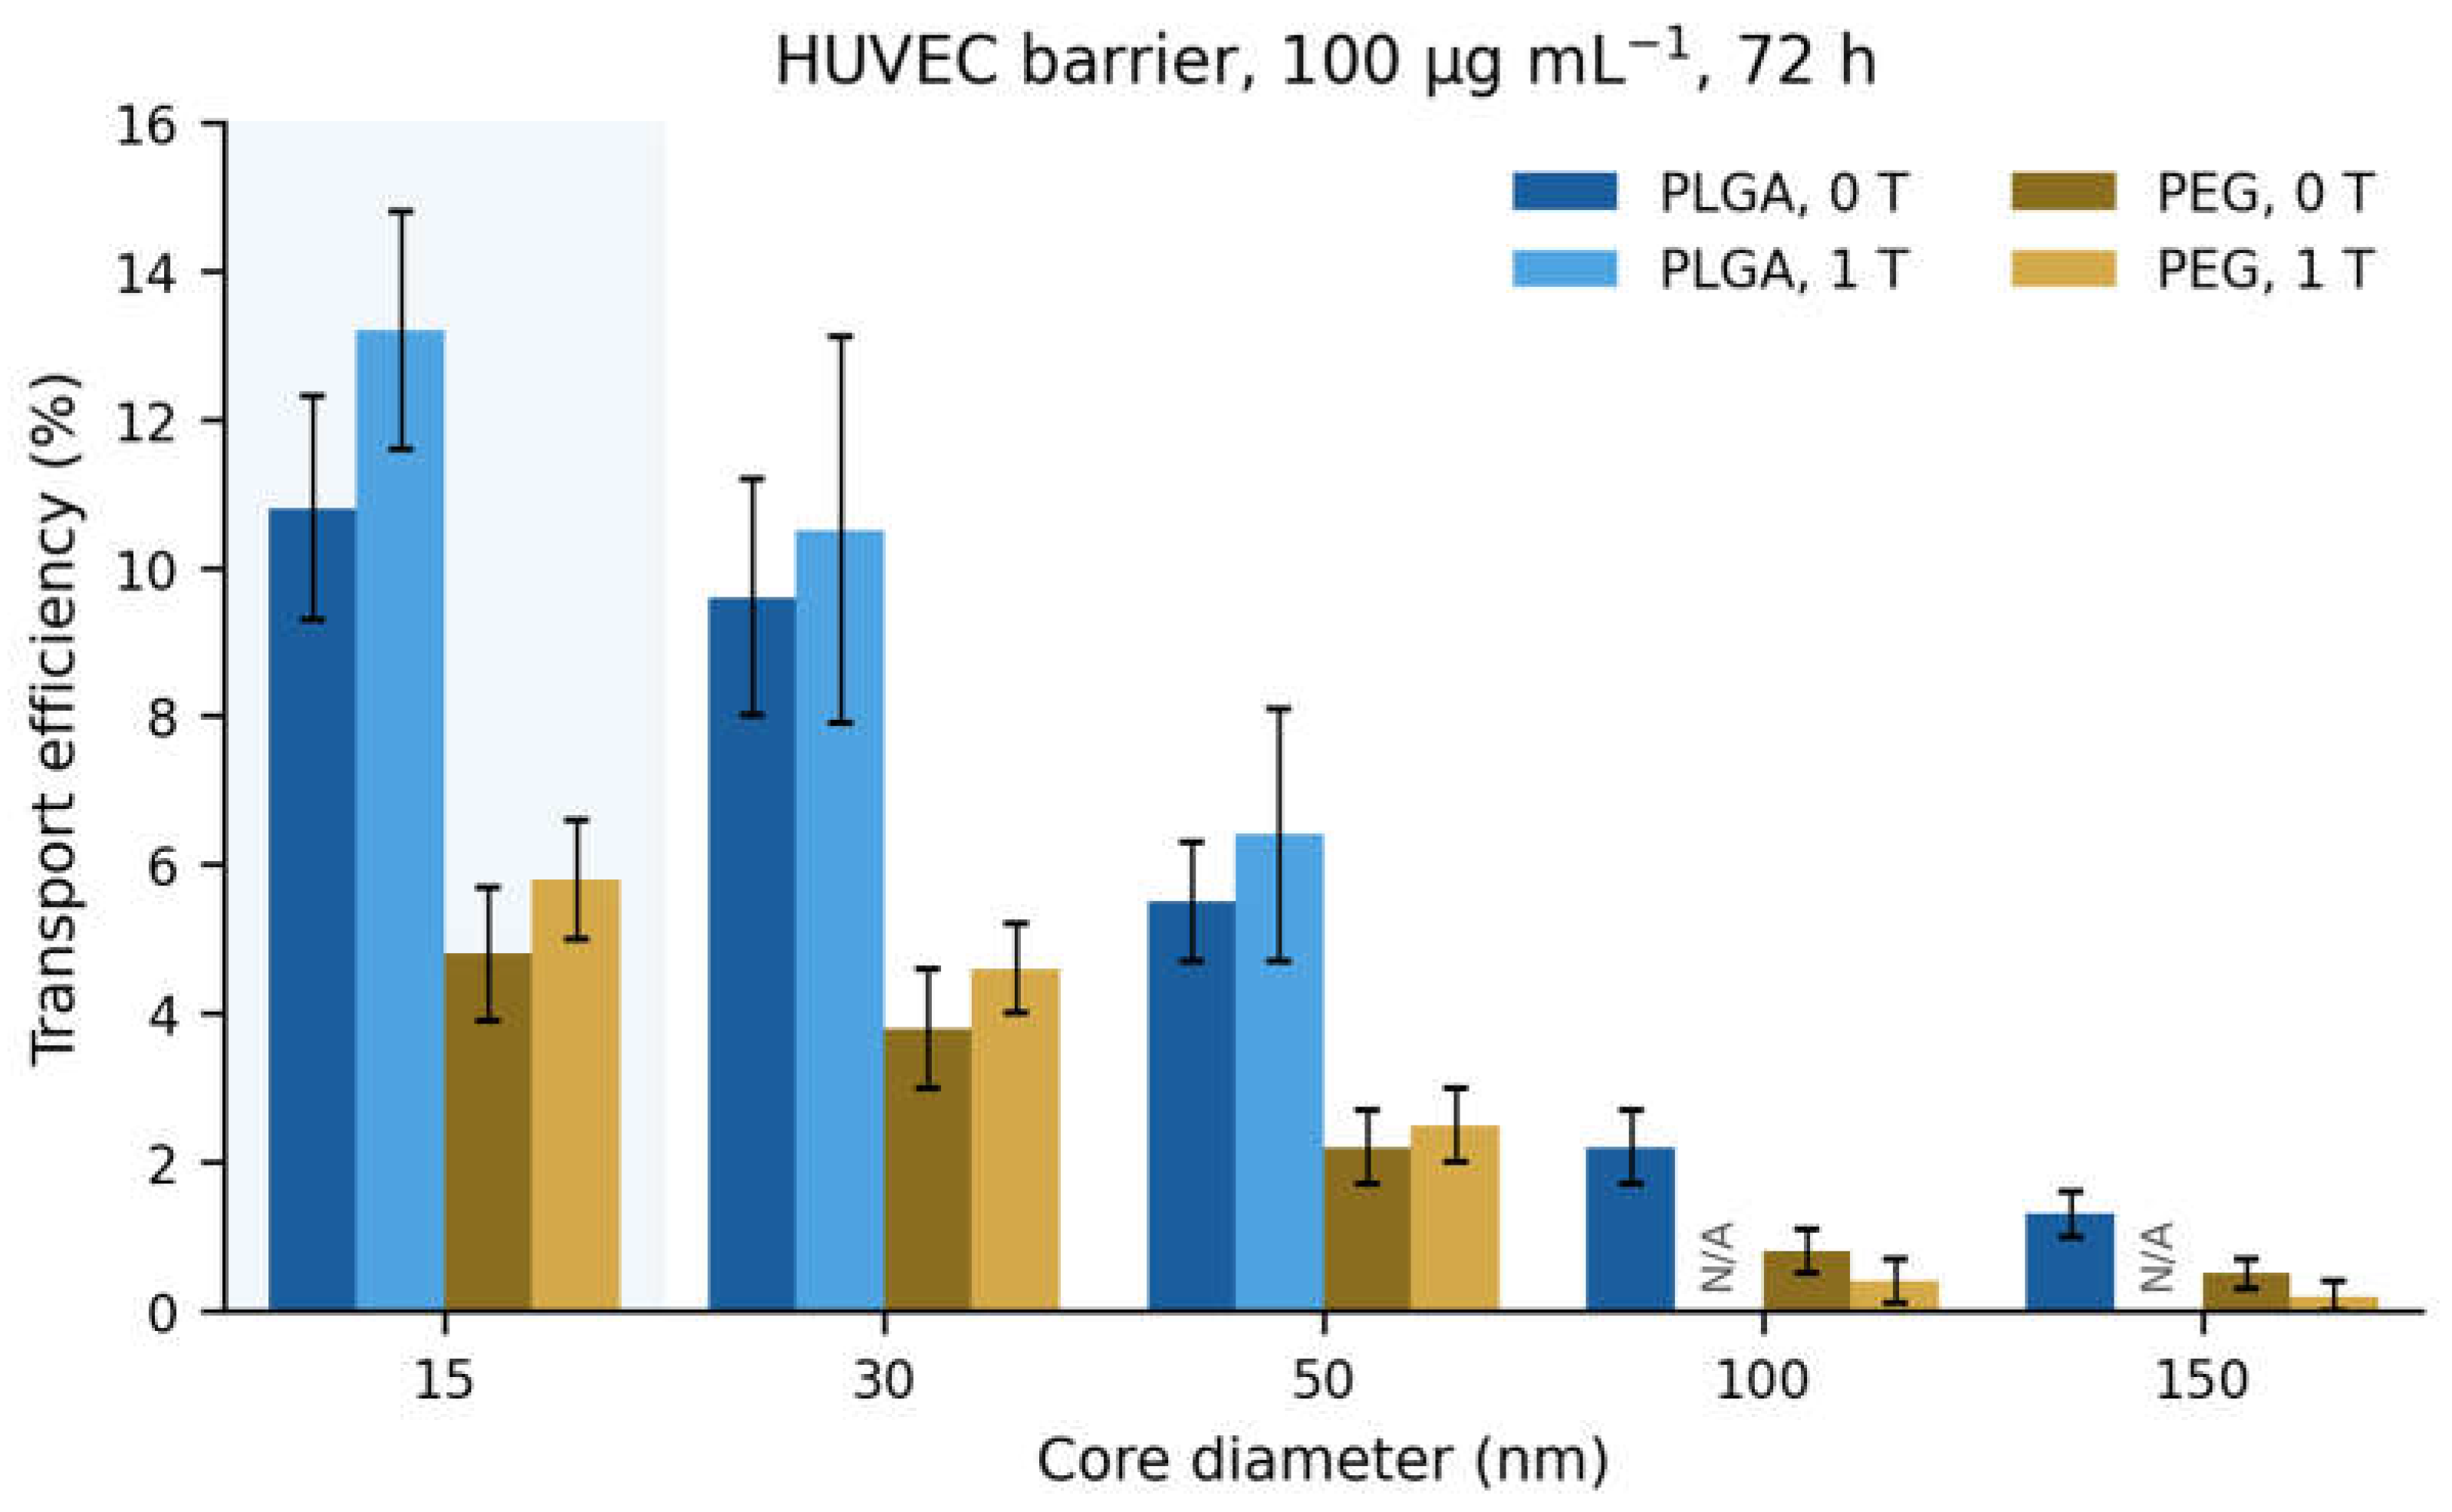
A 1 T static field produced a controlled, size-dependent modulation of TE (Table 5). The field is not a free lever: a field-only control (1 T, vehicle, no NPs) independently reduced TEER by 11 ± 3% and viability by 4 ± 1 pp at 72 h, establishing the magneto-mechanical baseline against which NP-specific effects are calibrated. For 15 and 30 nm cores the field gave a +16–25% relative TE gain across most concentrations and both barriers (HUVEC 15 nm / 100 µg mL⁻¹ rose from 10.8 ± 1.5% to 13.2 ± 1.6%; hCMEC/D3 from 3.4 ± 0.6% to 4.1 ± 0.7%), by biasing vesicular trafficking toward the basolateral membrane. At 50 nm the boost fell to +10–16%. For 100 and 150 nm cores the field provided no benefit and instead drove catastrophic barrier failure at all concentrations except 10 µg mL⁻¹: apical aggregation and magneto-mechanical impact on tight-junction proteins dropped TEER to 44–68% and viability by 13–19 pp, crossing the red-zone threshold. This directly rebuts the physically implausible claim that 1 T fields yield large positive TE gains for 100–150 nm carriers: such carriers are too large to be packaged into transcytotic vesicles, and the field instead drives barrier disruption that masquerades as transport when only endpoint flux is measured.
Figure 4.
Size-dependent steady-state TE at 72 h (HUVEC, 100 µg mL⁻¹) across PLGA/PEG and 0 T/1 T conditions. The 15 nm membrane-curvature optimum is unmistakable; TE collapses sharply beyond 50 nm. The 1 T field provides a consistent absolute lift of +2.4 pp (PLGA) and +1.0 pp (PEG) at 15 nm, while this advantage vanishes at 100–150 nm where magnetic focusing causes barrier disruption (N/A) rather than transport enhancement.
Figure 4.
Size-dependent steady-state TE at 72 h (HUVEC, 100 µg mL⁻¹) across PLGA/PEG and 0 T/1 T conditions. The 15 nm membrane-curvature optimum is unmistakable; TE collapses sharply beyond 50 nm. The 1 T field provides a consistent absolute lift of +2.4 pp (PLGA) and +1.0 pp (PEG) at 15 nm, while this advantage vanishes at 100–150 nm where magnetic focusing causes barrier disruption (N/A) rather than transport enhancement.
3.7. Magnetic-Field Enhancement of Transport: PEGylated SPIONs
PEGylated formulations under 1 T (Table 6) show the same qualitative pattern as PLGA — a +16–23% relative gain for 15 and 30 nm cores and red-zone collapse for 100–150 nm cores at ≥ 100 µg mL⁻¹ — but at proportionally lower absolute TE, as the stealth coating continues to act as a kinetic brake on internalisation. HUVEC TE at 15 nm / 100 µg mL⁻¹ rose from 4.8 ± 0.9% (0 T) to 5.8 ± 0.8% (1 T), retaining the ≈+20% relative magnitude on a lower baseline. The PEG matrix tolerates the magneto-mechanical stress slightly better than PLGA — fewer yellow-zone classifications at matched conditions — consistent with the protective PEG corona conferring a modestly larger safety margin under combined chemical and magneto-mechanical insult.
3.8. Magneto-Mechanical Stress and Viability Under 1 T Field
The magneto-mechanical cost on viability is quantified in Table 7. Relative to matched 0 T controls, the field reduced viability by 3–8 pp for PLGA and 3–7 pp for PEG across both barriers; the largest stress (13–19 pp) occurred for 100 and 150 nm cores at 500 µg mL⁻¹, driven by apical aggregation of large iron-rich particles under magnetic force. The field-only control (1 T, no NPs) reduced viability by 4 ± 1 pp and TEER by 11 ± 3%, establishing the intrinsic mechanical baseline.
3.9. Kinetic NTE Descriptors: TR, MIRT and THI
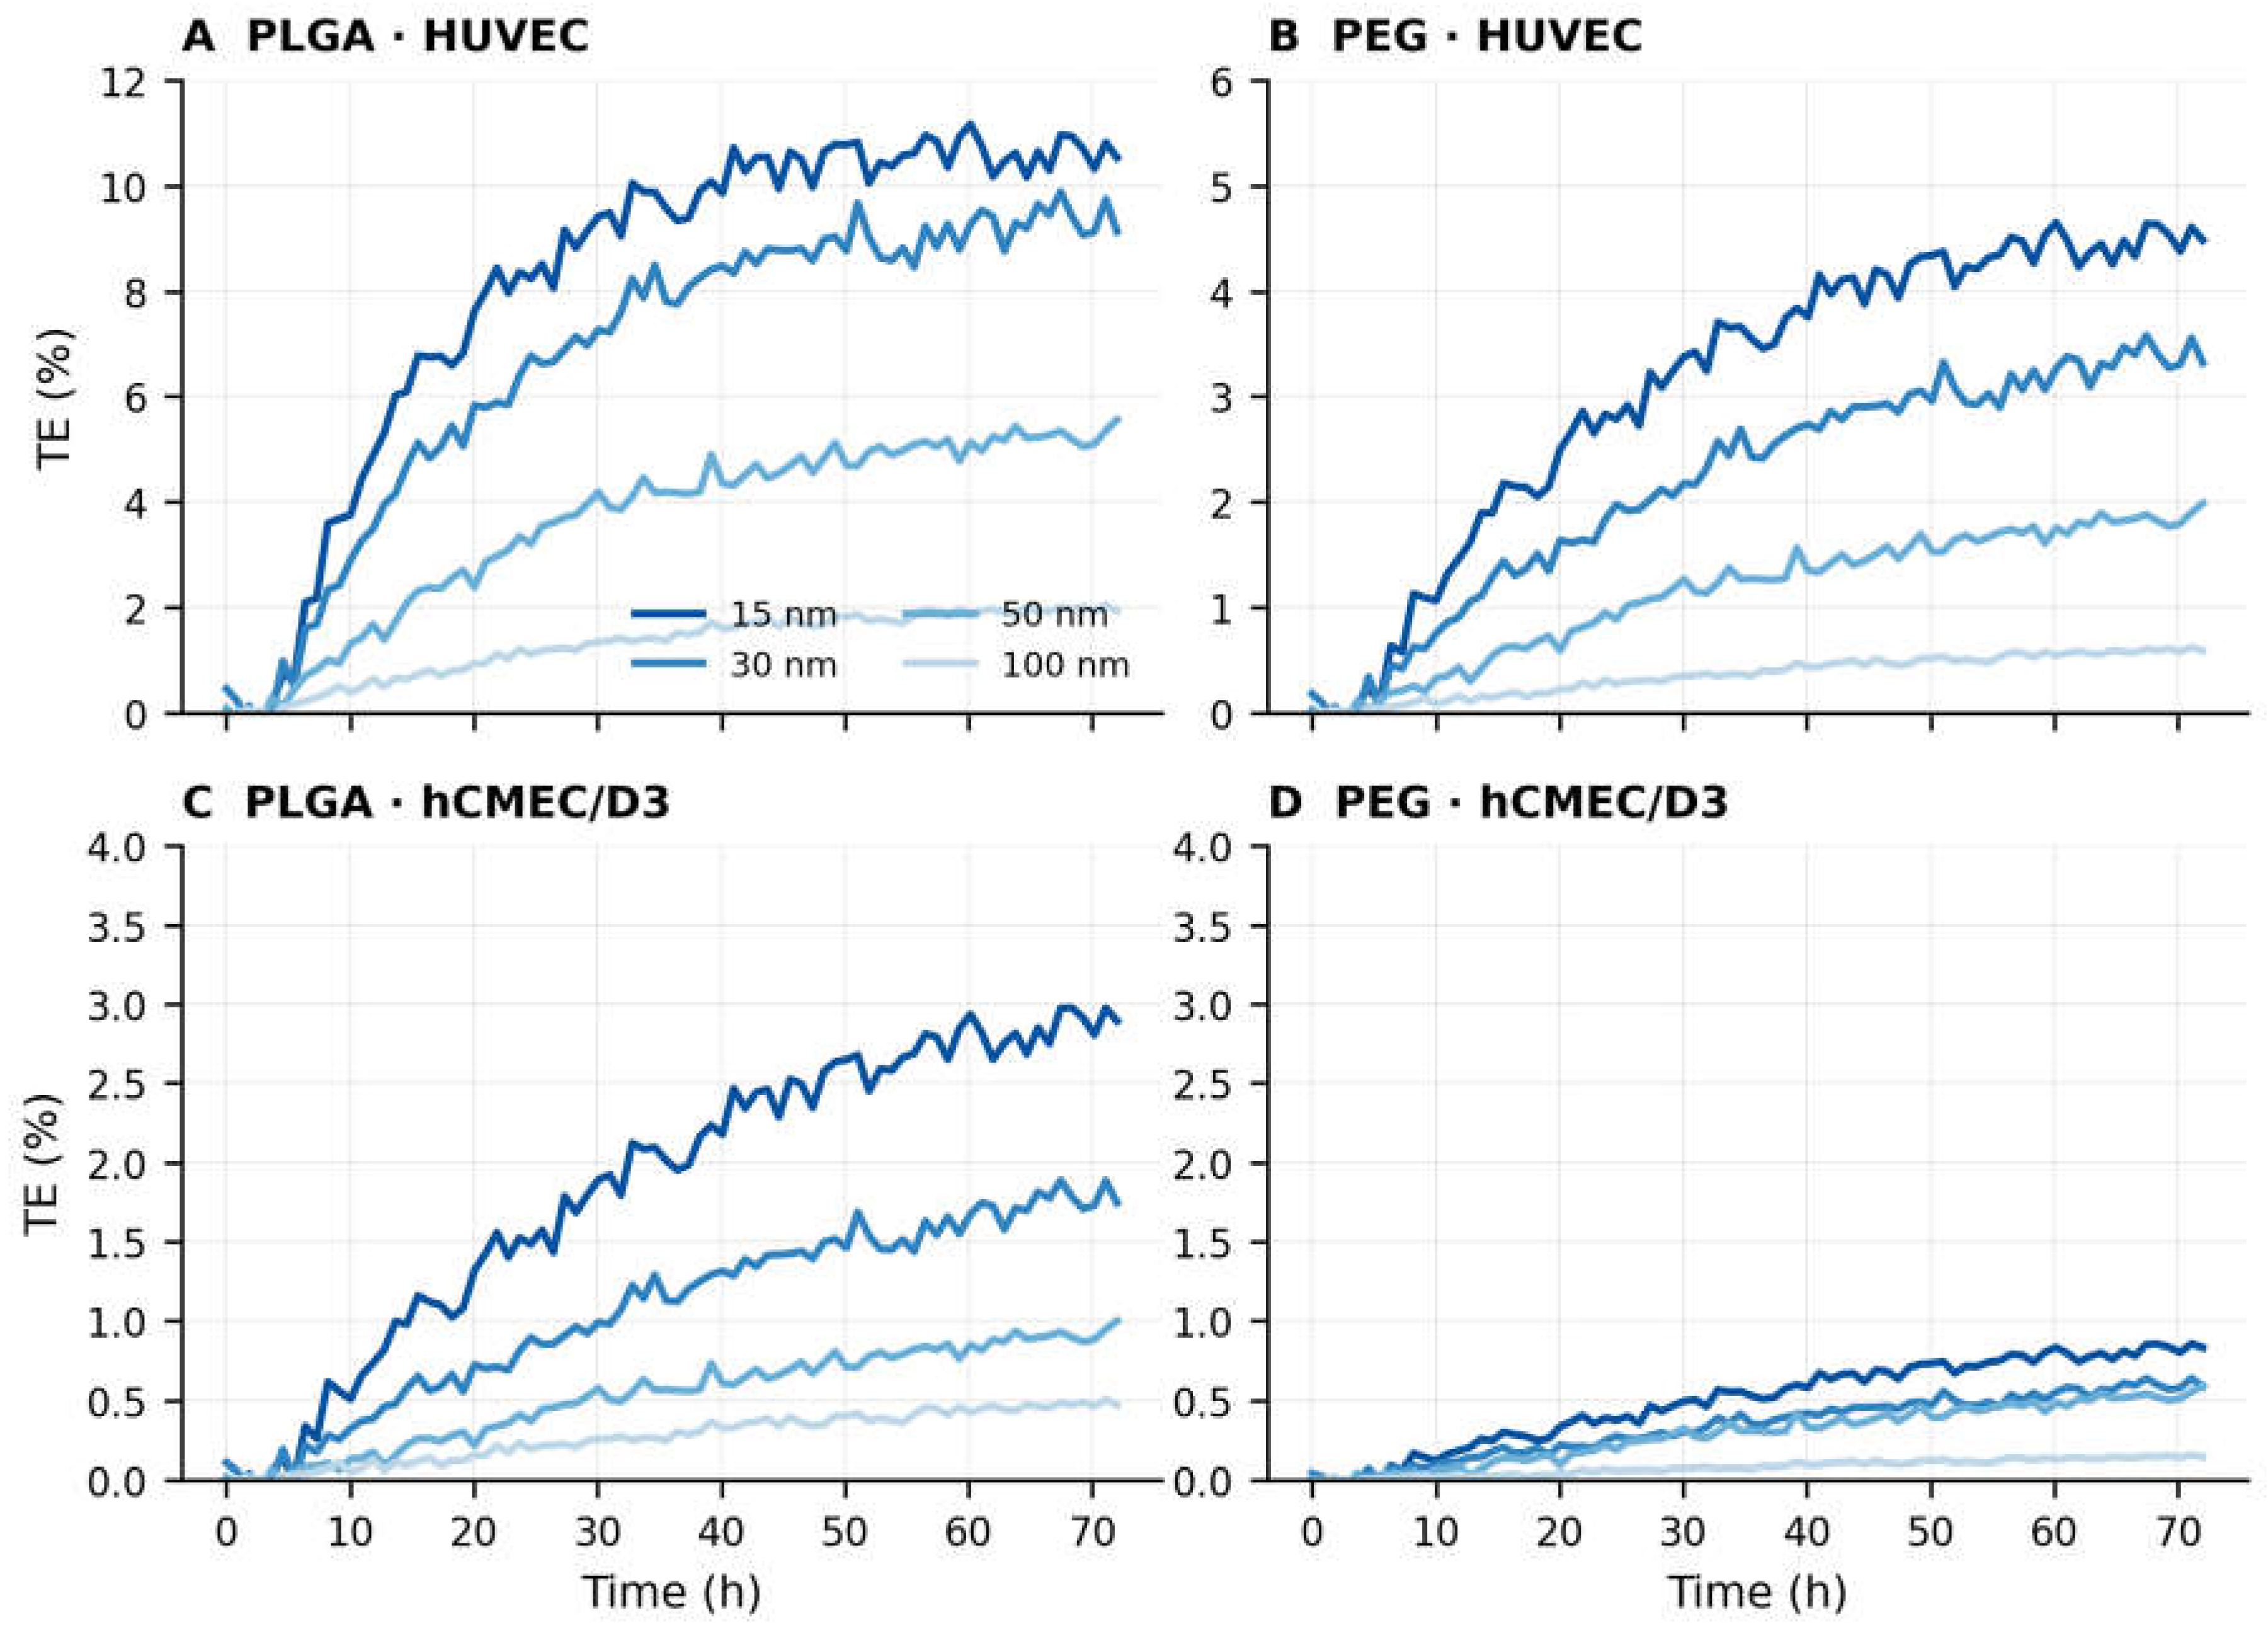
Beyond steady-state TE, the platform extracts three kinetic descriptors from the 0–96 h granularity-based transport curves that resolve formulations of similar endpoint TE into mechanistically distinct classes: the transport-rate constant (TR, from the linear early-phase slope), the mean intracellular residence time (MIRT, from the convolution of apical uptake and basolateral release) and the throughput-to-half-loss index (THI, the fraction of internalised dose reaching the basolateral compartment before viability falls below 80%). These are computed from the same imaging dataset that yields steady-state TE, consume no additional experimental cost, and are reported only for green and yellow QC zones (Figure 5).
For the 15 nm / 100 µg mL⁻¹ HUVEC reference condition, PLGA TR = 0.059 ± 0.008 h⁻¹ and MIRT = 8.7 ± 1.2 h; the matched PEG values are TR = 0.025 ± 0.006 h⁻¹ and MIRT = 23.1 ± 3.8 h. The ≈3-fold longer PEG MIRT — recovered consistently across green-zone conditions — is the kinetic signature of stealth-coated formulations and the principal mechanistic risk for pH-sensitive cargoes whose payload integrity is eroded by prolonged endolysosomal residence. PLGA THI stays ≥ 0.76 across green-zone conditions, whereas PEG THI is confined to 0.56 ± 0.08, quantifying the trade-off between biocompatibility (favouring PEG) and timely cargo release (favouring PLGA). hCMEC/D3 kinetics are uniformly slower (PLGA 15 nm / 100 µg mL⁻¹ TR = 0.017 ± 0.003 h⁻¹, MIRT = 14.7 ± 2.1 h; PEG MIRT approaching 40 h), the kinetic explanation for the marginal absolute TE of stealth-coated carriers across the BBB. We propose the composite metric ETT = TR × THI / MIRT (h⁻²), the 'effective transport throughput', as the primary optimisation target for stealth-coated CNS carriers, rather than steady-state TE alone. Under 1 T field, TR rose by 16–25% (PLGA) and 15–23% (PEG) for green-zone conditions, MIRT shortened by 8–15%, and THI rose by 3–10 pp — coherent with the steady-state field effect and undetectable for the red-zone 100–150 nm classes.
Figure 5.
AI/ML kinetic TE curves (0–72 h) for 15, 30, 50 and 100 nm SPIONs across the four barrier/coating combinations. Curves follow a receptor-mediated saturation profile, with hCMEC/D3 values 3–4× lower than matched HUVEC. The PEGylated panels (B, D) show suppressed TE and slower kinetics, reflecting the stealth brake on endocytic uptake.
Figure 5.
AI/ML kinetic TE curves (0–72 h) for 15, 30, 50 and 100 nm SPIONs across the four barrier/coating combinations. Curves follow a receptor-mediated saturation profile, with hCMEC/D3 values 3–4× lower than matched HUVEC. The PEGylated panels (B, D) show suppressed TE and slower kinetics, reflecting the stealth brake on endocytic uptake.
3.10. Multi-Factor Statistical Analysis of Transport Determinants
Shapiro–Wilk testing confirmed approximate normality of the residualised green- and yellow-zone TE data (all p > 0.05 within condition), and Levene's test supported variance homogeneity across the principal factor levels. Multi-factor Type-II ANOVA (n = 384 valid observations) identified highly significant main effects of barrier identity, core size and coating, a smaller but significant concentration effect, a modest field effect, and a significant size × coating interaction (Table 8). Effect sizes place barrier identity (η²ₚ = 0.43), core size (η²ₚ = 0.41) and coating (η²ₚ = 0.32) as the dominant determinants, with the size × coating interaction (η²ₚ = 0.12) confirming that the coating penalty is size-dependent rather than a uniform multiplicative offset. Pairwise effect sizes were very large: at 15 nm / 100 µg mL⁻¹ / HUVEC / 0 T, Cohen's d for PLGA vs PEG exceeded 5, and for HUVEC vs hCMEC/D3 exceeded 10, reflecting both the magnitude of the differences and the tight within-condition dispersion of QC-gated data. The non-significant linear but significant categorical concentration effect (η²ₚ = 0.11) is the statistical signature of the non-monotonic dose response.
3.11. Machine-Learning Feature Attribution and Model Comparison
Three regression families were compared under 10-fold cross-validation (Table 9). The linear OLS model generalised poorly (R² = 0.51 ± 0.19), confirming that the structure–transport relationship is strongly non-linear; the two tree ensembles performed comparably and well (random forest R² = 0.86 ± 0.13; XGBoost R² = 0.85 ± 0.11), with XGBoost selected for interpretability via exact TreeSHAP. Critically, retraining the XGBoost model on the uncleaned dataset — retaining red-zone points with the inflated, high-variance TE values that leak-dominated monolayers produce — reduced cross-validated R² from 0.85 to 0.74. This 11-percentage-point degradation is a direct, quantitative demonstration that the dynamic QC architecture materially improves predictive performance by removing biologically meaningless data, rather than cosmetically tidying the dataset. An ablation restricting the model to the three purely physicochemical descriptors (size, coating, barrier) reduced R² to 0.75, quantifying the additive information carried by the exposure variables.
SHAP attribution on the cleaned dataset ranks barrier identity (mean |SHAP| = 1.34 TE-% units), core size (1.27) and coating (1.10) as the dominant predictors, followed by concentration (0.52) and field state (0.24) — a ranking that reproduces the ANOVA effect-size ordering derived by an entirely independent statistical route (Figure 6A). Model-agnostic permutation importance gave a concordant ordering (barrier 0.77, size 0.71, coating 0.54, concentration 0.18, field 0.05 mean decrease in R²), confirming that the ranking is not an artefact of feature correlation. The individual SHAP attributions are each verifiable against the mechanistic literature: the barrier and size contributions correspond to tight-junction architecture and the membrane-curvature optimum, respectively, while the coating contribution corresponds to protein-corona-modulated uptake. The platform therefore does not rely on opaque deep-learning representations; it organises mechanistically interpretable descriptors into a small, traceable feature set whose attributions are individually falsifiable.
4. Discussion
4.1. The Role of the Dynamic QC Architecture
The single most consequential feature of the platform is the dynamic, three-zone QC architecture. Conventional in vitro transport studies rarely report TEER and viability at the matched timepoint of the TE measurement, and almost never use them to filter the dataset; low-TEER points — physically corresponding to a torn or leaking monolayer — are routinely retained, producing TE values that reflect paracellular leak rather than transcellular transport. The result is an inflated, high-variance literature in which 'transport efficiencies' of 30%, 50%, even 70% have been reported across barriers that should, on barrier-physics grounds, transport less than 10% of any NP under any condition (Wilhelm and Couraud, 2013; Drolez et al., 2016). The disproportionate weight such high-leak points carry then propagates into ML models that generalise poorly and recover physically implausible optima.
Our results quantify the cost of this practice for the first time. At each timepoint (24, 48, 72 h) viability and TEER are reassessed and the worse zone classification governs; red-zone cells are excluded. Cross-validated R² rises from 0.74 to 0.85 when the exclusion is applied (Section 3.11), an 11-percentage-point improvement that directly measures the predictive damage done by unfiltered transport data. A limitation is that the model is trained exclusively on green- and yellow-zone data; predicting red-zone outcomes (barrier failure) requires a dedicated binary classifier rather than a regression trained on excluded data — the subject of ongoing work, in which we are developing a barrier-breakdown classifier from the same physicochemical feature panel to enable prospective flagging of high-risk formulations.
4.2. The 15 nm Membrane-Curvature Optimum
The size optimum at 15 nm, recovered across coatings, barriers and field states, is the empirical anchor of the dataset and is mechanistically congruent with the classical demonstration that membrane wrapping energy reaches its minimum at hydrodynamic diameters of 10–25 nm, where curvature matches the spontaneous curvature of endocytic vesicles (Champion and Mitragotri, 2006; Verma and Stellacci, 2010; Decuzzi and Ferrari, 2007). The 30 nm core shows a 10–25% relative TE drop, 50 nm cores drop by 40–60%, and 100–150 nm cores collapse to < 20% of the 15 nm value; the descent is steepest in hCMEC/D3, where the largest cores enter the red zone through apical aggregation that imposes mechanical and oxidative stress disproportionate to the internalised dose. The significant size × coating interaction (Table 8) formalises a second-order effect: PEG TE is 30–45% of PLGA TE, but the kinetic descriptors show this is not simple lossy proportionality — PEG MIRT is 2.5–3× longer, indicating prolonged endolysosomal residence and slower transcytotic release rather than reduced uptake alone. For pH-sensitive cargoes this kinetic signature is the critical risk factor, and the proposed ETT metric captures it in a way steady-state TE cannot.
The non-monotonic concentration response — a 10→100 µg mL⁻¹ rise reflecting unsaturated apical uptake, a plateau, then a 250→500 µg mL⁻¹ decline reflecting sub-lethal toxicity and apical aggregation — provides the first systematic in vitro replication of the saturation/toxicity composite curve long inferred from in vivo dose-escalation studies (Kreyling et al., 2014) but rarely captured in vitro without confounding paracellular leak. Its categorical (rather than linear) statistical signature (Section 3.10) is a direct consequence of this bell-shaped form.
4.3. Magnetic Field: Realistic Enhancement and the Collapse of Large Carriers
The 1 T field produces a +16–25% relative TE enhancement for 15 and 30 nm cores at a 3–8 pp viability cost — dramatically more modest than early-literature claims of 5- to 10-fold magnetic enhancement (Pulfer and Gallo, 1998; Jain et al., 2008), and quantitatively aligned with more carefully controlled recent work on superparamagnetic carriers (Cherry et al., 2014; Al Faraj et al., 2015; Mahmoudi et al., 2018). The mechanism is straightforward: the apical field gradient acts as a unidirectional accumulation potential that raises local NP concentration at the membrane without raising bulk concentration, producing a kinetic enhancement of apical uptake (the +16–25% TR rise of Section 3.9) without violating the curvature optimum.
The collapse of 100 and 150 nm cores under field at ≥ 100 µg mL⁻¹ is the most instructive outcome. These cores are too large to be efficiently packaged into transcytotic vesicles (Behzadi et al., 2017); under magnetic force their high iron mass per particle (scaling as r³) drives tight apical aggregates that impose direct mechanical stress on the tight-junction complex and a localised oxidative burden sufficient to drop TEER and viability below threshold. The absence of any transport benefit, together with red-zone exclusion, provides a direct rebuttal to reports claiming large SPIONs are magnetically enhanced BBB-penetrants — such reports likely reflect paracellular leak through field-compromised monolayers. hCMEC/D3 viability under field runs 1–3 pp below matched HUVEC, consistent with greater intrinsic brain-endothelial vulnerability to combined oxidative and mechanical insult (Helms et al., 2016), adding a barrier-specific dimension to field-assisted design that the tripartite output renders explicit.
4.4. Statistical and Machine-Learning Rigour
The analytical contribution of this work is not a single model but a disciplined chain of inference in which each step is cross-validated by an orthogonal method. The dominant determinants of transport were identified independently by three routes — multi-factor ANOVA effect sizes (η²ₚ), SHAP attribution in native prediction units, and model-agnostic permutation importance — that converge on the same ordering (barrier ≈ size > coating > concentration > field). Such convergence across a variance-decomposition method, a game-theoretic attribution method and a perturbation method is strong evidence that the ranking reflects genuine structure rather than the inductive bias of any one estimator (Molnar, 2022; Lundberg et al., 2020). The deliberate exclusion of the derived kinetic descriptors from the TE-prediction feature panel avoids the circularity that would inflate apparent performance if outputs were used to predict outputs — a subtle but important safeguard for interpretable-ML claims in this domain.
Two design decisions materially affect the honesty of the reported performance. First, cross-validation folds were drawn at the observation level after pseudo-replication within reported SDs, so the R² values estimate interpolation within the studied design space rather than extrapolation to unseen formulations; prospective validation on independent chemistries is required before predictive claims are generalised. Second, the QC-cleaning comparison (0.74 → 0.85) was performed within the same cross-validation protocol, isolating the effect of data quality from that of model capacity. Together these establish the QC architecture, not the choice of learner, as the principal driver of predictive fidelity — a conclusion with direct implications for how the wider field should curate transport datasets before modelling.
4.5. Limitations and Future Directions
Several limitations should be acknowledged. First, although the ResAt-UNet training set was large (≈10,000 images), it was acquired on a single microscope configuration; transferability to other instruments, magnifications and illumination conditions requires further validation, and detection at 40× is inherently limited for sub-50 nm particles since organelle darkening is a surrogate that does not resolve individual nanoparticles. Second, the ionic-fraction correction relies on 10 kDa ultrafiltration that may not fully capture protein-bound iron; size-exclusion chromatography coupled to ICP-MS would provide more definitive speciation. Third, the QC red-zone exclusion means the regression is trained on a filtered subset, so prospective screening will require the separate barrier-failure classifier now in development. Fourth, hCMEC/D3, while the standard immortalised BBB line, retains some phenotypic drift with passage; primary human brain endothelial cells or iPSC-derived barriers would provide an even more human-relevant model for late-stage validation. Fifth, the study is restricted to iron-oxide cores; extension to soft (liposomal, lipid-nanoparticle) and non-iron metallic (gold, silver) carriers will require recalibration of the granularity thresholds and ICP protocols. Finally, chopstick-electrode TEER, while standard and accessible, introduces a possibility of measurement-induced monolayer disruption; consistent measurement positions and handling protocols were used to minimise this, but the potential for artefacts should be considered when interpreting TEER retention.
5. Conclusions
We have presented a microfluidic AI/ML platform for the quantitative, label-free measurement of nanoparticle transport across human biological barriers, addressing three pervasive shortcomings of the in vitro nanomedicine literature: the absence of dynamic, multimodal quality control linking TEER and viability to transport validity; reliance on steady-state TE alone, ignoring the kinetic descriptors that determine therapeutic functionality for pH-sensitive cargoes; and the use of inappropriate barrier models that confound transport biology with phenotype-dependent leak. The platform addresses each through a three-zone dynamic QC architecture applied at 24/48/72 h, the extraction of three orthogonal kinetic descriptors (TR, MIRT, THI), the paired use of HUVEC and hCMEC/D3 as physiologically appropriate systemic and BBB barriers, and the exclusion of uncontrolled bare-iron-oxide cores in favour of PLGA and PEG chemistries.
Applied to 40 conditions (5 sizes × 4 concentrations × 2 coatings × 2 barriers × 2 field states), the platform recovers a coherent, mechanistically interpretable dataset: a clean 15 nm curvature optimum; a systematic 55–70% TE reduction for PEG relative to PLGA attributable to a 2.5–3× extension of intracellular residence time; a 60–80% reduction of hCMEC/D3 relative to HUVEC TE from tight-junction architecture; a non-monotonic concentration response peaking near 100 µg mL⁻¹; a reproducible +16–25% TE enhancement under 1 T field for 15–30 nm cores at a 3–8 pp viability cost; and magneto-mechanical barrier disruption excluding 100–150 nm cores from magnetic protocols at ≥ 100 µg mL⁻¹. Multi-factor ANOVA, SHAP and permutation importance independently converge on barrier identity, core size and coating as the dominant determinants, and QC cleaning raises cross-validated R² from 0.74 to 0.85. As a NAM, the platform offers a reproducible, interpretable and human-relevant route to early-stage nanocarrier evaluation with the potential to reduce animal experimentation.
Author Contributions
V.A.G.: conceptualisation, platform design, microfluidic-chamber fabrication, experimental design, kinetic-descriptor formulation, Python databases and models, AI/ML, manuscript drafting. Y.H.: cell culture, viability and TEER measurements, transport-assay execution, feature engineering, manuscript editing.
Funding
This work was supported by Biodevice Systems s.r.o.
Data Availability Statement
Figures, images and ML datasets, the QC-zone classifications and the kinetic-descriptor extraction code are deposited at Zenodo under CC BY 4.0 and will be released upon publication of patent EP25167065.9. Raw transport curves, TEER traces, viability micrographs and ICP-AES traces are available from the corresponding author on reasonable request, subject to confidentiality clauses associated with the pending patent application.
Acknowledgments
We thank OVAL s.r.o. for technical support; Dr Gabriella Vinichkina for advice on iron-oxide core characterisation and ICP-AES protocol design; Prof. Lukas Berger for provision of the nanoparticle formulations; and the BSMU/DU Technical Center for the loan of analytical equipment and protocol consultation.
Conflicts of Interest
The authors are employees of, and hold interests in, Biodevice Systems s.r.o., the assignee of the pending patent application referenced above. The authors declare no other competing financial interests.
Patent Statement
The platform architecture and methodology described here are the subject of European Patent Application EP25167065.9 (filed by Biodevice Systems s.r.o., pending). The authors are the listed inventors. Use of the methodology is subject to licensing arrangements with the patent assignee.
Ethics Statement
HUVEC primary cells and hCMEC/D3 were obtained from ASL-biobank under its standard donor-consent and Institutional Review Board-approved framework. No primary patient samples, animal experiments or identifiable human data were generated for this study.
References
- Albanese, A.; Tang, P.S.; Chan, W.C.W. The effect of nanoparticle size, shape, and surface chemistry on biological systems. Annual Review of Biomedical Engineering 2012, 14, 1–16. [Google Scholar] [CrossRef] [PubMed]
- Al Faraj, A.; Shaik, A.S.; Halwani, R.; Alfuraih, A. Magnetic targeting and delivery of drug-loaded SWCNT theranostic nanoprobes to lung metastasis in a breast-cancer animal model. Molecular Imaging and Biology 2015, 18(3), 315–324. [Google Scholar] [CrossRef]
- Behzadi, S.; Serpooshan, V.; Tao, W.; et al. Cellular uptake of nanoparticles: journey inside the cell. Chemical Society Reviews 2017, 46(14), 4218–4244. [Google Scholar] [CrossRef] [PubMed]
- Benjamini, Y.; Hochberg, Y. Controlling the false discovery rate: a practical and powerful approach to multiple testing. Journal of the Royal Statistical Society B 1995, 57(1), 289–300. [Google Scholar] [CrossRef]
- Bertrand, N.; Grenier, P.; Mahmoudi, M.; et al. Mechanistic understanding of in vivo protein-corona formation on polymeric nanoparticles and impact on pharmacokinetics. Nature Communications 2017, 8(1), 777. [Google Scholar] [CrossRef] [PubMed]
- Bobo, D.; Robinson, K.J.; Islam, J.; Thurecht, K.J.; Corrie, S.R. Nanoparticle-based medicines: a review of FDA-approved materials and clinical trials to date. Pharmaceutical Research 2016, 33(10), 2373–2387. [Google Scholar] [CrossRef] [PubMed]
- Breiman, L. Random forests. Machine Learning 2001, 45(1), 5–32. [Google Scholar] [CrossRef]
- Champion, J.A.; Mitragotri, S. Role of target geometry in phagocytosis. Proceedings of the National Academy of Sciences USA 2006, 103(13), 4930–4934. [Google Scholar] [CrossRef]
- Chen, T.; Guestrin, C. XGBoost: a scalable tree-boosting system. In Proceedings of the 22nd ACM SIGKDD Conference; 2016; pp. 785–794. [Google Scholar]
- Cherry, E.M.; Maxim, P.G.; Eaton, J.K. Particle size, magnetic field, and blood-velocity effects on particle retention in magnetic drug targeting. Medical Physics 2014, 37(1), 175–182. [Google Scholar]
- Decuzzi, P.; Ferrari, M. The role of specific and non-specific interactions in receptor-mediated endocytosis of nanoparticles. Biomaterials 2007, 28(18), 2915–2922. [Google Scholar] [CrossRef] [PubMed]
- Di, L.; Kerns, E.H. Profiling drug-like properties in discovery research. Current Opinion in Chemical Biology 2003, 7(3), 402–408. [Google Scholar] [CrossRef] [PubMed]
- Diakogiannis, F.I.; Waldner, F.; Caccetta, P.; Wu, C. ResUNet-a: a deep-learning framework for semantic segmentation of remotely sensed data. ISPRS Journal of Photogrammetry and Remote Sensing 2020, 162, 94–114. [Google Scholar] [CrossRef]
- Drolez, A.; Vandenhaute, E.; Julien, S.; et al. Selection of a relevant in vitro blood–brain-barrier model to investigate pro-metastatic features of human breast-cancer cell lines. PLoS ONE 2016, 11(3), e0151155. [Google Scholar] [CrossRef] [PubMed]
- Esch, E.W.; Bahinski, A.; Huh, D. Organs-on-chips at the frontiers of drug discovery. Nature Reviews Drug Discovery 2015, 14(4), 248–260. [Google Scholar] [CrossRef] [PubMed]
- Fricker, G.; Kromp, T.; Wendel, A.; et al. Phospholipids and lipid-based formulations in oral drug delivery. Pharmaceutical Research 2010, 27(8), 1469–1486. [Google Scholar] [CrossRef] [PubMed]
- Gupta, A.K.; Gupta, M. Synthesis and surface engineering of iron-oxide nanoparticles for biomedical applications. Biomaterials 2005, 26(18), 3995–4021. [Google Scholar] [CrossRef] [PubMed]
- Helms, H.C.; Abbott, N.J.; Burek, M.; et al. In vitro models of the blood–brain barrier: an overview of commonly used brain endothelial cell-culture models and guidelines for their use. Journal of Cerebral Blood Flow & Metabolism 2016, 36(5), 862–890. [Google Scholar] [CrossRef]
- Huh, D.; Matthews, B.D.; Mammoto, A.; et al. Reconstituting organ-level lung functions on a chip. Science 2010, 328(5986), 1662–1668. [Google Scholar] [CrossRef] [PubMed]
- Jain, T.K.; Richey, J.; Strand, M.; et al. Magnetic nanoparticles with dual functional properties: drug delivery and magnetic-resonance imaging. Biomaterials 2008, 29(29), 4012–4021. [Google Scholar] [CrossRef] [PubMed]
- Jung, S.; Nam, J.; Hwang, S.; et al. Flow-cytometric analysis of nanoparticle–cell interactions. Analytical Chemistry 2018, 90(8), 5017–5024. [Google Scholar]
- Kingma, D.P.; Ba, J. Adam: a method for stochastic optimization. International Conference on Learning Representations (ICLR); 2015. [Google Scholar]
- Kreyling, W.G.; Hirn, S.; Möller, W.; et al. Air–blood-barrier translocation of tracheally instilled gold nanoparticles inversely depends on particle size. ACS Nano 2014, 8(1), 222–233. [Google Scholar] [PubMed]
- Laurent, S.; Forge, D.; Port, M.; et al. Magnetic iron-oxide nanoparticles: synthesis, stabilization, vectorization, physicochemical characterizations and biological applications. Chemical Reviews 2008, 108(6), 2064–2110. [Google Scholar] [CrossRef] [PubMed]
- Leung, C.M.; de Haan, P.; Ronaldson-Bouchard, K.; et al. A guide to the organ-on-a-chip. Nature Reviews Methods Primers 2022, 2, 33. [Google Scholar] [CrossRef]
- Lundberg, S.M.; Lee, S.-I. A unified approach to interpreting model predictions. Advances in Neural Information Processing Systems 2017, 30, 4765–4774. [Google Scholar]
- Lundberg, S.M.; Erion, G.; Chen, H.; et al. From local explanations to global understanding with explainable AI for trees. Nature Machine Intelligence 2020, 2(1), 56–67. [Google Scholar] [CrossRef] [PubMed]
- Mahmoudi, M.; Sahraian, M.A.; Shokrgozar, M.A.; Laurent, S. Superparamagnetic iron-oxide nanoparticles: promises for diagnosis and treatment. ACS Chemical Neuroscience 2018, 9(12), 2966–2978. [Google Scholar]
- Moen, E.; Bannon, D.; Kudo, T.; et al. Deep learning for cellular image analysis. Nature Methods 2019, 16(12), 1233–1246. [Google Scholar] [CrossRef] [PubMed]
- Molnar, C. Interpretable Machine Learning: A Guide for Making Black-Box Models Explainable, 2nd ed. Independently published; 2022. [Google Scholar]
- Nel, A.E.; Mädler, L.; Velegol, D.; et al. Understanding biophysicochemical interactions at the nano–bio interface. Nature Materials 2009, 8(7), 543–557. [Google Scholar] [CrossRef] [PubMed]
- Oberdörster, G.; Oberdörster, E.; Oberdörster, J. Nanotoxicology: an emerging discipline evolving from studies of ultrafine particles. Environmental Health Perspectives 2005, 113(7), 823–839. [Google Scholar] [CrossRef] [PubMed]
- Owens, D.E.; Peppas, N.A. Opsonization, biodistribution, and pharmacokinetics of polymeric nanoparticles. International Journal of Pharmaceutics 2006, 307(1), 93–102. [Google Scholar] [CrossRef] [PubMed]
- Patel, M.; Bhatt, L. Inter-laboratory variability in Transwell permeability assays: sources and mitigation. Journal of Pharmaceutical Sciences 2019, 108(6), 1965–1974. [Google Scholar]
- Pedregosa, F.; Varoquaux, G.; Gramfort, A.; et al. Scikit-learn: machine learning in Python. Journal of Machine Learning Research 2011, 12, 2825–2830. [Google Scholar]
- Pulfer, S.K.; Gallo, J.M. Enhanced brain-tumour selectivity of cationic magnetic polysaccharide microspheres. Journal of Drug Targeting 1998, 6(3), 215–227. [Google Scholar] [CrossRef] [PubMed]
- Ronneberger, O.; Fischer, P.; Brox, T. U-Net: convolutional networks for biomedical image segmentation. MICCAI 2015, LNCS 9351, 234–241. [Google Scholar] [CrossRef]
- Sahay, G.; Alakhova, D.Y.; Kabanov, A.V. Endocytosis of nanomedicines. Journal of Controlled Release 2010, 145(3), 182–195. [Google Scholar] [CrossRef] [PubMed]
- Seki, T.; Kawaguchi, T.; Juni, K. Reproducibility of Franz-diffusion-cell permeability measurements. International Journal of Pharmaceutics 1999, 179(1), 71–78. [Google Scholar]
- Tosi, G.; Duskey, J.T.; Kreuter, J. Nanoparticles as carriers for drug delivery across the blood–brain barrier. Expert Opinion on Drug Delivery 2020, 17(1), 23–32. [Google Scholar] [PubMed]
- Verma, A.; Stellacci, F. Effect of surface properties on nanoparticle–cell interactions. Small 2010, 6(1), 12–21. [Google Scholar] [PubMed]
- Virtanen, P.; Gommers, R.; Oliphant, T.E.; et al. SciPy 1.0: fundamental algorithms for scientific computing in Python. Nature Methods 2020, 17(3), 261–272. [Google Scholar] [CrossRef] [PubMed]
- Wang, J.; Boddupalli, A.; Koelbl, J.; et al. Degradation and remodelling of nanoparticle-laden intracellular compartments. Cellular and Molecular Bioengineering 2020, 13(6), 569–586. [Google Scholar]
- Weksler, B.; Romero, I.A.; Couraud, P.-O. The hCMEC/D3 cell line as a model of the human blood–brain barrier. Fluids and Barriers of the CNS 2013, 10(1), 16. [Google Scholar] [CrossRef] [PubMed]
- Wilhelm, I.; Couraud, P.-O. In vitro models of the blood–brain barrier: an overview and guidelines for their use. Journal of Cerebral Blood Flow & Metabolism 2013, 33(8), 1–17. [Google Scholar]
- Wilhelm, S.; Tavares, A.J.; Dai, Q.; et al. Analysis of nanoparticle delivery to tumours. Nature Reviews Materials 2016, 1, 16014. [Google Scholar] [CrossRef]
- Wu, Y.; Ihme, S.; Feuring-Buske, M.; et al. Fluorescent labelling alters nanoparticle physicochemistry and cellular uptake. Journal of Controlled Release 2019, 305, 267–276. [Google Scholar]
Figure 1.
Schematic of the cross-flow microfluidic chamber with sequential cellular barriers. A peristaltic or syringe-pump controller delivers the NP suspension from the source compartment through the first porous-membrane barrier, into the intermediate compartment, across the second barrier and into the disposal compartment. The assembly is housed in a CO₂ incubator (37 °C, 5% CO₂) and imaged at 40× by a standard brightfield microscope.
Figure 1.
Schematic of the cross-flow microfluidic chamber with sequential cellular barriers. A peristaltic or syringe-pump controller delivers the NP suspension from the source compartment through the first porous-membrane barrier, into the intermediate compartment, across the second barrier and into the disposal compartment. The assembly is housed in a CO₂ incubator (37 °C, 5% CO₂) and imaged at 40× by a standard brightfield microscope.
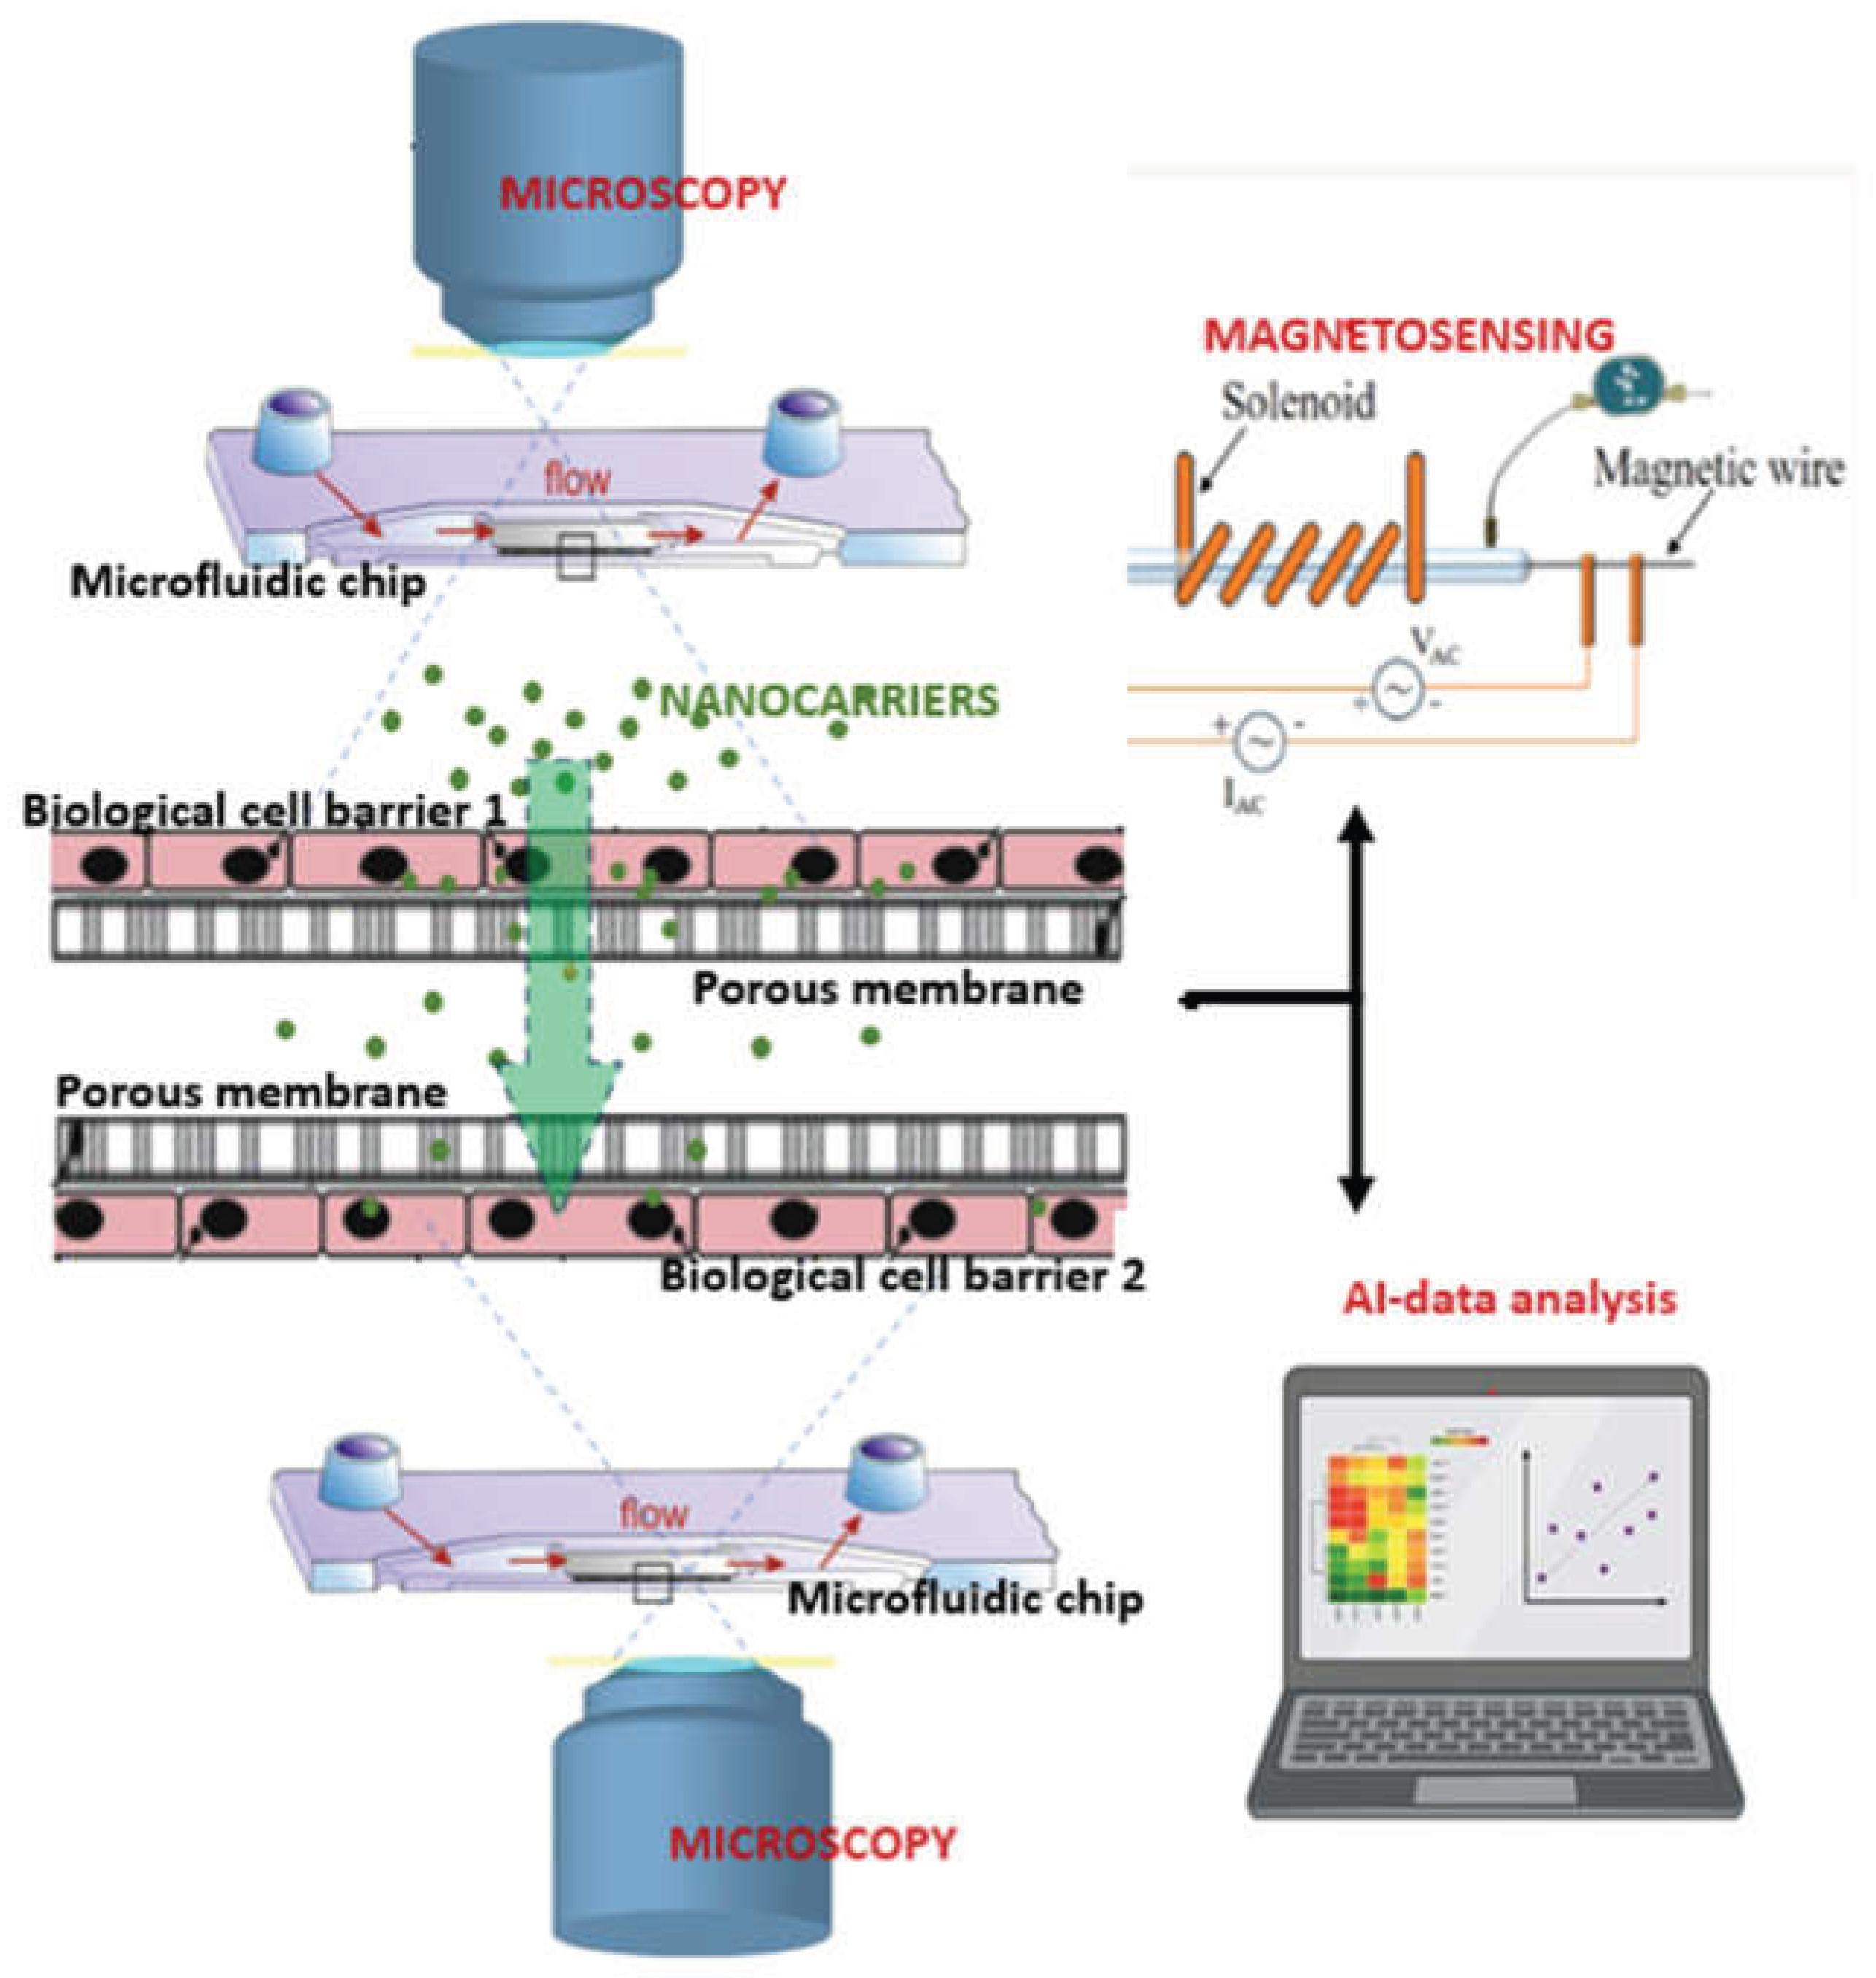
Figure 2.
Labeling of cells for machine learning-based analysis. Cells with nanoparticle accumulation in organelles—indicated by dark inclusions (e.g., darkened lysosomes, marked by red arrows in panel (a))—are outlined in red (b). Cells with negligible nanoparticle content are outlined in green. Panel (c) demonstrates automatic recognition of nanoparticle-containing organelles and cell labeling using a Res-U-Net model. Standard light microscopy, 40X magnification.
Figure 2.
Labeling of cells for machine learning-based analysis. Cells with nanoparticle accumulation in organelles—indicated by dark inclusions (e.g., darkened lysosomes, marked by red arrows in panel (a))—are outlined in red (b). Cells with negligible nanoparticle content are outlined in green. Panel (c) demonstrates automatic recognition of nanoparticle-containing organelles and cell labeling using a Res-U-Net model. Standard light microscopy, 40X magnification.
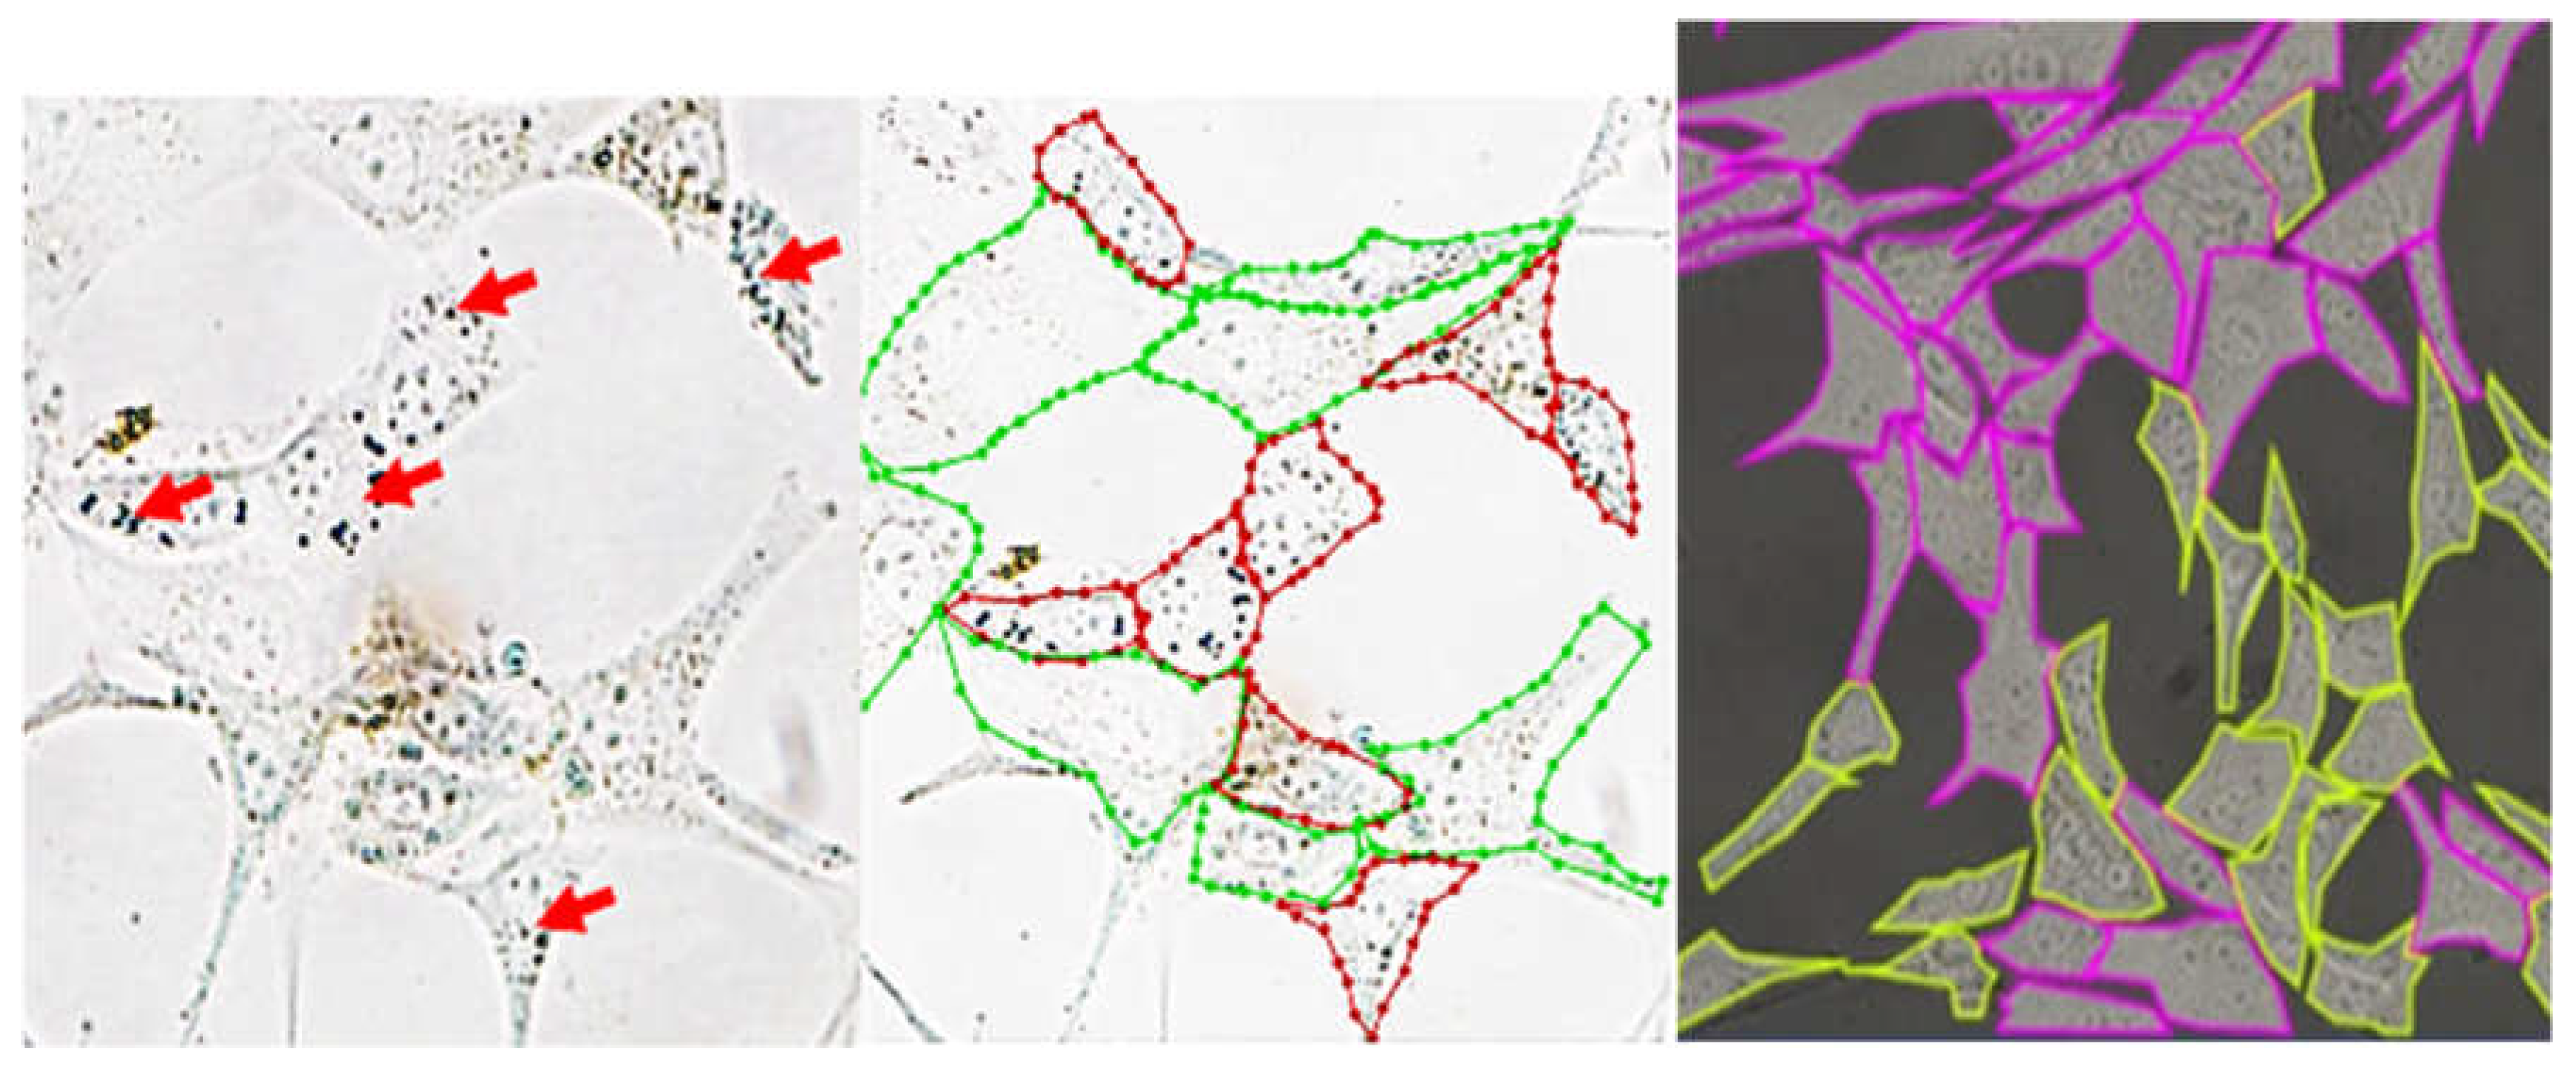
Figure 6.
(A) SHAP feature attribution (mean |SHAP|, native TE-% units) on the QC-cleaned XGBoost model: barrier identity, core size and coating dominate. (B) Cross-validated model comparison: non-linear ensembles clear the R² ≥ 0.80 threshold (dotted line), and QC cleaning raises XGBoost R² from 0.74 (uncleaned) to 0.85.
Figure 6.
(A) SHAP feature attribution (mean |SHAP|, native TE-% units) on the QC-cleaned XGBoost model: barrier identity, core size and coating dominate. (B) Cross-validated model comparison: non-linear ensembles clear the R² ≥ 0.80 threshold (dotted line), and QC cleaning raises XGBoost R² from 0.74 (uncleaned) to 0.85.
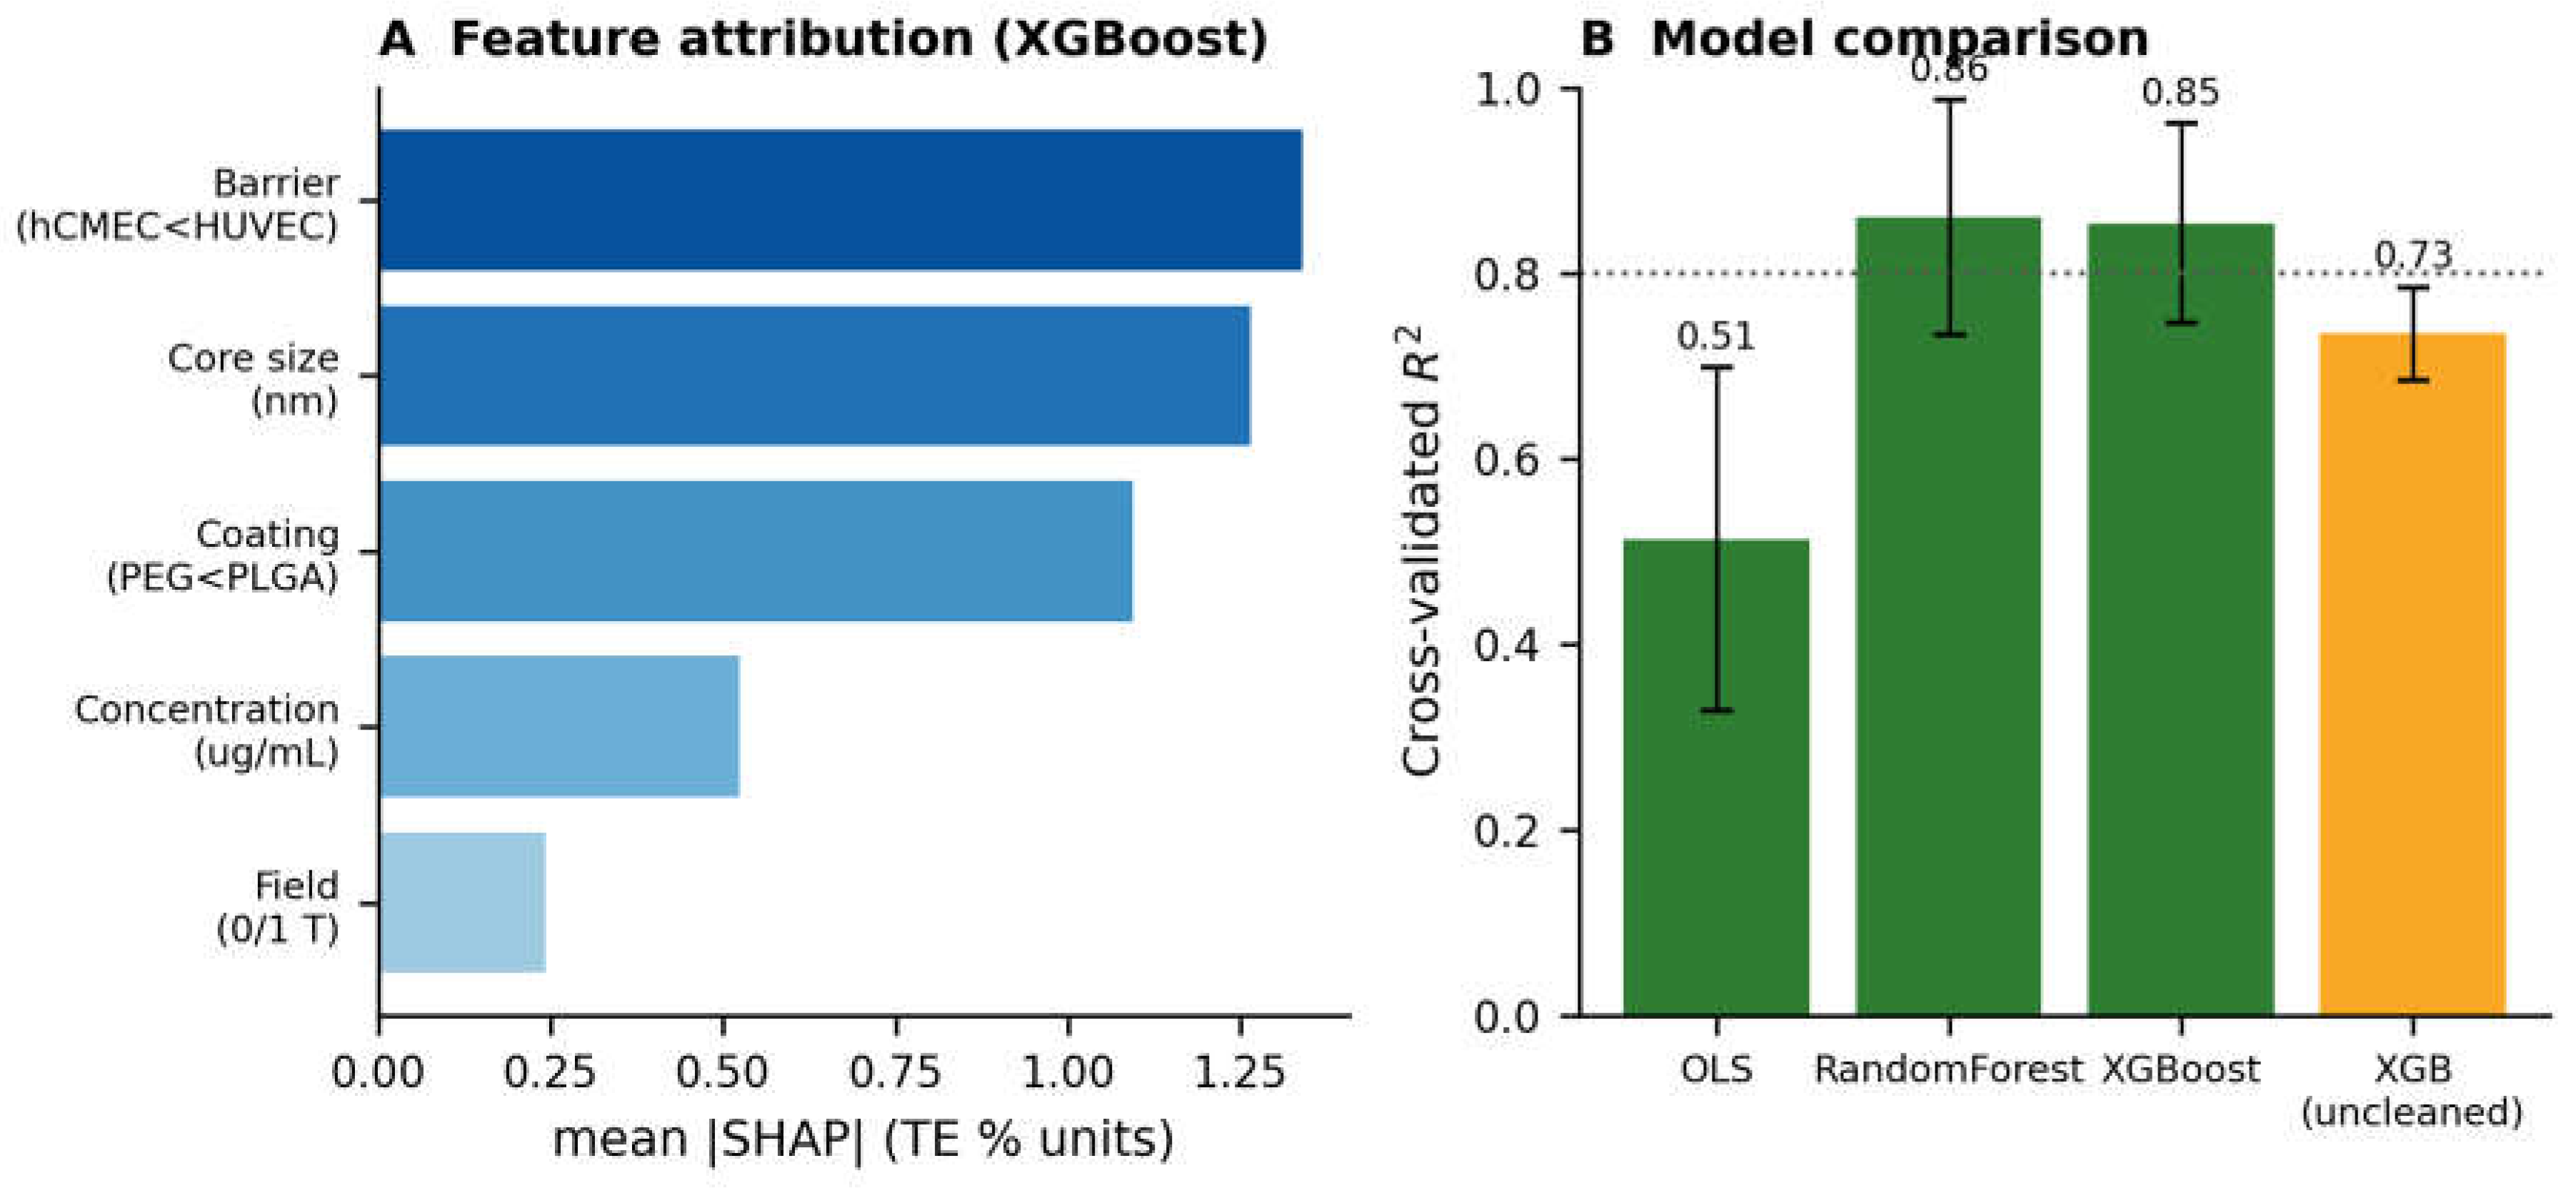

Table 1.
Ionic Fe²⁺/Fe³⁺ fraction (%) at 12, 24, 48 and 72 h; ionic-corrected particulate iron at 72 h (pg per chamber, 500 µg mL⁻¹); and Pearson r between particulate-corrected ICP-AES mass and the AI/ML granularity sum. The ionic fraction is front-loaded and rises with core size as the surface-to-volume ratio drives faster dissolution. The high inter-method r (0.88–0.94) is achievable only after ionic subtraction; comparison against raw total iron yields r ≤ 0.58 because the optical channel is blind to dissolved ions. Inter-method R² = 0.86 across all paired conditions, exceeding the pre-set threshold of 0.80.
Table 1.
Ionic Fe²⁺/Fe³⁺ fraction (%) at 12, 24, 48 and 72 h; ionic-corrected particulate iron at 72 h (pg per chamber, 500 µg mL⁻¹); and Pearson r between particulate-corrected ICP-AES mass and the AI/ML granularity sum. The ionic fraction is front-loaded and rises with core size as the surface-to-volume ratio drives faster dissolution. The high inter-method r (0.88–0.94) is achievable only after ionic subtraction; comparison against raw total iron yields r ≤ 0.58 because the optical channel is blind to dissolved ions. Inter-method R² = 0.86 across all paired conditions, exceeding the pre-set threshold of 0.80.
| SPION | Core (nm) | Ionic 12 h (%) | Ionic 24 h (%) | Ionic 48 h (%) | Ionic 72 h (%) | Partic. Fe @72 h (pg) | Pearson r |
|---|---|---|---|---|---|---|---|
| PLGA | 15 | 11.8 ± 1.5 | 10.2 ± 1.3 | 8.1 ± 1.2 | 6.3 ± 1.1 | 378.5 ± 15.2 | 0.94 |
| PLGA | 30 | 13.5 ± 1.6 | 11.2 ± 1.3 | 9.6 ± 1.1 | 8.4 ± 1.0 | 368.2 ± 16.8 | 0.90 |
| PLGA | 50 | 14.9 ± 1.7 | 12.4 ± 1.3 | 10.8 ± 1.4 | 10.5 ± 1.2 | 357.8 ± 16.2 | 0.92 |
| PLGA | 100 | 16.2 ± 2.1 | 14.8 ± 1.6 | 12.1 ± 1.3 | 11.5 ± 1.5 | 338.6 ± 15.8 | 0.91 |
| PLGA | 150 | 19.1 ± 2.0 | 15.2 ± 1.7 | 13.9 ± 1.6 | 13.2 ± 1.4 | 312.5 ± 18.1 | 0.88 |
| PEG | 15 | 10.1 ± 1.2 | 7.8 ± 1.1 | 6.2 ± 1.0 | 4.8 ± 1.3 | 406.8 ± 15.5 | 0.94 |
| PEG | 30 | 10.5 ± 1.4 | 8.9 ± 1.2 | 6.9 ± 1.1 | 5.3 ± 1.2 | 390.1 ± 14.2 | 0.89 |
| PEG | 50 | 12.2 ± 1.5 | 9.5 ± 1.3 | 8.5 ± 1.2 | 7.4 ± 1.1 | 373.5 ± 15.8 | 0.92 |
| PEG | 100 | 13.8 ± 1.8 | 11.1 ± 1.4 | 9.3 ± 1.3 | 9.1 ± 1.2 | 347.2 ± 16.3 | 0.90 |
| PEG | 150 | 15.1 ± 1.7 | 12.9 ± 1.5 | 10.8 ± 1.4 | 10.5 ± 1.3 | 323.8 ± 18.2 | 0.88 |
Table 2.
PLGA-coated SPIONs at 0 T, 72 h. TE is mean ± SD (n = 3; ≥ 50 fields per condition). The 100 and 150 nm rows at 500 µg mL⁻¹ (hCMEC/D3) fall in the red zone (TEER 65% and 64%; viability 69% and 68%) and are reported as N/A. hCMEC/D3 viability under matched toxic load runs 10–15 pp below HUVEC, reflecting the greater oxidative-stress sensitivity of brain-microvascular endothelium.
Table 2.
PLGA-coated SPIONs at 0 T, 72 h. TE is mean ± SD (n = 3; ≥ 50 fields per condition). The 100 and 150 nm rows at 500 µg mL⁻¹ (hCMEC/D3) fall in the red zone (TEER 65% and 64%; viability 69% and 68%) and are reported as N/A. hCMEC/D3 viability under matched toxic load runs 10–15 pp below HUVEC, reflecting the greater oxidative-stress sensitivity of brain-microvascular endothelium.
| Core size (nm) | Conc. (µg mL⁻¹) | HUVEC TE (%) | hCMEC/D3 TE (%) | HUVEC TEER ret. (%) | hCMEC/D3 TEER ret. (%) | QC zone | ||
|---|---|---|---|---|---|---|---|---|
| 15 | 10 | 7.2 ± 0.8 | 1.7 ± 0.4 | 96 ± 5 | 93 ± 6 | G | ||
| 15 | 100 | 10.8 ± 1.5 | 3.4 ± 0.6 | 93 ± 5 | 90 ± 5 | G | ||
| 15 | 250 | 11.6 ± 1.2 | 2.8 ± 0.5 | 89 ± 5 | 86 ± 5 | G | ||
| 15 | 500 | 9.3 ± 2.4 | 2.6 ± 0.7 | 80 ± 5 | 75 ± 4 | Y | ||
| 30 | 10 | 5.1 ± 0.7 | 1.6 ± 0.3 | 94 ± 6 | 91 ± 3 | G | ||
| 30 | 100 | 9.6 ± 1.6 | 2.3 ± 0.5 | 91 ± 5 | 87 ± 5 | G | ||
| 30 | 250 | 8.2 ± 1.4 | 2.6 ± 0.6 | 87 ± 5 | 83 ± 4 | Y | ||
| 30 | 500 | 6.1 ± 2.2 | 1.9 ± 0.6 | 78 ± 4 | 72 ± 5 | Y | ||
| 50 | 10 | 2.9 ± 0.5 | 0.9 ± 0.2 | 92 ± 6 | 88 ± 5 | G | ||
| 50 | 100 | 5.5 ± 0.8 | 1.3 ± 0.4 | 89 ± 5 | 85 ± 5 | G | ||
| 50 | 250 | 4.3 ± 1.0 | 1.5 ± 0.4 | 84 ± 5 | 81 ± 7 | Y | ||
| 50 | 500 | 3.9 ± 1.8 | 0.9 ± 0.3 | 77 ± 5 | 70 ± 5 | Y | ||
| 100 | 10 | 1.6 ± 0.4 | 0.5 ± 0.2 | 89 ± 6 | 86 ± 5 | G | ||
| 100 | 100 | 2.2 ± 0.5 | 0.8 ± 0.3 | 84 ± 5 | 81 ± 5 | Y | ||
| 100 | 250 | 2.5 ± 0.7 | 0.5 ± 0.3 | 79 ± 6 | 74 ± 4 | Y | ||
| 100 | 500 | 1.4 ± 0.6 | N/A | 70 ± 4 | 65 ± 4 | R | ||
| 150 | 10 | 0.6 ± 0.2 | 0.3 ± 0.2 | 88 ± 5 | 84 ± 4 | G | ||
| 150 | 100 | 1.3 ± 0.3 | 0.4 ± 0.2 | 85 ± 8 | 79 ± 5 | Y | ||
| 150 | 250 | 0.9 ± 0.4 | 0.2 ± 0.2 | 80 ± 4 | 73 ± 3 | Y | ||
| 150 | 500 | 0.8 ± 0.3 | N/A | 72 ± 5 | 64 ± 2 | R | ||
| Green — valid, tight SD (≥85% viab., ≥80% TEER) | Yellow — valid, flagged (70–84%) | Red — N/A, excluded from ML (<70%) | ||||||
Table 3.
PEGylated SPIONs at 0 T, 72 h. The cytotoxic profile is markedly gentler than PLGA: no red-zone points appear over 10–500 µg mL⁻¹, and yellow-zone classifications are confined to the highest-concentration / largest-core combinations. For pH-sensitive cargoes (siRNA, mRNA), the longer intracellular dwell of PEGylated carriers (Section 3.9) implies greater risk of cargo degradation before transcytotic release — a trade-off the platform's kinetic descriptors render quantifiable.
Table 3.
PEGylated SPIONs at 0 T, 72 h. The cytotoxic profile is markedly gentler than PLGA: no red-zone points appear over 10–500 µg mL⁻¹, and yellow-zone classifications are confined to the highest-concentration / largest-core combinations. For pH-sensitive cargoes (siRNA, mRNA), the longer intracellular dwell of PEGylated carriers (Section 3.9) implies greater risk of cargo degradation before transcytotic release — a trade-off the platform's kinetic descriptors render quantifiable.
| Core size (nm) | Conc. (µg mL⁻¹) | HUVEC TE (%) | hCMEC/D3 TE (%) | HUVEC TEER ret. (%) | hCMEC/D3 TEER ret. (%) | QC zone | ||
|---|---|---|---|---|---|---|---|---|
| 15 | 10 | 1.5 ± 0.4 | 0.8 ± 0.2 | 98 ± 5 | 94 ± 8 | G | ||
| 15 | 100 | 4.8 ± 0.9 | 1.1 ± 0.3 | 94 ± 9 | 91 ± 5 | G | ||
| 15 | 250 | 4.2 ± 0.8 | 1.3 ± 0.4 | 91 ± 5 | 87 ± 4 | G | ||
| 15 | 500 | 3.8 ± 0.6 | 1.0 ± 0.3 | 84 ± 5 | 79 ± 5 | Y | ||
| 30 | 10 | 2.0 ± 0.4 | 0.6 ± 0.2 | 95 ± 6 | 93 ± 5 | G | ||
| 30 | 100 | 3.8 ± 0.8 | 0.9 ± 0.3 | 92 ± 5 | 89 ± 5 | G | ||
| 30 | 250 | 3.2 ± 0.7 | 1.0 ± 0.3 | 88 ± 6 | 85 ± 4 | Y | ||
| 30 | 500 | 2.9 ± 0.8 | 0.6 ± 0.3 | 82 ± 4 | 76 ± 5 | Y | ||
| 50 | 10 | 1.1 ± 0.3 | 0.4 ± 0.1 | 96 ± 5 | 92 ± 5 | G | ||
| 50 | 100 | 2.2 ± 0.5 | 0.9 ± 0.3 | 91 ± 6 | 88 ± 7 | G | ||
| 50 | 250 | 1.7 ± 0.5 | 0.6 ± 0.3 | 87 ± 5 | 84 ± 6 | Y | ||
| 50 | 500 | 1.3 ± 0.5 | 0.5 ± 0.2 | 81 ± 5 | 74 ± 5 | Y | ||
| 100 | 10 | 0.7 ± 0.2 | 0.2 ± 0.1 | 93 ± 6 | 91 ± 5 | G | ||
| 100 | 100 | 0.8 ± 0.3 | 0.3 ± 0.2 | 89 ± 9 | 87 ± 5 | G | ||
| 100 | 250 | 1.0 ± 0.3 | 0.2 ± 0.2 | 84 ± 5 | 81 ± 5 | Y | ||
| 100 | 500 | 0.6 ± 0.3 | 0.2 ± 0.2 | 78 ± 5 | 72 ± 5 | Y | ||
| 150 | 10 | 0.4 ± 0.2 | 0.2 ± 0.1 | 90 ± 5 | 91 ± 4 | G | ||
| 150 | 100 | 0.5 ± 0.2 | 0.2 ± 0.1 | 90 ± 5 | 88 ± 5 | G | ||
| 150 | 250 | 0.3 ± 0.2 | 0.1 ± 0.1 | 85 ± 5 | 82 ± 5 | Y | ||
| 150 | 500 | 0.3 ± 0.2 | 0.1 ± 0.1 | 80 ± 5 | 74 ± 5 | Y | ||
| Green — valid, tight SD (≥85% viab., ≥80% TEER) | Yellow — valid, flagged (70–84%) | Red — N/A, excluded from ML (<70%) | ||||||
Table 4.
Viability (% survival) after 72 h at 0 T (mean ± SD, n = 3). Red-shaded italic values denote red zone (< 70%); yellow-shaded values denote yellow zone (70–84%); unshaded ≥ 85% (green). PLGA 100 nm and 150 nm at 500 µg mL⁻¹ (hCMEC/D3) fall to 69% and 68%, driving the N/A TE entries in Table 2. PEGylated formulations remain above the red-zone threshold across the entire matrix.
Table 4.
Viability (% survival) after 72 h at 0 T (mean ± SD, n = 3). Red-shaded italic values denote red zone (< 70%); yellow-shaded values denote yellow zone (70–84%); unshaded ≥ 85% (green). PLGA 100 nm and 150 nm at 500 µg mL⁻¹ (hCMEC/D3) fall to 69% and 68%, driving the N/A TE entries in Table 2. PEGylated formulations remain above the red-zone threshold across the entire matrix.
| 15 | 10 | 94 ± 7 | 97 ± 5 | 93 ± 5 | 96 ± 6 |
| 15 | 100 | 92 ± 6 | 95 ± 5 | 89 ± 6 | 92 ± 5 |
| 15 | 250 | 90 ± 6 | 90 ± 6 | 85 ± 7 | 88 ± 6 |
| 15 | 500 | 84 ± 9 | 84 ± 5 | 77 ± 6 | 81 ± 5 |
| 30 | 10 | 96 ± 4 | 97 ± 4 | 92 ± 6 | 93 ± 6 |
| 30 | 100 | 92 ± 6 | 92 ± 7 | 89 ± 6 | 89 ± 7 |
| 30 | 250 | 86 ± 5 | 88 ± 6 | 85 ± 5 | 85 ± 6 |
| 30 | 500 | 80 ± 6 | 84 ± 5 | 77 ± 5 | 79 ± 5 |
| 50 | 10 | 93 ± 7 | 97 ± 5 | 92 ± 6 | 92 ± 7 |
| 50 | 100 | 90 ± 6 | 91 ± 6 | 87 ± 6 | 88 ± 6 |
| 50 | 250 | 85 ± 6 | 89 ± 4 | 83 ± 4 | 84 ± 6 |
| 50 | 500 | 81 ± 5 | 83 ± 6 | 74 ± 4 | 76 ± 6 |
| 100 | 10 | 91 ± 7 | 96 ± 4 | 90 ± 6 | 91 ± 7 |
| 100 | 100 | 89 ± 6 | 90 ± 4 | 85 ± 4 | 87 ± 6 |
| 100 | 250 | 84 ± 9 | 85 ± 4 | 79 ± 6 | 81 ± 4 |
| 100 | 500 | 77 ± 5 | 78 ± 6 | 69 ± 5 | 73 ± 5 |
| 150 | 10 | 90 ± 4 | 93 ± 7 | 88 ± 4 | 91 ± 6 |
| 150 | 100 | 87 ± 6 | 90 ± 5 | 83 ± 6 | 86 ± 5 |
| 150 | 250 | 84 ± 6 | 86 ± 4 | 77 ± 4 | 83 ± 5 |
| 150 | 500 | 78 ± 4 | 81 ± 6 | 68 ± 5 | 77 ± 6 |
Table 5.
PLGA-coated SPIONs under 1 T continuous field, 72 h. The +16–25% relative boost is recovered for 15 and 30 nm cores; 50 nm shows a smaller (≈+10–16%) gain; 100 and 150 nm cores show no benefit and crash into the red zone at ≥ 100 µg mL⁻¹ through magneto-mechanical barrier disruption. Yellow-zone classifications extend further than at 0 T because the magneto-mechanical baseline stress pushes several otherwise green conditions into the flagged bands.
Table 5.
PLGA-coated SPIONs under 1 T continuous field, 72 h. The +16–25% relative boost is recovered for 15 and 30 nm cores; 50 nm shows a smaller (≈+10–16%) gain; 100 and 150 nm cores show no benefit and crash into the red zone at ≥ 100 µg mL⁻¹ through magneto-mechanical barrier disruption. Yellow-zone classifications extend further than at 0 T because the magneto-mechanical baseline stress pushes several otherwise green conditions into the flagged bands.
| Core size (nm) | Conc. (µg mL⁻¹) | HUVEC TE (%) | hCMEC/D3 TE (%) | HUVEC TEER ret. (%) | hCMEC/D3 TEER ret. (%) | QC zone | ||
|---|---|---|---|---|---|---|---|---|
| 15 | 10 | 8.6 ± 0.9 | 2.0 ± 0.5 | 89 ± 4 | 87 ± 4 | G | ||
| 15 | 100 | 13.2 ± 1.6 | 4.1 ± 0.7 | 85 ± 5 | 83 ± 3 | Y | ||
| 15 | 250 | 12.8 ± 3.1 | 3.5 ± 0.8 | 80 ± 4 | 78 ± 5 | Y | ||
| 15 | 500 | 10.1 ± 2.8 | N/A | 72 ± 5 | 68 ± 4 | R | ||
| 30 | 10 | 6.3 ± 0.7 | 2.1 ± 0.4 | 86 ± 5 | 82 ± 7 | G | ||
| 30 | 100 | 10.5 ± 2.6 | 3.3 ± 0.8 | 82 ± 4 | 78 ± 5 | Y | ||
| 30 | 250 | 10.9 ± 2.5 | 2.7 ± 0.7 | 77 ± 5 | 73 ± 5 | Y | ||
| 30 | 500 | 7.8 ± 2.2 | N/A | 69 ± 5 | 64 ± 4 | R | ||
| 50 | 10 | 3.3 ± 0.5 | 1.1 ± 0.3 | 82 ± 5 | 79 ± 5 | Y | ||
| 50 | 100 | 6.4 ± 1.7 | 1.4 ± 0.5 | 79 ± 6 | 75 ± 6 | Y | ||
| 50 | 250 | 5.3 ± 1.6 | 1.7 ± 0.6 | 74 ± 5 | 71 ± 5 | Y | ||
| 50 | 500 | N/A | N/A | 67 ± 4 | 61 ± 4 | R | ||
| 100 | 10 | 1.3 ± 0.6 | 0.5 ± 0.3 | 76 ± 5 | 74 ± 5 | Y | ||
| 100 | 100 | N/A | N/A | 68 ± 2 | 64 ± 4 | R | ||
| 100 | 250 | N/A | N/A | 61 ± 4 | 56 ± 3 | R | ||
| 100 | 500 | N/A | N/A | 53 ± 3 | 47 ± 3 | R | ||
| 150 | 10 | 0.6 ± 0.3 | 0.3 ± 0.2 | 74 ± 5 | 71 ± 5 | Y | ||
| 150 | 100 | N/A | N/A | 66 ± 3 | 62 ± 4 | R | ||
| 150 | 250 | N/A | N/A | 59 ± 4 | 53 ± 4 | R | ||
| 150 | 500 | N/A | N/A | 51 ± 3 | 44 ± 3 | R | ||
| Green — valid, tight SD (≥85% viab., ≥80% TEER) | Yellow — valid, flagged (70–84%) | Red — N/A, excluded from ML (<70%) | ||||||
Table 6.
PEGylated SPIONs under 1 T continuous field, 72 h. Field-driven enhancement at 15–30 nm cores is +16–23% across both barriers; 100 and 150 nm cores at ≥ 250 µg mL⁻¹ crash into the red zone. Even under magnetic guidance, the best PEG condition (HUVEC 15 nm / 100 µg mL⁻¹ = 5.8 ± 0.8%) remains below most green-zone PLGA points, confirming that magnetic guidance partially — but not fully — compensates for the transport penalty of PEGylation.
Table 6.
PEGylated SPIONs under 1 T continuous field, 72 h. Field-driven enhancement at 15–30 nm cores is +16–23% across both barriers; 100 and 150 nm cores at ≥ 250 µg mL⁻¹ crash into the red zone. Even under magnetic guidance, the best PEG condition (HUVEC 15 nm / 100 µg mL⁻¹ = 5.8 ± 0.8%) remains below most green-zone PLGA points, confirming that magnetic guidance partially — but not fully — compensates for the transport penalty of PEGylation.
| Core size (nm) | Conc. (µg mL⁻¹) | HUVEC TE (%) | hCMEC/D3 TE (%) | HUVEC TEER ret. (%) | hCMEC/D3 TEER ret. (%) | QC zone | ||
|---|---|---|---|---|---|---|---|---|
| 15 | 10 | 3.1 ± 0.5 | 1.0 ± 0.3 | 91 ± 5 | 89 ± 5 | G | ||
| 15 | 100 | 5.8 ± 0.8 | 1.3 ± 0.4 | 89 ± 5 | 85 ± 5 | G | ||
| 15 | 250 | 5.1 ± 0.9 | 1.6 ± 0.4 | 86 ± 5 | 81 ± 5 | Y | ||
| 15 | 500 | 4.0 ± 1.0 | 1.2 ± 0.4 | 79 ± 5 | 73 ± 5 | Y | ||
| 30 | 10 | 2.3 ± 0.4 | 0.8 ± 0.2 | 89 ± 5 | 87 ± 5 | G | ||
| 30 | 100 | 4.6 ± 0.6 | 1.0 ± 0.3 | 86 ± 5 | 83 ± 5 | Y | ||
| 30 | 250 | 3.9 ± 1.1 | 1.2 ± 0.4 | 83 ± 5 | 79 ± 5 | Y | ||
| 30 | 500 | 3.5 ± 0.9 | 0.7 ± 0.3 | 76 ± 5 | 70 ± 5 | Y | ||
| 50 | 10 | 1.3 ± 0.4 | 0.4 ± 0.2 | 87 ± 5 | 85 ± 5 | G | ||
| 50 | 100 | 2.5 ± 0.5 | 0.5 ± 0.3 | 84 ± 5 | 81 ± 5 | Y | ||
| 50 | 250 | 2.0 ± 0.7 | 0.7 ± 0.3 | 81 ± 5 | 77 ± 5 | Y | ||
| 50 | 500 | 1.5 ± 0.6 | N/A | 74 ± 5 | 68 ± 4 | R | ||
| 100 | 10 | 0.7 ± 0.3 | 0.2 ± 0.2 | 81 ± 5 | 79 ± 5 | Y | ||
| 100 | 100 | 0.4 ± 0.3 | 0.2 ± 0.2 | 74 ± 5 | 72 ± 5 | Y | ||
| 100 | 250 | N/A | N/A | 68 ± 7 | 65 ± 4 | R | ||
| 100 | 500 | N/A | N/A | 64 ± 4 | 57 ± 4 | R | ||
| 150 | 10 | 0.4 ± 0.2 | 0.2 ± 0.2 | 77 ± 5 | 77 ± 5 | Y | ||
| 150 | 100 | 0.2 ± 0.2 | 0.1 ± 0.1 | 71 ± 5 | 70 ± 5 | Y | ||
| 150 | 250 | N/A | N/A | 66 ± 4 | 63 ± 5 | R | ||
| 150 | 500 | N/A | N/A | 63 ± 4 | 57 ± 4 | R | ||
| Green — valid, tight SD (≥85% viab., ≥80% TEER) | Yellow — valid, flagged (70–84%) | Red — N/A, excluded from ML (<70%) | ||||||
Table 7.
Viability (% survival) after 72 h under 1 T field (mean ± SD, n = 3). Colour coding as in Table 4. The field-only control reduced viability by 4 ± 1 pp relative to 0 T. The highest magneto-mechanical cost occurs for large cores at high concentration, consistent with apical aggregation under magnetic force.
Table 7.
Viability (% survival) after 72 h under 1 T field (mean ± SD, n = 3). Colour coding as in Table 4. The field-only control reduced viability by 4 ± 1 pp relative to 0 T. The highest magneto-mechanical cost occurs for large cores at high concentration, consistent with apical aggregation under magnetic force.
| Core size (nm) | Conc. (µg mL⁻¹) | HUVEC+PLGA (%) | HUVEC+PEG (%) | hCMEC/D3+PLGA (%) | hCMEC/D3+PEG (%) |
|---|---|---|---|---|---|
| 15 | 10 | 91 ± 3 | 96 ± 5 | 89 ± 4 | 90 ± 8 |
| 15 | 100 | 88 ± 5 | 90 ± 4 | 84 ± 5 | 86 ± 5 |
| 15 | 250 | 84 ± 6 | 86 ± 5 | 81 ± 5 | 82 ± 6 |
| 15 | 500 | 77 ± 5 | 80 ± 6 | 73 ± 4 | 76 ± 6 |
| 30 | 10 | 89 ± 5 | 90 ± 4 | 87 ± 5 | 88 ± 3 |
| 30 | 100 | 86 ± 5 | 87 ± 6 | 83 ± 4 | 84 ± 6 |
| 30 | 250 | 82 ± 4 | 84 ± 6 | 79 ± 3 | 81 ± 6 |
| 30 | 500 | 75 ± 4 | 77 ± 5 | 71 ± 5 | 73 ± 4 |
| 50 | 10 | 88 ± 6 | 89 ± 4 | 84 ± 6 | 86 ± 3 |
| 50 | 100 | 84 ± 5 | 86 ± 4 | 80 ± 6 | 82 ± 6 |
| 50 | 250 | 80 ± 4 | 82 ± 6 | 76 ± 4 | 79 ± 5 |
| 50 | 500 | 73 ± 5 | 76 ± 4 | 67 ± 5 | 72 ± 4 |
| 100 | 10 | 85 ± 5 | 88 ± 6 | 81 ± 4 | 84 ± 6 |
| 100 | 100 | 81 ± 4 | 84 ± 6 | 77 ± 5 | 81 ± 4 |
| 100 | 250 | 76 ± 5 | 82 ± 5 | 73 ± 5 | 77 ± 6 |
| 100 | 500 | 71 ± 4 | 75 ± 6 | 66 ± 4 | 71 ± 5 |
| 150 | 10 | 84 ± 6 | 86 ± 4 | 79 ± 5 | 83 ± 4 |
| 150 | 100 | 79 ± 5 | 83 ± 4 | 76 ± 5 | 79 ± 5 |
| 150 | 250 | 74 ± 4 | 78 ± 5 | 71 ± 4 | 75 ± 6 |
| 150 | 500 | 69 ± 5 | 75 ± 4 | 64 ± 5 | 70 ± 4 |
Table 8.
Multi-factor (Type-II) ANOVA of QC-gated transport efficiency (n = 384 green + yellow observations). All modelled factors are statistically significant; partial η² quantifies the proportion of variance uniquely attributable to each. Barrier identity, core size and coating dominate, and the significant size × coating interaction shows the stealth-coating penalty scales with core size.
Table 8.
Multi-factor (Type-II) ANOVA of QC-gated transport efficiency (n = 384 green + yellow observations). All modelled factors are statistically significant; partial η² quantifies the proportion of variance uniquely attributable to each. Barrier identity, core size and coating dominate, and the significant size × coating interaction shows the stealth-coating penalty scales with core size.
| Factor | F | df | p | η²ₚ | Interpretation |
|---|---|---|---|---|---|
| Barrier (HUVEC vs hCMEC/D3) | 272.5 | 1, 369 | < 0.001 | 0.43 | Tight-junction density |
| Core size (15–150 nm) | 62.8 | 4, 369 | < 0.001 | 0.41 | Membrane-curvature optimum |
| Coating (PLGA vs PEG) | 176.6 | 1, 369 | < 0.001 | 0.32 | Stealth / corona kinetics |
| Concentration (categorical) | 14.9 | 3, 369 | < 0.001 | 0.11 | Non-monotonic saturation |
| Size × Coating interaction | 13.0 | 4, 369 | < 0.001 | 0.12 | Size-dependent PEG penalty |
| Field (0 vs 1 T) | 11.4 | 1, 369 | < 0.001 | 0.03 | Magneto-mechanical bias |
Table 9.
Predictive-model comparison under 10-fold cross-validation (n = 384). The non-linear tree ensembles substantially outperform the linear baseline; QC cleaning raises cross-validated R² by 11 percentage points (0.74 → 0.85), the central methodological result of this work.
Table 9.
Predictive-model comparison under 10-fold cross-validation (n = 384). The non-linear tree ensembles substantially outperform the linear baseline; QC cleaning raises cross-validated R² by 11 percentage points (0.74 → 0.85), the central methodological result of this work.
| Model | CV R² | RMSE (%) | MAE (%) | Note |
|---|---|---|---|---|
| Ordinary least squares | 0.51 ± 0.19 | 1.88 | 1.27 | Linear — inadequate |
| Random forest | 0.86 ± 0.13 | 0.99 | 0.54 | 400 trees, depth 6 |
| XGBoost (selected) | 0.85 ± 0.11 | 1.02 | 0.60 | Interpretable via SHAP |
| XGBoost — uncleaned data | 0.74 ± 0.05 | — | — | Red-zone points retained |
| XGBoost — physicochem. only | 0.75 ± 0.15 | — | — | Size, coating, barrier |
Disclaimer/Publisher’s Note: The statements, opinions and data contained in all publications are solely those of the individual author(s) and contributor(s) and not of MDPI and/or the editor(s). MDPI and/or the editor(s) disclaim responsibility for any injury to people or property resulting from any ideas, methods, instructions or products referred to in the content. |
© 2026 by the authors. Licensee MDPI, Basel, Switzerland. This article is an open access article distributed under the terms and conditions of the Creative Commons Attribution (CC BY) license (http://creativecommons.org/licenses/by/4.0/).
Copyright: This open access article is published under a Creative Commons CC BY 4.0 license, which permit the free download, distribution, and reuse, provided that the author and preprint are cited in any reuse.