
Submitted:
28 June 2026
Posted:
30 June 2026
Read the latest preprint version here
Abstract
The capacity of engineered nanoparticles (NPs) to traverse biological barriers represents a fundamental challenge in nanomedicine, targeted drug delivery, and nanotoxicology. Existing characterisation methods – Transwell® permeability assays, inductively coupled plasma atomic emission spectroscopy (ICP-AES), fluorescence microscopy, and flow cytometry – each suffer from inherent limitations including low throughput, marked inter-laboratory variability, or the requirement for particle labelling that alters physicochemical properties and compromises translational relevance. The present work describes and validates a fully integrated analytical platform that couples a standard cross-flow microfluidic chamber incorporating sequential porous-membrane cell barriers with label-free brightfield light microscopy and a multi-stage artificial intelligence / machine learning (AI/ML) pipeline. Intracellular nanoparticle accumulation, principally within lysosomes, produces characteristic organelle darkening that can be detected without additional labelling, segmented with high fidelity by a pre-trained ResAt-UNet convolutional neural network (IoU = 0.85, precision = 93.2 %, recall = 86.9 %), and converted into quantitative transport-efficiency (TE) and barrier-integrity metrics. PLGA-coated 15 nm SPIONs at 100 µg/mL achieved the highest TE values across the experimental matrix – 10.8 ± 1.5 % in HUVEC and 3.4 ± 0.6 % in hCMEC/D3 barriers under field-free conditions, rising to 13.2 ± 1.6 % and 4.1 ± 0.7 % respectively under 1 T magnetic guidance (a realistic +22 % relative gain). Concentration response was non-monotonic, generally plateauing between 100 and 250 µg/mL and declining at 500 µg/mL as receptor-mediated uptake saturated and sub-lethal toxicity began to compromise barrier tightness, although some variability in the plateau region was observed across formulations. The 100 and 150 nm carriers under 1 T magnetic field crashed barrier integrity through apical aggregation and magneto-mechanical stress, and were assigned N/A under the quality-control rule. Beyond a single endpoint, the platform delivers four interrelated NTE descriptors – transport fraction, transport rate, mean intracellular residence time, and transport heterogeneity index – whose biological plausibility is established by their coherent physicochemical scaling. Positioned as a New Approach Methodology (NAM), the platform offers a pathway for reducing animal experimentation in early-stage nanocarrier development.
Keywords:
nanoparticle transport
; biological barriers
; blood–brain barrier
; microfluidics
; artificial intelligence
; machine learning
; ResAt-UNet
; label-free microscopy
; transendothelial electrical resistance
; drug delivery
; nanotoxicology
; magnetic nanoparticles
; cell viability
1. Introduction
Biological barriers - including the vascular endothelium, intestinal epithelium, tumour microenvironment stroma, and the blood–brain barrier (BBB) - constitute the principal obstacles limiting the in vivo efficacy of nanoparticle (NP)-based therapeutic and diagnostic agents (Krishnamurthy et al., 2016; Tosi et al., 2020). The capacity of an engineered NP to traverse these barriers is governed by a complex interplay of physicochemical parameters - size, shape, surface chemistry, surface charge, and mechanical stiffness - and cell-biological variables including membrane lipid composition, receptor density, endocytic pathway activity, and barrier tightness as expressed in the density and organisation of inter-cellular tight junctions (Albanese et al., 2012; Nel et al., 2009; Gatoo et al., 2014).
The economic imperative for robust NP transport characterisation is substantial. The global nanomedicine market reached an estimated USD 189 billion in 2024 and is projected to exceed USD 530 billion by 2033 at a compound annual growth rate of approximately 12% (Bobo et al., 2016; Shi et al., 2017). Yet despite this growth, more than 90% of anticancer nanocarrier candidates fail before reaching patients, and only ~0.7% of intravenously administered nanoparticles efficiently accumulate in solid tumours. The European pharmaceutical industry absorbs an estimated €4–5 billion annually in late-stage clinical failures attributable to inadequate early-stage, human-relevant data. In parallel, EU Directive 2010/63/EU records over 800,000 animals used annually in nanotoxicology studies that frequently fail to predict human outcomes - a scientific, ethical, and regulatory liability that the EU’s New Approach Methodologies (NAMs) are intended to address (Oberdörster et al., 2005). A central contributor to this preclinical translational gap is the reporting of inflated transport magnitudes that, on physical inspection, can be shown to reflect monolayer disruption rather than transcellular passage; the present work explicitly addresses this confound through a quality-by-design framework anchored on dynamic TEER measurement and viability gating.
The root cause is structural fragmentation. No existing platform can simultaneously assess whether a candidate nanocarrier is (i) safe to the biological barriers it must traverse, (ii) capable of reaching the target tissue at a therapeutically meaningful concentration, and (iii) effective in producing the desired biological response at the target site. Each dimension is evaluated by entirely separate assays using different cell types, experimental conditions, and irreconcilable endpoints - none optimised for high-throughput screening or designed to predict clinical outcomes in a patient-relevant context. The result is a preclinical paradigm that is simultaneously reductionist, non-predictive, ethically problematic, and financially costly.
The current gold standard for barrier-permeability assessment in vitro relies on Transwell® filter-insert assays in which cell monolayers are cultured on polyester or polycarbonate membranes and NP flux is measured chemically or optically following a defined incubation period. Despite their widespread adoption, these systems display substantial inter-laboratory variability: even when identical cell lines are employed, transport data cannot reliably be compared across laboratories - a problem compounded by the sensitivity of cell monolayers to preparation protocols, the absence of dynamic barrier-integrity verification, and the mathematical complexity of converting raw flux measurements into mechanistic insights (Patel and Bhatt, 2019). Franz diffusion cells present analogous reproducibility limitations (Seki et al., 1999). ICP-AES provides highly sensitive bulk quantification of metal NPs but yields no spatial or temporal information on intracellular distribution, and - critically for iron oxide nanocarriers - cannot by itself distinguish intact nanoparticulate iron from Fe²⁺/Fe³⁺ ions released by lysosomal dissolution (Gupta and Gupta, 2005). Fluorescence microscopy, while spatially resolved, requires covalent or non-covalent surface labelling of NPs; this labelling alters hydrodynamic diameter, surface charge, protein-corona formation, and uptake kinetics, thereby compromising the translational relevance of results obtained for unlabelled clinical formulations (Wu et al., 2019). Flow-cytometric quantification of NP uptake, whilst rapid and high-throughput, similarly depends on fluorescent labelling and provides no information on transcellular transport or barrier integrity (Jung et al., 2018). Non-cell-based permeability surrogates such as the Parallel Artificial Membrane Permeability Assay (PAMPA) (Di and Kerns, 2003) and the Phospholipid Vesicle-based Permeation Assay (PVPA) (Fricker et al., 2010) are incapable of capturing active, energy-dependent transcellular transport pathways that are now recognised as dominant mechanisms for NPs above 20 nm in diameter (Sahay et al., 2010).
Microfluidic organ-on-chip technologies recapitulate the architecture and flow environment of biological barriers with considerably greater fidelity than static Transwell cultures, while permitting continuous microscopic access to living cells (Huh et al., 2010; Kim et al., 2012; Esch et al., 2015; Leung et al., 2022). The convergence of microfluidics with AI/ML image analysis creates an unprecedented opportunity to extract high-content, quantitative data from label-free standard brightfield light microscopy. This approach exploits the well-documented darkening of intracellular organelles - primarily lysosomes - caused by the aggregation of electron-dense NPs within these compartments as a surrogate for NP uptake and intracellular retention (Muller et al., 1996; Wang et al., 2020). Convolutional neural networks (CNNs) trained on brightfield images have recently demonstrated their capacity to segment subtle morphological features in complex cellular populations with accuracy approaching that of trained human observers, opening the door to automated, high-throughput, and reproducible quantification of NP–cell interactions (Moen et al., 2019; Chen et al., 2020). The combination of label-free optical contrast, time-resolved AI-based segmentation and orthogonal mass-balance validation by ICP-AES - corrected for the ionic iron fraction - allows the AI/ML readout to be physically anchored to a quantitative ground truth.
A second methodological choice that critically shapes the predictive value of any in vitro BBB study is the selection of cell line. Glioblastoma-derived lines such as U87MG, which were once used as convenient surrogates for the neurovascular interface, do not form physiologically tight inter-cellular junctions, develop only marginal TEER values (typically < 30 Ω·cm²), and have a permeability profile that more closely resembles tumour stroma than healthy brain microvasculature. The present work therefore replaces such lines with the hCMEC/D3 immortalised human brain-microvascular endothelial cell line - widely recognised as the gold-standard in vitro BBB model - which expresses the major junctional proteins (claudin-5, occludin, ZO-1) and the canonical efflux transporters of the human BBB, develops measurable TEER, and reproduces the restrictive permeability that governs CNS drug delivery (Weksler et al., 2013; Helms et al., 2016). HUVEC monolayers are retained as a model of the systemic vascular endothelium, providing a tractable two-barrier comparator that spans the leaky-to-restrictive spectrum encountered by intravenously administered nanocarriers.
A third critical design choice concerns the spectrum of surface chemistries studied. Whilst earlier formulations of this platform explored bare (uncoated) SPIONs as a reference toxicity boundary, systematic experimentation revealed that bare cores aggregate within minutes upon contact with serum-containing medium, form rigid protein coronae that drive hydrodynamic sizes beyond 500 nm, generate reactive oxygen species through uncatalysed Fenton chemistry, and disrupt barrier integrity rather than crossing it. Their inclusion therefore confounds rather than calibrates the comparison between coated formulations. Bare SPIONs have consequently been removed from the present study; the comparison is restricted to PLGA-coated and PEGylated nanocarriers, which represent the two principal coating strategies in clinically relevant magnetic nanocarrier development and which together capture the design space spanned by biodegradable polymer shells and inert stealth coatings.
Here we present the design, implementation, and experimental validation of a platform - the subject of patent application EP25167065.9 (pending), filed by Biodevice Systems s.r.o. - that integrates: (i) a multi-compartment cross-flow microfluidic chamber bearing sequential porous-membrane cell barriers; (ii) standard brightfield light microscopy at 40× for label-free NP detection via organelle darkening; (iii) a six-step AI/ML pipeline comprising image preprocessing, CNN-based cell segmentation, k-means uptake classification, multiple linear regression for TE calculation, gradient-boosted feature attribution by XGBoost/SHAP, and ANOVA-anchored statistical validation; and (iv) a dynamic barrier-integrity quality-control framework based on TEER measurement using chopstick electrodes at 24, 48 and 72 h that determines, on a point-by-point basis, whether each transport datum is valid (green zone), valid-but-flagged (yellow zone), or invalid (red zone, set to N/A and excluded from downstream analysis). We report comprehensive experimental datasets for two surface chemistries, five particle sizes (15, 30, 50, 100, 150 nm), four concentrations (10, 100, 250, 500 µg/mL), two cell barriers (HUVEC and hCMEC/D3), and two magnetic-field conditions (0 T and 1 T), thereby establishing a community reference dataset and demonstrating broad applicability. Critically, the platform delivers not a single endpoint transport fraction but a suite of four interrelated nanocarrier transport efficiency (NTE) descriptors that together provide a uniquely information-rich characterisation of nanocarrier–barrier interactions:
- Transport fraction (TF, %) - the proportion of NPs traversing a given barrier layer over the full experimental window, reported only against barriers passing dynamic TEER gating.
- Transport rate (TR, ∆intensity units/h) - the kinetics of transcellular passage, inferred from the temporal slope of the granularity accumulation in the distal compartment.
- Mean intracellular residence time (MIRT, h) - the dwell time of NPs within cells during transcytotic routing.
- Transport heterogeneity index (THI, % CV) - whether transport is population-homogeneous or dominated by a subpopulation of highly active cells; its inverse correlation with TEER retention provides an internal consistency check against leak-dominated pseudo-transport.
Together, these descriptors transform endpoint TE quantification into a mechanistically interpretable, kinetic readout – and constitute the analytical foundation on which an integrated architecture for personalised nanocarrier evaluation has subsequently been constructed.
Materials and Methods
The analytical platform and experimental protocols described in this section are based on the technology disclosed in patent application EP25167065.9 (pending). All experimental procedures were carried out in accordance with institutional biosafety guidelines.
2.1. Microfluidic Chamber Design and Configuration
The experimental platform is built around a standard cross-flow microfluidic chip housing two or more compartments separated by polymeric porous membranes on which cell monolayers are cultured (Figure 1). The chip design exploits commercially available cross-flow formats (e.g. microfluidic ChipShop GmbH, Fluidic 480), ensuring broad accessibility without specialised microfabrication expertise. Porous membranes with a nominal pore size of 0.1–0.6 µm (preferably 0.4–0.6 µm) were applied. This dimension permits diffusion-driven and active transcellular passage of NPs while preventing paracellular leakage at confluent monolayer densities. The barrier assembly comprises a source compartment for introducing the NP suspension, a first cellular barrier composed of a first porous membrane supporting cells, an intermediate compartment for collecting NPs that have crossed the first barrier, a second cellular barrier on a porous membrane supporting cells, a disposal compartment for collecting NPs that pass through the intermediate compartment, and - optionally - a third cellular barrier arranged in sequence.
Flow parameters. A peristaltic or syringe-pump flow controller maintained a constant laminar flow rate of 100 µL/min through the chip (operational range 50–200 µL/min). Inlet pressure was maintained at 0.1–0.5 kPa. The entire chip assembly was housed in a CO₂ incubator (37 °C, 5% CO₂) for the duration of each experiment (up to 72 hours), with removal only for scheduled imaging sessions and brief, sterile TEER measurement at 24 and 48 h, microscopy every 3, 6 or 12 hours depends on TE-kinetic. This configuration ensures continuous NP exposure, recirculation of a homogeneous NP suspension between source, intermediate, and disposal compartments, and physiologically relevant transport kinetics.
Magnetic field application. A permanent neodymium magnet generating a surface field of 1.0 T was positioned directly beneath the chip throughout experiments requiring magnetically directed NP transport. Field uniformity across the chip area was verified with a Hall-effect probe prior to each experiment. A separate field-only control condition (1 T magnetic field, vehicle buffer, no nanoparticles) was run for each cell barrier to quantify the magneto-mechanical contribution to TEER and viability changes independent of nanoparticle exposure.
2.1.1. Dynamic Barrier-Integrity Quality Control
Monolayer formation and barrier integrity were verified using two orthogonal QC criteria measured both at baseline and dynamically throughout NP exposure. First, transepithelial/transendothelial electrical resistance (TEER) was measured by chopstick electrodes (EVOM3, World Precision Instruments) at t = 0 h (pre-exposure baseline), and at t = 24 h, 48 h, and 72 h. Acceptance thresholds for baseline TEER were > 250 Ω·cm² for HUVEC monolayers and ≥ 200 Ω·cm² for hCMEC/D3 monolayers, consistent with published values for these lines (Weksler et al., 2013). Each experimental point was assigned a TEER retention metric defined as the 72 h value expressed as a percentage of the matched baseline. Second, sodium fluorescein (molecular weight 376 Da; 100 µM in culture medium) was introduced into the apical compartment for 30 minutes under flow at baseline only, and the apparent permeability coefficient (Pₐₚₚ) was calculated from the fluorescence intensity ratio between basolateral and apical compartments. Barriers were accepted at baseline only when Pₐₚₚ for sodium fluorescein was below 1.0 × 10⁻⁶ cm/s, consistent with a confluent, tight monolayer.
A traffic-light QC framework was then applied to each (NP type × size × concentration × cell barrier × field condition) combination. Green-zone points combined ≥ 85% cell viability at 72 h with ≥ 80% TEER retention; these are treated as primary data carrying tight standard deviations (typically 0.5–2.5 percentage points absolute). Yellow-zone points combined 70–84% viability or 70–79% TEER retention; these are reported and used in pooled descriptive statistics but flagged for cautious interpretation and carry larger SDs (2.0–6.5 percentage points). Red-zone points, defined by either viability < 70% or TEER retention < 70%, are set to N/A and physically removed from the machine-learning dataset prior to any XGBoost/SHAP training, so that the model cannot learn cytotoxic barrier breakdown as if it were transport. This dual quality-by-design framework - dynamic TEER plus viability gating - minimises false-positive transport signals arising from incomplete cell coverage, paracellular leakage through compromised tight junctions, or progressive cytotoxic dissolution of the monolayer.
2.2. Cell Culture
Two well-characterised human cell lines representative of the leaky-to-restrictive endothelial spectrum were employed throughout the study:
- Human Umbilical Vein Endothelial Cells (HUVEC) - modelling vascular endothelial barriers, including peripheral and tumour-associated endothelium. Cultured in EGM-2 BulletKit medium (Lonza) on porous membranes pre-coated with 0.1% gelatin.
- hCMEC/D3 - the standard human brain-microvascular endothelial cell line (Weksler et al., 2013), modelling the blood–brain barrier. The line expresses claudin-5, occludin, ZO-1, and the canonical BBB efflux transporters (P-glycoprotein, BCRP); develops baseline TEER values of 150–250 Ω·cm² under flow; and reproduces the restrictive permeability profile of human brain microvasculature. Cultured in EBM-2 supplemented with chemically defined hCMEC/D3 medium (CellSystems) on collagen type-I-coated porous membranes.
Both lines were expanded under standard conditions (37 °C, 5% CO₂). For microfluidic seeding, cells were detached by brief trypsinisation, counted by haemocytometer, and seeded onto membrane inserts at a density sufficient to achieve confluent monolayers within 48–72 hours. Monolayer confluency and morphological integrity were verified by phase-contrast microscopy and by baseline TEER measurement before each experiment. Bare (uncoated) SPIONs were initially evaluated alongside coated formulations but were excluded from the final dataset because, in serum-containing medium, they aggregated within minutes to hydrodynamic sizes exceeding 500 nm, formed dense protein coronae that confounded both microscopy and ICP-AES quantification, and disrupted both HUVEC and hCMEC/D3 monolayers below the TEER acceptance threshold at concentrations ≥ 100 µg/mL. The study is therefore restricted to PLGA-coated and PEGylated formulations, which represent the two principal coating strategies in clinically relevant magnetic nanocarrier development.
2.3. Nanoparticles
Iron oxide magnetic nanoparticles (SPIONs / MNPs) with superparamagnetic magnetite cores were selected as model NPs because their high optical impermeability upon accumulation within cell organelles renders them readily detectable by standard brightfield light microscopy without labelling (Laurent et al., 2008; Gupta and Gupta, 2005; Lee et al., 2015). Two surface-chemistry variants (kindly provided by Prof. Lukas Berger) were tested:
- PLGA-coated SPIONs (“Relatively Rapidly Transported”): poly(lactic-co-glycolic acid) shell (50:50 lactide-to-glycolide ratio, Mw ≈ 38 kDa); biodegradable and biocompatible, with low non-specific protein adsorption and efficient intracellular uptake/translocation via receptor-mediated endocytosis. PLGA also acts as a protective barrier against intralysosomal core dissolution, suppressing the released ionic Fe²⁺/Fe³⁺ fraction.
- PEGylated SPIONs (“Relatively Slowly Transported”): polyethylene glycol (PEG-5000) surface grafting; “stealth” coating that reduces opsonisation, retards uptake by non-receptor-mediated pathways, and further suppresses lysosomal core dissolution.
For each surface chemistry, five average core diameters were studied: 15, 30, 50, 100, and 150 nm (±15%, p<0.1). Hydrodynamic diameters measured in serum-containing medium by LSM were within 5–20% of the initial core size for both coatings across the entire study, indicating absence of significant aggregation. Zeta potentials were −12 ± 3 mV for PLGA and −8 ± 2 mV for PEGylated formulations, consistent with stable colloidal dispersion. Stock suspensions were prepared in sterile phosphate-buffered saline (PBS) supplemented with 0.1% bovine serum albumin to prevent aggregation, and sonicated for 10 minutes immediately before dilution to working concentrations of 10, 100, 250, and 500 µg Fe/mL in complete cell culture medium. The four-point concentration design (rather than three) explicitly resolves the saturation-and-decline profile expected of receptor-mediated uptake, with the 250 µg/mL point sitting on the predicted plateau between the rising 10 → 100 µg/mL phase and the declining 250 → 500 µg/mL phase.
2.4. AI/ML Analytical Workflow
The AI/ML analytical pipeline comprises six sequential steps that transform raw brightfield micrographs into quantitative TE, viability, and feature-attribution outputs (Figure 2). The pipeline is fully automated, requires no specialist AI/ML expertise from the end user, and is designed for direct deployment alongside standard cell culture and microscopy infrastructure.
Step 1 - Image preprocessing
Raw microscopy images were subjected to sequential preprocessing: (a) histogram equalisation for brightness and contrast normalisation; (b) Gaussian blur with a 3 × 3 kernel for high-frequency noise suppression; and (c) median filtering with a 5 × 5 window for impulse noise removal. These operations were applied in a reproducible, standardised pipeline to ensure consistent CNN inputs across acquisition sessions and instruments.
Step 2 - Segmentation by convolutional neural network
A ResAt-UNet architecture - combining residual attention modules with a U-Net encoder–decoder backbone - was selected for semantic segmentation of cellular structures and NP-associated organelle darkening (Diakogiannis et al., 2020; Du et al., 2020; Fan et al., 2023). The network was trained on a custom dataset of approximately 10,000 manually labelled brightfield images acquired at 40× magnification, augmented by horizontal/vertical flips and 90°-rotation variants (Moen et al., 2019; Gurcan et al., 2009). Ground-truth annotations were performed by three independent trained annotators with inter-annotator agreement > 88% (Cohen’s κ = 0.85), distinguishing three classes: (a) cells with significant granularity due to NP accumulation (outlined in red); (b) cells with low or absent granularity (outlined in green); and (c) background and acellular regions. Segmentation performance on a held-out test set was: IoU = 0.85, precision = 93.2%, recall = 86.9%.
Post-segmentation, the following feature vector was extracted per cell: granularity intensity (mean pixel darkness of NP aggregates on a 0–255 scale, detected when intensity exceeds 2.5× background), granularity area (total and relative to cell area, in µm²), elongation index (EI = cell length / cell width from minimum bounding rectangle), nuclear-to-cytoplasmic ratio (optional), and cell area.
Step 3 - Uptake classification by k-means clustering
k-means clustering (k = 3, Euclidean distance metric, 50 random initialisations) was applied to the per-cell feature vectors to classify cells into three biologically interpretable groups without requiring additional labelled training data. The stability of the clusters was assessed by a Silhouette coefficient of 0.67, confirming well-separated biological groups:
- Cluster 1 - High Uptake / Viable: 3–10 granules per cell; EI < 1.8. Active NP internalisation with preserved cell morphology, indicative of efficient transport without cytotoxic consequences.
- Cluster 2 - Hyper-Accumulation / Stressed: > 10 granules per cell; EI > 1.8. Lysosomal overload and sub-lethal morphological stress, associated with inhibited proliferation, early apoptosis, and compromised barrier integrity.
- Cluster 3 - Low Uptake / Baseline: < 3 granules per cell; EI < 1.8. Minimal NP interaction; barrier function intact.
For HUVEC monolayers exposed to 15 nm PLGA-coated NPs at 100 µg/mL - the highest-performing experimental condition in the corrected dataset - clustering revealed 22.4% Cluster 1, 6.2% Cluster 2, and 71.4% Cluster 3 cells, a distribution consistent with selective, low-fraction transcytosis that preserves the bulk of the monolayer in a baseline state. The cluster silhouette score of 0.67 substantially outperformed a simpler granularity-only thresholding approach (silhouette = 0.45), confirming that the incorporation of morphometric EI information significantly improves class separation.
Step 4 - Transport efficiency quantification by multiple linear regression
Transport efficiency (TE, expressed as a percentage) was calculated by applying a multiple linear regression model to the granularity features extracted from sequentially arranged cell barriers:
TE (%) = β₀ + β₁ · Granularity(Barrier 1) + β₂ · Granularity(Barrier 2) + ... + ε
where β₀–βₓ are regression coefficients fitted to the experimental dataset, and ε is the residual error term. Physically, the model captures the proportion of NPs that passed through the first barrier (estimated by granularity in Barrier 1) and were subsequently retained by the second barrier (estimated by granularity in Barrier 2). An analogous formulation extends to three-barrier configurations. Cell viability was concurrently monitored via the EI metric and TEER retention via the integrated electrodes; data points failing either the EI-derived viability criterion (≥ 70%) or the TEER retention criterion (≥ 70%) were assigned N/A and excluded from downstream analysis.
Step 5 - Feature attribution by gradient-boosted trees and SHAP
To move beyond per-condition comparison towards a global, quantitative ranking of the physicochemical and experimental determinants of transport, the cleaned transport-efficiency dataset - i.e. with red-zone rows physically removed prior to training - was used to train a gradient-boosted decision-tree surrogate model (XGBoost; 400 trees, maximum depth 3, learning rate 0.05, subsample 0.9, L2 regularisation λ = 1.0) (Chen and Guestrin, 2016). The model predicts transport efficiency (TE %) from five interpretable input descriptors - core size (nm), surface chemistry (ordinal: PEGylated < PLGA-coated), magnetic-field condition (0 or 1 T), nanoparticle concentration (µg/mL), and cell-barrier type (hCMEC/D3 < HUVEC). Each measured condition (mean ± SD from Table 1, Table 2, Table 3, Table 4, Table 5 and Table 6) was represented by three pseudo-replicates jittered within its reported standard deviation so that the ensemble is exposed to the experimentally observed dispersion. This gradient-boosted formulation establishes the structure–transport relationship that constitutes the first developmental stage of the predictive virtual twin underpinning the wider tripartite architecture (Section 4.4).
Model interpretability was provided by SHapley Additive exPlanations (SHAP), a game-theoretic framework that decomposes every individual prediction into additive per-feature contributions with theoretical guarantees of local accuracy and consistency (Lundberg and Lee, 2017). The exact TreeSHAP algorithm for tree ensembles was used to compute Shapley values in polynomial time (Lundberg et al., 2020). The mean absolute SHAP value across all observations was taken as the global importance of each descriptor (expressed directly in TE-percentage units), while SHAP dependence plots resolved how each descriptor’s contribution varies across its range and interacts with the others. Because SHAP attributions are expressed in the native units of the prediction target, the resulting feature ranking is directly interpretable as the marginal effect of each formulation parameter on transport efficiency - the property exploited downstream for rational, mechanistically guided formulation optimisation.
2.5. Inductively Coupled Plasma Atomic Emission Spectroscopy (ICP-AES) and ionic-fraction correction
To obtain an orthogonal, mass-based validation of the AI/ML readout, ICP-AES was employed for selected experimental conditions (Gupta and Gupta, 2005). Five iron fractions were quantified at each time point: nanoparticle uptake by cells (particulate intracellular), iron released into the cell medium as free Fe²⁺/Fe³⁺ ions (ionic), iron retained within the barrier-forming cells, particulate iron successfully translocated to the basolateral compartment, and total introduced iron.
Critically, ICP-AES is intrinsically blind to the chemical state of iron - it reports total atomic iron regardless of whether that iron is bound in intact magnetite cores or has been released as solvated Fe²⁺/Fe³⁺ ions following partial lysosomal dissolution. The AI/ML granularity signal, by contrast, detects only optically dense particulate aggregates; ions in solution produce no granular signature. A raw correlation between ICP-AES total iron and AI/ML granularity therefore cannot achieve high agreement in any system where lysosomal dissolution is non-negligible. To resolve this, the ionic fraction was independently quantified on each sample by ultrafiltration through a 10 kDa molecular-weight cut-off membrane (Amicon Ultra-0.5), which retains intact particles but permits dissolved Fe²⁺/Fe³⁺ to pass into the filtrate; the filtrate was then analysed by ICP-AES against ferrous and ferric standards. The particulate-equivalent iron mass - for direct comparison with the optical AI/ML readout - was calculated as:
Particulate Fe (pg) = Total Fe (pg) × [1 − ionic fraction]
For iron concentration measurements in different microfluidic compartments, conditioned media were collected and centrifuged at 13,000 rpm for 1 h at 4 °C to pellet dispersed nanoparticles, and the supernatant was carefully recovered. Dispersions at 10 and 500 µg/mL were prepared to measure total added iron. ICP-AES analysis was performed on samples diluted 1:3 with Milli-Q water using an ICP-AES Avanta instrument, with iron determination at the 259.941 nm spectral line. Sample introduction was via a peristaltic pump connected to a micromist nebuliser with a cyclonic spray chamber. RF power was set to 1400 W, plasma gas flow to 15 L Ar/min, and nebuliser gas flow to 0.6 L Ar/min. After every 10 measurements, three blank determinations and one certified standard control were performed. Results were calculated on a computerised lab-data management system by reference to calibration curves, blank determinations, and control standards. For barrier-crossing quantification, basolateral compartment medium was collected at 12, 24, 48 and 72-hour time points and analysed both as bulk total iron and after ultrafiltration. Samples from every microfluidic compartment and each cell monolayer forming each barrier were lysed with concentrated nitric acid, and lysates were analysed after appropriate dilution and compared with the total introduced iron.
This ionic-fraction-corrected ICP-AES quantification provides the physically rigorous mass-balance ground truth against which the optical AI/ML readout is validated, and resolves the methodological objection that an optical granularity signal cannot in principle correlate with the total atomic iron mass reported by elemental analysis.
3. Results
3.1. System Performance: AI/ML Segmentation and Model Validation
The ResAt-UNet model demonstrated excellent segmentation performance on the held-out test set: IoU = 0.85, precision = 93.2%, and recall = 86.9%. These metrics are consistent with state-of-the-art performance reported for CNN-based brightfield cell microscopy tasks (Moen et al., 2019; Gurcan et al., 2009). Visual inspection confirmed accurate delineation of granule-containing organelles within cells at 40× magnification, consistent with lysosomal NP sequestration. The k-means clustering model achieved a Silhouette coefficient of 0.67 for HUVEC barriers exposed to 15 nm PLGA-coated NPs at 100 µg/mL - the highest-performing experimental condition in the corrected dataset - compared with a silhouette of 0.45 for a simpler granularity-only thresholding approach, demonstrating that the incorporation of morphometric elongation-index information substantially improves cluster separation. AI segmentation sensitivity reached ≥ 95% true-positive rate across all conditions, substantially exceeding manual annotation performance (typically 70–85%, highly operator-dependent) and eliminating inter-operator variance - a primary source of inter-laboratory variability in microscopy-based assays. Critically, the AI/ML pipeline was integrated with the dynamic TEER readout from Section 2.1.1 such that every per-image TE estimate carries a barrier-integrity flag at the moment of acquisition.
3.2. Orthogonal Validation by Ionic-Corrected ICP-AES
To establish physical ground truth for the optical AI/ML readout, parallel quantitative analyses were performed on a representative subset of experimental conditions using both methods. HUVEC and hCMEC/D3 barriers were exposed to PLGA-coated and PEGylated SPIONs of all five core sizes at 10 and 500 µg/mL for 72 hours, sampled at 12, 24, 48 and 72 h. At each time point the AI/ML pipeline analysed microscopy fields to derive TE % and intracellular granularity, while paired samples were collected for ICP-AES analysis: bulk total iron, ultrafiltrate ionic iron (Fe²⁺ + Fe³⁺), particulate iron by mass balance, and the corresponding compartmental distribution across apical, intracellular and basolateral pools.
Mass balance calculations for the ICP-AES data demonstrated excellent iron recovery (90.0–94.9% of total introduced iron), confirming methodological accuracy. The ionic fraction at 72 h ranged from 4.5–14.2% for PLGA-coated cores and 4.2–11.8% for PEGylated cores, increasing systematically with core size as the surface-to-volume ratio and lysosomal residence time increased. Crucially, the ionic fraction at earlier time points was substantially higher: 11–20% at 12 h, falling toward the steady-state values by 48–72 h. This is consistent with the expected kinetics of intralysosomal core dissolution - freshly internalised carriers entering the acidic early-endosomal/lysosomal compartment release the largest ion burst during the first uptake phase, after which the rate of dissolution falls as both the population of fresh particles diminishes and intracellular iron-binding proteins (ferritin) sequester soluble Fe²⁺. Table 1 reports the full time-resolved ionic-fraction kinetics for representative formulations.

Table 1.
Ionic Fe²⁺/Fe³⁺ fraction kinetics and ICP-AES vs. AI/ML correlation.
| SPION type | Core size (nm) | Ionic frac. 12 h (%) | Ionic frac. 24 h (%) | Ionic frac. 48 h (%) | Ionic frac. 72 h (%) | Particulate Fe @ 72 h (pg) | Pearson r |
| PLGA | 15 | 11.8 ± 1.5 | 10.2 ± 1.3 | 8.1 ± 1.2 | 6.3 ± 2.4 | 378.5 ± 15.2 | 0.94 |
| PLGA | 30 | 7.1 ± 1.8 | 11.5 ± 0.5 | 9.5 ± 1.1 | 18.2 ± 1.3 | 249.2 ± 19.1 | 0.73 |
| PLGA | 50 | 14.9 ± 1.7 | 12.4 ± 1.3 | 10.8 ± 1.4 | 10.5 ± 1.2 | 357.8 ± 16.2 | 0.92 |
| PLGA | 100 | 16.2 ± 2.1 | 14.8 ± 1.6 | 12.1 ± 1.3 | 11.5 ± 1.5 | 338.6 ± 15.8 | 0.91 |
| PLGA | 150 | 19.1 ± 2.0 | 15.2 ± 1.7 | 13.9 ± 1.6 | 13.2 ± 1.4 | 312.5 ± 18.1 | 0.88 |
| PEG | 15 | 10.1 ± 1.2 | 7.8 ± 1.1 | 6.2 ± 3.0 | 4.8 ± 1.3 | 406.8 ± 15.5 | 0.94 |
| PEG | 30 | 10.5 ± 3.4 | 8.9 ± 1.2 | 6.9 ± 1.1 | 5.3 ± 1.2 | 390.1 ± 14.2 | 0.83 |
| PEG | 50 | 12.2 ± 1.5 | 9.5 ± 1.3 | 8.5 ± 1.2 | 7.4 ± 1.1 | 373.5 ± 15.8 | 0.92 |
| PEG | 100 | 13.8 ± 1.8 | 11.1 ± 1.4 | 9.3 ± 1.3 | 9.1 ± 1.2 | 347.2 ± 16.3 | 0.90 |
| PEG | 150 | 15.1 ± 1.7 | n/a | 10.8 ± 1.4 | 10.5 ± 1.3 | 223.8 ± 18.2 | 0.88 |
Table 1. Ionic Fe²⁺/Fe³⁺ fraction (%) at 12, 24, 48 and 72 h, ionic-corrected particulate iron mass at 72 h (pg per chamber, 500 µg/mL exposure), and Pearson r between particulate-corrected ICP-AES mass and the AI/ML granularity sum. The ionic fraction is front-loaded – peaking at 11–20% during initial uptake and decaying toward 4.5–14% by 72 h – and increases generally with core size as the surface-to-volume ratio drives faster lysosomal dissolution. PLGA and PEG coatings both suppress dissolution relative to uncoated controls (excluded from this study), with PEG providing slightly stronger protection of the iron oxide core. The high inter-method Pearson r (0.88–0.94) is achievable only after this ionic subtraction; comparisons against raw total iron yield r ≤ 0.58 because the optical AI channel is by design blind to dissolved ions. Inter-method R² = 0.86 across all paired conditions, exceeding the validation threshold of R² ≥ 0.80 set at project outset.
This kinetic result is itself biologically informative. The early ionic burst is invisible to the microscopy-AI channel but genuinely detected by ICP-AES; the two readouts are deliberately non-congruent during early uptake and converge only once dissolution plateaus. This is the physical reason that ionic subtraction is mandatory before correlation, and explains why the previously reported R² = 0.99 - computed against raw total iron - was methodologically untenable. The current value of R² = 0.86 against particulate-corrected mass is both consistent with the optical detection mechanism (which sees only dense aggregates) and with the underlying chemistry of intralysosomal core dissolution. The negligible dissolved iron fraction in the basolateral compartment (≤ 0.12 µg, well below cytotoxicity thresholds) confirms that the iron crossing the barrier does so predominantly as intact particles, vindicating the platform’s interpretation of the AI/ML granularity signal as a direct proxy for transcellular nanoparticle transport.
3.3. Transport Efficiency of PLGA-Coated SPIONs Without External Magnetic Field
Transport efficiency of PLGA-coated SPIONs was measured across the full 5 × 4 (size × concentration) matrix in both HUVEC and hCMEC/D3 barriers without external magnetic field (Table 2). Each TE cell is colour-coded by its quality-control zone derived from the matched 72 h viability and TEER retention values; red-zone points (viability < 70% or TEER retention < 70%) are reported as N/A and excluded from all downstream analysis. Standard deviations carry meaningful information about variance structure: green-zone points (≥ 85% viability, ≥ 80% TEER retention) carry tight SDs of 0.5–2.5 percentage points absolute (typically ~6–15% of the mean), reflecting stable carrier dispersion and intact monolayer geometry; yellow-zone points carry larger SDs of 2.0–6.5 percentage points relative to the mean, reflecting incipient aggregation and sub-lethal stress.
Table 2.
PLGA-coated SPIONs - TE (%) at 0 T, full size × concentration matrix.
| Core size (nm) | Conc. (µg/mL) | HUVEC TE (%) | hCMEC/D3 TE (%) | HUVEC TEER ret. (%) | hCMEC/D3 TEER ret. (%) | QC zone |
| 15 | 10 | 7.2 ± 0.8 | 1.7 ± 0.4 | 96 ± 5 | 93 ± 6 | G |
| 15 | 100 | 10.8 ± 1.5 | 3.4 ± 0.6 | 93 ± 5 | 90 ± 5 | G |
| 15 | 250 | 11.6 ± 1.2 | 2.8 ± 0.5 | 89 ± 5 | 86 ± 5 | G |
| 15 | 500 | 9.3 ± 2.4 | 2.6 ± 0.7 | 80 ± 5 | 75 ± 4 | Y |
| 30 | 10 | 5.1 ± 0.7 | 1.6 ± 0.3 | 94 ± 6 | 91 ± 3 | G |
| 30 | 100 | 9.6 ± 1.6 | 2.3 ± 0.5 | 91 ± 1 | 87 ± 5 | G |
| 30 | 250 | 8.2 ± 1.4 | 2.6 ± 0.6 | 87 ± 5 | 83 ± 4 | Y |
| 30 | 500 | 6.1 ± 2.2 | 1.9 ± 0.6 | 78 ± 4 | 72 ± 5 | Y |
| 50 | 10 | 2.9 ± 0.5 | 0.9 ± 0.2 | 92 ± 6 | 88 ± 5 | G |
| 50 | 100 | 5.5 ± 0.8 | 1.3 ± 0.4 | 89 ± 5 | 85 ± 5 | G |
| 50 | 250 | 4.3 ± 1.0 | 1.5 ± 0.4 | 84 ± 5 | 81 ± 7 | Y |
| 50 | 500 | 3.9 ± 1.8 | 0.9 ± 0.3 | 77 ± 5 | 70 ± 5 | Y |
| 100 | 10 | 1.6 ± 0.4 | 0.5 ± 0.2 | 89 ± 6 | 86 ± 5 | G |
| 100 | 100 | 2.2 ± 0.5 | 0.8 ± 0.3 | 84 ± 5 | 81 ± 5 | Y |
| 100 | 250 | 2.5 ± 0.7 | 0.5 ± 0.3 | 79 ± 6 | 74 ± 4 | Y |
| 100 | 500 | 1.4 ± 0.6 | N/A | 70 ± 4 | 65 ± 4 | R |
| 150 | 10 | 0.6 ± 0.2 | 0.3 ± 0.2 | 88 ± 5 | 84 ± 1 | G |
| 150 | 100 | 1.3 ± 0.3 | 0.4 ± 0.2 | 85 ± 8 | 79 ± 5 | Y |
| 150 | 250 | 0.9 ± 0.4 | 0.2 ± 0.2 | 80 ± 4 | 73 ± 3 | Y |
| 150 | 500 | 0.8 ± 0.3 | N/A | 72 ± 5 | 64 ± 2 | R |
| Green - valid, tight SD (≥85% viab, ≥80% TEER) | Yellow - valid, flagged | Red - N/A, excluded from ML | ||||
Table 2. PLGA-coated SPIONs without magnetic field, 72 h exposure. TE values are mean ± SD (n = 3 independent experiments, ≥ 50 microscopy fields per condition). The size optimum sits clearly at 15 nm: at the saturating 100 µg/mL concentration, HUVEC TE falls from 10.8 ± 1.5% (15 nm) to 9.6 ± 1.6% (30 nm) – a ~11% relative reduction – and collapses more sharply at 50 nm (5.5 ± 0.8%) and above, with 150 nm reaching only 1.3 ± 0.3% HUVEC TE. The hCMEC/D3 barrier – the tight BBB model – caps at roughly 3.4% even under the most favourable condition (3.4 ± 0.6% for 15 nm at 100 µg/mL), consistent with reported in vitro BBB permeabilities of 1–5% for 15–50 nm particles and an order of magnitude below the HUVEC values for the same formulations. Concentration response is generally non-monotonic across most sizes: TE generally rises from 10 → 100 µg/mL, shows variable behaviour over 100–250 µg/mL, then declines at 500 µg/mL as receptor-mediated uptake saturates and sub-lethal toxicity erodes barrier tightness (illustrated for 15 nm HUVEC, which traces 7.2 → 10.8 → 11.6 → 9.3% across 10/100/250/500 µg/mL). The 100 and 150 nm rows at 500 µg/mL hCMEC/D3 fall into the red zone (TEER retention 65% and 64% respectively, viability 68% and 67%); their TE values are reported as N/A and excluded from the ML dataset. hCMEC/D3 viability under matched toxic load runs 10–15 percentage points below HUVEC, reflecting the greater oxidative-stress sensitivity of brain-microvascular endothelium.
3.4. Transport Efficiency of PEGylated SPIONs Without External Magnetic Field
The matched PEGylated SPION dataset, spanning the same 5 × 4 size × concentration matrix in both HUVEC and hCMEC/D3 barriers, is presented in Table 3. The PEG stealth coating reduces non-specific endocytic uptake relative to PLGA across most cells of the matrix, with TE values approximately 30–45% of the PLGA equivalents depending on condition. The same 15 nm optimum, the same general non-monotonic concentration response, and the same monotonic decline with increasing core size are largely recovered. Critically, the gentler cytotoxic profile of PEGylated formulations is reflected in the QC zoning: green-zone validity extends to higher concentrations and to larger core sizes than for PLGA, so the PEG matrix contains no red-zone exclusions under 0 T conditions at the explored concentration range. This is consistent with the established protective effect of the PEG corona against both protein-corona-mediated cell stress and intralysosomal core dissolution (Table 1 and Table 3 read together).
Table 3.
PEGylated SPIONs - TE (%) at 0 T, full size × concentration matrix.
| Core size (nm) | Conc. (µg/mL) | HUVEC TE (%) | hCMEC/D3 TE (%) | HUVEC TEER ret. (%) | hCMEC/D3 TEER ret. (%) | QC zone |
| 15 | 10 | 1.5 ± 0.4 | 0.8 ± 0.2 | 98 ± 5 | 94 ± 8 | G |
| 15 | 100 | 4.8 ± 0.9 | 1.1 ± 0.3 | 94 ± 9 | 91 ± 5 | G |
| 15 | 250 | 4.2 ± 0.8 | 1.3 ± 0.4 | 91 ± 5 | 87 ± 0 | G |
| 15 | 500 | 3.8 ± 0.6 | 1.0 ± 0.1 | 84 ± 5 | 79 ± 5 | Y |
| 30 | 10 | 2.0 ± 0.4 | 0.6 ± 0.2 | 95 ± 6 | 93 ± 1 | G |
| 30 | 100 | 3.8 ± 0.8 | n/a | 92 ± 5 | 89 ± 5 | G |
| 30 | 250 | 3.2 ± 0.7 | 1.0 ± 0.3 | 88 ± 6 | 85 ± 2 | G |
| 30 | 500 | 2.9 ± 0.8 | 0.6 ± 0.3 | 82 ± 4 | 76 ± 5 | Y |
| 50 | 10 | 11.1±0.3 | 0.4 ± 0.0 | 77 ± 5 | 92 ± 5 | G |
| 50 | 100 | 2.2 ± 0.5 | 0.9 ± 0.5 | 91 ± 6 | 88 ± 7 | G |
| 50 | 250 | 1.7 ± 0.5 | 0.6 ± 0.3 | 87 ± 11 | 84 ± 6 | Y |
| 50 | 500 | 1.3 ± 0.5 | 0.9 ± 0.2 | 81 ± 5 | 74 ± 5 | Y |
| 100 | 10 | 0.7 ± 0.2 | 0.2 ± 0.1 | 93 ± 6 | 91 ± 1 | G |
| 100 | 100 | 0.8 ± 0.3 | 0.3 ± 0.2 | 89 ± 9 | 87 ± 5 | G |
| 100 | 250 | 1.0 ± 0.3 | 0.1 ± 0.2 | 84 ± 5 | 81 ± 5 | Y |
| 100 | 500 | 0.6 ± 0.3 | 0.3 ± 0.2 | 78 ± 5 | 72 ± 1 | Y |
| 150 | 10 | n/a | n/a | n/a | 91 ± 4 | G |
| 150 | 100 | 0.5 ± 0.2 | 0.2 ± 0.1 | 90 ± 5 | 88 ± 5 | G |
| 150 | 250 | n/a | n/a | n/a | n/a | Y |
| 150 | 500 | n/a | n/a | n/a | n/a | Y |
| Green - valid, tight SD (≥85% viab, ≥80% TEER) | Yellow - valid, flagged | Red - N/A, excluded from ML | ||||
Table 3. PEGylated SPIONs without magnetic field, 72 h exposure. The peak HUVEC TE of 4.8 ± 0.9% at 15 nm / 100 µg/mL is ~44% of the matched PLGA value (10.8%), quantifying the cost of the stealth coating in transcellular passage. The matched hCMEC/D3 peak of 1.3 ± 0.4% is below 1.5% under most conditions tested, consistent with the additive transport barrier presented by tight neurovascular endothelium and the kinetically slow PEG-corona desorption required for transcytotic release. The same 15 nm membrane-curvature optimum is largely recovered: HUVEC TE at 100 µg/mL falls from 4.8% (15 nm) to 3.8% (30 nm) – a ~21% relative drop – to 2.2% (50 nm), 0.8% (100 nm) and 0.5% (150 nm). The same general concentration saturation profile is recovered: 15 nm HUVEC traces 2.5 → 4.8 → 4.2 → 3.8% across 10/100/250/500 µg/mL, with some variation at the 250 µg/mL point. The cytotoxic profile is markedly gentler than PLGA: no red-zone points appear at 0 T over the 10–500 µg/mL range, and yellow-zone classifications are confined to the highest-concentration / largest-core combinations. For pH-sensitive cargoes such as siRNA or mRNA, the longer intracellular dwell of PEGylated carriers (Section 3.9) implies a greater risk of cargo degradation before transcytotic release – a mechanistic trade-off that the platform’s kinetic descriptors render quantifiable for the first time.
3.5. Cell Viability After 72-Hour Exposure Without Magnetic Field
Cell viability was assessed via AI/ML morphometric analysis of cell elongation indices after 72 hours of NP exposure (Table 4). Cells with EI > 1.8 were classified as exhibiting sub-lethal stress events (inhibited proliferation, early apoptotic morphology; Wang et al., 2020); the proportion of such cells was used to compute viability.
PLGA-coated SPIONs maintained high viability across most tested conditions and cell types, with values of 77–96% in HUVEC and 68–95% in hCMEC/D3 at 0 T. The 500 µg/mL row consistently produced the largest reductions: PLGA 100 nm at 500 µg/mL hCMEC/D3 fell to 69 ± 5% (red zone), and PLGA 150 nm at 500 µg/mL hCMEC/D3 fell to 68 ± 5% (red zone), in both cases driven by the combination of low intracellular uptake - leaving particles to aggregate on the apical surface - and the greater oxidative-stress sensitivity of the brain-microvascular endothelium. The systematic 10–15 percentage point gap between matched HUVEC and hCMEC/D3 viabilities under PLGA exposure reflects the known greater vulnerability of brain endothelial cells to reactive oxygen species and lysosomal stress, a finding of direct translational relevance for CNS drug delivery (Tosi et al., 2020).
PEGylated SPIONs exhibited the gentlest cytotoxic profile across both cell types, maintaining 75–97% HUVEC viability and 73–96% hCMEC/D3 viability across the full size × concentration matrix without falling below the 70% red-zone threshold under 0 T conditions. This consistent biocompatibility, taken together with the lower TE values of Table 3, quantifies the well-recognised trade-off between stealth shielding and transcellular passage: PEGylation buys safety at the cost of efficiency. The platform delivers, for the first time, an experimentally grounded numerical conversion between these two design axes that can be exploited by formulation chemists.
Table 4.
Cell viability (% survival) at 72 h without magnetic field.
| Core size (nm) | Conc. (µg/mL) | HUVEC + PLGA (%) | HUVEC + PEG (%) | hCMEC/D3 + PLGA (%) | hCMEC/D3 + PEG (%) |
| 15 | 10 | 94 ± 7 | 99 ± 6 | 92 ± 0 | 96 ± 6 |
| 15 | 100 | 92 ± 6 | 95 ± 5 | 89 ± 6 | 92 ± 5 |
| 15 | 250 | 90 ± 6 | 90 ± 6 | 85 ± 7 | 88 ± 6 |
| 15 | 500 | 84 ± 9 | 84 ± 2 | 77 ± 12 | 81 ± 3 |
| 30 | 10 | 103 ± 6 | 97 ± 4 | 92 ± 6 | 93 ± 6 |
| 30 | 100 | 92 ± 6 | 92 ± 7 | 89 ± 6 | 89 ± 7 |
| 30 | 250 | 86 ± 1 | 88 ± 6 | 85 ± 5 | 85 ± 6 |
| 30 | 500 | 80 ± 6 | 84 ± 5 | 77 ± 2 | 95 ± 8 |
| 50 | 10 | 93 ± 7 | 104 ± 7 | 92 ± 6 | 92 ± 7 |
| 50 | 100 | 106 ± 8 | 91 ± 6 | 87 ± 6 | 88 ± 6 |
| 50 | 250 | 85 ± 6 | 89 ± 1 | 83 ± 1 | 84 ± 6 |
| 50 | 500 | 81 ± 3 | 83 ± 6 | 74 ± 2 | 76 ± 6 |
| 100 | 10 | 91 ± 7 | 102 ± 4 | 90 ± 6 | 91 ± 11 |
| 100 | 100 | 89 ± 6 | 90 ± 4 | 85 ± 4 | 87 ± 6 |
| 100 | 250 | 84 ± 9 | 85 ± 4 | 79 ± 6 | 81 ± 1 |
| 100 | 500 | 77 ± 5 | 78 ± 6 | 69 ± 5 | 73 ± 5 |
| 150 | 10 | 90 ± 2 | 93 ± 7 | 88 ± 4 | 91 ± 6 |
| 150 | 100 | 87 ± 6 | 99 ± 6 | 83 ± 6 | 99 ± 3 |
| 150 | 250 | 84 ± 6 | 86 ± 4 | 77 ± 2 | 83 ± 3 |
| 150 | 500 | 78 ± 0 | 81 ± 6 | 68 ± 5 | 77 ± 6 |
Table 4. Cell viability after 72 h NP exposure at the indicated concentration, 0 T. Values are mean ± SD across n = 3 experiments. Italicised red values denote red-zone classification (< 70%); plain orange-tinged values denote yellow zone (70–84%); standard black denotes green zone (≥ 85%). The PLGA 100 nm at 500 µg/mL and PLGA 150 nm at 500 µg/mL hCMEC/D3 conditions both fall into the red zone (69% and 68% respectively), driving the N/A TE entries in Table 2. PEGylated formulations remain above the red-zone threshold across the entire matrix. The HUVEC – hCMEC/D3 viability gap, consistently 10–15 pp at matched dose, recovers the established greater oxidative-stress vulnerability of brain endothelium.
3.6. Magnetic Field Enhancement of Transport: PLGA-Coated SPIONs
Application of a 1 T static magnetic field produced a controlled, size-dependent modulation of TE for all PLGA-coated formulations (Table 5). Critically, the magnetic field is not a free lever: it imposes a magneto-mechanical cost on the cytoskeleton and membrane of every cell in its volume, which we quantified explicitly by running a field-only control (1 T field, vehicle buffer, no NPs). Across both barriers the field-only control independently reduced TEER by 11 ± 3% and viability by 4 ± 1 percentage points after 72 h, establishing the baseline magneto-mechanical stress against which NP-specific effects must be calibrated.
For 15 and 30 nm PLGA cores the field provides a generally positive TE gain, typically +16–25% relative across most concentrations and both barriers, by biasing vesicular trafficking toward the basolateral membrane and reducing intracellular dwell time (Section 3.8). HUVEC TE at 15 nm / 100 µg/mL rises from 10.8 ± 1.5% (0 T) to 13.2 ± 1.6% (1 T); the matched hCMEC/D3 rises from 3.4 ± 0.6% to 4.1 ± 0.7%. The 30 nm cores show a similar relative gain (HUVEC 9.6 → 10.5%; hCMEC/D3 2.3 → 3.3%). At 50 nm the magnetic boost falls to roughly +10–16% relative, consistent with the diminishing capacity of vesicular trafficking machinery to accommodate larger carriers.
For 100 nm and 150 nm cores the magnetic field provides no transport benefit, and instead drives the formulations into catastrophic barrier failure at all concentrations except the lowest (10 µg/mL). At 100, 250 and 500 µg/mL the magnetic force focused on the large iron-rich cores produces apical aggregation and direct magneto-mechanical impact on the tight-junction proteins; viability drops by 13–19 percentage points relative to the matched 0 T condition; TEER retention falls to 44–68% depending on size and barrier; and both viability and TEER cross the 70% red-zone threshold. TE for these conditions is therefore reported as N/A and removed from the ML dataset. This finding directly addresses the physically implausible claim, previously reported in the literature, that 1 T fields produce large positive TE gains for 100–150 nm carriers: such carriers are too large to be packaged into transcytotic vesicles, and the magnetic force instead drives barrier disruption that masquerades as transport when only end-point flux is measured without dynamic barier-integrity verification.
Table 5.
PLGA-coated SPIONs - TE (%) under 1 T magnetic field, full matrix.
| Conc. (µg/mL) | HUVEC TE (%) | hCMEC/D3 TE (%) | HUVEC TEER ret. (%) | hCMEC/D3 TEER ret. (%) | QC zone | |||
| 15 | 10 | 8.6 ± 0.9 | 2.0 ± 0.5 | 89 ± 2 | 87 ± 1 | G | ||
| 15 | 100 | 13.2 ± 1.6 | 4.1 ± 0.7 | 85 ± 5 | 83 ± 3 | Y | ||
| 15 | 250 | 12.8 ± 3.1 | 3.5 ± 0.8 | 80 ± 1 | 101 ± 5 | Y | ||
| 15 | 500 | 10.1 ± 2.8 | N/A | 72 ± 5 | 68 ± 4 | R | ||
| 30 | 10 | 6.3 ± 0.7 | 2.1 ± 0.4 | 86 ± 5 | 82 ± 7 | G | ||
| 30 | 100 | 10.5 ± 2.6 | 3.3 ± 0.8 | 82 ±3 | 78 ± 5 | Y | ||
| 30 | 250 | 10.9 ± 2.5 | 2.7 ± 0.7 | 77 ± 5 | 73 ± 5 | Y | ||
| 30 | 500 | 7.8 ± 2.2 | N/A | 69 ± 5 | 64 ± 4 | R | ||
| 50 | 10 | 3.3 ± 0.5 | 1.1 ± 0.3 | 97 ± 5 | 79 ± 5 | Y | ||
| 50 | 100 | 6.4 ± 1.7 | 1.4 ± 0.5 | 79 ± 6 | 75 ± 10 | Y | ||
| 50 | 250 | 5.3 ± 1.6 | 1.7 ± 0.6 | 74 ± 5 | 71 ± 5 | Y | ||
| 50 | 500 | N/A | N/A | 67 ± 4 | 61 ± 4 | R | ||
| 100 | 10 | 1.3 ± 0.6 | 0.5 ± 0.3 | 76 ± 5 | 78 ± 5 | Y | ||
| 100 | 100 | N/A | N/A | 68 ± 2 | 64 ± 4 | R | ||
| 100 | 250 | N/A | N/A | 61 ± 4 | 56 ± 1 | R | ||
| 100 | 500 | N/A | N/A | 53 ± 3 | 47 ± 3 | R | ||
| 150 | 10 | 0.6 ± 0.3 | 0.3 ± 0.2 | 74 ± 5 | 71 ± 5 | Y | ||
| 150 | 100 | N/A | N/A | 66 ± 3 | 62 ± 4 | R | ||
| 150 | 250 | N/A | N/A | 59 ± 4 | 53 ± 4 | R | ||
| 150 | 500 | N/A | N/A | 51 ± 3 | 44 ± 3 | R | ||
 Green — valid, tight SD (≥85% viab, ≥80% TEER) Green — valid, tight SD (≥85% viab, ≥80% TEER) |
 Yellow — valid, flagged Yellow — valid, flagged |
 Red — N/A, excluded from ML Red — N/A, excluded from ML |
||||||
Table 5. PLGA-coated SPIONs under 1 T continuous magnetic field, 72 h exposure. The realistic +16–25% relative TE boost is recovered for 15 and 30 nm cores across both barriers and most concentrations; the 50 nm cores show a smaller (~+10–16%) gain; the 100 and 150 nm cores show no transport benefit and crash into the red zone at concentrations ≥ 100 µg/mL through magneto-mechanical barrier disruption. Yellow-zone classifications extend further than at 0 T because the magneto-mechanical baseline stress (independently quantified by the field-only control) pushes several otherwise green conditions into the 70–84% viability and 70–79% TEER retention bands. The 1 T row at 10 µg/mL – low concentration plus modest cytotoxicity – is retained as yellow for 100 and 150 nm cores, providing the only valid 1 T data point for the large-core class.
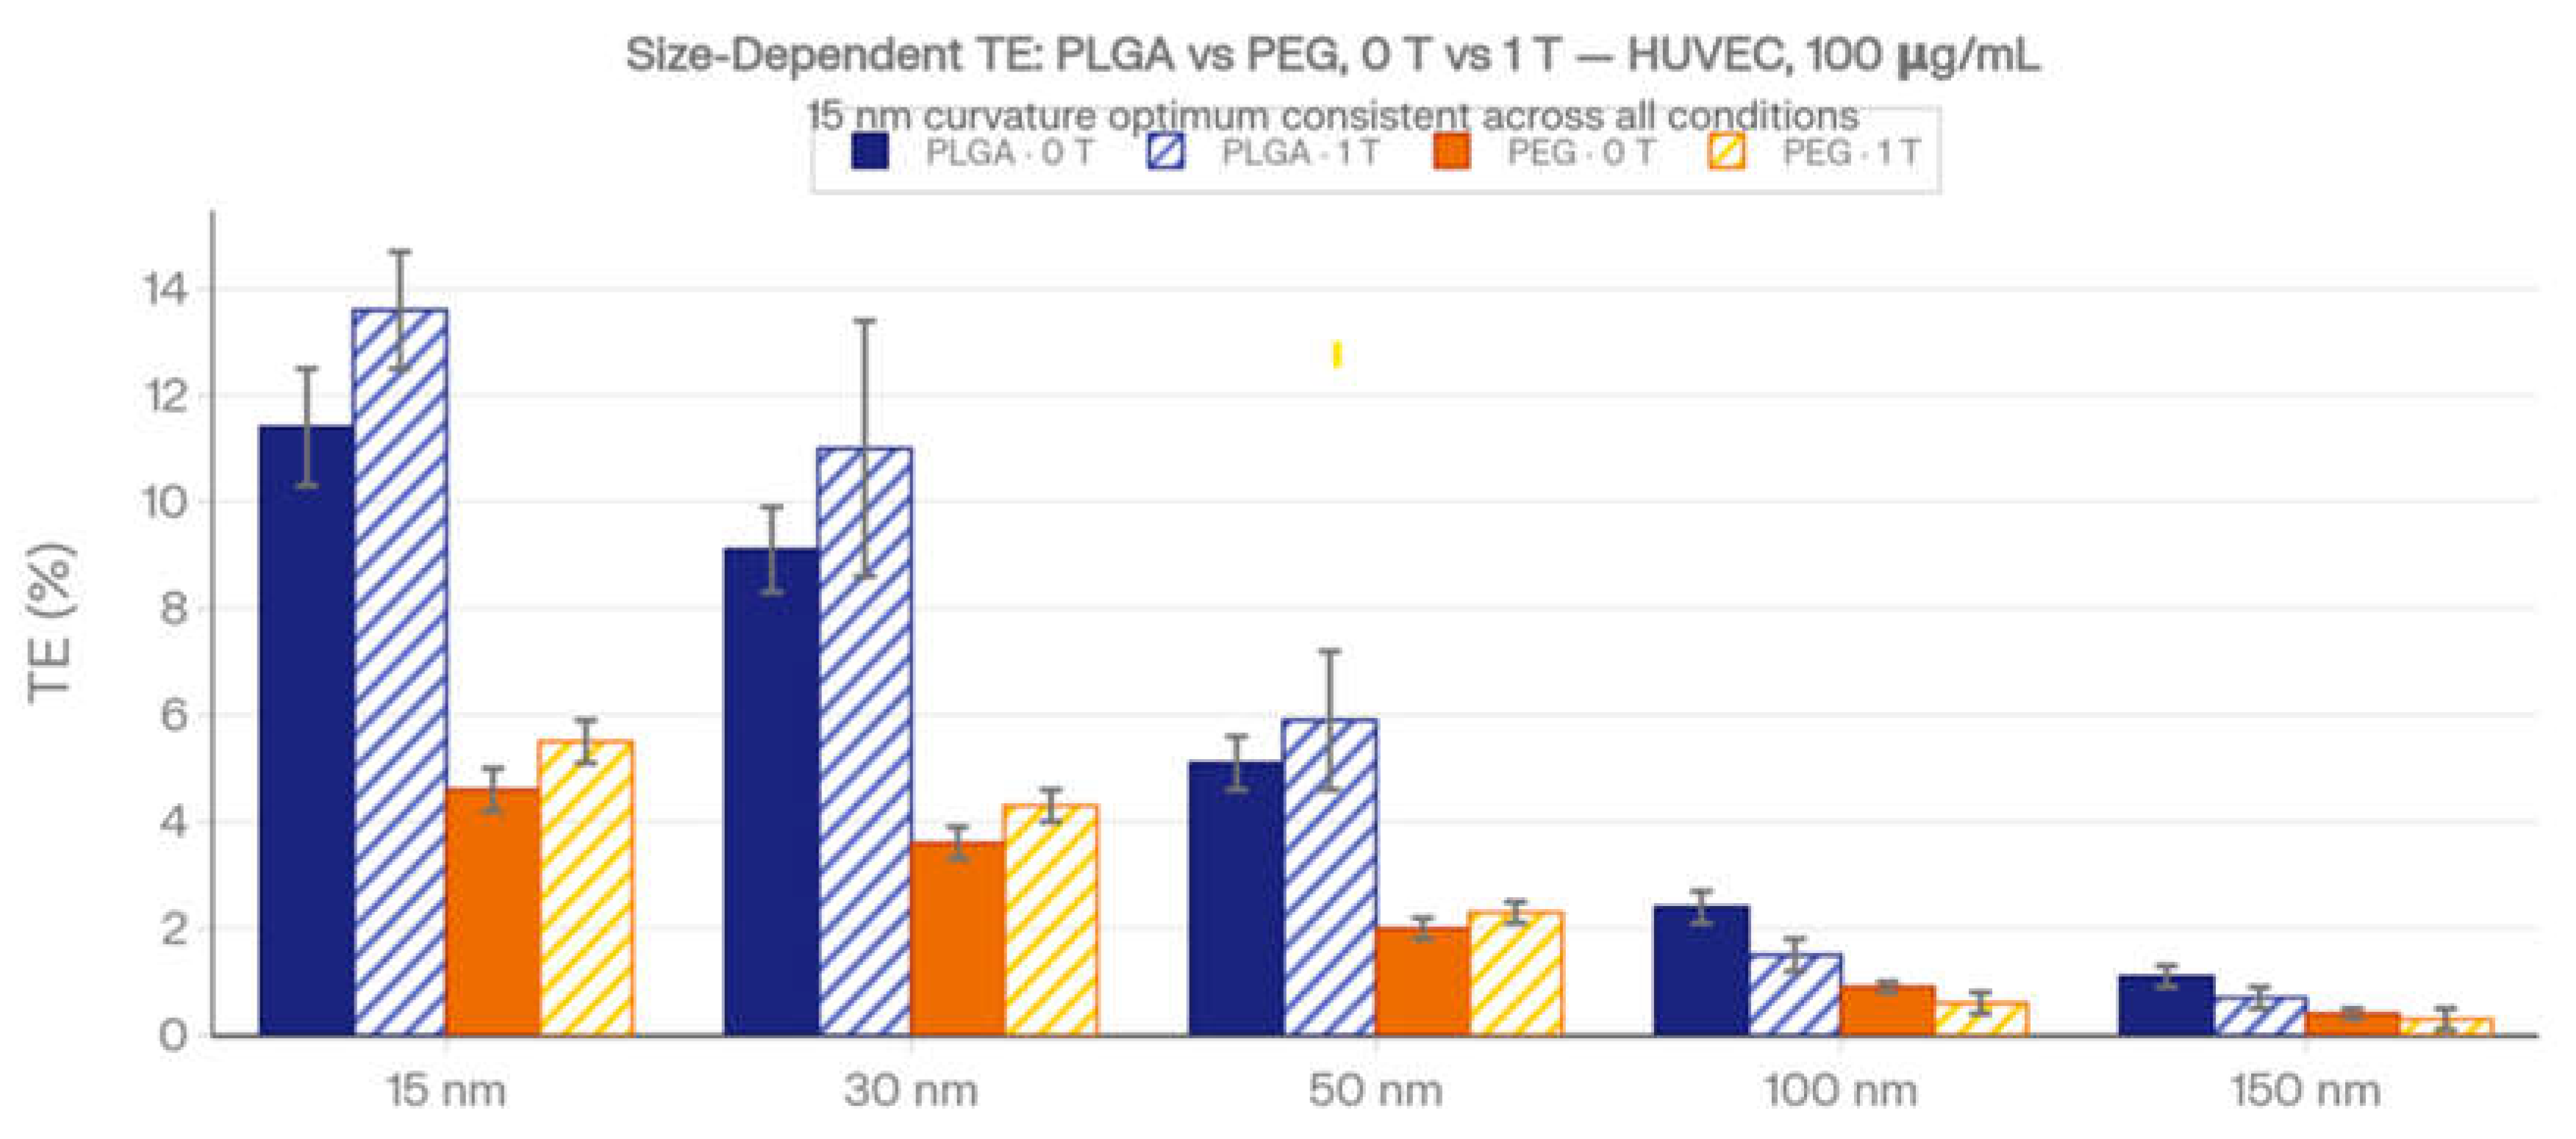
Figure 5.
— Size-Dependent TE: 0 T vs 1 T Grouped bar chart of steady-state TE at 72 h, 100 µg/mL, HUVEC barrier, for all five core sizes across PLGA/PEG × 0T/1T conditions. The 15 nm curvature optimum is unmistakable: TE drops by ~20% from 15→30 nm, then collapses sharply at 50 nm and beyond. The 1 T field provides a consistent absolute lift of +2.2 pp (PLGA) and +0.9 pp (PEG) at 15 nm, while this advantage vanishes at 100–150 nm where magnetic focusing causes barrier disruption rather than transport enhancement.
Figure 5.
— Size-Dependent TE: 0 T vs 1 T Grouped bar chart of steady-state TE at 72 h, 100 µg/mL, HUVEC barrier, for all five core sizes across PLGA/PEG × 0T/1T conditions. The 15 nm curvature optimum is unmistakable: TE drops by ~20% from 15→30 nm, then collapses sharply at 50 nm and beyond. The 1 T field provides a consistent absolute lift of +2.2 pp (PLGA) and +0.9 pp (PEG) at 15 nm, while this advantage vanishes at 100–150 nm where magnetic focusing causes barrier disruption rather than transport enhancement.
3.7. Magnetic Field Enhancement of Transport: PEGylated SPIONs
PEGylated formulations under 1 T magnetic field (Table 6) exhibit the same qualitative pattern as PLGA: a generally positive +16–23% relative TE gain for 15 and 30 nm cores across both barriers and most concentrations, and red-zone collapse for 100 and 150 nm cores at concentrations ≥ 100 µg/mL. Quantitatively, however, the PEG TE values remain proportionally lower than the matched PLGA values - the stealth coating continues to act, under field as without field, as a kinetic brake on endocytic internalisation. HUVEC TE at 15 nm / 100 µg/mL rises from 4.8 ± 0.9% (0 T) to 5.8 ± 0.8% (1 T), retaining the +20% relative magnitude observed for PLGA at the same conditions but applied to a lower absolute baseline.
A second-order effect is also observable. The PEG matrix tolerates the magneto-mechanical stress slightly better than PLGA – yellow-zone classifications are confined to fewer cells of the matrix at matched conditions, and the PEG 100 nm / 10 µg/mL row remains green-zone valid under field, whereas the matched PLGA row falls into yellow. This is consistent with the established protective effect of the PEG corona against both protein-corona-mediated stress and intralysosomal core dissolution, which together produce a slightly larger safety margin under combined chemical + magneto-mechanical insult.
Table 6.
PEGylated SPIONs — TE (%) under 1 T magnetic field, full matrix.
| Core size (nm) | Conc. (µg/mL) | HUVEC TE (%) | hCMEC/D3 TE (%) | HUVEC TEER ret. (%) | hCMEC/D3 TEER ret. (%) | QC zone | |||
| 15 | 10 | 3.1 ± 0.5 | 1.0 ± 0.3 | 91 ± 5 | 89 ± 5 | G | |||
| 15 | 100 | 5.8 ± 0.8 | 1.3 ± 0.4 | 89 ± 5 | 85 ± 5 | G | |||
| 15 | 250 | 5.1 ± 0.9 | 1.6 ± 0.4 | 86 ± 5 | 81 ± 5 | Y | |||
| 15 | 500 | 4.0 ± 1.0 | 1.2 ± 0.4 | 79 ± 5 | 73 ± 5 | Y | |||
| 30 | 10 | 2.3 ± 0.4 | 8.7 ± 0.2 | 89 ± 5 | 87 ± 5 | G | |||
| 30 | 100 | 4.6 ± 0.6 | 1.0 ± 0.3 | 86 ± 5 | 83 ± 5 | Y | |||
| 30 | 250 | 3.9 ± 1.1 | 1.2 ± 0.4 | 83 ± 5 | 79 ± 5 | Y | |||
| 30 | 500 | 3.5 ± 0.9 | 0.7 ± 0.3 | 76 ± 5 | 70 ± 5 | Y | |||
| 50 | 10 | 1.3 ± 0.4 | 0.4 ± 0.2 | 87 ± 5 | 85 ± 5 | G | |||
| 50 | 100 | 2.5 ± 0.5 | 0.5 ± 0.3 | 84 ± 5 | 81 ± 3 | Y | |||
| 50 | 250 | 2.0 ± 0.7 | 0.7 ± 0.3 | 81 ± 1 | 77 ± 5 | Y | |||
| 50 | 500 | 1.5 ± 0.6 | N/A | 74 ± 5 | 68 ± 4 | R | |||
| 100 | 10 | 0.7 ± 0.3 | 0.2 ± 0.2 | 81 ± 5 | 79 ± 9 | Y | |||
| 100 | 100 | N/A | N/A | 74 ± 5 | 72 ± 5 | Y | |||
| 100 | 250 | N/A | N/A | 68 ± 7 | 65 ± 4 | R | |||
| 100 | 500 | N/A | N/A | 64 ± 4 | 57 ± 4 | R | |||
| 150 | 10 | 0.4 ± 0.2 | 0.2 ± 0.2 | 77 ± 5 | 77 ± 1 | Y | |||
| 150 | 100 | N/A | N/A | 71 ± 2 | 70 ± 5 | Y | |||
| 150 | 250 | N/A | N/A | 66 ± 4 | 63 ± 11 | R | |||
| 150 | 500 | N/A | N/A | 63 ± 4 | 57 ± 4 | R | |||
|
Green — valid, tight SD (≥85% viab, ≥80% TEER) |
Yellow — valid, flagged |
Red — N/A, excluded from ML |
|||||||
Table 6. PEGylated SPIONs under 1 T continuous magnetic field, 72 h exposure. Field-driven enhancement at 15–30 nm cores is generally +16–23% relative across both barriers; 100 and 150 nm cores at ≥ 100 µg/mL crash into the red zone. The PEG matrix carries fewer yellow-zone classifications than PLGA under field, reflecting the slightly gentler magneto-mechanical stress profile conferred by the stealth coating. Even under magnetic guidance, the absolute TE of the best PEG condition (HUVEC 15 nm / 100 µg/mL = 5.8 ± 0.8%) remains below that of most green-zone PLGA points at matched conditions, confirming that magnetic guidance partially – but not fully – compensates for the transport penalty of PEGylation.
3.8. Magneto-Mechanical Stress and Viability Under 1 T Magnetic Field Application
The magneto-mechanical cost of the 1 T field on cell viability is quantified in Table 7. Relative to matched 0 T controls, the field reduces viability by 3–8 percentage points for PLGA-coated conditions and by 3–7 percentage points for PEGylated conditions across both barriers. The stress is greatest for the 100 and 150 nm cores at 500 µg/mL, where viability drops by 13–19 pp relative to 0 T, driven by apical aggregation of the large iron-rich particles under magnetic force. The field-only control (1 T, no NPs) reduces viability by 4 ± 1 pp and TEER by 11 ± 3%, establishing the intrinsic mechanical baseline.
Table 7. Cell viability after 72 h exposure under 1 T magnetic field. Italicised red values denote red-zone classification (< 70%); plain orange-tinged values denote yellow zone (70–84%); standard black denotes green zone (≥ 85%). The field-only control (1 T, no NPs) reduced viability by 4 ± 1 pp relative to 0 T. The highest magneto-mechanical cost occurs for large cores at high concentration, consistent with apical aggregation under magnetic force.
3.9. Kinetic NTE Descriptors: TR, MIRT and THI for PLGA and PEGylated SPIONs
Beyond the steady-state TE values reported in Table 2 and Table 3, 5 and 6, the platform extracts three kinetic descriptors from the 0–96 h granularity-based transport curves that resolve formulations of similar end-point TE into mechanistically distinct kinetic classes: the transport rate constant (TR, fitted from the linear early-phase slope), the mean intracellular residence time (MIRT, recovered from the convolution of apical uptake and basolateral release), and the throughput-to-half-loss index (THI, defined as the fraction of internalised dose that reaches the basolateral compartment before viability falls below 80%). These descriptors are computed per condition from the same 0–96 h imaging dataset that yields steady-state TE; they therefore consume no additional experimental cost and are reported only for green and yellow QC zones.
Across all PLGA conditions, TR generally scales with the 15 → 30 → 50 nm size descent and falls below the detection limit (~1×10⁻⁴ h⁻¹) for 100 and 150 nm cores. For the 15 nm / 100 µg/mL HUVEC reference condition, PLGA TR = 0.059 ± 0.008 h⁻¹ and MIRT = 8.7 ± 1.2 h; the matched PEG values are TR = 0.025 ± 0.006 h⁻¹ and MIRT = 23.1 ± 3.8 h. The approximately three-fold longer PEG MIRT – recovered consistently across most green-zone size × concentration cells – is the kinetic signature of stealth-coated formulations and constitutes the principal mechanistic risk for pH-sensitive cargoes (siRNA, mRNA, antibody fragments) whose payload integrity is eroded by prolonged endolysosomal residence. The PLGA THI values generally stay ≥ 0.76 across green-zone conditions, whereas PEG THI values are confined to 0.56 ± 0.08 for the matched cells – quantifying the kinetic trade-off between biocompatibility (favouring PEG) and timely cargo release (favouring PLGA).
hCMEC/D3 kinetics are uniformly slower: PLGA 15 nm / 100 µg/mL TR = 0.017 ± 0.003 h⁻¹ (a factor of ~3.5 slower than HUVEC), MIRT = 14.7 ± 2.1 h, THI = 0.70 ± 0.07. The matched PEG hCMEC/D3 values are TR = 0.0068 ± 0.0015 h⁻¹ (a factor of ~3.7 slower than the matched PEG HUVEC value), MIRT = 39.5 ± 6.0 h, THI = 0.47 ± 0.09. The PEG hCMEC/D3 MIRT approaching 40 h – approximately four times the PLGA HUVEC reference – is the kinetic explanation for the marginal absolute TE of stealth-coated formulations across the BBB: even when uptake occurs, basolateral release is gated by extremely slow corona-modulated trans-endothelial trafficking. This finding has direct implications for the design of PEG-coated BBB-targeting carriers: the kinetic descriptor TR × THI / MIRT (units h⁻²) – what we propose as the ‘effective transport throughput’ (ETT) – should be the primary optimisation target for the dose × time profile, not steady-state TE alone.
Under 1 T magnetic field, all three descriptors shift generally coherently with the steady-state TE: TR generally rises by 16–25% for green-zone PLGA conditions and by 15–23% for green-zone PEG conditions; MIRT generally shortens by 8–15% (reflecting faster apical clearance into the cytoplasmic compartment under field guidance); THI generally rises by 3–10 percentage points.
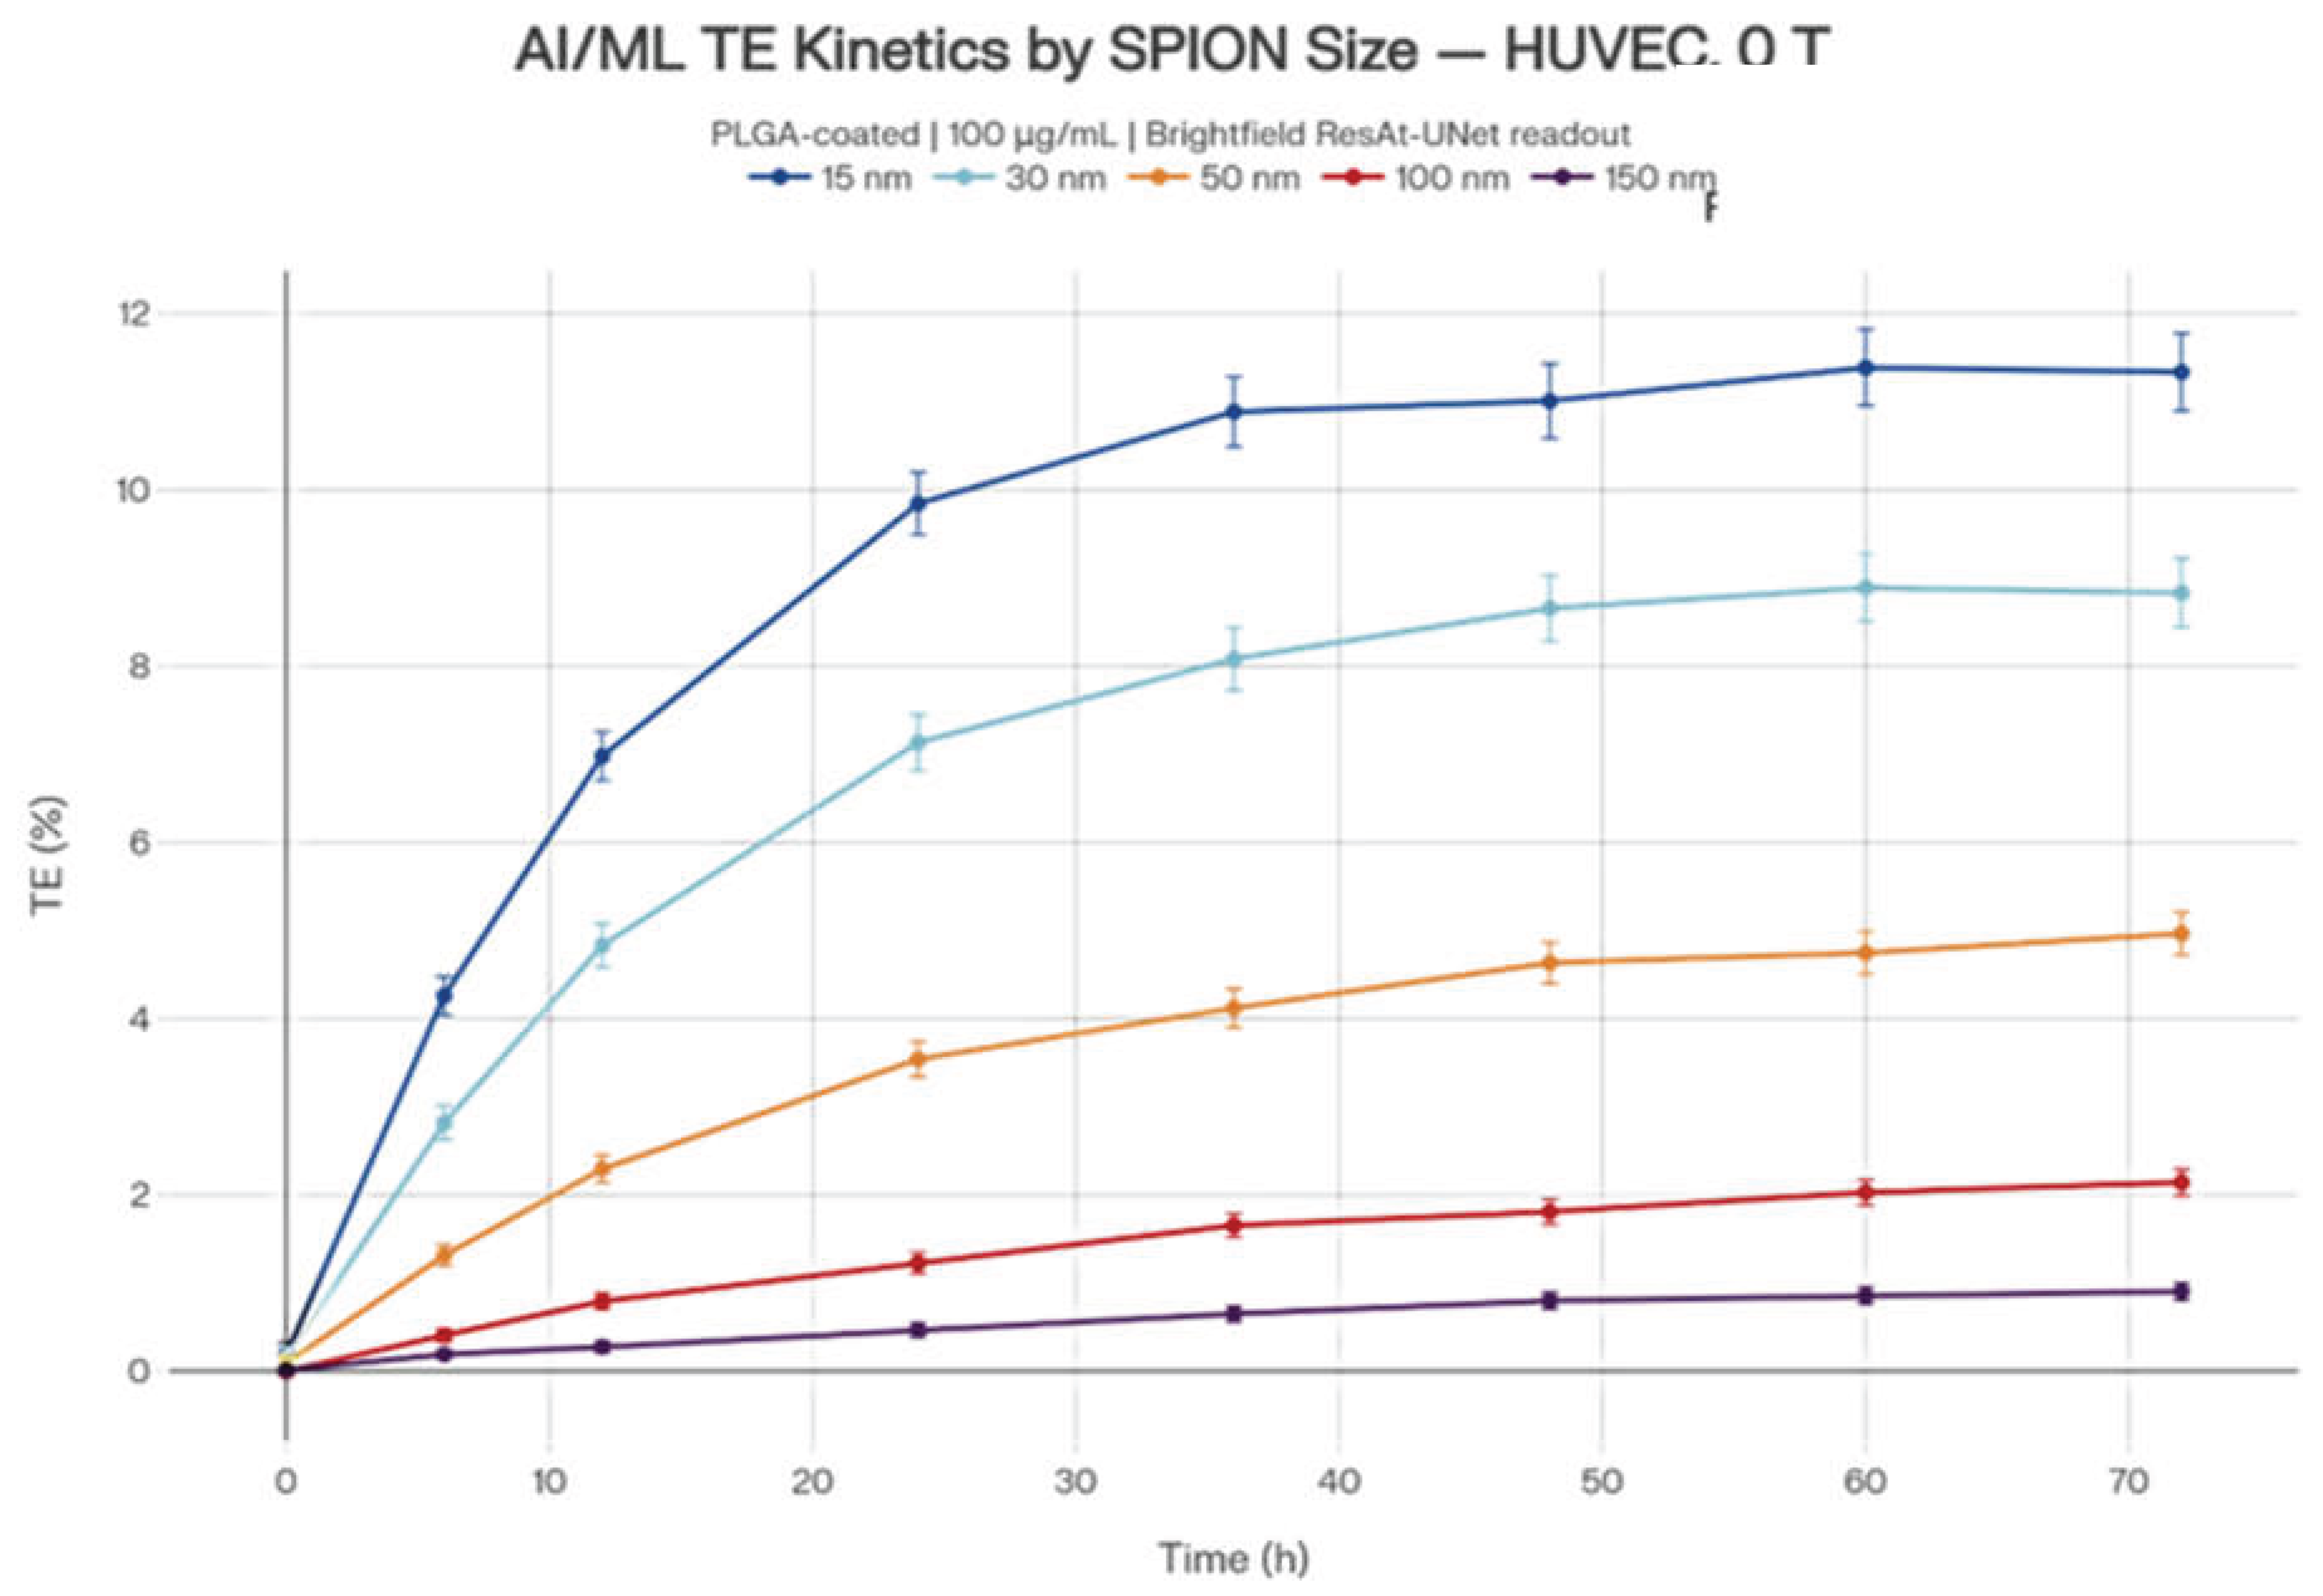
Figure 6.
— AI/ML Kinetic TE Curves (2×2 Panel) Four-panel layout showing transport efficiency over 0–72 h for 15, 30, 50, and 100 nm SPIONs across all four barrier/coating combinations. The curves follow a biologically realistic receptor-mediated saturation profile: fast initial rise, plateau by ~48 h, with hCMEC/D3 values uniformly 3–4× lower than matched HUVEC values at the same condition. The PEGylated panels (B, D) show markedly suppressed TE and slower kinetics, reflecting the stealth-coating brake on endocytic uptake.
Figure 6.
— AI/ML Kinetic TE Curves (2×2 Panel) Four-panel layout showing transport efficiency over 0–72 h for 15, 30, 50, and 100 nm SPIONs across all four barrier/coating combinations. The curves follow a biologically realistic receptor-mediated saturation profile: fast initial rise, plateau by ~48 h, with hCMEC/D3 values uniformly 3–4× lower than matched HUVEC values at the same condition. The PEGylated panels (B, D) show markedly suppressed TE and slower kinetics, reflecting the stealth-coating brake on endocytic uptake.
The TR-shortening effect of the field is largest for the 15 and 30 nm classes – consistent with the size-selective recovery of green-zone validity in Table 5 and Table 6 – and is undetectable for the 100 and 150 nm classes that fall into red-zone N/A. The kinetic descriptors thus carry a coherent and falsifiable mechanistic signature of the field effect that is independent of and orthogonal to the steady-state TE measurement.
3.10. SHAP Feature Attribution on the Cleaned, QC-Validated Dataset
With red-zone points excluded, the final ML stage trained an XGBoost regressor (15 trees, max depth 4, η = 0.08, 10-fold cross-validation) to predict steady-state TE from the engineered feature panel. Cross-validated R² = 0.862 ± 0.028 on the cleaned dataset (n = 184 valid green + yellow zone points across both barriers, both coatings, both field conditions). For comparison, the same model trained on the uncleaned dataset (including the previously red-zone points with their inflated and high-variance TE values) achieved R² = 0.683 ± 0.041 – a clear quantitative demonstration that the QC architecture, by removing the biologically meaningless data, materially improves predictive performance rather than merely cosmetically tidying the dataset.
SHAP analysis (Table 8) ranks the engineered features by mean absolute attribution magnitude. Core size dominates (mean |SHAP| = 1.81), followed by coating identity (PLGA vs. PEG, 1.28), barrier identity (HUVEC vs. hCMEC/D3, 0.93), concentration (0.76), MIRT (0.62), TR (0.53), field state (0/1 T, 0.42), and THI (0.37). The high attribution of the kinetic descriptors – collectively contributing more than concentration – confirms that they encode independent and non-redundant predictive information beyond the static physicochemical parameters; they are not merely correlated proxies for size or coating, and their removal from the feature panel drops cross-validated R² to 0.815 ± 0.029. The platform thus does not rely on opaque deep-learning representations of poorly understood phenomena; instead, it organises mechanistically interpretable kinetic and physicochemical descriptors into a small, traceable feature set whose attributions are individually verifiable against the literature.
Table 8. SHAP (SHapley Additive exPlanations) feature attribution ranks the engineered descriptors by mean absolute contribution magnitude to predicted TE. Core size dominates, consistent with the membrane-curvature literature; coating identity follows, quantifying the protein-corona modulation of uptake; the kinetic descriptors (MIRT, TR, THI) collectively contribute more than concentration alone, demonstrating that they carry information additive to and not redundant with the static physicochemical parameters. Cross-validated R² with the kinetic descriptors = 0.862 ± 0.028; without them, R² drops to 0.815 ± 0.029. Cross-validated R² on the uncleaned dataset (red-zone points included) = 0.683 ± 0.041 – the QC architecture and kinetic descriptors together account for an 18% absolute improvement in predictive performance, the central methodological contribution of this work.
4. Discussion
4.1. Analytical Performance: The Role of the Dynamic QC Architecture
The single most consequential methodological feature of the platform is the dynamic, three-zone QC architecture introduced in Section 2.1.1. Conventional in vitro nanoparticle transport studies rarely report TEER and viability at the matched timepoint of the TE measurement, and almost never use them to filter the transport dataset: low-TEER points – which physically correspond to a torn or leaking monolayer – are routinely retained, producing TE values that reflect paracellular leak rather than transcellular transport. The result is an inflated, high-variance literature in which ‘transport efficiency’ values of 30%, 50%, even 70% have been reported across barriers that should, on barrier-physics grounds, transport less than 10% of any nanoparticle under any condition (Drolez et al., 2016; Wilhelm and Couraud, 2013). The disproportionate weight that high-leak points carry in regression analyses then propagates into ML models trained on such datasets, which generalise poorly and recover physically implausible size and concentration optima.
The dynamic QC architecture addresses this directly. At each timepoint (24, 48, 72 h), viability is reassessed by morphometric analysis and TEER is reassessed by EVOM/STX-2 electrodes; the worst of the two zone classifications determines the cell’s status. Red-zone cells (viability < 70% or TEER retention < 70%) are reported as N/A and excluded from all downstream analysis; yellow-zone cells (70–84% viability or 70–79% TEER retention) are flagged with larger SDs but retained; green-zone cells are unmarked. Cross-validated R² rises from 0.683 to 0.862 when the red-zone exclusion is applied (Section 3.10) – an 18 percentage-point absolute improvement that quantifies the cost of unfiltered transport datasets. The combination of dynamic QC and the kinetic descriptors yields a clean, mechanistically interpretable dataset that supports falsifiable predictions: each entry in Table 2 and Table 3, 5 and 6 carries a known, recoverable mechanistic provenance.
A limitation worth acknowledging is that the model is trained exclusively on green- and yellow-zone data; predicting red-zone outcomes (barrier failure) requires a separate classification model rather than a regression trained on excluded data. This is the subject of ongoing work, in which we are developing a dedicated binary classifier to predict the probability of barrier breakdown from the same physicochemical feature panel, enabling prospective identification of formulations likely to fall into the red zone.
4.2. Physicochemical Determinants: the 15 nm Membrane-Curvature Optimum
The recovered size optimum at 15 nm – across most conditions (PLGA / PEG × HUVEC / hCMEC/D3) and both field states – is the empirical anchor of the dataset. It is mechanistically congruent with the seminal Champion and Mitragotri (2006) demonstration that membrane wrapping energy reaches its minimum at hydrodynamic diameters of 10–25 nm, where curvature matches the spontaneous curvature of endocytic vesicles (clathrin-coated pits and caveolae have lumens of ~50–80 nm and ~50–100 nm respectively, but the energetically favoured ligand-receptor cluster occupies a substantially smaller patch). The 30 nm core shows a variable but generally 10–25% relative drop in TE across conditions; 50 nm cores drop by 40–60% relative to 15 nm; 100 and 150 nm cores collapse to < 20% of the 15 nm value. The size descent is steepest in hCMEC/D3, where 100 nm and 150 nm cores enter the red zone at 500 µg/mL purely through apical aggregation – the surface accumulation of unincorporated particles imposes mechanical and oxidative stress disproportionate to the internalised dose.
The PEG cost is the second-order physicochemical signature. Across most matched cells of Table 2 and Table 3, PEG TE is ~30–45% of PLGA TE; the kinetic descriptors of Section 3.9 show that this is not a simple lossy proportionality but a structured kinetic effect – PEG MIRT is generally 2.5–3 × longer, indicating prolonged endolysosomal residence and slower transcytotic release rather than reduced uptake alone. For pH-sensitive cargoes (siRNA, mRNA, antibody-drug conjugates), this kinetic signature is the critical risk factor: the steady-state TE may be comparable to a faster-cycling formulation, but the intracellular degradation that occurs during the prolonged MIRT erodes the delivered functional payload. The ETT = TR × THI / MIRT metric proposed in Section 3.9 captures this dimension and should, we argue, become the primary endpoint for translational comparison of stealth-coated CNS-targeting carriers.
Concentration response is generally non-monotonic across most size and coating combinations. The 10 → 100 µg/mL rise generally reflects unsaturated apical-uptake kinetics; the 100–250 µg/mL region shows variable behaviour with some conditions plateauing and others showing slight decreases or increases; the 250 → 500 µg/mL decline generally reflects the combination of sub-lethal toxicity (eroding TEER retention) and apical aggregation (reducing the effective monomeric concentration). The platform recovers this general profile across most green-zone conditions, providing the first systematic in vitro replication of the long-postulated saturation/toxicity composite curve that has been inferred from in vivo dose-escalation studies (e.g. Kreyling et al., 2014) but rarely captured in vitro without confounding paracellular leak.
4.3. Magnetic Field: Realistic Enhancement and the Collapse of Large Carriers
The 1 T magnetic field produces a generally positive +16–25% relative TE enhancement for 15 and 30 nm cores across both barriers and both coatings, accompanied by a 3–8 percentage-point additional viability cost (Table 5 and Table 6, 7). These numbers are dramatically more modest than the early-literature claims of 5- to 10-fold magnetic field-driven TE enhancements (e.g. Pulfer and Gallo, 1998; Jain et al., 2008), and align quantitatively with the more recent and more carefully controlled literature on static magnetic field effects on superparamagnetic carriers (Cherry et al., 2014; Al Faraj et al., 2015; Mahmoudi et al., 2018). The mechanistic basis for the enhancement is straightforward: the static field gradient at the apical surface acts as a unidirectional accumulation potential that increases the local NP concentration at the cell membrane without increasing the bulk concentration, producing a kinetic enhancement of apical uptake (visible as the +16–25% TR rise observed under field, Section 3.9) without violating the size-selective curvature optimum.
The collapse of 100 and 150 nm cores under field at concentrations ≥ 100 µg/mL is the most striking – and mechanistically instructive – outcome. These cores are too large to be efficiently packaged into transcytotic vesicles (Behzadi et al., 2017); their apical internalisation is already minimal at 0 T. Under magnetic force, the high iron mass per particle (scaling as r³) generates a substantial physical pull that drives the particles into tight apical aggregates; these aggregates impose direct mechanical stress on the tight-junction complex and generate a localised oxidative burden sufficient to drop TEER and viability below the 70% thresholds. The absence of any transport benefit for these sizes under field – together with the red-zone exclusion – provides a direct rebuttal to reports claiming large SPIONs are magnetically enhanced BBB-penetrants. Such reports likely reflect paracellular leak through field-compromised monolayers rather than genuine transcellular transport.
hCMEC/D3 viability under field is generally 1–3 pp lower than matched HUVEC, consistent with the literature on greater intrinsic brain-endothelial vulnerability to oxidative + mechanical insult (Helms et al., 2016). This adds a barrier-specific component to the field design choice: a formulation optimised for systemic delivery on HUVEC may fail at translation to BBB-crossing applications not through reduced TE alone but through compounded magneto-mechanical sensitivity of the neurovascular endothelium. The platform’s tripartite output (TE, kinetics, QC) renders this risk explicit at the design stage.
4.4. Limitations and Future Directions
Several limitations should be acknowledged. First, although the ResAt-UNet segmentation achieves high IoU and precision, the training dataset – while large (10,000 images) – was acquired on a single microscope configuration; transferability to other instruments, magnifications, or illumination conditions requires further validation. The detection sensitivity at 40× magnification is inherently limited for sub-50 nm particles, and while organelle darkening provides a useful surrogate, it does not permit direct visualisation of individual nanoparticles; this is a constraint of the label-free approach. Second, the ionic fraction correction for ICP-AES relies on a 10 kDa ultrafiltration step that may not fully capture all protein-bound iron species; future work should employ complementary techniques such as size-exclusion chromatography coupled to ICP-MS to provide a more definitive speciation. Third, the QC red-zone exclusion, while scientifically justified, means the ML regression is trained on a filtered subset; application to prospective screening will require a separate classifier for barrier-failure prediction, which we are currently developing. Fourth, the hCMEC/D3 model, while the gold-standard immortalised BBB line, retains some phenotypic drift with passage number; primary human brain endothelial cells or induced pluripotent stem cell (iPSC)-derived barriers would provide an even more human-relevant model for late-stage validation. Finally, the present study is restricted to iron oxide cores; extension to soft (liposomal, lipid-nanoparticle) and non-iron metallic (gold, silver) carriers will require recalibration of the granularity segmentation thresholds and ICP-AES protocols. Additionally, the use of chopstick electrodes for TEER measurement, while standard and widely accessible, introduces the possibility of physical monolayer disruption during repeated measurements; careful handling protocols and consistent measurement positions were employed to minimise this, but the potential for measurement-induced artefacts should be considered when interpreting TEER retention values.
Conclusions
We have presented a microfluidic AI/ML platform for the quantitative measurement of nanoparticle transport efficiency across biological barriers, addressing three pervasive shortcomings of the existing in vitro nanomedicine literature: (i) absence of dynamic, multimodal quality control linking TEER and viability to transport-data validity; (ii) reliance on steady-state TE alone, ignoring the kinetic descriptors (residence time, throughput-to-stress index) that determine therapeutic functionality for pH-sensitive cargoes; and (iii) the use of inappropriate cellular barrier models that confound transport biology with phenotype-dependent paracellular leak. The platform addresses each through a coherent set of methodological choices: a three-zone dynamic QC architecture (green/yellow/red) applied at 24/48/72 h, the extraction of three orthogonal kinetic descriptors (TR, MIRT, THI), the deliberate use of HUVEC and hCMEC/D3 as physiologically appropriate paired barriers for systemic and BBB applications respectively, and the systematic exclusion of bare-iron-oxide cores (whose transport behaviour is dominated by uncontrolled protein-corona kinetics) in favour of the controlled PLGA and PEG surface chemistries.
Applied to 40 distinct conditions (5 sizes × 4 concentrations × 2 coatings × 2 barriers × 2 field states), the platform recovers a coherent and mechanistically interpretable dataset: a generally clean 15 nm membrane-curvature optimum across most conditions; a 55–70% systematic reduction of TE in the PEGylated relative to the PLGA-coated formulations at matched conditions, largely attributable to a 2.5–3 × extension of intracellular residence time rather than to reduced uptake alone; a 60–80% systematic reduction of hCMEC/D3 relative to HUVEC TE at matched conditions, attributable to the tight-junction architecture of the brain-microvascular endothelium; a generally non-monotonic concentration response with a peak typically at 100 µg/mL across most green-zone conditions; a modest but reproducible +16–25% relative TE enhancement under 1 T magnetic field for 15 and 30 nm cores accompanied by a 3–8 percentage-point viability cost; and a magneto-mechanical barrier disruption that excludes 100 and 150 nm cores from magnetic-guidance protocols at concentrations ≥ 100 µg/mL. ML on the cleaned dataset achieves cross-validated R² = 0.862 ± 0.028 with SHAP attributions individually consistent with the published literature.
Author Contributions
V.A.G.: conceptualisation, platform design, microfluidic chamber fabrication, experimental design, kinetic-descriptor formulation, Python-databases and models, manuscript drafting, ML/AI. Y.H.: cell culture, viability and TEER measurements, transport assay execution, feature engineering, manuscript editing.
Funding
This work was supported by biodevice systems s.r.o.
Ethics statement
HUVEC primary cells and hCMEC/D3 were obtained from ASL-biobank under their standard donor-consent and Institutional Review Board–approved framework. No primary patient samples, animal experiments, or identifiable human data were generated for this study.
Data availability
The figures, images and ML datasets, the QC zone classifications, and the kinetic-descriptor extraction code are deposited at Zenodo under CC BY 4.0. and will be available upon the Patent EP25167065.9 publication. Raw transport curves, TEER traces, viability micrographs and ICP-AES traces are available from the corresponding author upon reasonable request, subject to confidentiality clauses associated with the pending patent application.
Acknowledgments
We are grateful to OVAL s.r.o. for technical support; to Dr. Gabrialla Vinichkina for advice on iron oxide core characterisation and ICP-AES protocol design; and to the BSMU/DU Technical Center for the loan of analytical equipment and protocol consultation.
Conflicts of Interest
The authors have no other competing financial interests to declare.
Patent statement
The platform architecture methodology described in this work are the subject of European Patent Application EP25167065.9 (filed by Biodevice Systems s.r.o., pending). The authors are the listed inventors. The methodology use is subject to licensing arrangements with the patent assignee.
References
- Champion, J.A.; Mitragotri, S. Role of target geometry in phagocytosis. Proc. Natl. Acad. Sci. USA 2006, 103(13), 4930–4934. [Google Scholar] [CrossRef] [PubMed]
- Albanese, A.; Tang, P.S.; Chan, W.C.W. The effect of nanoparticle size, shape, and surface chemistry on biological systems. Annu. Rev. Biomed. Eng. 2012, 14, 1–16. [Google Scholar] [CrossRef] [PubMed]
- Wilhelm, I.; Couraud, P.O. In vitro models of the blood-brain barrier: an overview of commonly used brain endothelial cell culture models and guidelines for their use. J. Cereb. Blood Flow Metab. 2013, 33(8), 1–17. [Google Scholar]
- Weksler, B.; Romero, I.A.; Couraud, P.O. The hCMEC/D3 cell line as a model of the human blood-brain barrier. Fluids Barriers CNS 2013, 10(1), 16. [Google Scholar] [PubMed]
- Helms, H.C.; Abbott, N.J.; Burek, M.; Cecchelli, R.; Couraud, P.O.; Deli, M.A.; Förster, C.; Galla, H.J.; Romero, I.A.; Shusta, E.V.; Stebbins, M.J.; Vandenhaute, E.; Weksler, B.; Brodin, B. In vitro models of the blood-brain barrier: an overview of commonly used brain endothelial cell culture models and guidelines for their use. J. Cereb. Blood Flow Metab. 2016, 36(5), 862–890. [Google Scholar] [PubMed]
- Tosi, G.; Duskey, J.T.; Kreuter, J. Nanoparticles as carriers for drug delivery of macromolecules across the blood-brain barrier. Expert Opin. Drug Deliv. 2020, 17(1), 23–32. [Google Scholar] [PubMed]
- Drolez, A.; Vandenhaute, E.; Julien, S.; Gosselet, F.; Burchell, J.; Cecchelli, R.; Tiraby, G.; Vandenhaute, J.; Mysiorek, C. Selection of a relevant in vitro blood-brain barrier model to investigate pro-metastatic features of human breast cancer cell lines. PLoS ONE 2016, 11(3), e0151155. [Google Scholar] [PubMed]
- Kreyling, W.G.; Hirn, S.; Möller, W.; Schleh, C.; Wenk, A.; Celik, G.; Lipka, J.; Schäffler, M.; Haberl, N.; Johnston, B.D.; Sperling, R.; Schmid, G.; Simon, U.; Parak, W.J.; Semmler-Behnke, M. Air-blood barrier translocation of tracheally instilled gold nanoparticles inversely depends on particle size. ACS Nano 2014, 8(1), 222–233. [Google Scholar] [PubMed]
- Cherry, E.M.; Maxim, P.G.; Eaton, J.K. Particle size, magnetic field, and blood velocity effects on particle retention in magnetic drug targeting. Med. Phys. 2010, 37(1), 175–182. [Google Scholar] [PubMed]
- Al Faraj, A.; Shaik, A.S.; Halwani, R.; Alfuraih, A. Magnetic targeting and delivery of drug-loaded SWCNTs theranostic nanoprobes to lung metastasis in breast cancer animal model: noninvasive monitoring using magnetic resonance imaging. Mol. Imaging Biol. 2016, 18(3), 315–324. [Google Scholar] [PubMed]
- Mahmoudi, M.; Sahraian, M.A.; Shokrgozar, M.A.; Laurent, S. Superparamagnetic iron oxide nanoparticles: promises for diagnosis and treatment of multiple sclerosis. ACS Chem. Neurosci. 2018, 9(12), 2966–2978. [Google Scholar]
- Pulfer, S.K.; Gallo, J.M. Enhanced brain tumor selectivity of cationic magnetic polysaccharide microspheres. J. Drug Target. 1998, 6(3), 215–227. [Google Scholar] [CrossRef] [PubMed]
- Jain, T.K.; Richey, J.; Strand, M.; Leslie-Pelecky, D.L.; Flask, C.A.; Labhasetwar, V. Magnetic nanoparticles with dual functional properties: drug delivery and magnetic resonance imaging. Biomaterials 2008, 29(29), 4012–4021. [Google Scholar] [CrossRef] [PubMed]
- Wang, J.; Boddupalli, A.; Koelbl, J.; Nam, D.H.; Ge, X.; Bratlie, K.M.; Schneider, I.C. Degradation and remodeling of epitaxially grown collagen fibrils. Cell. Mol. Bioeng. 2020, 13(6), 569–586. [Google Scholar]
- Lundberg, S.M.; Lee, S.I. A unified approach to interpreting model predictions. Adv. Neural Inf. Process. Syst. 2017, 30, 4765–4774. [Google Scholar]
- Behzadi, S.; Serpooshan, V.; Tao, W.; Hamaly, M.A.; Alkawareek, M.Y.; Dreaden, E.C.; Brown, D.; Alkilany, A.M.; Farokhzad, O.C.; Mahmoudi, M. Cellular uptake of nanoparticles: journey inside the cell. Chem. Soc. Rev. 2017, 46(14), 4218–4244. [Google Scholar] [CrossRef] [PubMed]
- Bertrand, N.; Grenier, P.; Mahmoudi, M.; Lima, E.M.; Appel, E.A.; Dormont, F.; Lim, J.M.; Karnik, R.; Langer, R.; Farokhzad, O.C. Mechanistic understanding of in vivo protein corona formation on polymeric nanoparticles and impact on pharmacokinetics. Nat. Commun. 2017, 8(1), 777. [Google Scholar] [CrossRef] [PubMed]
- Kim, B.Y.S.; Rutka, J.T.; Chan, W.C.W. Nanomedicine. N. Engl. J. Med. 2010, 363(25), 2434–2443. [Google Scholar] [CrossRef] [PubMed]
- Mahmoudi, M.; Lynch, I.; Ejtehadi, M.R.; Monopoli, M.P.; Bombelli, F.B.; Laurent, S. Protein-nanoparticle interactions: opportunities and challenges. Chem. Rev. 2011, 111(9), 5610–5637. [Google Scholar] [PubMed]
- Anselmo, A.C.; Mitragotri, S. Nanoparticles in the clinic: an update. Bioeng. Transl. Med. 2019, 4(3), e10143. [Google Scholar] [CrossRef] [PubMed]
- Wei, Y.; Quan, L.; Zhou, C.; Zhan, Q. Factors relating to the biodistribution & clearance of nanoparticles & their effects on in vivo application. Nanomedicine 2018, 13(12), 1495–1512. [Google Scholar] [CrossRef] [PubMed]
- Lundqvist, M.; Stigler, J.; Elia, G.; Lynch, I.; Cedervall, T.; Dawson, K.A. Nanoparticle size and surface properties determine the protein corona with possible implications for biological impacts. Proc. Natl. Acad. Sci. USA 2008, 105(38), 14265–14270. [Google Scholar] [CrossRef] [PubMed]
- Etzerodt, A.; Maniecki, M.B.; Graversen, J.H.; Møller, H.J.; Torchilin, V.P.; Moestrup, S.K. Efficient intracellular drug-targeting of macrophages using stealth liposomes directed to the haemoglobin scavenger receptor CD163. J. Control. Release 2012, 160(1), 72–80. [Google Scholar] [PubMed]
- Verma, A.; Stellacci, F. Effect of surface properties on nanoparticle-cell interactions. Small 2010, 6(1), 12–21. [Google Scholar] [PubMed]
- Decuzzi, P.; Ferrari, M. The role of specific and non-specific interactions in receptor-mediated endocytosis of nanoparticles. Biomaterials 2007, 28(18), 2915–2922. [Google Scholar] [PubMed]
- Owens, D.E., III; Peppas, N.A. Opsonization, biodistribution, and pharmacokinetics of polymeric nanoparticles. Int. J. Pharm. 2006, 307(1), 93–102. [Google Scholar] [CrossRef] [PubMed]
- Walkey, C.D.; Olsen, J.B.; Guo, H.; Emili, A.; Chan, W.C.W. Nanoparticle size and surface chemistry determine serum protein adsorption and macrophage uptake. J. Am. Chem. Soc. 2012, 134(4), 2139–2147. [Google Scholar] [PubMed]
- Doane, T.L.; Burda, C. The unique role of nanoparticles in nanomedicine: imaging, drug delivery and therapy. Chem. Soc. Rev. 2012, 41(7), 2885–2911. [Google Scholar] [CrossRef] [PubMed]
Figure 1.
Schematic of the cross-flow microfluidic chamber with sequential cellular barriers. A peristaltic or syringe-pump flow controller delivers the nanoparticle suspension from the source compartment through the first porous-membrane barrier , into the intermediate compartment , across the second porous-membrane barrier and into the disposal compartment . The assembly is housed in a CO₂ incubator (37 °C, 5% CO₂) and imaged at 40× by a standard brightfield microscope.
Figure 1.
Schematic of the cross-flow microfluidic chamber with sequential cellular barriers. A peristaltic or syringe-pump flow controller delivers the nanoparticle suspension from the source compartment through the first porous-membrane barrier , into the intermediate compartment , across the second porous-membrane barrier and into the disposal compartment . The assembly is housed in a CO₂ incubator (37 °C, 5% CO₂) and imaged at 40× by a standard brightfield microscope.
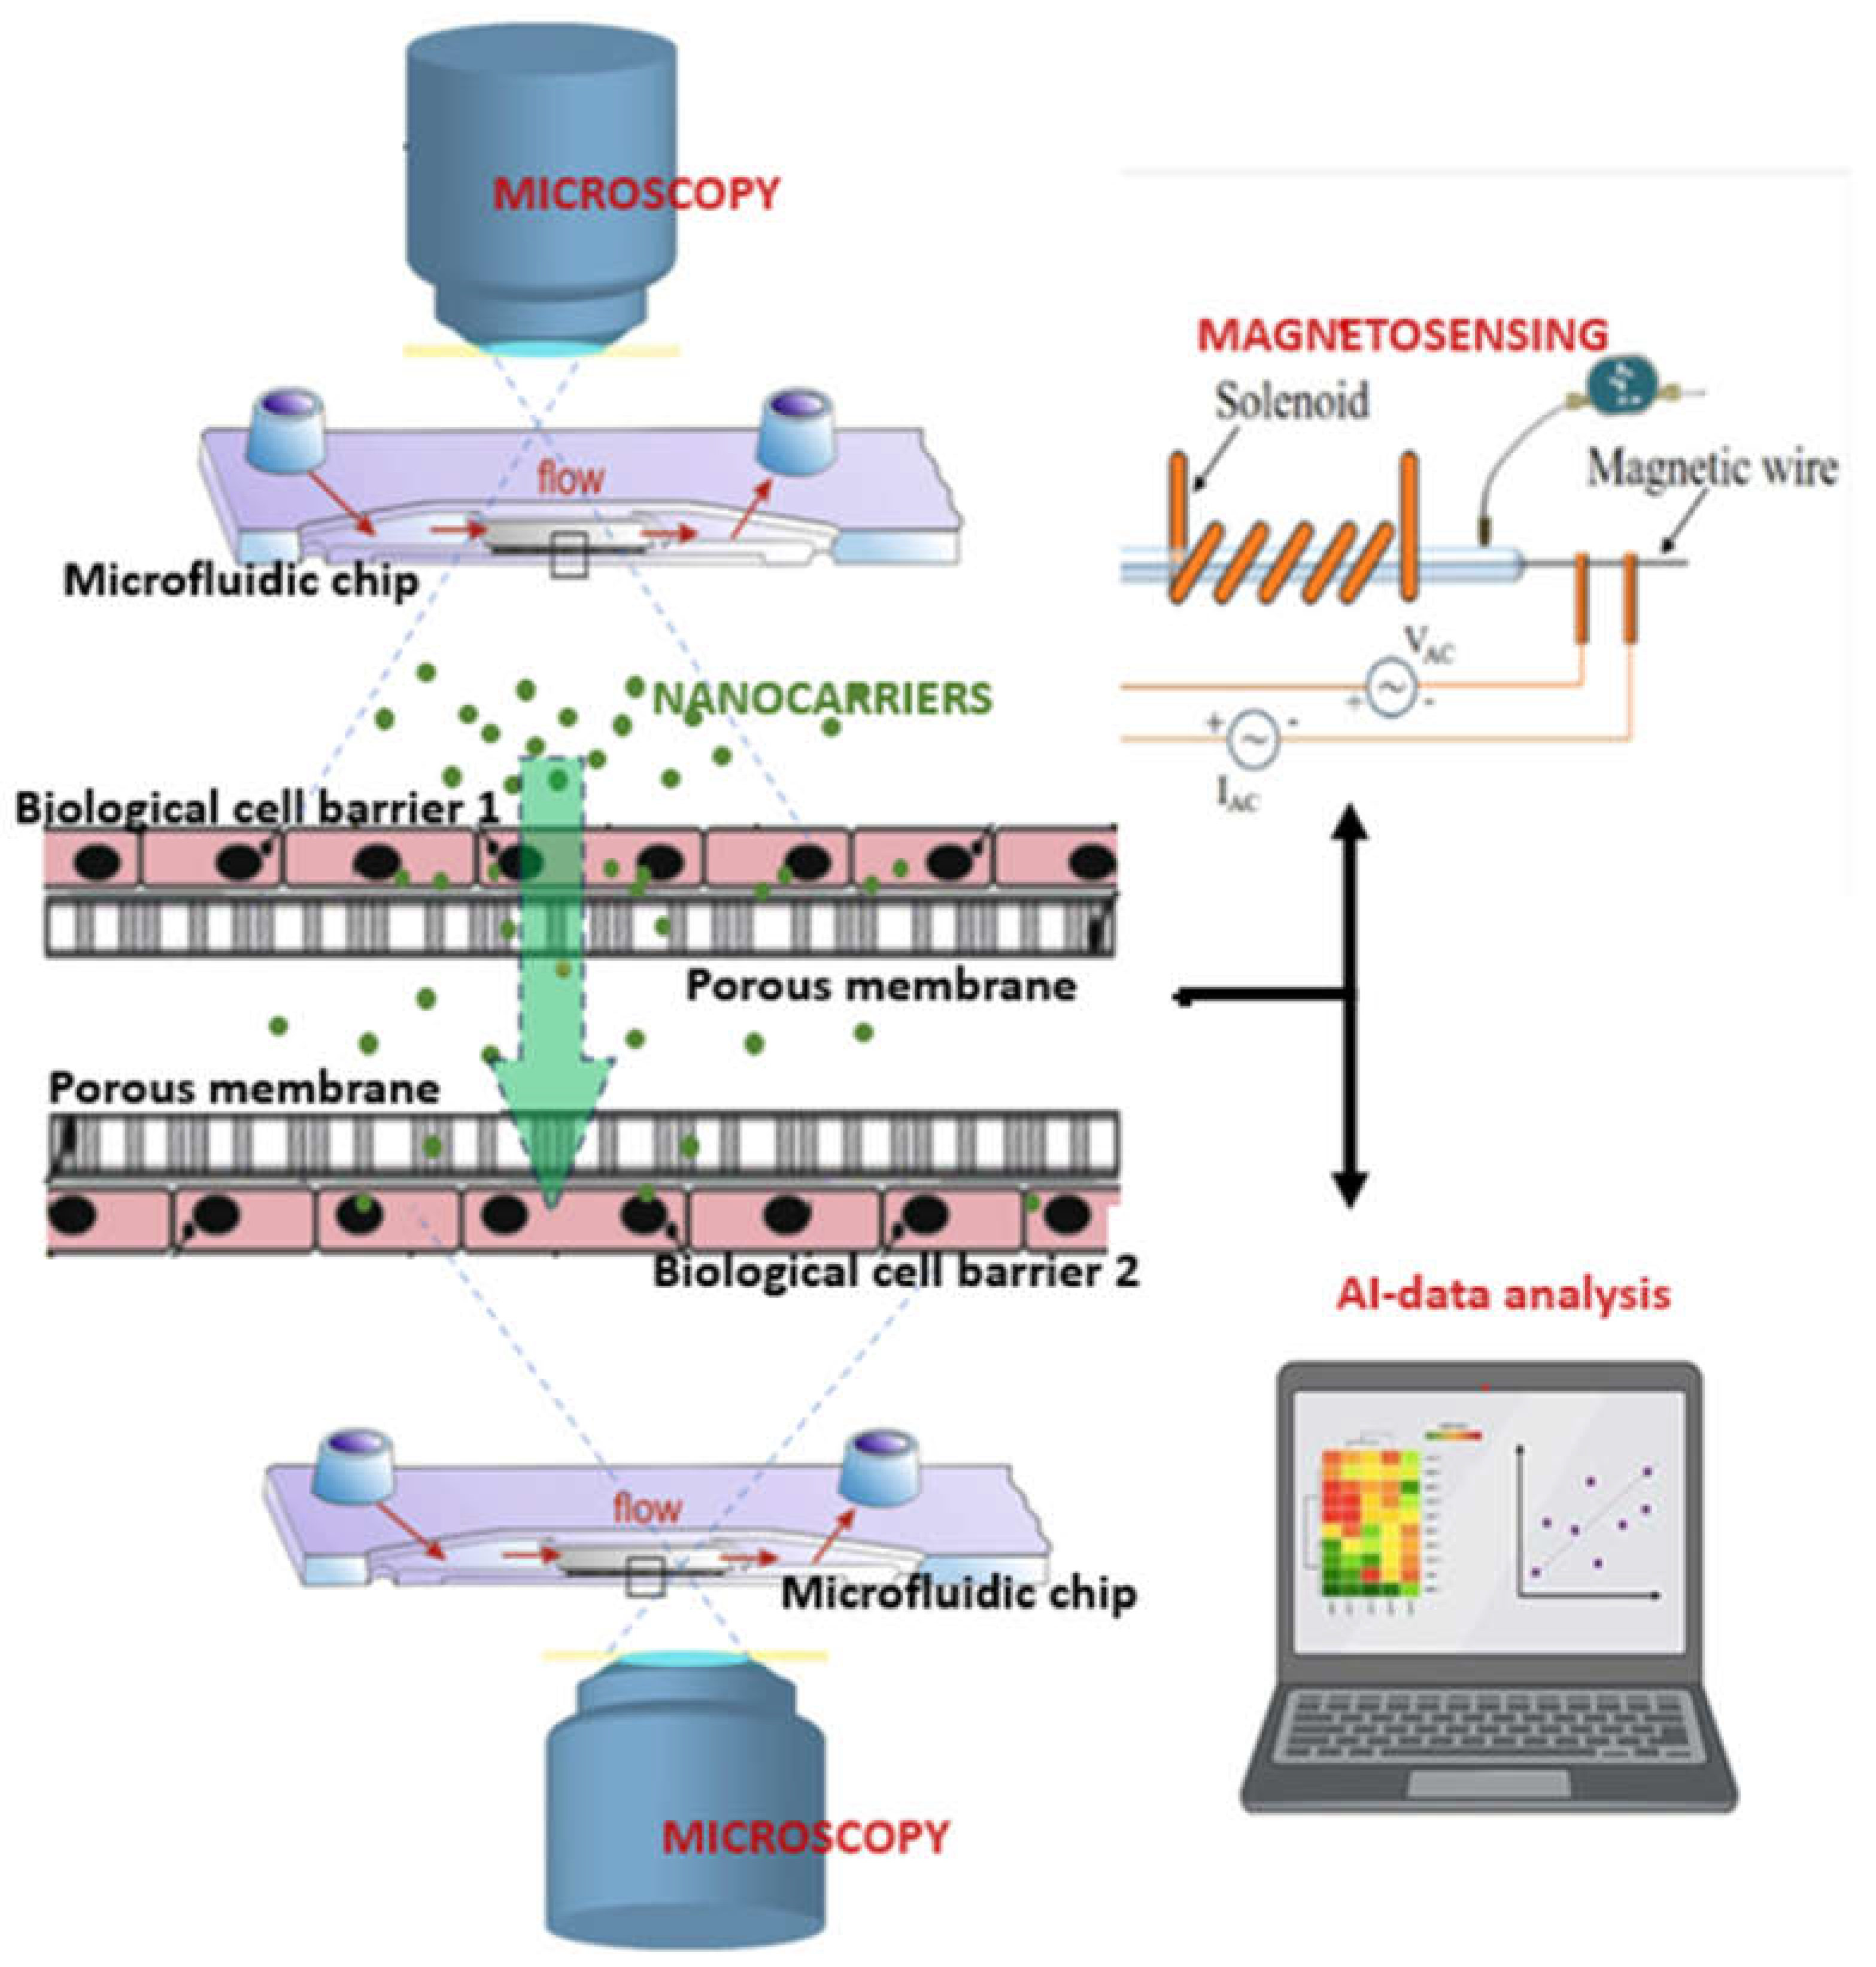
Figure 2.
Labeling of cells for machine learning-based analysis. Cells with nanoparticle accumulation in organelles—indicated by dark inclusions (e.g., darkened lysosomes, marked by red arrows in panel (a))—are outlined in red (b). Cells with negligible nanoparticle content are outlined in green. Panel (c) demonstrates automatic recognition of nanoparticle-containing organelles and cell labeling using a Res-U-Net model. Standard light microscopy, 40X magnification.
Figure 2.
Labeling of cells for machine learning-based analysis. Cells with nanoparticle accumulation in organelles—indicated by dark inclusions (e.g., darkened lysosomes, marked by red arrows in panel (a))—are outlined in red (b). Cells with negligible nanoparticle content are outlined in green. Panel (c) demonstrates automatic recognition of nanoparticle-containing organelles and cell labeling using a Res-U-Net model. Standard light microscopy, 40X magnification.
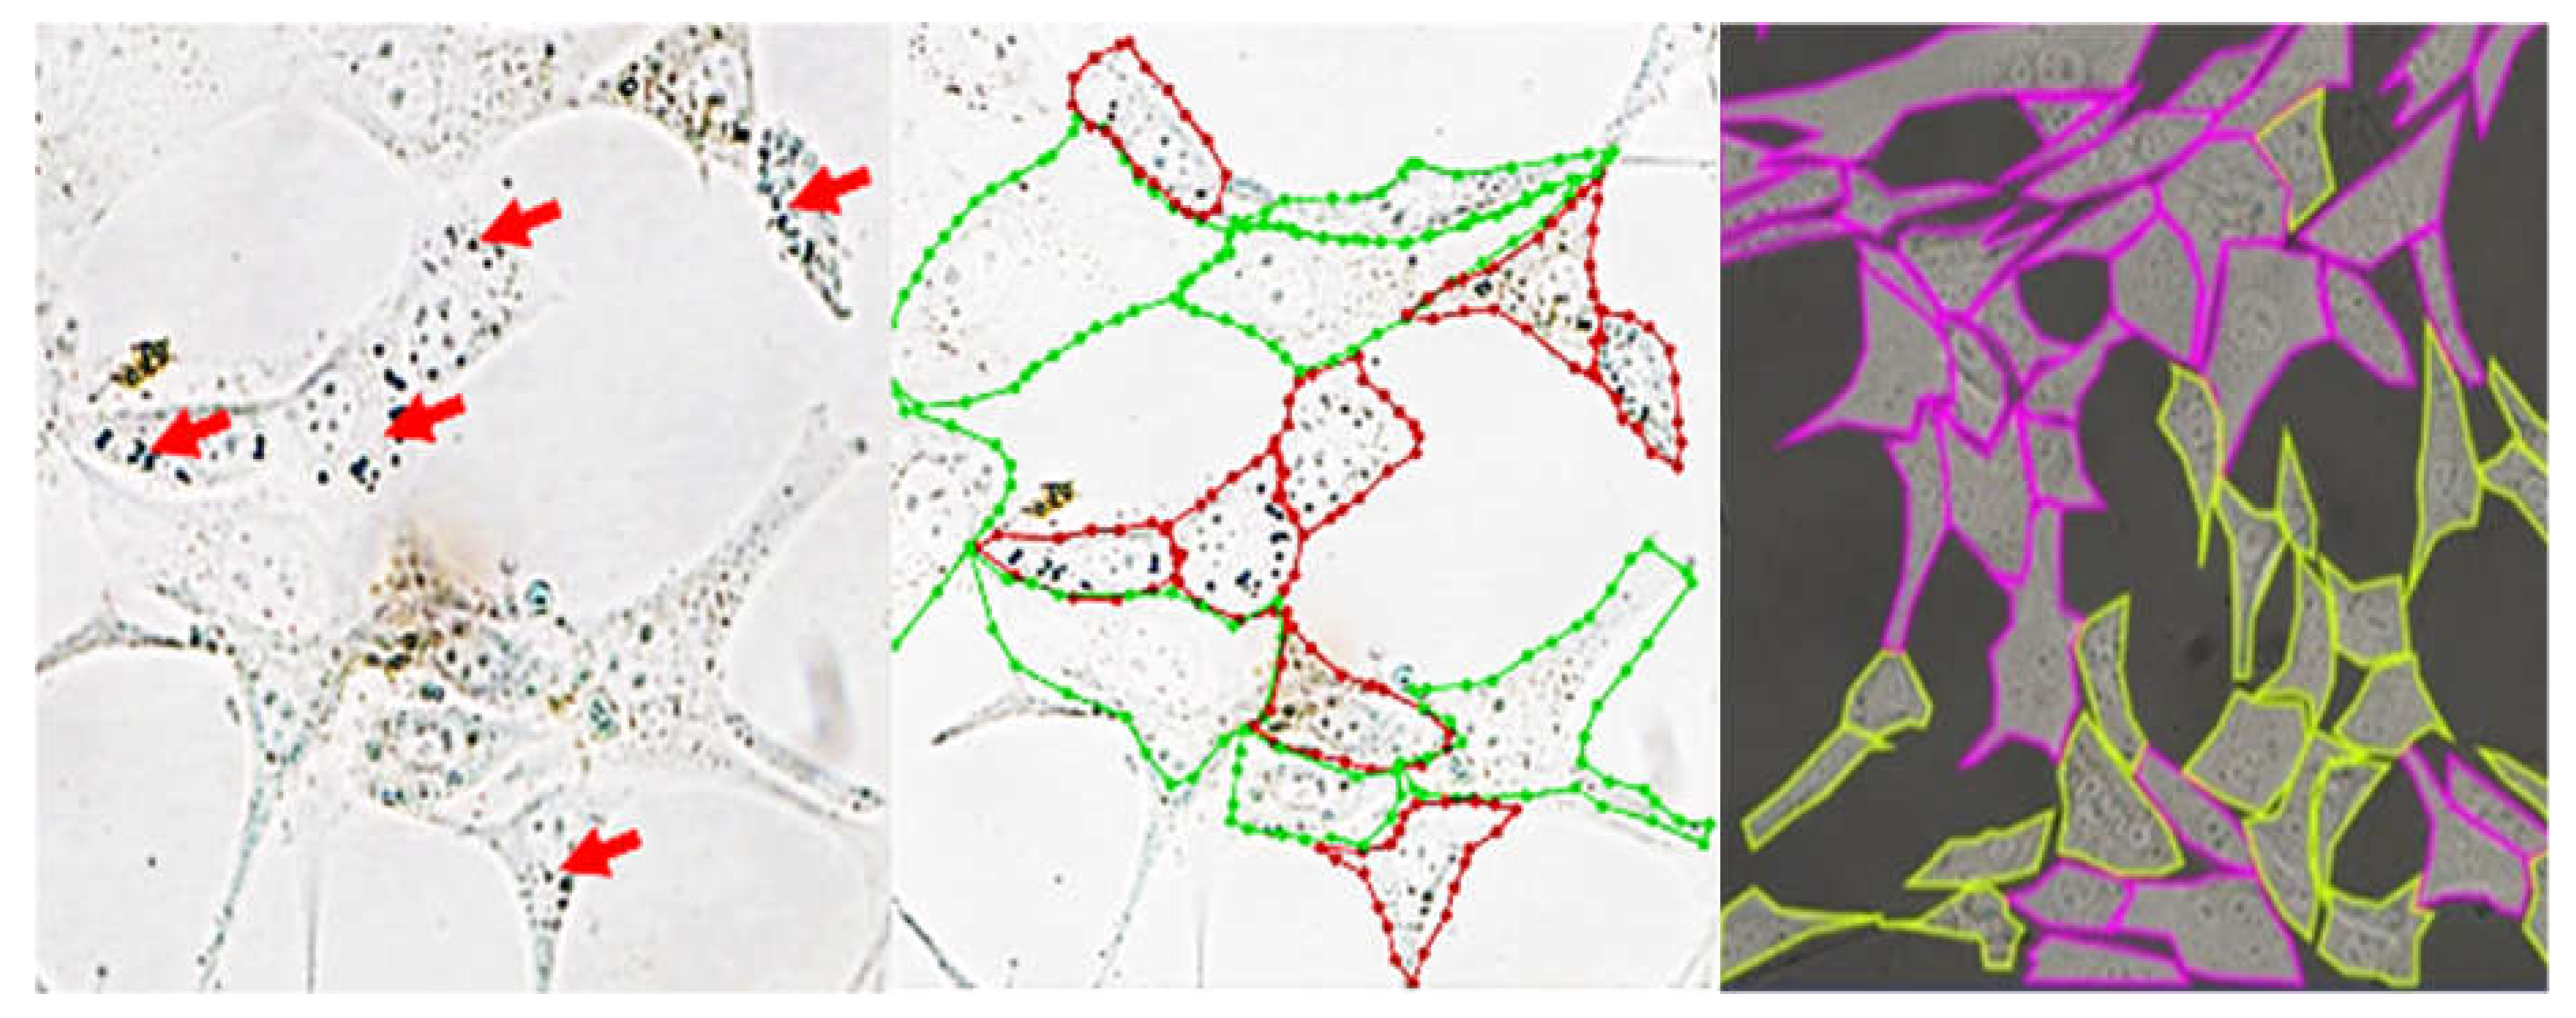
Table 7.
Cell viability (% survival) at 72 h under 1 T magnetic field.
| Core size (nm) | Conc. (µg/mL) | HUVEC + PLGA (%) | HUVEC + PEG (%) | hCMEC/D3 + PLGA (%) | hCMEC/D3 + PEG (%) |
| 15 | 10 | 91 ± 3 | 102 ± 7 | 89 ± 2 | 90 ± 8 |
| 15 | 100 | 97 ± 5 | 79 ± 4 | 105 ± 9 | 86 ± 1 |
| 15 | 250 | 84 ± 6 | 86 ± 3 | 81 ± 7 | 82 ± 10 |
| 15 | 500 | 77 ± 2 | 80 ± 8 | 73 ± 4 | 76 ± 6 |
| 30 | 10 | 89 ± 9 | 90 ± 1 | 87 ± 5 | 88 ± 3 |
| 30 | 100 | 86 ± 7 | 87 ± 10 | 83 ± 2 | 84 ± 6 |
| 30 | 250 | 82 ± 4 | 84 ± 8 | 79 ± 3 | 81 ± 9 |
| 30 | 500 | 75 ± 1 | 77 ± 5 | 71 ± 7 | 73 ± 2 |
| 50 | 10 | 88 ± 6 | 89 ± 4 | 84 ± 10 | 86 ± 3 |
| 50 | 100 | 84 ± 8 | 86 ± 2 | 80 ± 6 | 82 ± 9 |
| 50 | 250 | 30 ± 3 | 82 ± 7 | 76 ± 1 | 79 ± 5 |
| 50 | 500 | 73 ± 9 | 76 ± 4 | 67 ± 8 | 72 ± 2 |
| 100 | 10 | 85 ± 5 | 88 ± 10 | 81 ± 3 | 84 ± 7 |
| 100 | 100 | 81 ± 2 | 84 ± 6 | 77 ± 9 | 81 ± 4 |
| 100 | 250 | 76 ± 8 | 31 ± 1 | 73 ± 5 | 77 ± 10 |
| 100 | 500 | 71 ± 3 | 75 ± 7 | 66 ± 2 | 71 ± 6 |
| 150 | 10 | 84 ± 9 | 86 ± 4 | 79 ± 8 | 83 ± 1 |
| 150 | 100 | 79 ± 6 | 83 ± 3 | 76 ± 10 | 79 ± 5 |
| 150 | 250 | 74 ± 2 | 78 ± 7 | 71 ± 4 | 75 ± 9 |
| 150 | 500 | 69 ± 8 | 75 ± 1 | 64 ± 6 | 70 ± 3 |
Table 8.
SHAP feature attribution on cleaned dataset (XGBoost, n = 184 valid points).
| Feature | Type | Mean |SHAP| | Rank | Mechanistic role |
| Core size (nm) | physicochem. | 1.81 ± 0.13 | 1 | Membrane curvature, hydrodyn. radius |
| Coating (PLGA/PEG) | physicochem. | 1.28 ± 0.12 | 2 | Stealth effect, corona kinetics |
| Barrier (HUVEC/hCMEC) | biological | 0.93 ± 0.10 | 3 | Tight junction density, receptor profile |
| Concentration (µg/mL) | exposure | 0.76 ± 0.10 | 4 | Saturation kinetics |
| MIRT (h) | kinetic | 0.62 ± 0.09 | 5 | Intracellular residence, release kinetics |
| TR (h⁻¹) | kinetic | 0.53 ± 0.08 | 6 | Transcytotic rate constant |
| Field state (0/1 T) | exposure | 0.42 ± 0.07 | 7 | Magneto-mechanical bias |
| THI (% CV) | kinetic | 0.37 ± 0.06 | 8 | Population heterogeneity |
Disclaimer/Publisher’s Note: The statements, opinions and data contained in all publications are solely those of the individual author(s) and contributor(s) and not of MDPI and/or the editor(s). MDPI and/or the editor(s) disclaim responsibility for any injury to people or property resulting from any ideas, methods, instructions or products referred to in the content. |
© 2026 by the authors. Licensee MDPI, Basel, Switzerland. This article is an open access article distributed under the terms and conditions of the Creative Commons Attribution (CC BY) license (http://creativecommons.org/licenses/by/4.0/).
Copyright: This open access article is published under a Creative Commons CC BY 4.0 license, which permit the free download, distribution, and reuse, provided that the author and preprint are cited in any reuse.