

Submitted:
26 June 2026
Posted:
29 June 2026
You are already at the latest version
Abstract
The rapid development of electric vehicles has increased the need for a better understanding of the relationships between vehicle dynamics, energy consumption and control strategies. This study presents an experimental investigation of the acceleration and coasting characteristics of a 2024 Kia Niro EV. Road tests were combined with laboratory measurements of the vehicle mass properties, including the centre of gravity. Vehicle motion parameters were recorded using a GNSS/INS measurement system, while electric powertrain data were acquired from the vehicle CAN bus using proprietary software developed by the authors. The influence of driving mode, accelerator pedal position and regenerative braking intensity was analysed. The results showed that the selected driving mode significantly affects the acceleration characteristics only at intermediate accelerator pedal positions, whereas identical maximum performance is obtained with the accelerator pedal fully depressed. The energy required to accelerate the vehicle to 90 km/h remained nearly constant under most operating conditions, indicating high electric powertrain efficiency. During coasting, regenerative braking recovered up to 50% of the energy previously required for acceleration. The obtained results provide valuable experimental data for the validation of vehicle dynamics and energy consumption models and support the development of more efficient electric vehicle control strategies.
Keywords:
battery electric vehicle
; longitudinal dynamics
; acceleration
; regenerative braking
; energy consumption
; energy recovery
; coast-down
1. Introduction
Nowadays, the electrification of road transport has become one of the main directions of automotive development, aimed at reducing greenhouse gas emissions and local air pollution. Electric vehicles differ from conventional vehicles equipped with internal combustion engines not only in terms of the energy source but also in their dynamic characteristics. The high torque of an electric machine, available from very low rotational speeds, together with the different mass distribution resulting from the location of the traction battery, significantly affects the vehicle traction performance and energy consumption [1,2]. Understanding these relationships is important both for vehicle design and for the assessment of real energy consumption under operating conditions.
One of the parameters fundamentally affecting vehicle dynamics is the position of the centre of gravity. It determines the distribution of axle loads and, consequently, the maximum tractive force available during vehicle acceleration, the tendency to unload the driven axle, as well as vehicle stability during braking and cornering [3]. In electric vehicles, the traction battery usually constitutes a considerable part of the total vehicle mass and is located low in the vehicle floor. As a result, the centre of gravity is lower than in conventional vehicles, which improves vehicle stability but simultaneously changes the conditions of power transmission. Nevertheless, in many studies the centre of gravity position is assumed based on estimated or catalogue data, which may lead to discrepancies between simulation results and the actual vehicle behaviour.
Various methods for determining the vehicle centre of gravity have been widely described in the literature. They are mainly based on measuring axle loads on a level surface and under controlled vehicle inclination, making it possible to determine not only the longitudinal position but also the height of the centre of gravity [4,5]. At the same time, mathematical models of vehicle motion, including rolling resistance, aerodynamic drag and inertial resistance, have been developed for predicting vehicle power demand and energy consumption [6,7]. Vehicle acceleration is of particular importance because the instantaneous power demand reaches its maximum during this phase, while the energy required for acceleration significantly affects the total energy consumption in a driving cycle [8]. The energy consumption during acceleration depends not only on the characteristics of the propulsion system but also on the conditions of tractive force transmission, which are directly influenced by the centre of gravity position. Therefore, the accuracy of vehicle energy models strongly depends on the quality of the input data, including correctly determined vehicle mass parameters.
In recent years, considerable attention has been paid to the development of mathematical models for predicting the energy consumption of electric vehicles. These models are based on the longitudinal dynamics of the vehicle, taking into account inertial forces, rolling resistance, aerodynamic drag, and the characteristics of the electric powertrain. Numerous studies have shown that the prediction accuracy strongly depends on the correctness of the adopted vehicle parameters and the actual vehicle speed and acceleration profiles [9,10,11]. At the same time, increasing attention has been paid to the validation of such models using experimental data obtained from road tests of production electric vehicles. Despite the considerable progress achieved in this field, relatively few studies simultaneously investigate the influence of vehicle mass parameters, particularly the centre of gravity position, on both acceleration characteristics and the energy consumption of the acceleration process.
Although numerous publications have addressed vehicle acceleration, electric vehicle energy consumption and methods for determining the centre of gravity separately, relatively few studies combine these aspects within a single comprehensive experimental investigation performed on a commercially available electric vehicle. In particular, there is a lack of studies relating the experimentally determined centre of gravity position to measured acceleration characteristics and the energy consumption of the acceleration process, followed by a comparison of the obtained results with predictions of a mathematical model. Filling this research gap is of practical importance because it allows the influence of model simplifications on the prediction accuracy of vehicle dynamics and energy consumption to be assessed.
For electric vehicles, the acceleration process is of particular importance because the high torque of the electric machine, available immediately after vehicle launch, means that the maximum acceleration may be limited not by the propulsion system itself but by the available tyre-road adhesion [12,13]. In front-wheel-drive electric vehicles, this phenomenon is additionally associated with unloading of the driven axle during acceleration. Consequently, accurate determination of the centre of gravity position is important not only for assessing vehicle stability but also for estimating the maximum achievable acceleration and the corresponding energy characteristics of the acceleration process. Although these issues are well established in vehicle dynamics theory, they are relatively rarely verified experimentally using modern production electric vehicles.
The aim of this study is to experimentally determine the acceleration characteristics, vehicle acceleration and energy consumption during acceleration of a 2024 Kia Niro EV, together with the determination of its centre of gravity position and the analysis of the relationship between this parameter, vehicle dynamics and energy consumption. The scope of the study includes laboratory measurements of the vehicle centre of gravity and road tests under acceleration. Considering the rapid development of electric mobility and the identified research gap, the presented study constitutes the first stage of a broader research programme devoted to the Kia Niro EV.
2. Materials and Methods
2.1. Test Vehicle
Experimental investigations were carried out using a second-generation 2024 Kia Niro EV. The vehicle belongs to the compact crossover segment and is equipped with a battery electric powertrain.
The vehicle is driven by the front axle through a single three-phase permanent magnet synchronous machine (PMSM). The electric motor delivers a maximum power of 150 kW and a maximum torque of 255 N·m. Its traction characteristic consists of a constant torque region of 255 N·m within the rotational speed range from 0 to 6000 rpm, followed by a constant power region of 150 kW between 6000 and 9000 rpm. The drive torque is transmitted to the front wheels through a single-speed reduction gearbox with a fixed gear ratio of 10.65:1 [14]. This characteristic is typical of electric powertrains, providing maximum torque from standstill, which is particularly important for the acceleration performance analysed in the present study.
The vehicle is powered by a lithium-ion (Li-ion) traction battery with a usable energy capacity of 64.8 kWh (180.9 Ah) and a nominal voltage of 358 V, corresponding to a 400 V electrical architecture [9]. The battery pack weighs 443 kg, while its pack-level energy density is 146.3 Wh/kg. The vehicle supports AC charging with a maximum power of 11 kW via the onboard charger, as well as DC fast charging. Under DC charging conditions, the battery can be charged from its initial state to 80% state of charge (SOC) in approximately 43 min using a 350 kW charger and in approximately 45 min using a 100 kW charger. According to the WLTP procedure, the declared driving range is 460 km [15], whereas the EPA rating specifies a range of 253 miles (approximately 407 km) [14].
The vehicle body is characterised by a relatively low aerodynamic drag coefficient of Cd = 0.29, achieved, among others, by the application of integrated rear-side air guides (“Aero Blade”) [16]. The frontal area of the investigated vehicle is 2.63 m2 [17]. The vehicle is equipped with 215/55 R17 tyres mounted on 7.0J × 17 rims [14]. The vehicle curb weight, axle load distribution and the position of the centre of gravity were determined experimentally as part of the laboratory investigations presented in this study, whereas the remaining vehicle parameters were adopted from the manufacturer’s technical specifications.

Table 1.
Main technical specifications of the investigated Kia Niro EV (SG2, 2024) [14].
Table 1.
Main technical specifications of the investigated Kia Niro EV (SG2, 2024) [14].
| Parameter | Value | Unit |
| Drivetrain configuration | FWD | — |
| Electric motor type | Three-phase PMSM | — |
| Maximum power | 150 | kW |
| Maximum torque | 255 | Nm |
| Constant torque operating range | 0–6000 | rpm |
| Constant power operating range | 6000–9000 | rpm |
| Final drive ratio | 10.65:1 | — |
| Battery type | Li-Ion | — |
| Usable battery capacity | 64.8 (180.9) | kWh (Ah) |
| Nominal battery voltage | 358 | V |
| Battery pack mass | 443 | kg |
| Maximum AC charging power | 11 | kW |
| Aerodynamic drag coefficient (Cd) | 0.29 | — |
| Frontal area | 2.63 | m2 |
| Tyre size | 215/55 R17 | — |
| Curb weight | 1723 | kg |
| Gross vehicle weight rating | 2170 | kg |
| Overall length | 4420 | mm |
| Overall width | 1824 | mm |
| Overall height | 1570 | mm |
| Wheelbase | 2718 | mm |
| Front/rear track width | 1572 / 1580 | mm |
| Acceleration (0–100 km/h) | 7.8 | s |
| Maximum speed | 167 | km/h |
| WLTP driving range | 460 | km |
2.2. Instrumentation and Experimental Setup
Vehicle motion parameters during the road tests were recorded using an OXTS RT2500 integrated inertial navigation system supported by satellite positioning (Oxford Technical Solutions Ltd., UK) [18]. The device integrates a microelectromechanical system (MEMS)-based inertial measurement unit (IMU), consisting of three-axis gyroscopes and accelerometers, a GNSS receiver, internal data storage and a real-time processing unit within a single housing. The tightly coupled GNSS/INS integration enables continuous, low-latency measurements of vehicle position, velocity, acceleration and spatial orientation, even under conditions of temporarily degraded satellite signal availability [18].
The system records data at sampling frequencies of up to 100 Hz, providing sufficient temporal resolution for the analysis of vehicle acceleration dynamics. Acceleration measurements are performed using accelerometers with a measurement range of ±10 g, whereas vehicle speed and travelled distance are determined using the integrated GNSS/INS solution. The high accuracy of vehicle speed measurements (0.1 km/h RMS) is particularly important for the reliable determination of the acceleration characteristics. All measurement data were stored in the internal memory of the device and subsequently processed using the manufacturer’s NAVsuite software package. The main metrological specifications of the measurement system are summarised in Table 2.
Vehicle operating parameters were acquired via the CAN bus through the EOBD diagnostic connector. The following signals were recorded: brake pedal position, mm, vehicle speed, km/h, drive motor speed, rpm, battery current, A, battery voltage, V, battery State of Charge, %, accelerator pedal position, % and drive motor torque, Nm. This set of signals includes both driver inputs (accelerator and brake pedal positions), the response of the electric powertrain (motor torque and rotational speed), and the electrical quantities required to determine the energy consumption during vehicle acceleration (battery current and voltage).
The recorded signals were not available as standard EOBD diagnostic parameters (PIDs) but were transmitted using manufacturer-specific CAN frames. Since neither the message identifiers nor the signal encoding are publicly documented, they were identified and decoded by the authors specifically for the purposes of the present study. Multi-frame messages were decoded in accordance with the ISO-TP transport protocol (ISO 15765-2) [19].
A dedicated software application, named Dual CAN-Bus Logger, was developed in Python for data acquisition. The software enables simultaneous acquisition of data from two independent CAN buses using a common and constant time base. The first CAN bus was used to acquire vehicle operating parameters available via the EOBD connector, whereas the second bus collected data transmitted by the OXTS RT2500 measurement system. This approach allows synchronous recording of signals from both sources into a single data file, eliminating the need for subsequent time synchronisation of separate datasets. Communication with the CAN buses was implemented using PCAN-USB and SLCAN interfaces, while the assignment of individual interfaces to the respective CAN buses can be configured by the user within the software.
All signals, both from the vehicle and the OXTS RT2500 system, were sampled at a constant frequency of 10 Hz. This sampling frequency results from the limitations of data acquisition through the EOBD diagnostic connector, which operates according to the request–response communication model. For each parameter, the software transmits a request and waits for the corresponding response from the vehicle controller. In the case of multi-frame messages (ISO-TP), each transaction additionally includes flow-control and consecutive data frames. Consequently, the sequential interrogation of the complete set of recorded signals, together with the response time of the vehicle controllers, determines the maximum achievable acquisition frequency. Under the conditions of the present study, a sampling frequency of 10 Hz ensured stable and repeatable acquisition of all signals without frame losses or communication delays while maintaining a common and constant time base. This temporal resolution is fully sufficient for analysing vehicle acceleration dynamics, whose characteristic duration (of the order of several seconds) is approximately one order of magnitude longer than the sampling interval. The acquired data were automatically stored in CSV format. The graphical user interface of the developed software is presented in Figure 1, whereas the block diagram of the measurement system is shown in Figure 2.
2.3. Determining the Centre of Gravity
The position of the centre of gravity between the vehicle axles was determined by measuring the normal reactions of the front and rear axle wheels, using the known formulas:
where:
– distances of the centre of gravity from the front and rear axle,
– wheelbase,
– vehicle gravity force,
, – normal reactions of the front and rear axle.
The tests were performed using WWSB3T electronic scales (Dini Argeo) with a measurement accuracy of ±1 kg. The height of the centre of gravity was determined by measuring the change in the normal reaction of the rear axle wheels due to the body tilt, according to the diagram presented in Figure 3.
Based on the moment equilibrium equation about the front axle, the required height () can be determined from the relationship:
where:
– normal force of the rear axle wheels for the body angled at ,
– wheel radius.
Figure 4 shows the method of testing the vehicle using a column lift equipped with a support platform under the front axle. To increase the accuracy of the obtained results, the measurements were carried out with the suspension deflection locked and the radial stiffness of the tires increased (increased inflation pressure). During the tests, the vehicle was tilted by an angle of 20°, which was the maximum obtainable value due to the rear overhang. Measurements were realized for three vehicle load conditions, i.e., curb weight, the vehicle with a driver, and the vehicle with a driver and three passengers. The results are presented in Table 3.
Based on the information about the exact position of the vehicle centre of gravity, it is possible to determine the extreme dynamic parameters of a car resulting from the friction conditions between drive wheels and road. The maximum acceleration of a front-wheel-drive vehicle can be expressed as [15]:
where:
– tire-road friction coefficient,
– rolling resistance coefficient.
Assuming good tire-road friction conditions (μ = 0.85), a typical rolling resistance coefficient (f = 0.015), as well as a horizontal road (α = 0), the maximum acceleration of the tested vehicle with a driver is exactly 4.0 m/s2.
2.4. Determining the Mass Moment of Inertia of the Wheel
The mass moment of inertia of the wheel was determined by the three-wire pendulum method using the formula [16]:
where:
– mass moment of inertia of the tested object with the pendulum,
– mass moment of inertia of the pendulum,
– mass moment of inertia of the tested wheel,
– mass of the tested object with the pendulum,
– oscillation period,
– distance of the wires from the pendulum axis of rotation,
– wires length.
Figure 5 shows the used test stand ( = 115 mm, = 1227 mm) and exemplary test results. The average vibration period was determined based on five tests, each lasting at least 10 full periods. The HBM B12 200 accelerometer coupled with a Spider 8 analog to digital converter was used to time measurement. Taking into account additional measurements performed for the pendulum itself, the wheel mass moment of inertia value was 1.25 kgm2, with the wheel mass of 22 kg.
2.5. Methodology of Acceleration and Energy Consumption Tests
The experimental investigations were carried out on a single, predefined test section, the route of which is presented in Figure 6. The use of the same test section for all measurement runs ensured repeatable road conditions (road profile, pavement type and surface condition) and allowed direct comparison of the results obtained for the individual test scenarios. All experiments were conducted on the same day under uniform ambient conditions (ambient temperature of 21 °C, atmospheric pressure of 1001 hPa and relative humidity of 60%), with no wind and on a dry road surface.
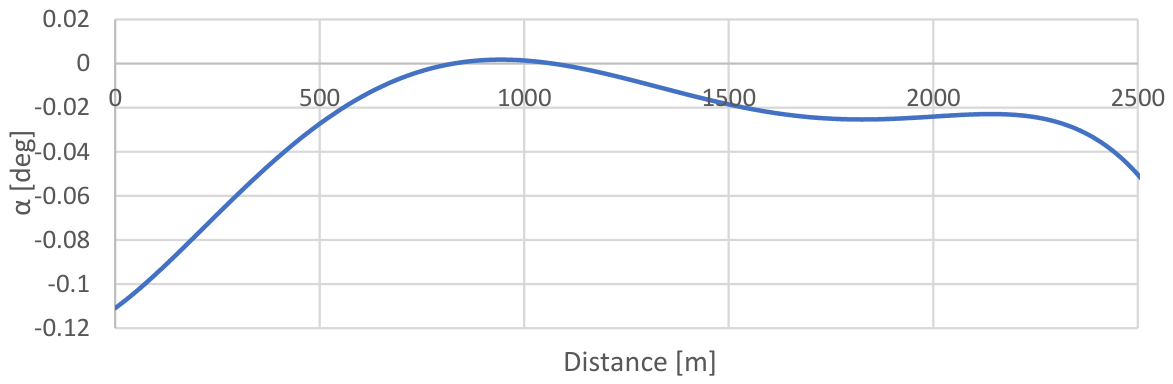
The applied measurement system enabled continuous recording of both the travelled distance and the vehicle altitude above sea level. Based on these data, the longitudinal profile of the test section was determined. Figure 7 presents the corresponding road gradient as a function of the travelled distance. As can be seen, the measurements were performed on an almost level road section characterised by a very small downhill gradient (negative values of the road inclination angle).
Figure 6.
Test track map.
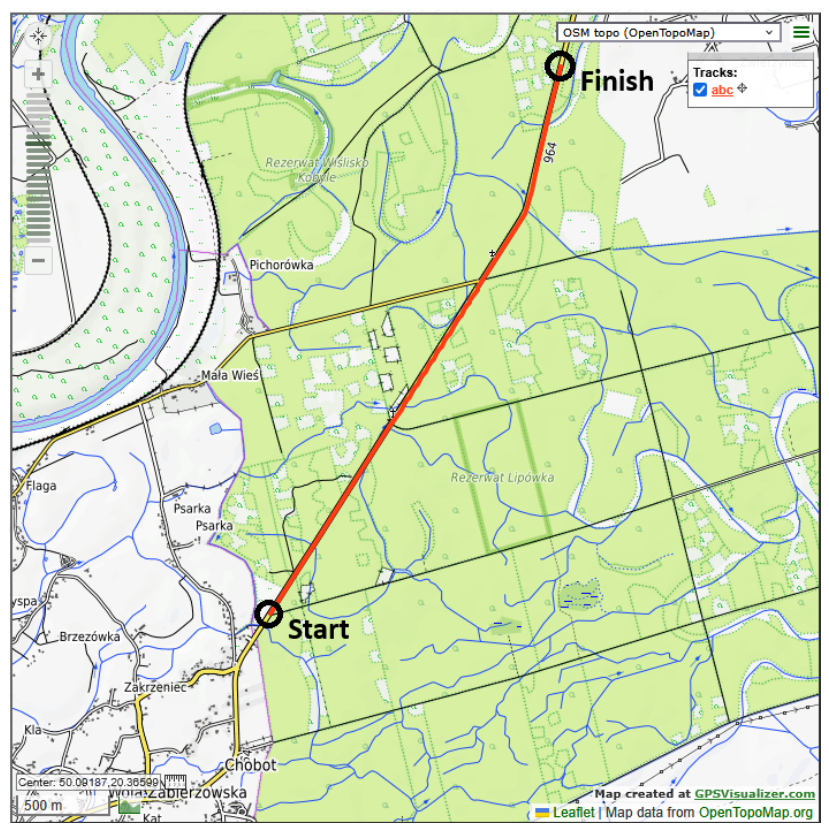
Figure 7.
Longitudinal profile of test track.
Before the measurement campaign, the traction battery was charged once to a state of charge (SOC) of 62.5%. All subsequent test runs were then performed sequentially without intermediate recharging. The battery SOC was recorded at the beginning of each test, and its decrease between consecutive runs did not exceed 2.5%. Therefore, the influence of battery state of charge on the obtained results can be considered negligible. Maintaining constant ambient temperature and road surface conditions throughout the experiments further minimised the influence of environmental factors on both the recorded acceleration characteristics and the vehicle energy balance.
Each test consisted of accelerating the vehicle while simultaneously recording the vehicle motion parameters and the electrical parameters of the propulsion system, according to the methodology described in Section 2.2 and Section 2.3. The experimental programme was divided into three test series, differing in their objectives and vehicle operating conditions.
The first test series was conducted in the Normal driving mode and consisted of five measurement runs performed with different levels of regenerative braking. The following regenerative braking settings were investigated: regeneration disabled, and levels 1, 2, 3 and 4. In addition to the acceleration characteristics, both the energy required to accelerate the vehicle and the energy recovered during vehicle deceleration were determined. The objective of this series was to evaluate the influence of regenerative braking intensity on the overall vehicle energy balance.
The second test series focused on the influence of accelerator pedal position on the longitudinal dynamic characteristics of the vehicle. The experiments were performed in three driving modes (Eco, Normal and Sport). For each driving mode, the accelerator pedal was mechanically fixed at four predefined positions corresponding to 25%, 50%, 75% and 100% of its full travel. Mechanical fixation of the accelerator pedal ensured constant and repeatable driver input throughout each test, eliminating variations resulting from manual pedal operation. The objective of this series was to determine the influence of both the accelerator pedal position and the selected driving mode on the vehicle acceleration characteristics.
The third and final test series consisted of acceleration tests performed in the Snow driving mode to investigate its influence on the longitudinal dynamics of the vehicle. Unlike the first test series, regenerative energy recovery during vehicle deceleration was not analysed. In this case, only the energy required to accelerate the vehicle was determined.
2.6. Power Balance
The paper determines the total resistance power acting on the vehicle (), taking into account air resistance (), rolling resistance (), gradient resistance (), and inertia resistance ():
The individual power values were calculated based on the following equations:
where:
– aerodynamic drag coefficient,
– projected frontal area,
– air density ( = 1.179 kg/m3),
– relative air velocity,
where:
– total vehicle mass including passengers and equipment,
where:
– vehicle acceleration,
– equivalent mass of the rotational inertia of the wheels.
Due to the typical nature of vehicle acceleration measured by the inertial measurement unit (numerous fluctuations), the acceleration obtained as a derivative of velocity was utilized in the calculations, additionally applying a 9-point Savitzky-Golay filter. Both the measured acceleration and the acceleration determined based on velocity are presented in the acceleration characteristics included in the next chapter. The analysis so far has omitted the influence of the rotating masses of the engine and the drivetrain; however, the equivalent mass resulting from the inertia of the rotating vehicle wheels was determined according to the following relationship:
The traction battery power () was calculated from the recorded electrical parameters as follows:
where:
– battery voltage,
– battery current.
Based on the recorded torque and angular velocity, the electric machine power () was determined:
where:
– electric machine torque,
– angular velocity of the electric machine.
Negative values of the battery power and the electric machine power are associated with the operation of the drivetrain in the energy recovery mode (determined by the signs of the recorded battery current and machine torque). The battery energy consumed or recovered, as well as the electric machine work, can be determined based on the known general relationship:
where:
– sampling time step of the data acquisition system.
3. Results
3.1. Vehicle Acceleration Characteristics
Figure 7, Figure 8, Figure 9, Figure 10, Figure 11, Figure 12, Figure 13, Figure 14, Figure 15, Figure 16, Figure 17, Figure 18 and Figure 19 present the experimental results together with the corresponding model predictions obtained for the vehicle acceleration process under different driving modes (Eco, Normal, Sport and Snow) and for different predefined accelerator pedal positions (25%, 50%, 75% and 100%). The Snow driving mode constitutes an exception, as the results are presented only for the fully depressed accelerator pedal (100%).
To facilitate comparison, all figures were prepared using identical vertical axis scales, while the recorded parameters are presented as a function of the distance travelled by the vehicle. Each figure simultaneously includes the following characteristics:
- vehicle speed recorded by the OXTS measurement system;
- longitudinal vehicle acceleration (X-axis) measured directly by the IMU integrated into the OXTS system;
- longitudinal vehicle acceleration (X-axis) determined as the time derivative of the vehicle speed recorded by the OXTS system and subsequently smoothed using the procedure described in Section 2.6;
- electric motor output power calculated from the vehicle CAN bus data;
- traction battery electrical power calculated from the vehicle CAN bus data;
- total resistance power determined using the calculation model described in Section 2.6.
The figures are arranged according to the accelerator pedal position. For each of the four analysed pedal positions, the results obtained in the Eco, Normal and Sport driving modes are presented consecutively. The results for the Snow driving mode are shown separately in Figure 19 at the end of Section 3.1.
Figure 7.
Vehicle acceleration characteristics in Eco mode at 25% accelerator pedal position.
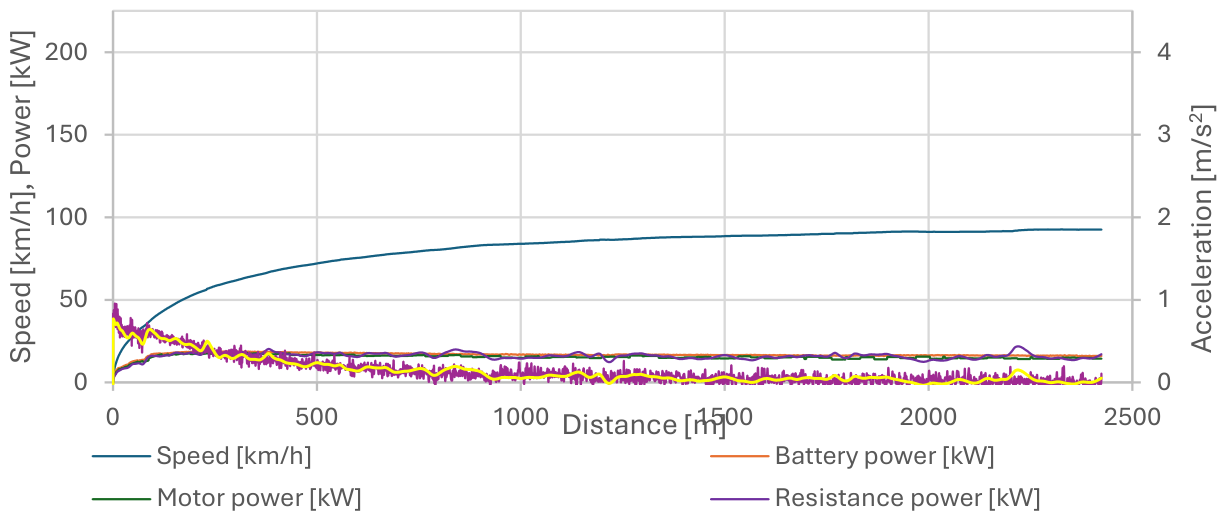
Figure 8.
Vehicle acceleration characteristics in Normal mode at 25% accelerator pedal position.
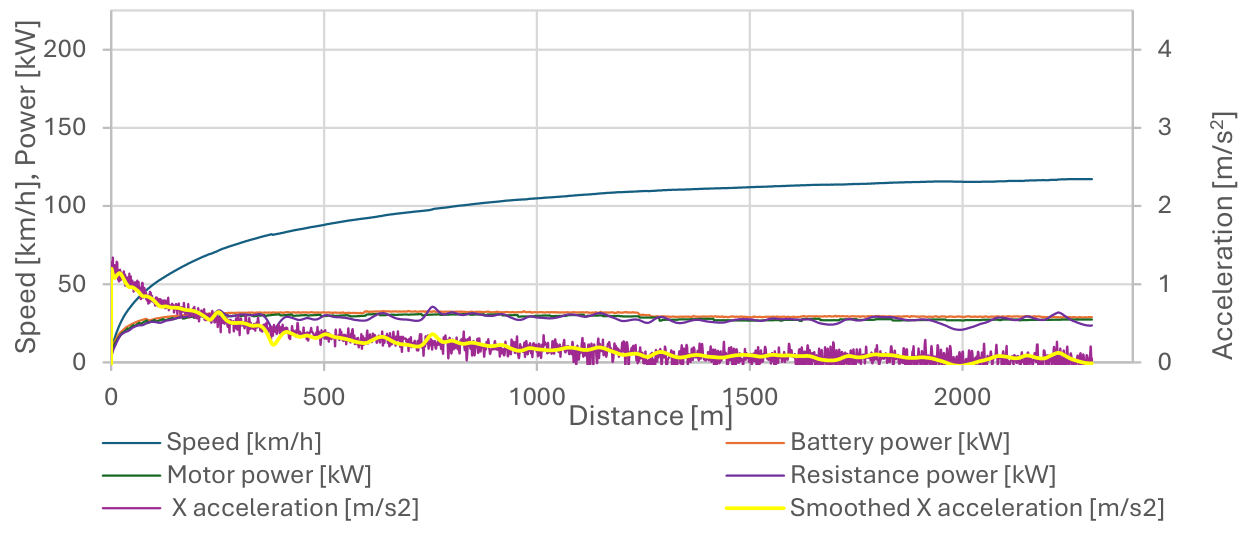
Figure 9.
Vehicle acceleration characteristics in Sport mode at 25% accelerator pedal position.
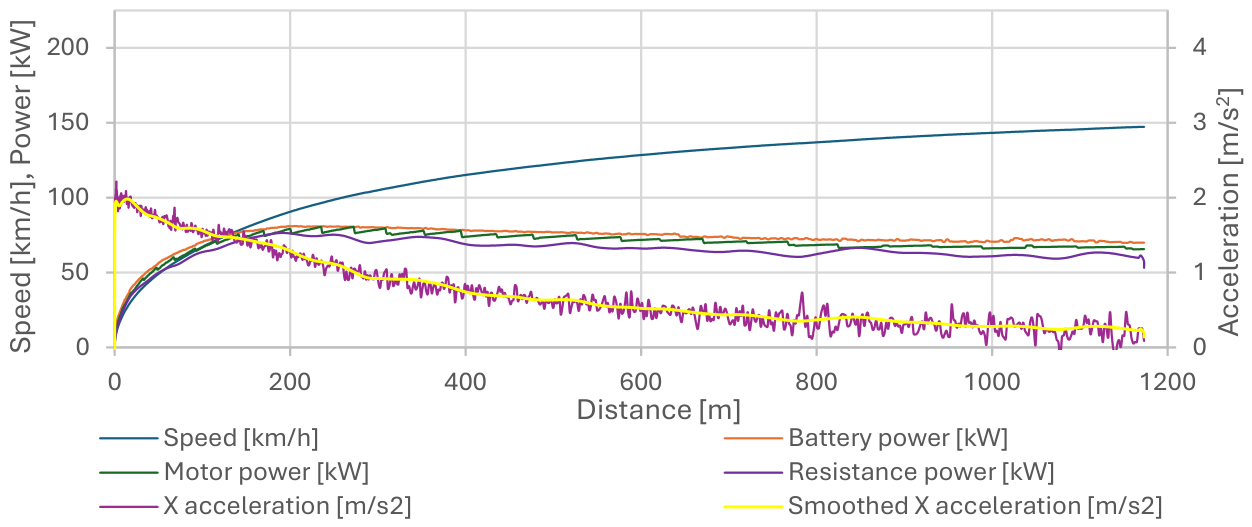
Figure 10.
Vehicle acceleration characteristics in Eco mode at 50% accelerator pedal position.
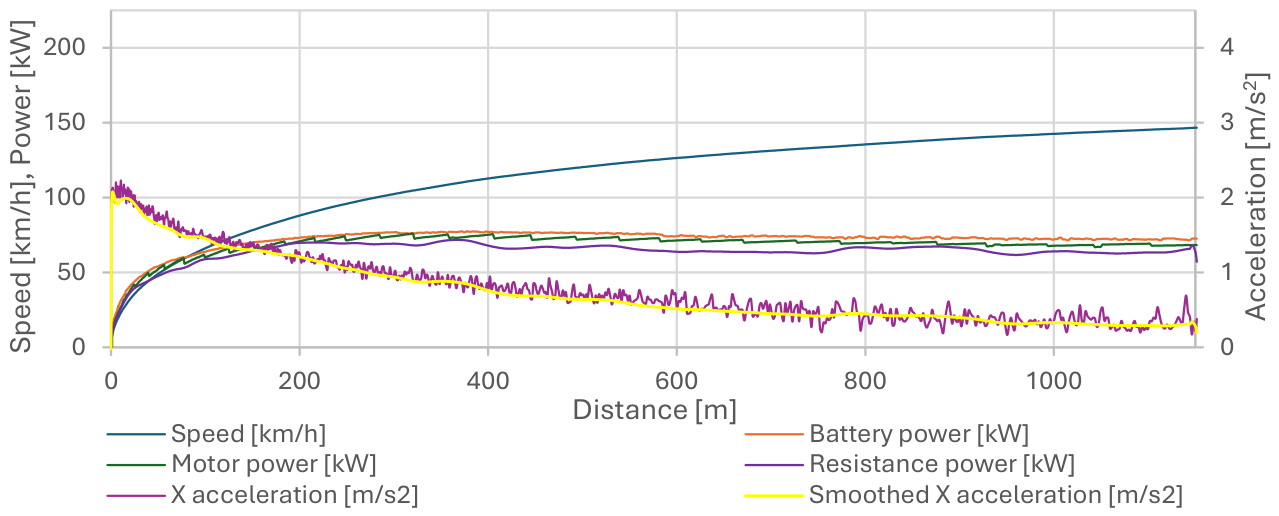
Figure 11.
Vehicle acceleration characteristics in Normal mode at 50% accelerator pedal position.
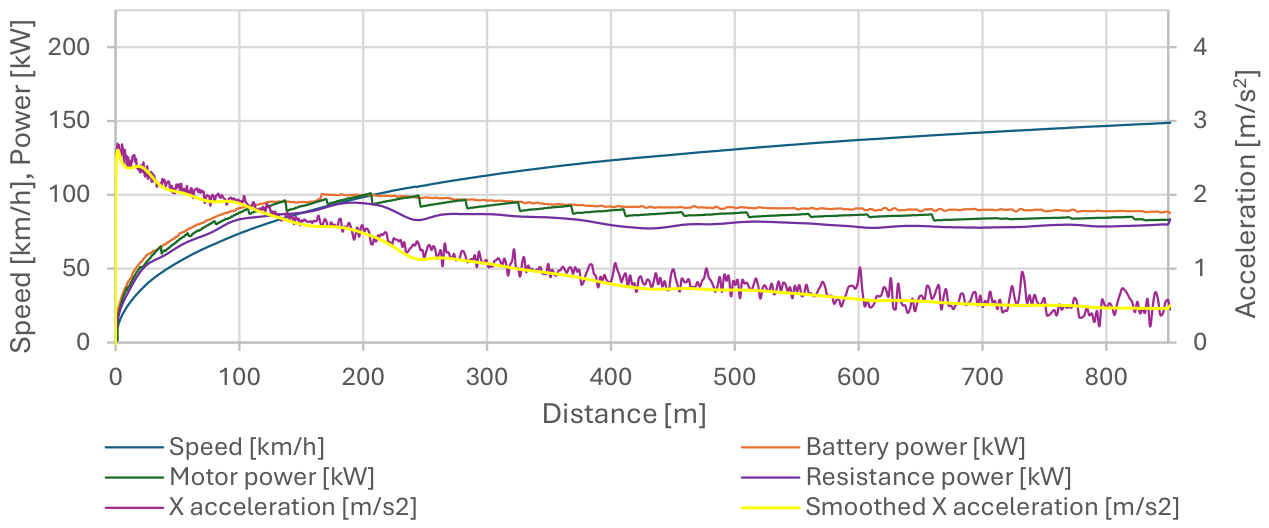
Figure 12.
Vehicle acceleration characteristics in Sport mode at 50% accelerator pedal position.
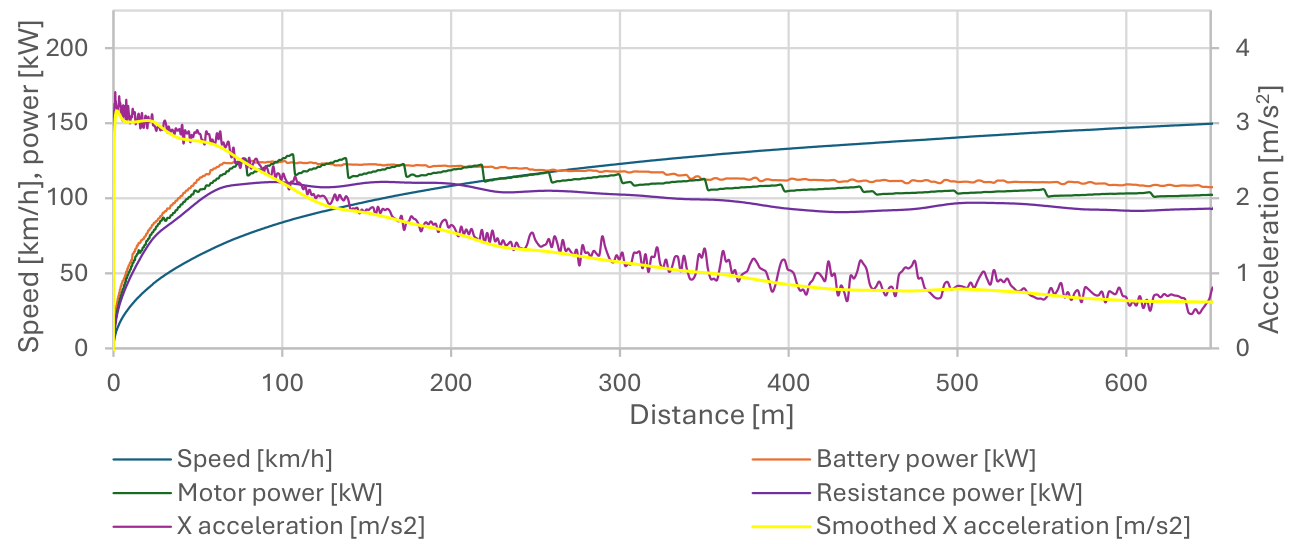
Figure 13.
Vehicle acceleration characteristics in Eco mode at 75% accelerator pedal position.
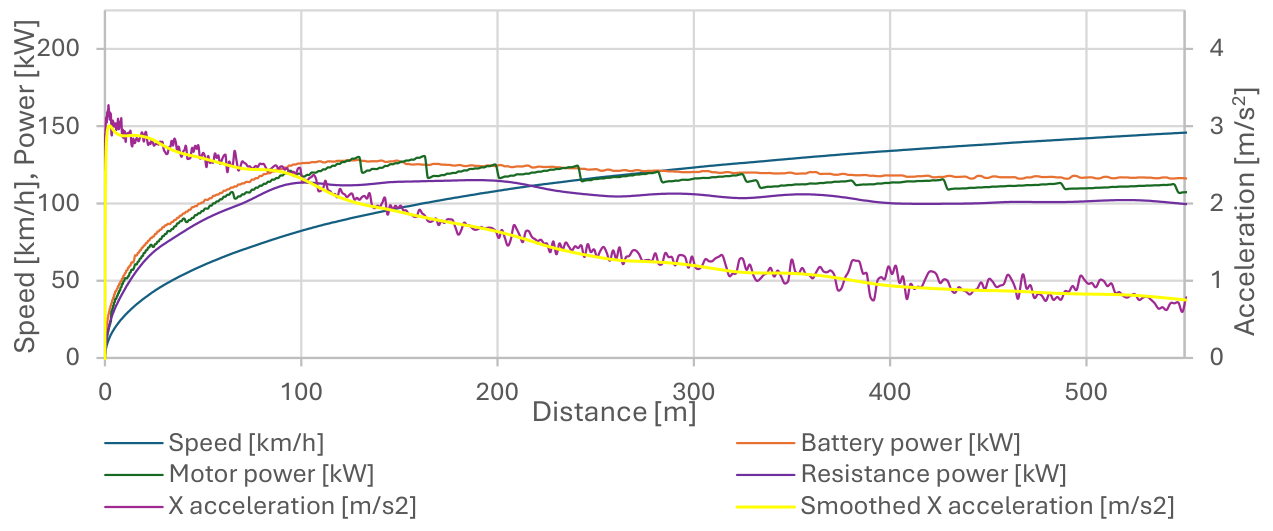
Figure 14.
Vehicle acceleration characteristics in Normal mode at 75% accelerator pedal position.
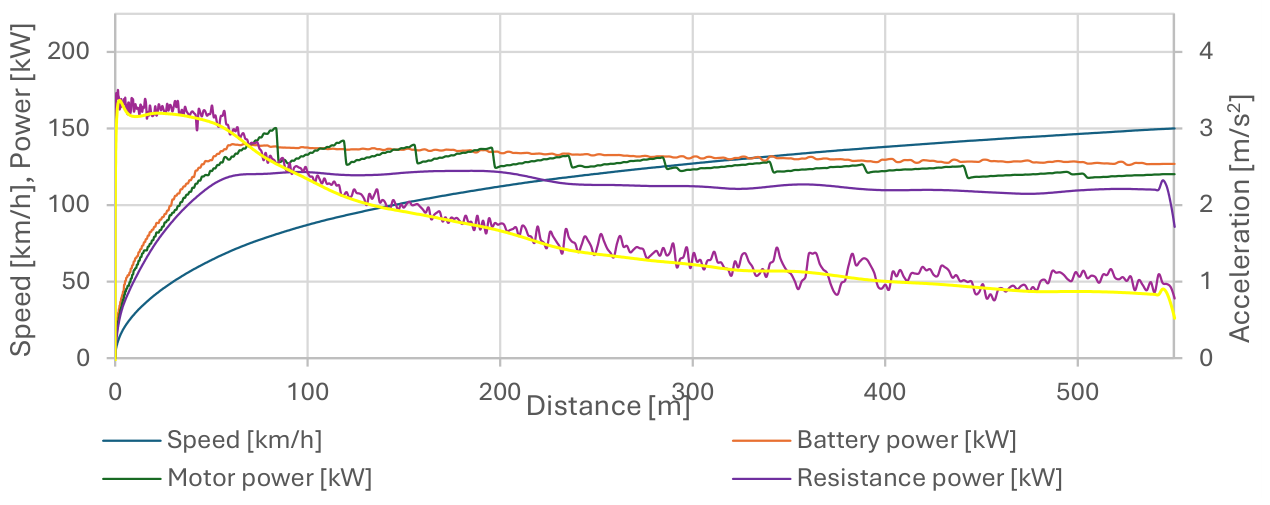
Figure 15.
Vehicle acceleration characteristics in Sport mode at 75% accelerator pedal position.
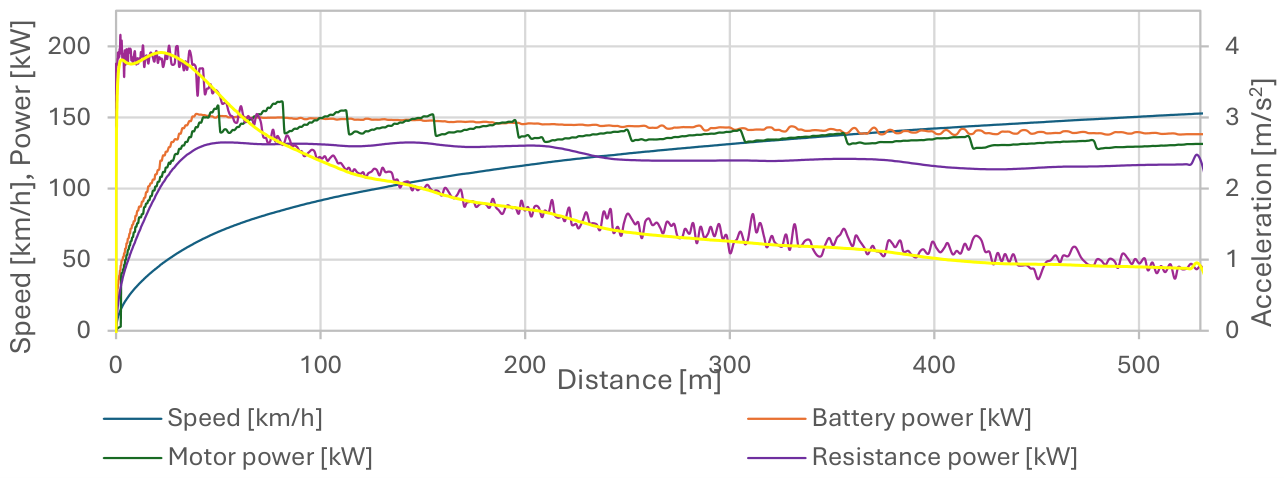
Figure 16.
Vehicle acceleration characteristics in Eco mode at 100% accelerator pedal position.
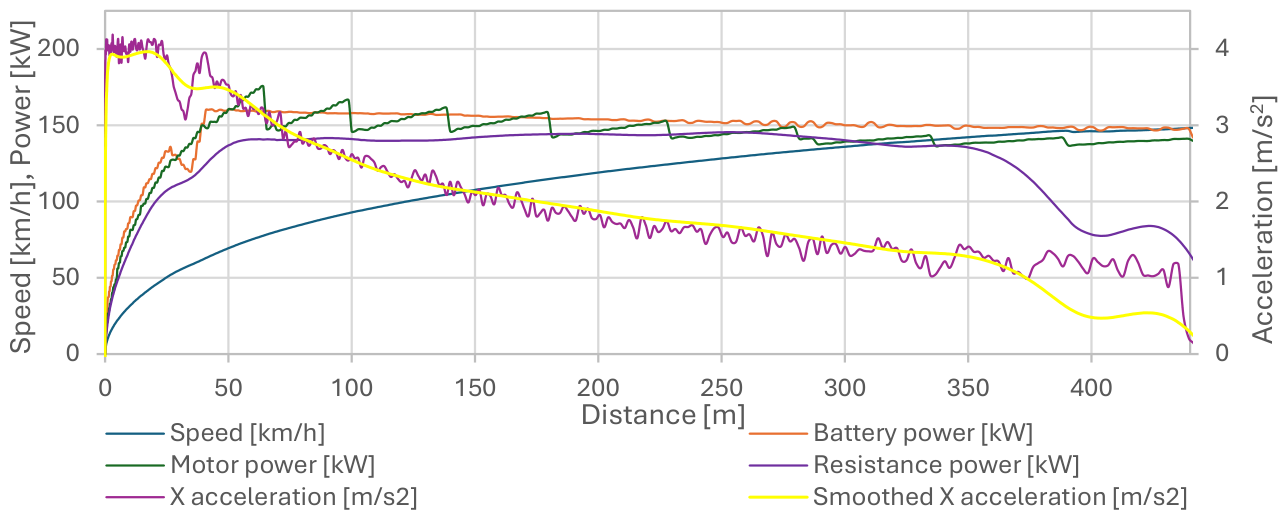
Figure 17.
Vehicle acceleration characteristics in Normal mode at 100% accelerator pedal position.
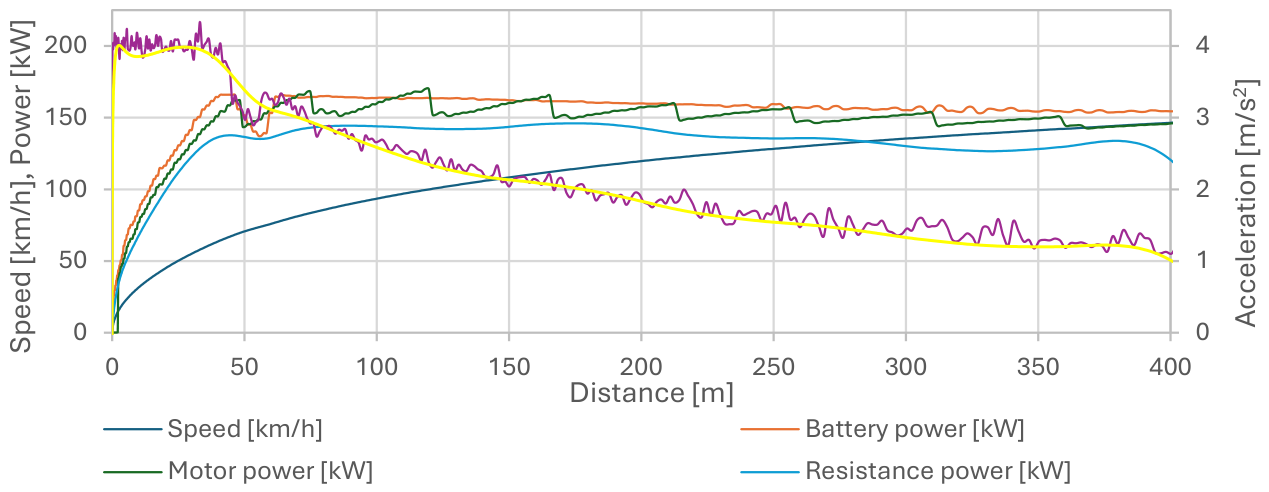
Figure 18.
Vehicle acceleration characteristics in Sport mode at 100% accelerator pedal position.
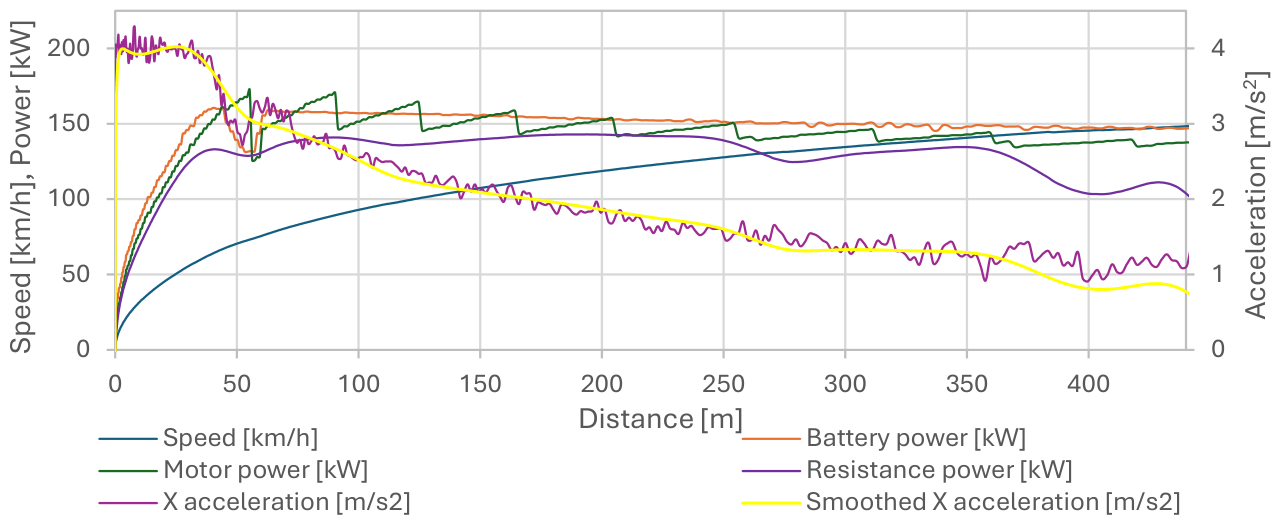
Figure 19.
Vehicle acceleration characteristics in Snow mode at 100% accelerator pedal position.
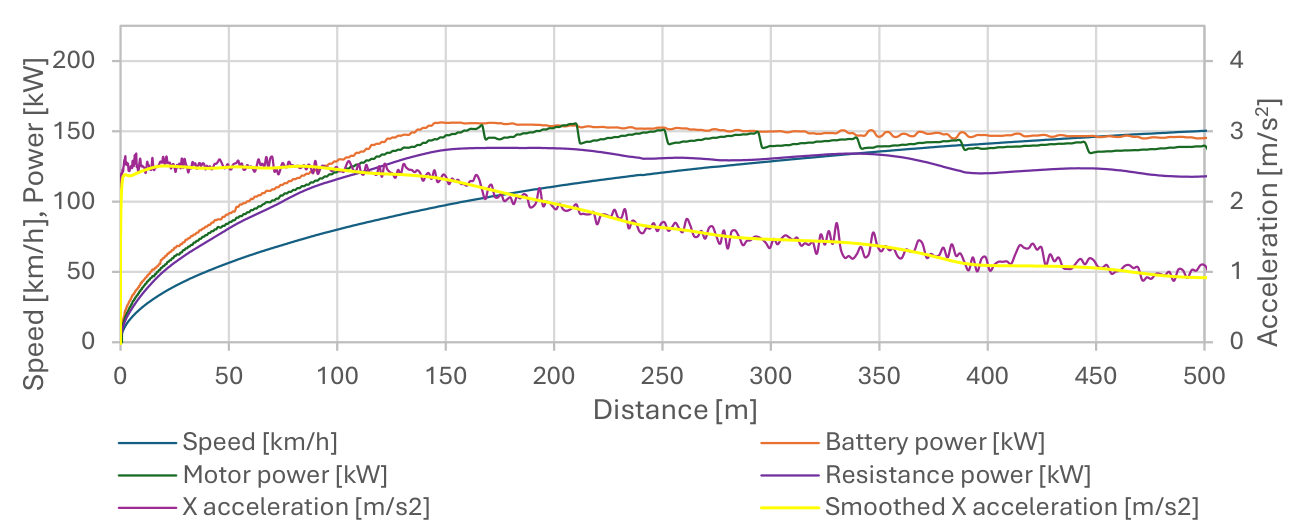
Figure 7, Figure 8 and Figure 9 present the acceleration characteristics obtained for the individual driving modes at an accelerator pedal position of 25%. A clear influence of the selected driving mode on the vehicle acceleration characteristics can be observed. As expected, the highest acceleration was recorded in Sport mode, reaching approximately 2.0 m/s2, whereas the corresponding values in Normal and Eco modes were approximately 1.0 m/s2 and 0.8 m/s2, respectively. In all cases, the maximum acceleration occurred immediately after vehicle launch and then decreased continuously in a non-linear manner with increasing vehicle speed.
The maximum test speed was not reached in either Eco or Normal mode. After travelling approximately 2000 m, the vehicle reached a speed of about 90 km/h in Eco mode and approximately 115 km/h in Normal mode. In Sport mode, the target speed of 150 km/h was achieved after travelling approximately 1200 m.
The calculated values of traction battery power, electric motor output power and total resistance power remained close throughout the acceleration process. The small differences between these quantities correspond to the expected energy conversion losses, with the battery power exceeding the motor output power, which in turn remained higher than the total resistance power. The smallest differences between the calculated power values were observed in the tests characterised by the lowest acceleration dynamics (Eco and Normal modes).
In all driving modes, the maximum power was reached after travelling approximately 200 m and subsequently remained nearly constant until the end of the test. The corresponding power levels were approximately 16 kW, 28 kW and 70 kW for the Eco, Normal and Sport modes, respectively.
The regions where the calculated total resistance power temporarily exceeds the traction battery power are solely a consequence of small speed measurement errors. These errors propagate into the acceleration determined from the differentiated speed signal and, consequently, into the calculated inertial resistance power.
Figure 10, Figure 11 and Figure 12 present the acceleration characteristics obtained for the individual driving modes at an accelerator pedal position of 50%. The same general trends as those observed for the 25% accelerator pedal position can also be identified. The highest acceleration was recorded in Sport mode, reaching approximately 3.2 m/s2, whereas the corresponding values in Normal and Eco modes were approximately 2.6 m/s2 and 2.1 m/s2, respectively. In all driving modes, the acceleration decreased non-linearly with increasing vehicle speed.
The target speed of 150 km/h was reached after travelling approximately 1200 m in Eco mode, 860 m in Normal mode and 650 m in Sport mode. The calculated values of traction battery power, electric motor output power and total resistance power remained close throughout the acceleration process, although the differences between them were more pronounced than those observed for the 25% accelerator pedal position.
The maximum power was reached after travelling approximately 150 m in the Eco and Normal modes and approximately 80 m in Sport mode. Thereafter, the power remained nearly constant until the end of the test, reaching approximately 70 kW, 90 kW and 110 kW in the Eco, Normal and Sport modes, respectively.
The electric motor power characteristics exhibit distinct step changes resulting from the resulting from the torque control strategy implemented in the motor controller.
Figure 13, Figure 14 and Figure 15 present the acceleration characteristics obtained for the individual driving modes at an accelerator pedal position of 75%. The influence of the selected driving mode on the vehicle acceleration characteristics remains clearly visible. The highest acceleration was recorded in Sport mode, reaching approximately 3.9 m/s2, whereas the corresponding values in Normal and Eco modes were approximately 3.4 m/s2 and 3.0 m/s2, respectively.
The target speed of 150 km/h was reached after travelling approximately 620 m in Eco mode, 550 m in Normal mode and 490 m in Sport mode. In both the Normal and Sport modes, a temporary plateau of the acceleration curve can be observed during the initial phase of the test. The corresponding acceleration, traction battery power and electric motor power characteristics clearly indicate two distinct operating regions of the electric powertrain. The first corresponds to acceleration at constant motor torque (constant acceleration), followed by a constant-power operating region.
The maximum power was reached after travelling approximately 100 m in Eco mode, 60 m in Normal mode and 40 m in Sport mode. Thereafter, the power remained nearly constant until the end of the test, reaching approximately 120 kW, 130 kW and 140 kW in the Eco, Normal and Sport modes, respectively.
Figure 16, Figure 17 and Figure 18 present the acceleration characteristics obtained for the individual driving modes at a fully depressed accelerator pedal (100%). In contrast to the previous cases, the selected driving mode has no influence on the vehicle acceleration characteristics. In all three driving modes, the maximum acceleration reached approximately 4.0 m/s2 and remained nearly constant over the initial 40 m of the acceleration process.
The acceleration, traction battery power and electric motor power characteristics clearly indicate two distinct operating regions of the electric powertrain. The initial phase corresponds to constant-torque operation, resulting in nearly constant vehicle acceleration, whereas the subsequent phase is characterised by constant-power operation at approximately 150 kW. In all cases, the target speed of 150 km/h was reached after travelling approximately 400 m.
Figure 19 presents the acceleration characteristics obtained in the Snow driving mode with the accelerator pedal fully depressed. In this case, the maximum acceleration reached approximately 2.5 m/s2 and remained nearly constant over the initial 150 m of the acceleration process. Thereafter, the electric motor operated in the constant-power region at approximately 150 kW, similarly to the remaining driving modes at full accelerator pedal position. The target speed of 150 km/h was reached after travelling approximately 500 m.
3.2. Vehicle Coasting Characteristics
Figure 20, Figure 21, Figure 22, Figure 23 and Figure 24 present the vehicle coasting characteristics obtained for increasing levels of regenerative braking, corresponding to regenerative braking settings from level 0 to level 4. All tests were performed in the Normal driving mode, as preliminary investigations showed that the coasting characteristics are practically independent of the selected driving mode. In contrast, the driving mode has a significant influence on the vehicle acceleration characteristics, as demonstrated in Section 3.1.
The same parameters and graphical presentation adopted for the acceleration characteristics in the previous subsection were used for the coasting characteristics presented here.
Each coasting test was initiated from an initial vehicle speed of approximately 150 km/h. A clear influence of the selected regenerative braking level on the vehicle deceleration characteristics can be observed. As expected, the highest deceleration was recorded at regenerative braking level 4, reaching approximately −2.3 m/s2. The corresponding maximum deceleration values for levels 3, 2 and 1 were approximately −1.7 m/s2, −1.1 m/s2 and −0.7 m/s2, respectively.
For all tests with regenerative braking enabled, the vehicle deceleration remained nearly constant within the speed range from approximately 140 km/h to 30 km/h. In contrast, during the coasting test performed with regenerative braking disabled (level 0), the deceleration gradually decreased from approximately −0.8 m/s2 to −0.1 m/s2.
The calculated values of traction battery power, electric motor output power and total resistance power remained close throughout the coasting process for all analysed regenerative braking levels, although noticeable differences, primarily in the electric motor power, were observed during the initial stage of regenerative braking. As expected, the power levels strongly depended on the selected regenerative braking setting. The corresponding maximum power values were approximately 120 kW, 80 kW, 50 kW and 20 kW for regenerative braking levels 4, 3, 2 and 1, respectively.
4. Discussion
Figure 25 compares the maximum vehicle acceleration obtained in the individual driving modes (Eco, Normal and Sport) for different accelerator pedal positions (25%, 50%, 75% and 100%). Regardless of the selected driving mode, the maximum acceleration achieved with the accelerator pedal fully depressed reached approximately 4.0 m/s2. This value is consistent with the theoretical maximum acceleration determined by the tyre–road adhesion limit of the driven wheels (Section 2.3).
For intermediate accelerator pedal positions, a clear increase in vehicle acceleration can be observed when switching from the Eco mode through the Normal mode to the Sport mode, reflecting the different traction torque control strategies implemented in the vehicle control system.
The energy required for vehicle acceleration was evaluated for the analysed variants with respect to the assumed target speed of 90 km/h (Figure 26) and the fixed travel distance of 400 m (Figure 27). When the target speed of 90 km/h is considered, the required energy is similar for almost all driving modes and accelerator pedal positions, amounting to approximately 0.21 kWh. The only significant exception is the Eco mode with the accelerator pedal fixed at 25%, for which the required energy exceeds this value by more than a factor of two. A moderately higher value was also recorded for the Normal mode at a 25% accelerator pedal position (approximately 0.26 kWh).
In both the Eco 25% and Normal 25% variants, the target speed of 90 km/h was reached after travelling a considerably longer distance than in the remaining test cases. This effect is particularly pronounced in the Eco 25% mode, where the required acceleration distance exceeded 1700 m.
When the energy required to reach 90 km/h is related to the travelled distance, the lowest specific energy consumption was obtained in the Eco driving mode. For each driving mode, the specific energy consumption increased with increasing accelerator pedal position, as illustrated in Figure 28.
A similar relationship can be observed in Figure 27, which presents the energy required to accelerate the vehicle over a fixed distance of 400 m. The ranking of the analysed driving modes and accelerator pedal positions remains consistent with that obtained for the specific energy consumption presented in Figure 28.
The average vehicle deceleration during the coasting tests, determined within the speed range from 140 to 30 km/h, strongly depended on the selected regenerative braking level. As shown in Figure 29, the average deceleration increased from approximately 0.3 m/s2 with regenerative braking disabled to approximately 2.3 m/s2 at the highest regenerative braking setting.
The amount of energy recovered during vehicle deceleration also increased with increasing regenerative braking intensity. At the maximum regenerative braking level, the recovered energy reached approximately 0.32 kWh within the analysed speed range. For the remaining regenerative braking settings, lower values were obtained, as summarised in Figure 30.
5. Conclusions
Based on the conducted experimental investigations and the obtained results, the following conclusions can be drawn:
- The selected driving mode (Eco, Normal and Sport) has a significant influence on the vehicle acceleration characteristics and the associated specific energy consumption (kWh/km). This effect is observed only at intermediate accelerator pedal positions. When the accelerator pedal is fully depressed (100%), the acceleration characteristics are practically identical regardless of the selected driving mode.
- Relating the specific energy consumption to the maximum vehicle acceleration shows that this indicator remains at a similar level in most of the analysed cases. Noticeably better results in terms of the energy efficiency of vehicle acceleration were obtained only for the Eco 25% and Normal 25% operating conditions.
- For the assumed target speed of 90 km/h, corresponding to the speed limit commonly applied on rural roads in many countries, the energy required to reach this speed is very similar in most analysed cases, regardless of the selected driving mode and accelerator pedal position. This behaviour results from the high and relatively uniform efficiency of the electric powertrain within the analysed operating range. Such behaviour clearly distinguishes electric vehicles from conventional vehicles equipped with internal combustion engines.
- In the Snow driving mode, vehicle acceleration is limited by a software-imposed reduction of the maximum motor torque. With the accelerator pedal fully depressed, the achieved acceleration corresponds to the theoretical acceleration limit for a vehicle travelling on wet asphalt (μ = 0.5).
- The possibility of adjusting the regenerative braking intensity during coasting significantly reduces the need for the use of the conventional friction braking system.
- Under the analysed operating conditions, the energy recovered during regenerative coasting reached approximately 50% of the energy previously required to accelerate the vehicle to the same speed. These results demonstrate the high potential of regenerative braking for reducing the overall energy demand of electric vehicles and extending their driving range, particularly under urban driving conditions.
The obtained results confirm that the energy efficiency of an electric vehicle depends not only on the characteristics of the electric powertrain itself but also on the adopted strategy for traction torque control and regenerative braking. An appropriate selection of the driving mode and regenerative braking intensity makes it possible to achieve a favourable compromise between vehicle dynamics, driving comfort and energy consumption.
The presented results provide a basis for further studies focused on the evaluation of vehicle energy efficiency under real traffic conditions. Future work will include analyses performed on different road profiles, under various traffic conditions and weather scenarios, as well as the development of adaptive control strategies that take into account route characteristics and driver preferences.
Supplementary Materials
The following supporting information can be downloaded at the website of this paper posted on Preprints.org.
Author Contributions
Conceptualization, S.K., M.S., A.K. and M.N.; methodology, M.S. and A.K.; software, M.S.; validation, M.S. and A.K.; formal analysis, S.K., M.S., A.K. and M.N.; investigation, S.K., M.S., A.K. and M.N.; resources, S.K., M.S., A.K. and M.N.; data curation, M.S. and A.K.; writing—original draft preparation, S.K., M.S., A.K. and M.N.; writing—review and editing, A.K. and M.N.; supervision, M.N.; project administration, S.K.; All authors have read and agreed to the published version of the manuscript.
Funding
This research received no external funding.
Institutional Review Board Statement
Not applicable.
Informed Consent Statement
Not applicable.
Data Availability Statement
The original contributions presented in this study are included in the article/supplementary material. Further inquiries can be directed to the corresponding author.
Acknowledgments
The electric vehicle used in the research conducted in this paper is owned by the Centre of Vocational Excellence in Forwarding at the Walery Goetel School Complex in Sucha Beskidzka and was acquired as part of Poland’s National Recovery and Resilience Plan funded by the European Commission.
Conflicts of Interest
The authors declare no conflict of interest.
Abbreviations
The following abbreviations are used in this manuscript:
| CAN | Controller Area Network |
| EOBD | European On-Board Diagnostics |
| FWD | Front Wheel Drive |
| GNSS | Global Navigation Satellite System |
| IMU | Inertial Measurement Unit |
| SOC | State of Charge |
References
- Chen, Y.; Wu, G.; Sun, R.; Dubey, A.; Laszka, A.; Pugliese, P. A Review and Outlook of Energy Consumption Estimation Models for Electric Vehicles. SAE Int. J. Sust. Trans., Energy, Env., & Policy 2021, 2(1), 79-96. [CrossRef]
- Kozłowski, E.; Wiśniowski, P.; Gis, M.; Zimakowska-Laskowska, M.; Borucka, A. Vehicle Acceleration and Speed as Factors Determining Energy Consumption in Electric Vehicles. Energies 2024, 17, 4051. [CrossRef]
- Fuerbeth, U. Centre of Gravity of Motor Vehicles. Forensic Science International 2024, 361, 112073, . [CrossRef]
- Road vehicles — Determination of centre of gravity. ISO 10392:2011. International Organization for Standardization: Geneva, Switzerland, 2011.
- Castro, F.; Melo, F.Q.d.; Faria, D.; Silva, J.; Nunes, J.; Sousa, P.J.; Vaz, M.A.P.; Moreira, P.M.G.P. An Evaluation Method to Estimate a Vehicle’s Center of Gravity During Motion Based on Acceleration Relationships. J. Exp. Theor. Anal. 2026, 4, 4. [CrossRef]
- Van Greunen, R.; Oosthuizen, C. Data Driven Methods for Finding Coefficients of Aerodynamic Drag and Rolling Resistance of Electric Vehicles. World Electr. Veh. J. 2023, 14, 134. [CrossRef]
- Micu, D.A.; Bățăuș, M.V.; Rențea, C.A.; Ancuța, A.A.; Mancaș, R. The Influence of Road Gradient Resistance on the Driving Range of Electric Vehicles. Vehicles 2026, 8, 44. [CrossRef]
- Galvin, R. Energy Consumption Effects of Speed and Acceleration in Electric Vehicles: Laboratory Case Studies and Implications for Drivers and Policymakers. Transportation Research Part D-transport and Environment 2017, 53, 234–248, . [CrossRef]
- Pielecha, I.; Pielecha, J. Simulation Analysis of Electric Vehicles Energy Consumption in Driving Tests. Maintenance and Reliability 2020, 22(1), 130–137, . [CrossRef]
- Skuza, A.; Jurecki, R.; Szumska, E. Influence of Traffic Conditions on the Energy Consumption of an Electric Vehicle. Communications – Scientific Letters of the University of Žilina 2023, 25(1), B22–B33, , . [CrossRef]
- Dominguez, S.; Garcia, G.; Hamon, A.; Frémont, V. Longitudinal Dynamics Model Identification of an Electric Car Based on Real Response Approximation. In Proceedings of the 2020 IEEE Intelligent Vehicles Symposium (IV), Las Vegas, NV, USA, 19 October–13 November 2020; pp. 398–404, . [CrossRef]
- Gillespie, T. D. Fundamentals of Vehicle Dynamics, Rev. ed.; Society of Automotive Engineers: Warrendale, USA, 2021; pp. 35-40.
- Wong, J.Y. Theory of Ground Vehicles, 5th ed.; John Wiley & Sons, Inc.: Hoboken, USA 2021; pp. 221-344.
- Available online: https://www.kiamedia.com/us/en/models/niro-ev/2024/specifications (accessed on 22.06.2026).
- Available online: https://www.kia.com/uk/new-cars/niro/specification/ (accessed on 22.06.2026).
- Available online: https://www.kiamedia.com/us/en/models/niro-ev/2023 (accessed on 22.06.2026).
- Available online: https://evkx.net/models/kia/niro/niro_ev/specifications/ (accessed on 22.06.2026).
- OXTS RT2000 Cost-effective GNSS/INS for vehicle dynamics testing technical brochure. Available online: https://www.oxts.com/software/navsuite/documentation/datasheets/RT2000_ds.pdf (accessed on: 22.06.2026).
- Road vehicles — Diagnostic communication over Controller Area Network (DoCAN) — Part 2: Transport protocol and network layer services. ISO 15765-2:2016. International Organization for Standardization: Geneva, Switzerland, 2016.
- Świder, P. Theory of Vehicles Motion – Part 1 (In Polish: Teoria ruchu samochodów cz. I), 2nd ed.; Cracow University of Technology Press: Cracow, Poland, 2017; pp. 83-91.
- Thomson, M. Determining moment of inertia using a three-wire pendulum: an in-depth tutorial. Ayden International Journal of Basic and Applied Sciences 2023, 11(2), 10-19.
Figure 1.
Graphical user interface of the Dual CAN-Bus Logger software.
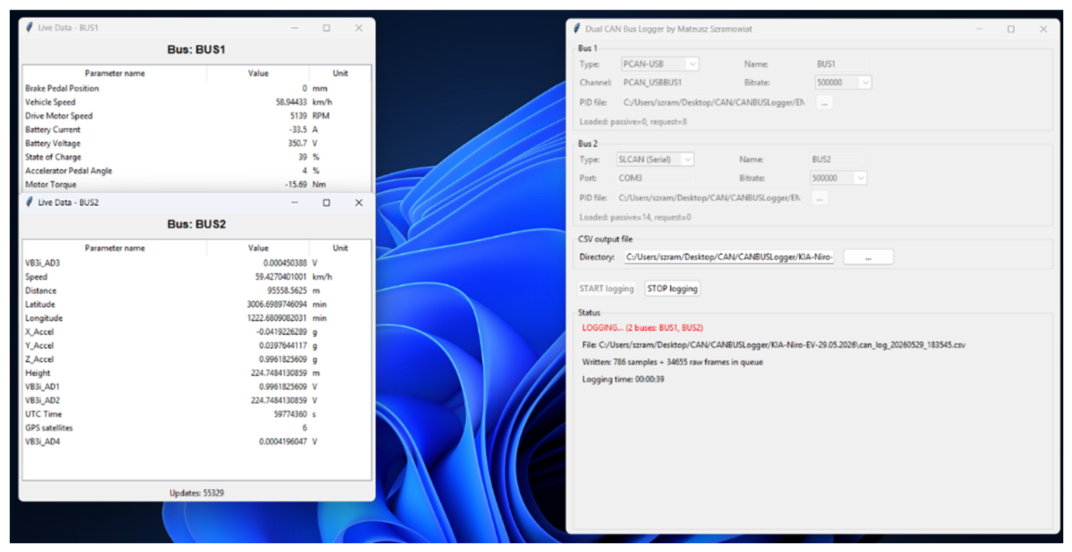
Figure 2.
Block diagram of the data acquisition system.
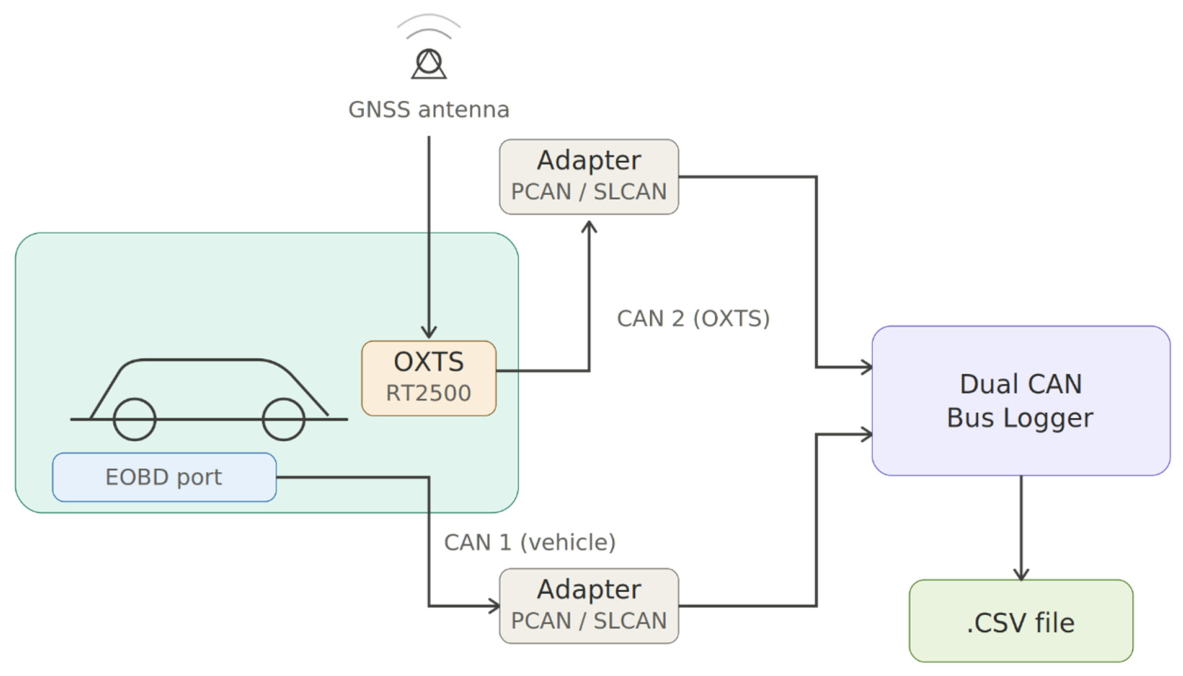
Figure 3.
Scheme of the centre of gravity height test.
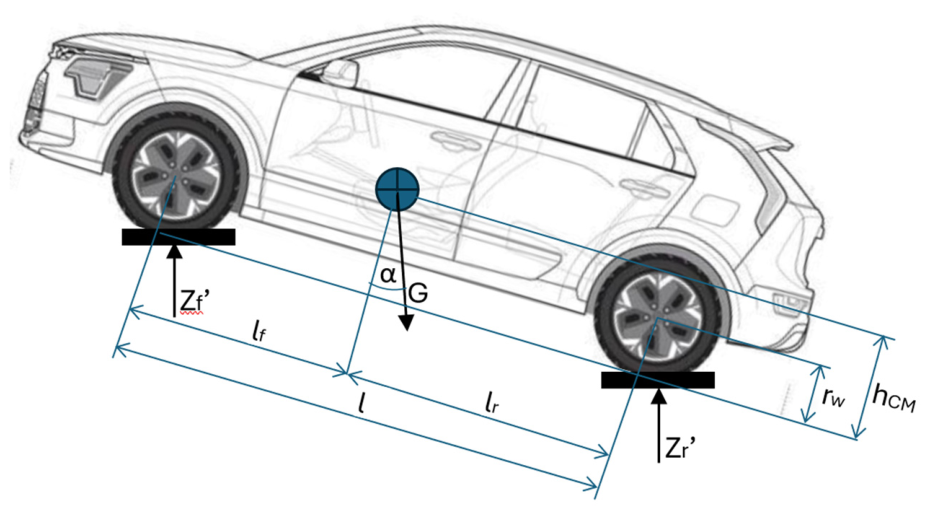
Figure 4.
Centre of gravity height test stand.
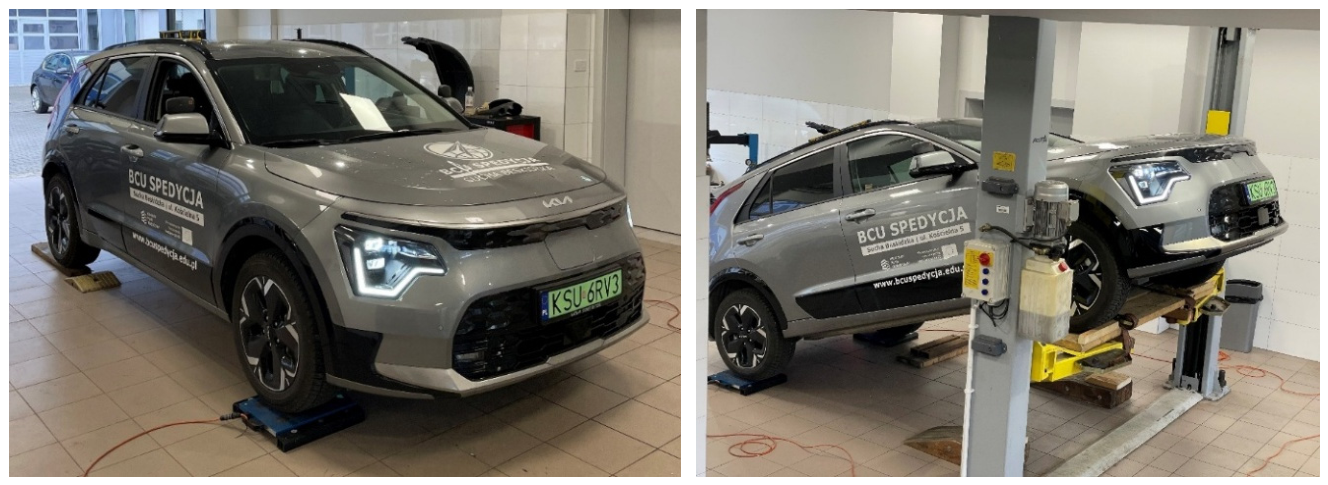
Figure 5.
Moment of inertia test stand and exemplary test results.
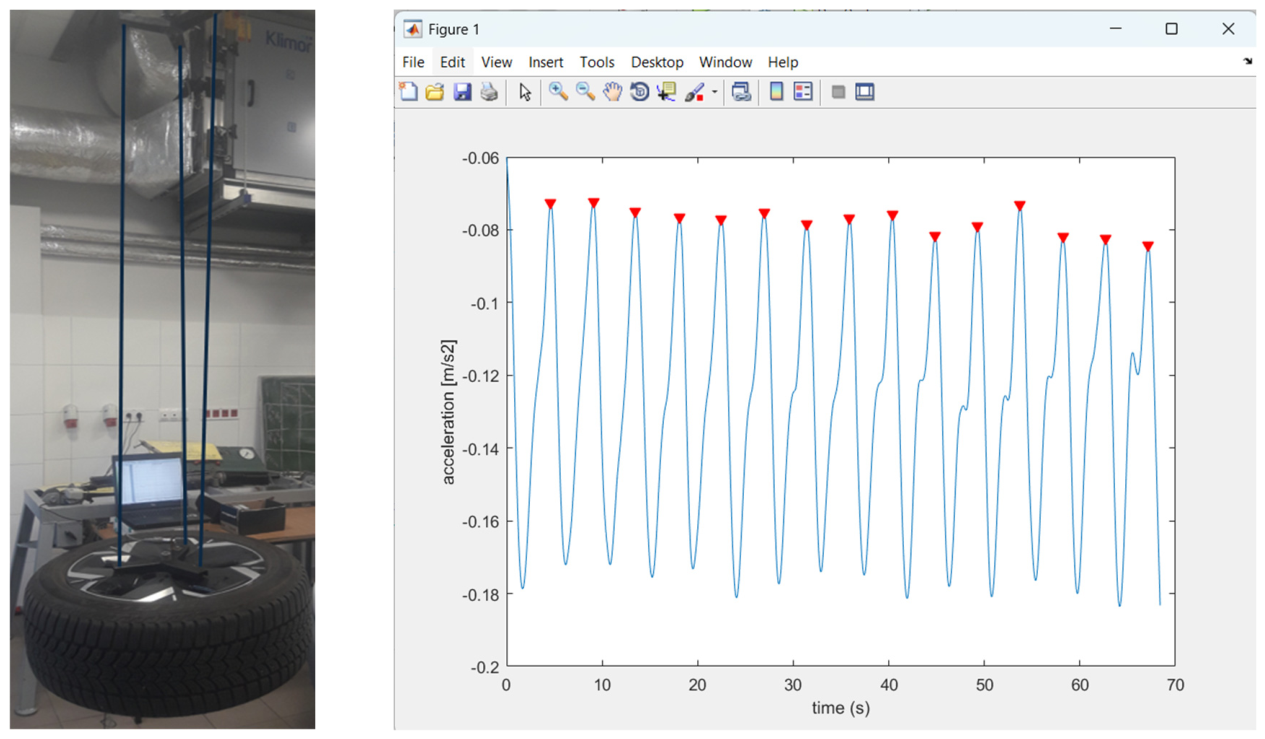
Figure 20.
Vehicle coast-down characteristics for regenerative braking level 0 (disabled).
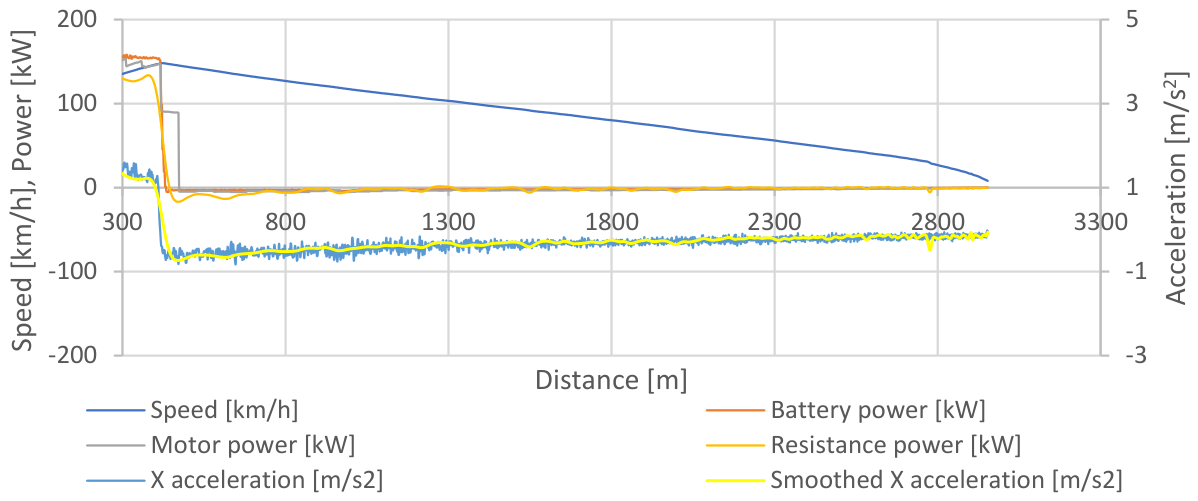
Figure 21.
Vehicle coast-down characteristics for regenerative braking level 1.
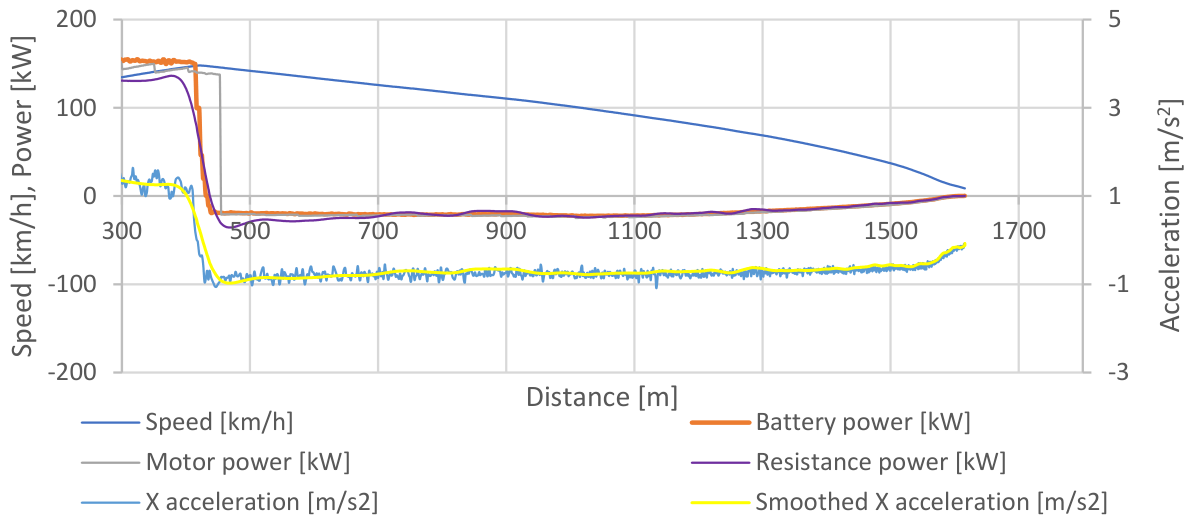
Figure 22.
Vehicle coast-down characteristics for regenerative braking level 2.
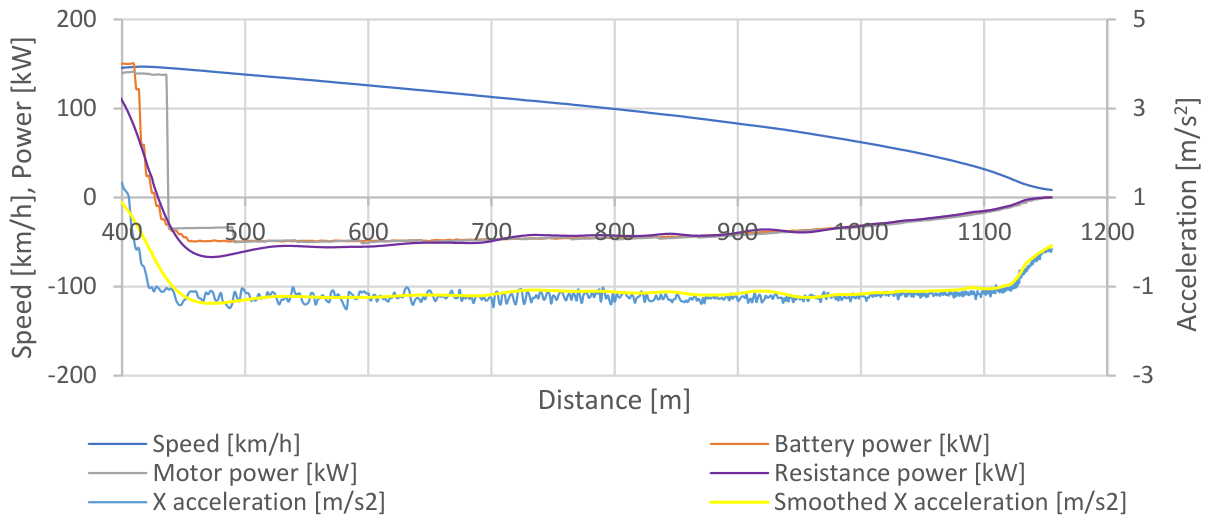
Figure 23.
Vehicle coast-down characteristics for regenerative braking level 3.
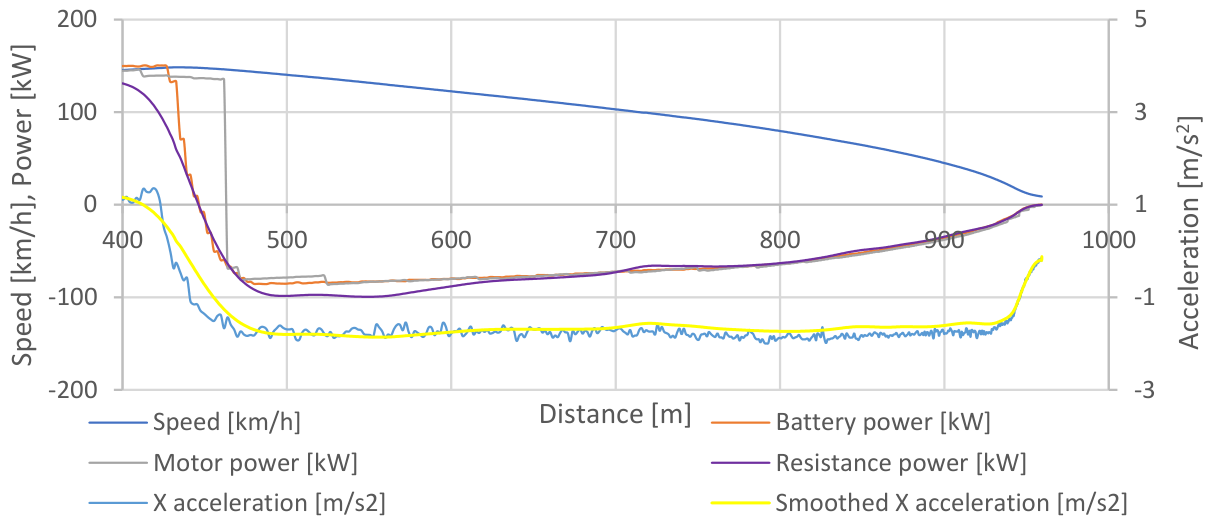
Figure 24.
Vehicle coast-down characteristics for regenerative braking level 4.
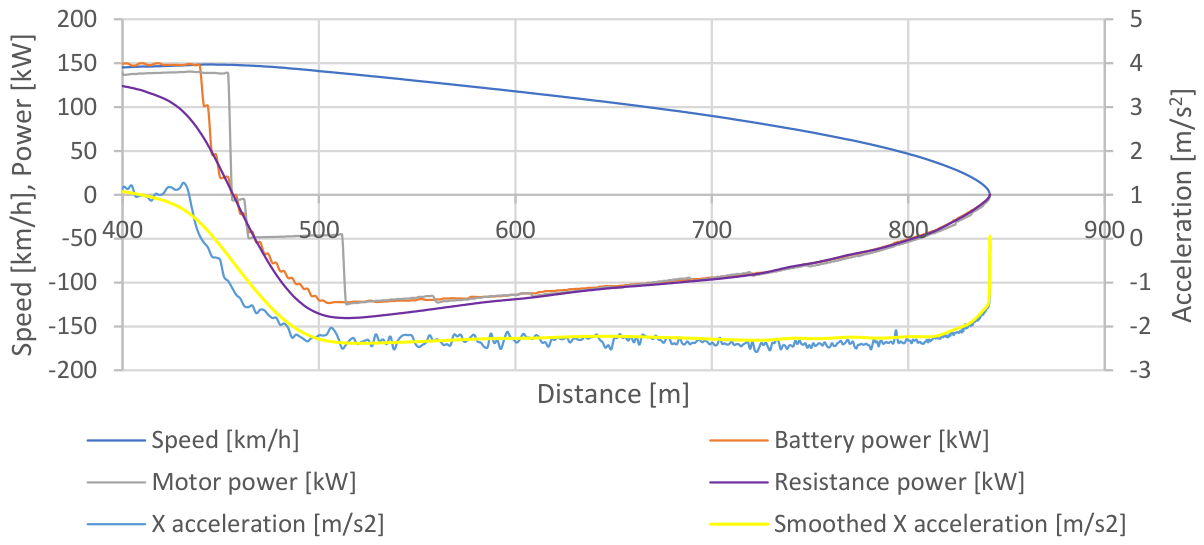
Figure 25.
Maximum vehicle acceleration in the analyzed driving modes.
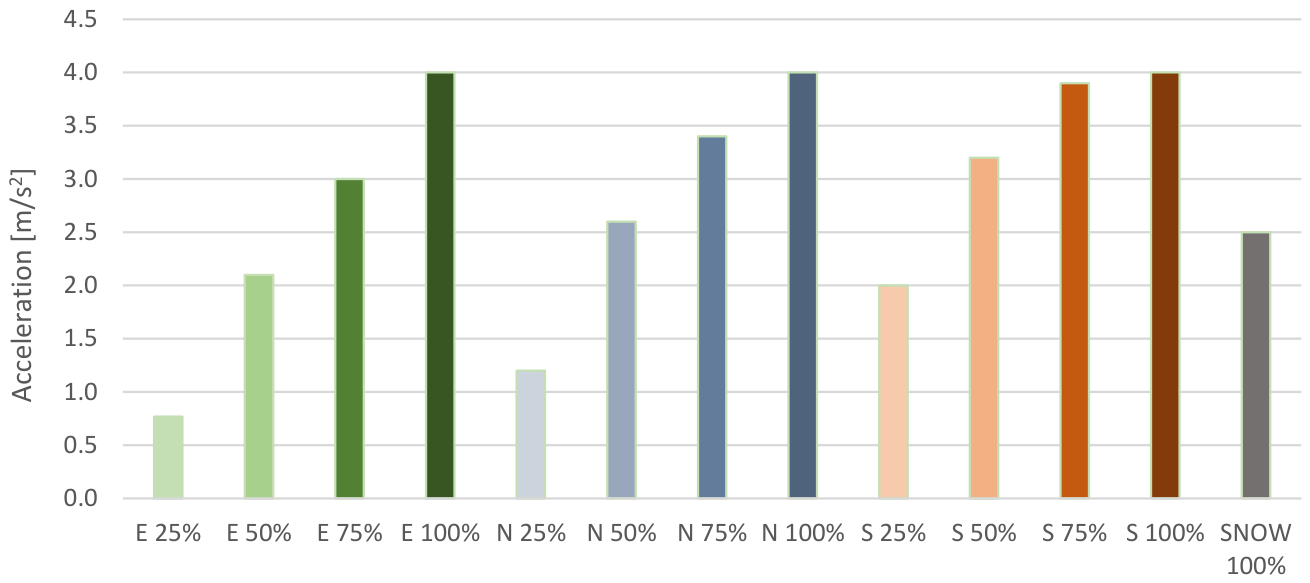
Figure 26.
Energy consumed from the battery during acceleration to 90 km/h.
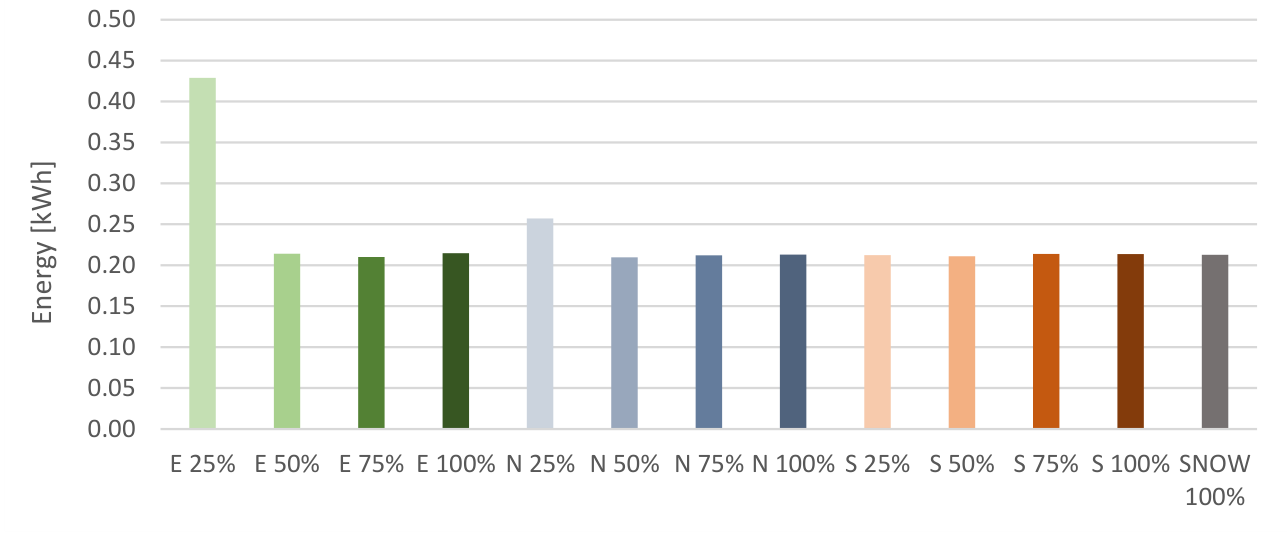
Figure 27.
Energy consumed from the battery over a distance of 0–400 m.
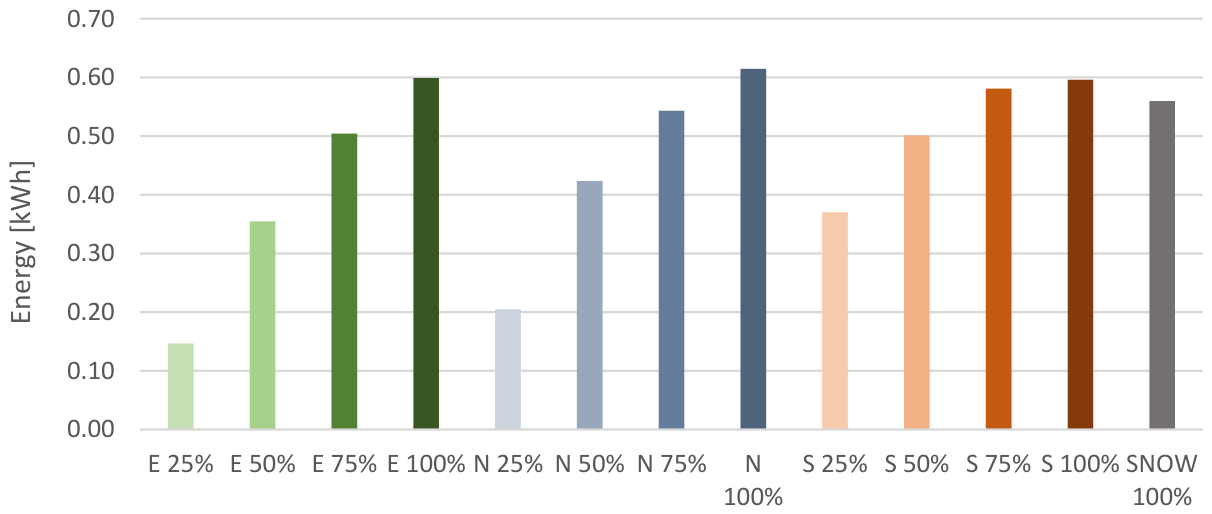
Figure 28.
Energy consumed from the battery during acceleration to 90 km/h per 1 km.
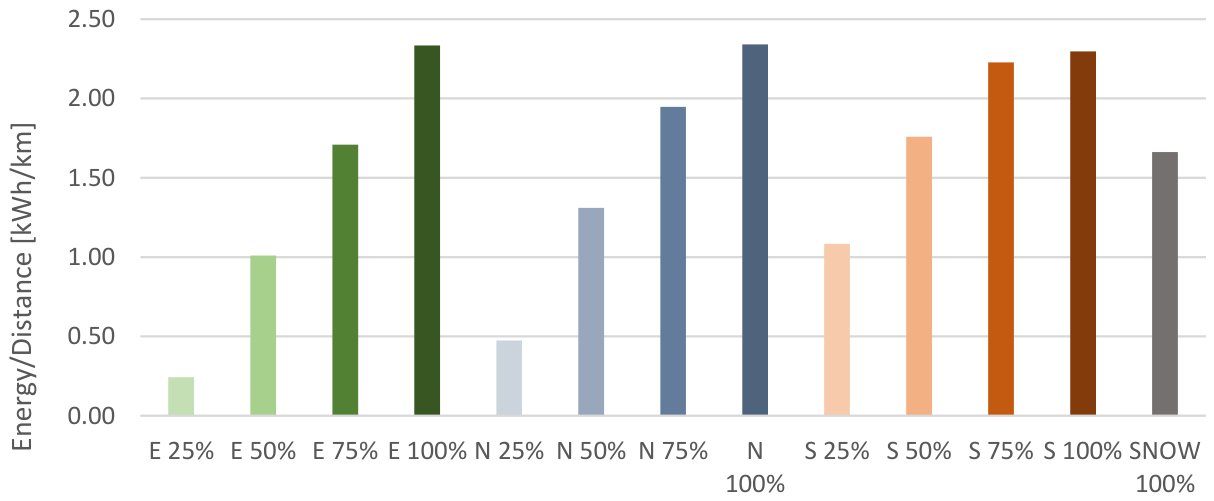
Figure 29.
Average deceleration within 140–30 km/h.
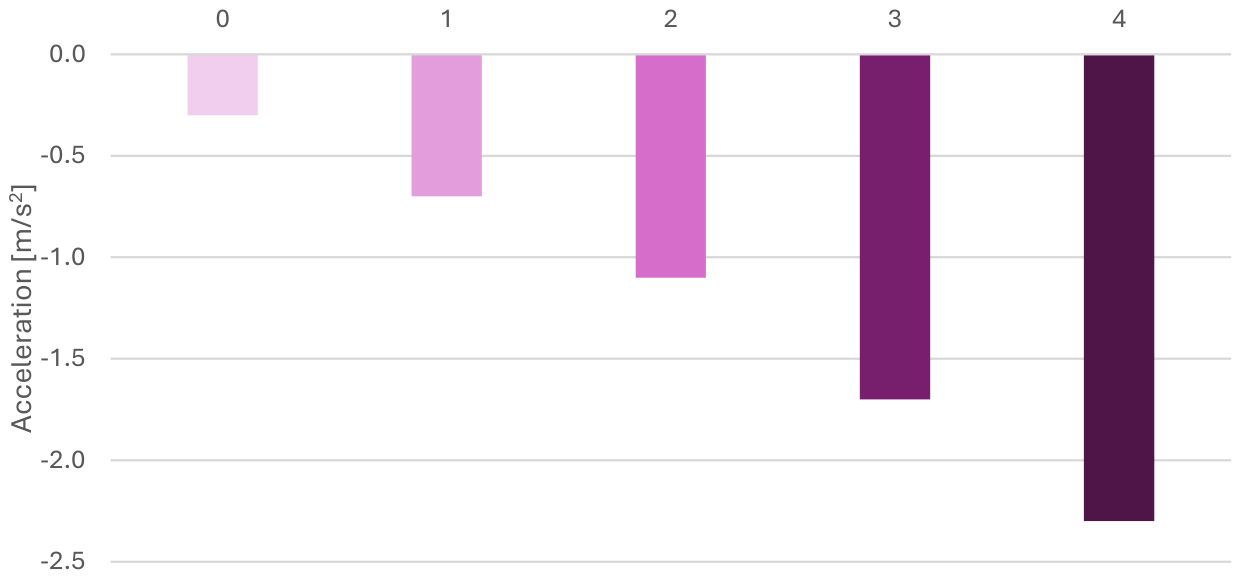
Figure 30.
Energy returned to the battery within 140–30 km/h.
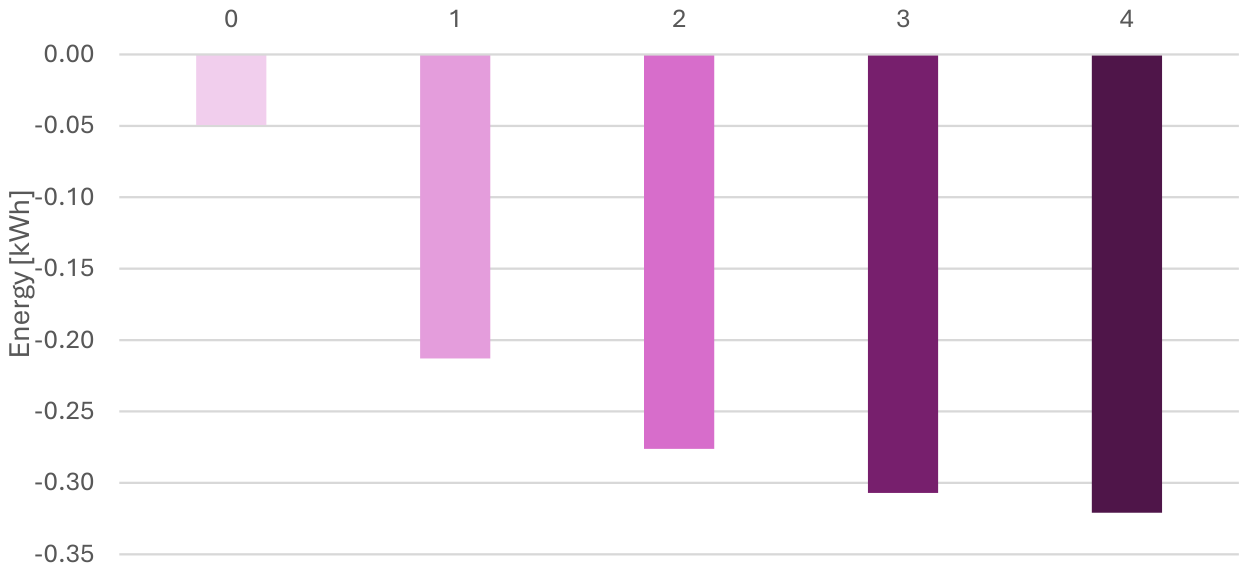
Table 2.
Main metrological characteristics of the OXTS RT2500 measurement system [18].
Table 2.
Main metrological characteristics of the OXTS RT2500 measurement system [18].
| Parameter | Value |
|---|---|
| Device type | GNSS/INS |
| Inertial sensor technology | MEMS (gyroscopes and accelerometers) |
| Data output rate | up to 100 Hz |
| Accelerometer measurement range | 10 g |
| Gyroscope measurement range | 100°/s |
| Position accuracy (CEP)1 | 0.5 m |
| Velocity accuracy (RMS) | 0.1 km/h |
| Roll/Pitch accuracy | 0.05° |
| Heading accuracy | 0.15° |
| Slip angle accuracy | 0.3° |
| Antenna configuration | single or dual antenna |
| Dimensions | 234 × 120 × 76 mm |
| Weight | 2.3 kg |
| Supply voltage | 10–25 V DC |
| Operating temperature range | from −10 °C to 50 °C |
| Communication interfaces | Ethernet, Serial port, CAN. |
1 Under open-sky conditions, the RT2500 provides a position accuracy of approximately 0.5 m (CEP). Unlike the RT2002 v2 variant, it does not support RTK corrections enabling centimetre-level positioning accuracy. However, for vehicle acceleration studies, the most important parameters are the accuracy of speed and acceleration measurements, which remain at the same high level across the entire RT2000 product family.
Table 3.
Centre of gravity positions for considered vehicle.
| Load | [mm] | [mm] | [mm] | |
|---|---|---|---|---|
| curb weigth | 1191 | 1524 | 44:56 | 510 |
| vehicle + driver | 1194 | 1521 | 44:56 | 517 |
| vehicle + 4 passengers | 1282 | 1433 | 47:53 | 546 |
Disclaimer/Publisher’s Note: The statements, opinions and data contained in all publications are solely those of the individual author(s) and contributor(s) and not of MDPI and/or the editor(s). MDPI and/or the editor(s) disclaim responsibility for any injury to people or property resulting from any ideas, methods, instructions or products referred to in the content. |
© 2026 by the authors. Licensee MDPI, Basel, Switzerland. This article is an open access article distributed under the terms and conditions of the Creative Commons Attribution (CC BY) license (http://creativecommons.org/licenses/by/4.0/).
Copyright: This open access article is published under a Creative Commons CC BY 4.0 license, which permit the free download, distribution, and reuse, provided that the author and preprint are cited in any reuse.


