

Submitted:
25 June 2026
Posted:
29 June 2026
You are already at the latest version
Abstract
Older adults with type 2 diabetes mellitus (T2DM) may exhibit early neuromuscular impairment, but the relative contribution of functional performance, mechanical capacity, body composition, and metabolic status remains unclear. This matched cross-sectional study compared 31 older adults with T2DM and 31 non-diabetic controls matched by age, sex, and body mass index (BMI). Participants completed assessments of physical function, sit-to-stand (STS)-derived muscle power, lower-limb force–velocity profiling during leg press, dual-energy X-ray absorptiometry, and fasting blood analyses. Between-group differences were examined using independent-samples t-tests, while discriminant and receiver operating characteristic (ROC) analyses were used as exploratory approaches to examine within-sample differentiation of T2DM status. Compared with controls, participants with T2DM showed longer 5-STS time (p = 0.001) and lower absolute and relative STS power (both p ≤ 0.01). In contrast, leg-press maximal force (F0) and maximal power (Pmax) did not differ between groups, while maximal and optimal velocity were higher in the T2DM group (both p = 0.026). T2DM group also showed lower peripheral fat mass, a higher android-to-gynoid ratio, higher fasting glucose, and lower insulin and HOMA-β values. Exploratory classification analyses suggested that a combined model including relative STS power, V₀, HOMA-β, and android-to-gynoid ratio showed higher within-sample discrimination than relative STS power or leg-press maximal power alone. These findings suggest that STS-derived functional power may provide complementary information to leg-press force–velocity profiling when characterizing functional status in older adults with T2DM.
Keywords:
sit-to-stand task
; type 2 diabetes
; aging
; functional performance
; force–velocity profile
1. Introduction
Age-related declines in muscle function are major contributors to frailty, loss of independence, and reduced quality of life in older adults [1]. Type 2 diabetes mellitus (T2DM), a highly prevalent chronic condition, accelerates these age-related impairments and is associated with both metabolic dysfunction and neuromuscular deterioration [2]. Specifically, alterations in insulin secretion and insulin resistance disrupt muscle protein metabolism and energy utilization, contributing to reductions in muscle mass, strength, and particularly lower-limb muscle power [3,4,5].
Lower-limb muscle power, defined as the ability to generate force rapidly, has emerged as a sensitive indicator of functional capacity and is strongly associated with mobility limitations, falls, and disability in older populations [6]. In individuals with T2DM, muscle power may be compromised due to a combination of factors, including impaired motor unit recruitment, diabetic neuropathy, and chronic low-grade inflammation [7]. Importantly, these neuromuscular impairments may emerge before clear deficits are detectable by conventional functional tests [8]. Traditional assessments such as handgrip strength and the Short Physical Performance Battery (SPPB) provide valuable information on global functional status; however, they may not fully capture the rapid force-production demands of daily activities. In this context, task-specific measures of lower-limb power, particularly sit-to-stand-derived power, may provide complementary and potentially more sensitive information on functional capacity in older adults with T2DM than conventional global functional tests.
Beyond functional performance, T2DM has also been associated with alterations in body composition, including reduced appendicular lean mass and increased adiposity, which further contribute to functional decline [9,10]. In parallel, alterations in biochemical markers such as glucose, insulin, and indices of insulin resistance and β-cell function reflect systemic metabolic dysfunction [11,12]. However, it remains unclear whether lower task-specific functional power in older adults with T2DM is accompanied by alterations in machine-based mechanical force–velocity outputs, or whether these assessments capture distinct dimensions of lower-limb function.
Emerging approaches such as force–velocity (F–V) profiling provide detailed information on the mechanical characteristics of lower-limb performance, including force-, velocity-, and power-related capacities [13]. However, it remains unclear whether alterations in functional performance in older adults with T2DM are accompanied by impairments in these underlying neuromuscular characteristics. Moreover, few studies have simultaneously integrated assessments of physical performance, task-specific functional power, body composition, and metabolic status within the same cohort.
Therefore, this matched cross-sectional study aimed to compare task-specific lower-limb functional power and leg-press force–velocity characteristics between older adults with T2DM and non-diabetic controls matched for age, sex, and BMI. A secondary aim was to describe between-group differences in physical function, body composition, and fasting metabolic and biochemical markers to provide a multidimensional characterization of this population. Finally, exploratory analyses were performed to characterize whether selected functional, mechanical, body composition, and metabolic markers could differentiate T2DM status within the study sample.
We hypothesized that older adults with T2DM would show lower STS-derived muscle power and poorer functional performance than controls. Given the task-specific nature of the STS test, we further hypothesized that differences in STS-derived power would not necessarily be paralleled by equivalent differences in leg-press force–velocity outputs. We also expected the T2DM group to show an altered body composition and metabolic profile.
2. Materials and Methods
2.1. Study Design and Participants
This observational, matched cross-sectional study compared musculoskeletal, body composition, and metabolic characteristics between older adults with type 2 diabetes mellitus (T2DM) and non-diabetic controls. A total of 62 participants were included, comprising 31 individuals with T2DM and 31 non-diabetic controls. All eligible T2DM participants with complete data for the main study variables were included. Given the limited availability of T2DM individuals, this cohort served as the reference for control selection from a larger database. Controls were group-matched using tolerance ranges of ± 3 years for age, ± 2 kg/m2 for BMI relative to T2DM participants, with sex distribution balanced between cohorts. No variables related to physical function, muscle power, force–velocity profiling, body composition, or metabolic parameters were used during the matching process.
Participants were recruited through advertisements in the community of Madrid, including municipal sports clubs and healthcare centers. Group allocation was based on clinical diagnosis. Inclusion criteria for the T2DM group were age ≥ 65 years and a confirmed diagnosis of T2DM for at least 2 years according to the American Diabetes Association criteria [14]. Information on glycemic control and pharmacological treatment was collected when available and considered in the interpretation of results. The control group included individuals aged ≥ 65 years without a diagnosis of T2DM or other metabolic diseases, and with fasting glucose levels within the normal range according to established clinical thresholds. Exclusion criteria for all participants included severe cognitive impairment, uncontrolled cardiovascular or metabolic disease, severe comorbidities, and mobility limitations not attributable to T2DM.
All participants attended three testing sessions separated by 48–72 h, conducted by the same evaluators under standardized conditions. Participants were instructed to avoid strenuous physical activity, caffeine, and alcohol for 24 h prior to testing. During the first session, anthropometry, body composition (DXA), and blood samples were obtained following an overnight fast. During the second session, participants completed assessments of physical function, including the Short Physical Performance Battery (SPPB), handgrip strength, and sit-to-stand (STS) tasks. During the third session, lower-limb performance was assessed through force–velocity profiling using the leg press. All assessments were performed in the morning to minimize circadian variability.
2.2. Assessments
2.2.1. Sociodemographic and Clinical Data
Information on participant characteristics, including age, sex, marital status, education level, medication use, and habitual physical activity (PA), was obtained through a structured interview using a validated questionnaire designed for older adults [15]. For descriptive analyses, marital status was classified as married or not married, and education level as higher education (bachelor’s degree or above) or lower education.
2.2.2. Anthropometrics and Body Composition
Body mass and height were measured using a calibrated scale and stadiometer (Seca 711, Hamburg, Germany), with participants barefoot and wearing light clothing. Body mass index (BMI) was calculated as body mass (kg) divided by height squared (m²). Body composition was assessed by dual-energy X-ray absorptiometry (DXA) using a Hologic Discovery Series QDR densitometer (Bedford, USA). Whole-body scans were performed with participants in a supine position, wearing light clothing and no metal objects. Total and regional body composition variables, including fat mass, lean mass (bone-free), appendicular lean mass, and percentage body fat, were obtained using APEX software (version 3.1.2, Hologic Inc., Bedford, USA). Android-to-gynoid fat ratio and regional bone mineral density were obtained from the manufacturer-defined regions of interest. Appendicular lean mass was calculated as the sum of lean mass in both arms and legs. Equipment was calibrated daily using a lumbar spine phantom, and quality-control procedures were performed according to the manufacturer’s guidelines.
2.2.3. Physical Function and Sit-to-Stand Power
Physical function was assessed using the Short Physical Performance Battery (SPPB) [16], which includes balance, usual gait speed (4-m walk), and the five-repetition sit-to-stand test (5-STS). Each component was scored according to established criteria, and a total score (0–12) was calculated, with higher scores indicating better function. Lower-limb muscle power was estimated from the 5-STS test using the validated equation proposed by Alcazar et al. [17]. Absolute STS power was calculated from body mass, height, chair height (0.43 m), and the time required to complete five sit-to-stand repetitions. Relative STS power was calculated by dividing absolute STS power by body mass.
Handgrip strength was assessed using a digital dynamometer (TKK 5401; Takei, Tokyo, Japan). Participants performed two maximal 3-second contractions per hand, with a 1-minute rest between trials. The highest value obtained was used for analysis.
2.2.4. Force–Velocity Profiling
Lower-limb force–velocity (F–V) profiling was assessed during the leg press exercise (Matrix GS310, Madrid, Spain), following a previously validated protocol [18]. After a standardized warm-up, participants performed 2–3 concentric repetitions at progressively increasing loads (5–20 kg increments), starting from low loads (~40% of the individual one repetition maximum (1-RM) and increasing until reaching a load equivalent to 80% 1-RM. A minimum of 4–6 loading conditions were recorded per participant to construct the individual force–velocity relationship. Participants were instructed to perform each repetition with maximally intended concentric velocity, and strong verbal encouragement was provided. Rest intervals of 1–2 minutes were allowed between successive repetitions at each load, and 2–3 minutes between different loading conditions to minimize fatigue accumulation.
Force and mean propulsive velocity were recorded using a linear position transducer (ADR, Toledo, Spain). For analysis, only the fastest repetition at each load was retained. The individual force–velocity relationship was determined using linear regression, from which theoretical maximal force (F0), maximal velocity (V0), slope, maximal power (Pmax), optimal load (Lopt), and optimal velocity (Vopt) were derived [18].
2.2.5. Metabolic and Biochemical Parameters
Following a minimum 12-hour overnight fast, venous blood samples were collected from the antecubital vein in the morning. Participants were instructed to refrain from moderate-to-vigorous physical activity for at least 72 hours prior to sampling. Routine clinical analyses were performed in an accredited laboratory and included hemoglobin, urea, alanine aminotransferase (ALT), fasting glucose, and insulin. Serum aliquots were stored at −80 °C for subsequent analyses.
Fasting insulin concentrations were determined using a commercial human insulin ELISA kit (Invitrogen, Cat. No. KAP1251, Thermo Fisher Scientific, USA), following the manufacturer’s protocol. All samples, standards, and controls were measured in duplicate using a 96-well microplate reader, with absorbance recorded at 450 nm. Insulin concentrations (µIU/mL) were calculated using a four-parameter logistic (4PL) regression curve. The assay sensitivity was 2 µIU/mL, and intra- and inter-assay coefficients of variation were both <10%. Fasting glucose concentrations (mg/dL) were obtained from the same blood draw and analyzed on the same day. Insulin resistance and β-cell function were estimated using the homeostasis model assessment indices [19]:
HOMA-IR = [Fasting insulin (µIU/mL) × Fasting glucose (mg/dL)] / 405
HOMA-β = [360 × Fasting insulin (µIU/mL)] / [Fasting glucose (mg/dL) – 63]
Participants with T2DM continued their usual pharmacological treatment, which was recorded and considered in data interpretation.
2.3. Statistical Analysis
Continuous variables were presented as mean ± standard deviation (SD), and categorical variables as frequencies and percentages. Data normality and homogeneity of variance were examined by Shapiro–Wilk and Levene’s tests, respectively. Independent-samples t-tests were used for group comparisons for continuous variables, and chi-square or Fisher’s exact tests were used for categorical variables. Effect sizes for continuous variables were calculated using Cohen’s d. Statistical significance was set at p < 0.05.
Exploratory multivariable analyses were performed to characterize between-group differentiation within the study sample. Four selected exploratory markers included: relative STS power, HOMA-β, V0, and AND/GYN ratio. These markers were selected from different domains based on theoretical relevance, univariate between-group findings, effect size, clinical interpretability, and avoidance of redundancy and potential multicollinearity among closely related variables. A canonical discriminant analysis was performed using the enter method. Structure coefficients were reported as pooled within-group correlations between each marker and the discriminant function. Classification accuracy was reported for both the original classification and leave-one-out cross-validation.
Receiver operating characteristic (ROC) curve analysis was used to assess the discriminatory performance of the combined model and individual markers. The combined model was based on predicted probabilities from a binary logistic regression model including the same four selected markers. Relative STS power and Pmax were also evaluated as individual markers. Area Under the Curve (AUC) and 95% confidence intervals (CI), and p-value were reported. All statistical analyses were performed using IBM SPSS Statistics (version 29.0; IBM Corp., Armonk, NY, USA).
3. Results
3.1. Participant Demographics
Descriptive characteristics of the study sample are presented in Table 1. A total of 62 older adults participated, comprising 31 older adults with T2DM and 31 matched non-diabetic controls (CON). No significant between-group differences were observed in the matching variables, including age, sex distribution, or BMI (all p > 0.05). Similarly, married status or higher education level did not differ significantly between groups (all p > 0.05). In the T2DM group, 83.8% were receiving anti-diabetic medication. Regarding physical activity, all participants with T2DM and 93.5% of controls met the aerobic component of the WHO physical activity guidelines [20], with no significant difference between groups (p = 0.492).
3.2. Physical Function, Sit-to-Stand Power, and Force–Velocity Profile
As presented in Table 2, compared with controls, the T2DM group exhibited a longer 5-STS time (p = 0.001, Cohen’s d = 0.903). Absolute STS power and relative STS power (p = 0.01 and p = 0.001, respectively) were lower in the T2DM group (Table 2 and Figure 1a). While no significant differences were observed for SPPB balance, 4-m gait time, SPPB total score or handgrip strength between groups (all p > 0.05).
For leg press force–velocity profiling, the T2DM group showed higher maximal and optimal velocity (V0 and Vopt; both p = 0.026) compared to the controls (Table 2 and Figure 1b). However, no significant between-group differences were found for F0, Fopt, F–V slope, or Pmax) (all p > 0.05; Table 2, and Figure 1c, d).
3.3. Body Composition, Metabolic and Biochemical Markers
Group comparisons for body composition, metabolic, and biochemical variables are presented in Table 3. Lean mass variables, including leg lean mass, appendicular lean mass, and whole-body lean mass, did not differ significantly between groups (all p > 0.05). Participants with T2DM had a lower leg fat mass (p < 0.05) and a higher android-to-gynoid ratio (p = 0.013) than controls, whereas arm fat mass showed a borderline between-group difference (p = 0.05). Arm fat percentage did not differ significantly between groups. Leg fat percentage was numerically lower in the T2DM group, although the between-group difference did not reach statistical significance (p = 0.054). Arm and leg BMD were higher in the T2DM group than in non-diabetic controls (both p < 0.001).
For metabolic parameters, fasting glucose level was higher in the T2DM group (p < 0.001, d = 1.155), whereas insulin concentration (p = 0.003) and HOMA-β (p < 0.001, d = −1.432) were significantly lower than in controls. HOMA-IR did not differ significantly between groups. Among biochemical markers, hemoglobin was lower (p = 0.027) and urea was higher in T2DM (p < 0.05), whereas ALT did not differ significantly between groups (p = 0.073).
3.4. Exploratory Analyses of Group Differentiation
To examine whether selected functional, force−velocity, body composition, and metabolic markers could differentiate between groups within the study sample, a canonical discriminant analysis was performed (Table 4). Four selected markers were entered into the discriminant model: relative STS power, HOMA-β, V0, and AND/GYN ratio. The discriminant function significantly differentiated older adults with T2DM from controls, Wilks’ Λ = 0.508, χ² (4) = 39.313, p < 0.001. The function showed an eigenvalue of 0.970 and a canonical correlation of 0.702. Structure coefficients indicated that HOMA-β had the largest loading on the discriminant function, followed by the relative STS power. Furthermore, the AND/GYN ratio (−0.336) and V0 (−0.300) also provided additional contributions to the discriminant function. The model achieved an original classification accuracy of 80.6%, with a leave-one-out cross-validated accuracy of 79.0%.
Subsequently, receiver operating characteristic (ROC) curve analysis was performed to evaluate the discriminatory performance of the combined model and selected individual markers (Figure 2). The multivariable combined model was based on predicted probabilities from a binary logistic regression model including relative STS power, HOMA-β, V₀, and AND/GYN ratio, which yielded an AUC of 0.937 (95% CI: 0.878–0.995; p < 0.001). Notably, relative STS power alone showed an AUC of 0.732 (95% CI, 0.606–0.857, p =0.002), whereas Pmax failed to reach statistical significance in its predictive value (AUC = 0.559; 95% CI, 0.415–0.704; p = 0.422).
4. Discussion
The main finding of this matched cross-sectional study was that older adults with T2DM showed lower STS-derived functional power than non-diabetic controls, whereas leg-press maximal force and maximal power did not differ significantly between groups. This pattern suggests that STS-derived power and machine-based F–V profiling may capture partly distinct dimensions of lower-limb function in this sample. In addition, body composition and fasting metabolic markers differed between groups, supporting the relevance of a multidimensional assessment approach.
The lower STS power observed in participants with T2DM represents a key functional finding of the present study. However, conventional clinical measures within our cohort, such as handgrip strength and total SPPB scores, showed limited sensitivity in separating T2DM populations from non-diabetic controls. This observation aligns with previous evidence indicating that muscle power is more sensitive than maximal strength for detecting early functional decline in older adults [21]. These results may be explained by the high physical activity levels of the participants, with nearly all individuals meeting the WHO aerobic physical activity recommendations. Regular physical activity may help preserve global mobility and upper-limb strength [22], potentially masking early impairments in more sensitive functional domains. This difference highlights that standard functional screenings may exhibit ceiling effects in physically active cohorts, whereas STS-derived power unmasks subtle deficits in dynamic, weight-bearing performance. These findings support the utility of relative STS power as an integrated marker of task-specific functional capacity in older adults with T2DM.
The reduction in STS power contrasted with the preserved force–velocity characteristics observed in the T2DM group. Specifically, no significant between-group differences were observed in maximal force (F0), optimal force (Fopt), or maximal power (Pmax). This functional-mechanical dissociation may reflect a task-specific functional and neuromuscular limitation rather than a generalized impairment in leg-press mechanical capacity. Unlike the leg press, which is performed in a guided and externally stabilized environment, the STS task requires rapid force generation, intermuscular coordination, postural control, and displacement of body mass during a self-initiated weight-bearing movement [23]. Therefore, in this relatively active cohort with comparable BMI between groups, reduced STS power may reflect task-specific functional limitations associated with T2DM, rather than differences in isolated maximal power alone. Previous studies have reported alterations in neuromuscular function in individuals with T2DM, which may contribute to impaired functional performance [24,25,26]. Nevertheless, because electromyography, kinematic analysis, coordination analysis, or neuropathy assessment were not performed, mechanisms related to altered muscular activation, motor recruitment, coordination, or compensatory movement strategies cannot be confirmed. Similarly, although V0 and Vopt were higher in the T2DM group, these results should be interpreted cautiously and should not be considered evidence of a compensatory strategy without direct biomechanical or electrophysiological measurements. Collectively, these findings suggest that STS-derived power and leg press force-velocity profiling provide complementary information [21,27,28], with STS power capturing early impairments that may not be fully reflected by traditional functional tests.
From a body composition perspective, participants with T2DM exhibited lower peripheral fat mass together with a higher android-to-gynoid ratio, despite being matched for BMI. This pattern may suggest altered fat distribution [29] rather than generalized adiposity, and differs from the obese phenotype typically described in older adults with T2DM. The relatively high physical activity level of the cohort and the BMI-matched study design may partly account for these findings. In addition, pharmacological treatment [30] and metabolic disturbances may also be relevant to the observed body composition profile. Notably, the absence of significant differences in appendicular or whole-body lean mass indicates that lower STS power was not accompanied by detectable differences in DXA-derived lean mass. However, DXA does not capture muscle quality, intramuscular fat infiltration, neuromuscular activation, or coordination, which may be relevant for functional power. In contrast, limb bone mineral density was higher in the T2DM group. Nevertheless, higher BMD does not necessarily indicate better bone quality [31], and may instead reflect differences in mechanical loading or metabolic influence on bone. This finding is consistent with previous evidence showing that individuals with T2DM may present normal or elevated bone mineral density despite an increased fracture risk, likely due to alterations in bone microarchitecture and material properties not captured by DXA [31].
Metabolically, the T2DM group was characterized by higher fasting glucose, together with lower insulin and HOMA-β values, whereas HOMA-IR did not differ significantly between groups. In this BMI-matched and relatively active cohort, this pattern suggests that impaired β-cell function may represent a more prominent fasting-derived feature than a clear difference in insulin resistance. This observation may differ from the more typical sedentary and obese T2DM phenotype, in which excess adiposity and insulin resistance are often more pronounced. Regular physical activity and pharmacological treatment have been associated with improved skeletal muscle glucose uptake and systemic glucose regulation [32,33], which may provide a plausible context for the absence of a significant between-group difference in HOMA-IR. However, this explanation should be interpreted cautiously, as treatment characteristics and tissue-specific insulin sensitivity were not directly examined. Furthermore, indices based only on fasting glucose and insulin cannot determine which tissues primarily contribute to impaired glucose regulation. Therefore, these findings should be interpreted as contextual metabolic features of this active cohort.
The exploratory discriminant and ROC analyses provided additional information regarding between-group differentiating within the study sample. In the discriminant model, four selected markers were included: relative STS power, V0, HOMA-β, and AND/GYN ratio. HOMA-β showed the largest structure coefficients, which were partly expected given that this index is derived from fasting glucose and insulin. Relative STS power was also associated with the discriminant function, suggesting that task-specific functional power contributed to group separation beyond the expected metabolic distinction. In the ROC analysis, the combined model showed a higher AUC than relative STS power or Pmax alone. This indicates that STS power provided important functional information, whereas metabolic and compositional markers added further discriminatory value. These findings should be interpreted cautiously because of the modest sample size and absence of external validation. Relative STS power showed significant standalone discriminatory ability, whereas Pmax did not. From an applied perspective, these findings support the inclusion of STS-derived power as a feasible complement to conventional functional assessments in older adults with T2DM. They also provide a rationale for future longitudinal and intervention studies examining whether power-oriented exercise programs can improve task-specific functional performance in this population.
Several limitations should be acknowledged. The study used a cross-sectional design and included a modest sample size, which should be considered when interpreting the findings. At the same time, it provides a comprehensive and integrative assessment of neuromuscular, compositional, and metabolic domains in older adults with T2DM. The relatively high physical activity level of the T2DM group may have attenuated group differences, but it may also have allowed the identification of impairments that persist despite favorable lifestyle conditions. Physical activity was self-reported, which may introduce bias, and detailed clinical information, such as HbA1c, disease duration, neuropathy status, and medication type or dosage, was not fully available. Future longitudinal studies with larger samples, more detailed clinical characterization, and biomechanical assessments are needed to confirm these findings and clarify their clinical relevance.
5. Conclusions
In this matched cross-sectional study, older adults with T2DM showed lower STS-derived functional power than non-diabetic controls, despite no significant between-group differences in leg-press maximal force and maximal power. These findings suggest that task-specific functional power may provide complementary information to machine-based force–velocity profiling when characterizing lower-limb function in older adults with T2DM. Integrating functional, mechanical, body composition, and metabolic assessments may help provide a more comprehensive characterization of this population. Longitudinal and intervention studies are needed to determine whether STS-derived power can identify clinically meaningful functional decline and whether power-oriented exercise programs improve functional outcomes in older adults with T2DM.
Author Contributions
The individual contributions to this paper were as follows: conceptualization, A.G.G., M.A.G.-R., and A.M.; methodology, A.G.G., M.A.G.-R., A.M., L.W., P.G.-R., and R.G.-M.; formal analysis, L.W., A.G.G., and M.A.G.-R.; investigation, A.M., P.G.-R., R.G.-M., M.C.A. , and L.W.; resources, A.M., P.G.-R., R.G.-M., and M.C.A.; data curation, A.M., A.G.G., P.G.-R., R.G.-M., and L.W.; writing—original draft preparation, L.W.; writing—review and editing, A.G.G., M.A.G.-R., A.M., P.G.-R., R.G.-M., and M.C.A.; visualization, L.W.; supervision, A.G.G. and M.A.G.-R. All authors have read and agreed to the published version of the manuscript.
Funding
This work was supported by the Spanish Diabetes Society, grant number SE1911600154, and the Government of Castilla-La Mancha (Grant No. PI2010/020). L.W. is supported by China Scholarship Council (CSC). P.G.-R. is supported by a Spanish Ministry of Science contract (FPU20/05210). R.G.-M. is supported by an Industrial contract from the Community of Madrid (IND2022/BMD-23595).
Institutional Review Board Statement
The study was conducted in accordance with the Declaration of Helsinki and approved by the Ethics Committee of the Universidad Politécnica de Madrid (ID: 202000011568). The study was registered at ClinicalTrials.gov (NCT04332302).
Informed Consent Statement
Written informed consent was obtained from all participants.
Data Availability Statement
The data supporting the findings of this study are available from the corresponding author upon reasonable request.
Acknowledgments
The authors have reviewed and edited the output and take full responsibility for the content of this publication. The authors would like to thank all the participants for their involvement and commitment. The authors used ChatGPT (OpenAI, San Francisco, CA, USA) to assist with language editing and refinement of the manuscript. All content was critically reviewed and approved by the authors, who take full responsibility for the final version of the manuscript.
Conflicts of Interest
The authors declare no conflicts of interest.
Abbreviations
The following abbreviations are used in this manuscript:
| T2DM | Type 2 Diabetes Mellitus |
| SPPB | Short Physical Performance Battery |
| 5-STS | 5 Times Sit-to-stand Test |
| RL STS | Relative Sit-to-stand Power |
| DXA | Dual-Energy X-ray Absorptiometry |
| HOMA-IR | Homeostatic Model Assessment of Insulin Resistance |
| HOMA-β | Homeostatic Model Assessment of β-cell Function |
| ALT | Alanine Aminotransferase |
| F–V | Force–velocity |
| BMI | Body Mass Index |
| WHO | World Health Organization |
| ADA | American Diabetes Association |
| BMD | Bone Mineral Density |
| PA | Physical Activity |
| 1-RM | One Repetition Maximum |
| F0 | Theoretical Maximal Isometric Force |
| V0 | Theoretical Maximal Velocity |
| Fopt | Optimal Force |
| Vopt | Optimal Velocity |
| Pmax | Maximal Power |
| ALM | Appendicular Lean Mass |
| WB | Whole Body |
| ROC | Receiver Operating Characteristic |
| AUC | Area Under the Curve |
| CI | Confidence Intervals |
References
- Trombetti, A.; Reid, K.F.; Hars, M.; Herrmann, F.R.; Pasha, E.; Phillips, E.M.; Fielding, R.A. Age-Associated Declines in Muscle Mass, Strength, Power, and Physical Performance: Impact on Fear of Falling and Quality of Life. Osteoporos. Int. J. Establ. Result Coop. Eur. Found. Osteoporos. Natl. Osteoporos. Found. USA 2015, 27, 463. [CrossRef]
- Zhang, Z.; He, X.; Sun, Y.; Li, J.; Sun, J. Type 2 Diabetes Mellitus: A Metabolic Model of Accelerated Aging - Multi-Organ Mechanisms and Intervention Approaches. Aging Dis. 2025, 0. [CrossRef]
- Nishikawa, H.; Fukunishi, S.; Asai, A.; Yokohama, K.; Ohama, H.; Nishiguchi, S.; Higuchi, K. Sarcopenia, Frailty and Type 2 Diabetes Mellitus (Review). Mol. Med. Rep. 2021, 24, 1–8. [CrossRef]
- Castillo, Í.M.P.; Argilés, J.M.; Rueda, R.; Ramírez, M.; Pedrosa, J.M.L. Skeletal Muscle Atrophy and Dysfunction in Obesity and Type-2 Diabetes Mellitus: Myocellular Mechanisms Involved. Rev. Endocr. Metab. Disord. 2025. [CrossRef]
- Strati, M.; Moustaki, M.; Psaltopoulou, T.; Vryonidou, A.; Paschou, S.A. Early Onset Type 2 Diabetes Mellitus: An Update. Endocrine 2024, 85, 965–978. [CrossRef]
- Chen, H.; Huang, X.; Dong, M.; Wen, S.; Zhou, L.; Yuan, X. The Association Between Sarcopenia and Diabetes: From Pathophysiology Mechanism to Therapeutic Strategy. Diabetes Metab. Syndr. Obes. Targets Ther. 2023, 16, 1541–1554. [CrossRef]
- Araújo, L.P.; Figueiredo Godoy, A.C.; Fortes Frota, F.; Barbalho Lamas, C.; Quesada, K.; Rucco Penteado Detregiachi, C.; Cressoni Araújo, A.; Miglino, M.A.; Landgraf Guiguer, E.; Santos de Argollo Haber, R.; et al. Sarcopenia in the Aging Process: Pathophysiological Mechanisms, Clinical Implications, and Emerging Therapeutic Approaches. Int. J. Mol. Sci. 2025, 26, 12147. [CrossRef]
- Park, S.W.; Goodpaster, B.H.; Strotmeyer, E.S.; Kuller, L.H.; Broudeau, R.; Kammerer, C.; de Rekeneire, N.; Harris, T.B.; Schwartz, A.V.; Tylavsky, F.A.; et al. Accelerated Loss of Skeletal Muscle Strength in Older Adults with Type 2 Diabetes: The Health, Aging, and Body Composition Study. Diabetes Care 2007, 30, 1507–1512. [CrossRef]
- Yuan, Y.; Li, S.; Yin, L.; Su, Y.; Guo, Z.; Liu, Y.; Blake, G.M.; Wang, L.; Liu, Y.; Cheng, X.; et al. Decreased Muscle Strength and Thigh Muscle Area Assessed with CT Imaging in Older Chinese Adults with Long Duration of Type 2 Diabetes. J. Nutr. Health Aging 2025, 29, 100506. [CrossRef]
- Sun, L.; Fu, J.; Mu, Z.; Duan, X.; Chan, P.; Xiu, S. Association between Body Fat and Sarcopenia in Older Adults with Type 2 Diabetes Mellitus: A Cross-Sectional Study. Front. Endocrinol. 2023, 14, 1094075. [CrossRef]
- Ohira, M.; Kawagoe, N.; Kameyama, C.; Kondou, Y.; Igarashi, M.; Ueshiba, H. Association of Serum Cortisol with Insulin Secretion and Plasma Aldosterone with Insulin Resistance in Untreated Type 2 Diabetes: A Cross-Sectional Study. Diabetol. Metab. Syndr. 2025, 17, 144. [CrossRef]
- Młynarska, E.; Czarnik, W.; Dzieża, N.; Jędraszak, W.; Majchrowicz, G.; Prusinowski, F.; Stabrawa, M.; Rysz, J.; Franczyk, B. Type 2 Diabetes Mellitus: New Pathogenetic Mechanisms, Treatment and the Most Important Complications. Int. J. Mol. Sci. 2025, 26, 1094. [CrossRef]
- Alcazar, J.; Rodriguez-Lopez, C.; Ara, I.; Alfaro-Acha, A.; Rodríguez-Gómez, I.; Navarro-Cruz, R.; Losa-Reyna, J.; García-García, F.J.; Alegre, L.M. Force-Velocity Profiling in Older Adults: An Adequate Tool for the Management of Functional Trajectories with Aging. Exp. Gerontol. 2018, 108, 1–6. [CrossRef]
- American Diabetes Association Diagnosis and Classification of Diabetes Mellitus. Diabetes Care 2014, 37 Suppl 1, S81-90. [CrossRef]
- López-Rodríguez, C.; Laguna, M.; Gómez-Cabello, A.; Gusi, N.; Espino, L.; Villa, G.; Pedrero-Chamizo, R.; Casajus, J.A.; Ara, I.; Aznar, S. Validation of the Self-Report EXERNET Questionnaire for Measuring Physical Activity and Sedentary Behavior in Elderly. Arch. Gerontol. Geriatr. 2017, 69, 156–161. [CrossRef]
- Guralnik, J.M.; Simonsick, E.M.; Ferrucci, L.; Glynn, R.J.; Berkman, L.F.; Blazer, D.G.; Scherr, P.A.; Wallace, R.B. A Short Physical Performance Battery Assessing Lower Extremity Function: Association with Self-Reported Disability and Prediction of Mortality and Nursing Home Admission. J. Gerontol. 1994, 49, M85-94. [CrossRef]
- Alcazar, J.; Losa-Reyna, J.; Rodriguez-Lopez, C.; Alfaro-Acha, A.; Rodriguez-Mañas, L.; Ara, I.; García-García, F.J.; Alegre, L.M. The Sit-to-Stand Muscle Power Test: An Easy, Inexpensive and Portable Procedure to Assess Muscle Power in Older People. Exp. Gerontol. 2018, 112, 38–43. [CrossRef]
- Alcazar, J.; Rodriguez-Lopez, C.; Ara, I.; Alfaro-Acha, A.; Mañas-Bote, A.; Guadalupe-Grau, A.; García-García, F.J.; Alegre, L.M. The Force-Velocity Relationship in Older People: Reliability and Validity of a Systematic Procedure. Int. J. Sports Med. 2017, 38, 1097–1104. [CrossRef]
- Bermúdez-Pirela, V.J.; Cano, C.; Medina, M.T.; Souki, A.; Lemus, M.A.; Leal, E.M.; Seyfi, H.A.; Cano, R.; Ciscek, A.; Bermúdez-Arias, F.; et al. Metformin plus Low-Dose Glimeperide Significantly Improves Homeostasis Model Assessment for Insulin Resistance (HOMA(IR)) and Beta-Cell Function (HOMA(Beta-Cell)) without Hyperinsulinemia in Patients with Type 2 Diabetes Mellitus. Am. J. Ther. 2007, 14, 194–202. [CrossRef]
- RECOMMENDATIONS. In WHO Guidelines on Physical Activity and Sedentary Behaviour; World Health Organization, 2020.
- Garcia-Aguirre, M.; Baltasar-Fernandez, I.; Alcazar, J.; Alfaro-Acha, A.; Bareiro-Quiñonez, F.A.; Ara, I.; Rodriguez-Mañas, L.; Garcia-Garcia, F.J.; Alegre, L.M. Low Relative Sit-to-Stand Power Is Associated With the Development of Adverse Health Outcomes: A 5-Year Longitudinal Study. J. Cachexia Sarcopenia Muscle 2025, 16, e13852. [CrossRef]
- Botton, C.E.; Umpierre, D.; Rech, A.; Pfeifer, L.O.; Machado, C.L.F.; Teodoro, J.L.; Dias, A.S.; Pinto, R.S. Effects of Resistance Training on Neuromuscular Parameters in Elderly with Type 2 Diabetes Mellitus: A Randomized Clinical Trial. Exp. Gerontol. 2018, 113, 141–149. [CrossRef]
- Wang, H.; Xu, S.; Fu, J.; Xu, X.; Wang, Z.; Na, R.S. Sit-to-Stand (STS) Movement Analysis of the Center of Gravity for Human-Robot Interaction. Front. Neurorobotics 2022, 16, 863722. [CrossRef]
- Larsen, S.; Ara, I.; Rabøl, R.; Andersen, J.L.; Boushel, R.; Dela, F.; Helge, J.W. Are Substrate Use during Exercise and Mitochondrial Respiratory Capacity Decreased in Arm and Leg Muscle in Type 2 Diabetes? Diabetologia 2009, 52, 1400–1408. [CrossRef]
- Shahrjerdi, S.; Bahrpeyma, F.; Savelberg, H.H.C.M.; Mohajeri-Tehrani, M.R. Effect of a 6-Week Strength-Training Program on Neuromuscular Efficiency in Type 2 Diabetes Mellitus Patients. Diabetol. Int. 2020, 11, 376–382. [CrossRef]
- Watanabe, K.; Gazzoni, M.; Holobar, A.; Miyamoto, T.; Fukuda, K.; Merletti, R.; Moritani, T. Motor Unit Firing Pattern of Vastus Lateralis Muscle in Type 2 Diabetes Mellitus Patients. Muscle Nerve 2013, 48, 806–813. [CrossRef]
- Lindemann, U.; Mohr, C.; Machann, J.; Blatzonis, K.; Rapp, K.; Becker, C. Association between Thigh Muscle Volume and Leg Muscle Power in Older Women. PloS One 2016, 11, e0157885. [CrossRef]
- Alcazar, J.; Alegre, L.M.; Suetta, C.; Júdice, P.B.; Van Roie, E.; González-Gross, M.; Rodríguez-Mañas, L.; Casajús, J.A.; MAGALHãES, Jo.P.; Nielsen, B.R.; et al. Threshold of Relative Muscle Power Required to Rise from a Chair and Mobility Limitations and Disability in Older Adults. Med. Sci. Sports Exerc. 2021, 53, 2217. [CrossRef]
- Gallagher, D.; Kelley, D.E.; Yim, J.-E.; Spence, N.; Albu, J.; Boxt, L.; Pi-Sunyer, F.X.; Heshka, S. Adipose Tissue Distribution Is Different in Type 2 Diabetes2. Am. J. Clin. Nutr. 2009, 89, 807–814. [CrossRef]
- Goel, V.; Aggarwal, R.; Prakash, A.; Ghotekar, L.H.; Bansal, P. Effects of Sulfonylureas and Dipeptidyl Peptidase 4 Inhibitors on Percentage Body Fat Change in Type 2 Diabetes Mellitus Patients on Metformin at 4 and 12 Weeks. Cureus 2024, 16, e70255. [CrossRef]
- Botella Martínez, S.; Varo Cenarruzabeitia, N.; Escalada San Martin, J.; Calleja Canelas, A. The Diabetic Paradox: Bone Mineral Density and Fracture in Type 2 Diabetes. Endocrinol. Nutr. Organo Soc. Espanola Endocrinol. Nutr. 2016, 63, 495–501. [CrossRef]
- Sylow, L.; Kleinert, M.; Richter, E.A.; Jensen, T.E. Exercise-Stimulated Glucose Uptake - Regulation and Implications for Glycaemic Control. Nat. Rev. Endocrinol. 2017, 13, 133–148. [CrossRef]
- KIRWAN, J.P.; SACKS, J.; NIEUWOUDT, S. The Essential Role of Exercise in the Management of Type 2 Diabetes. Cleve. Clin. J. Med. 2017, 84, S15–S21. [CrossRef]
Figure 1.
Comparison of key neuromuscular outcomes between older adults with T2DM and CON. (a) Relative sit-to-stand (STS) power; (b) theoretical maximal velocity (V0); (c) theoretical maximal force (F0); (d) maximal power (Pmax). Violin plots display the median (dashed lines), interquartile range (dotted lines), and full probability density distribution. * p < 0.05, ** p < 0.01, n.s., not significant.
Figure 1.
Comparison of key neuromuscular outcomes between older adults with T2DM and CON. (a) Relative sit-to-stand (STS) power; (b) theoretical maximal velocity (V0); (c) theoretical maximal force (F0); (d) maximal power (Pmax). Violin plots display the median (dashed lines), interquartile range (dotted lines), and full probability density distribution. * p < 0.05, ** p < 0.01, n.s., not significant.
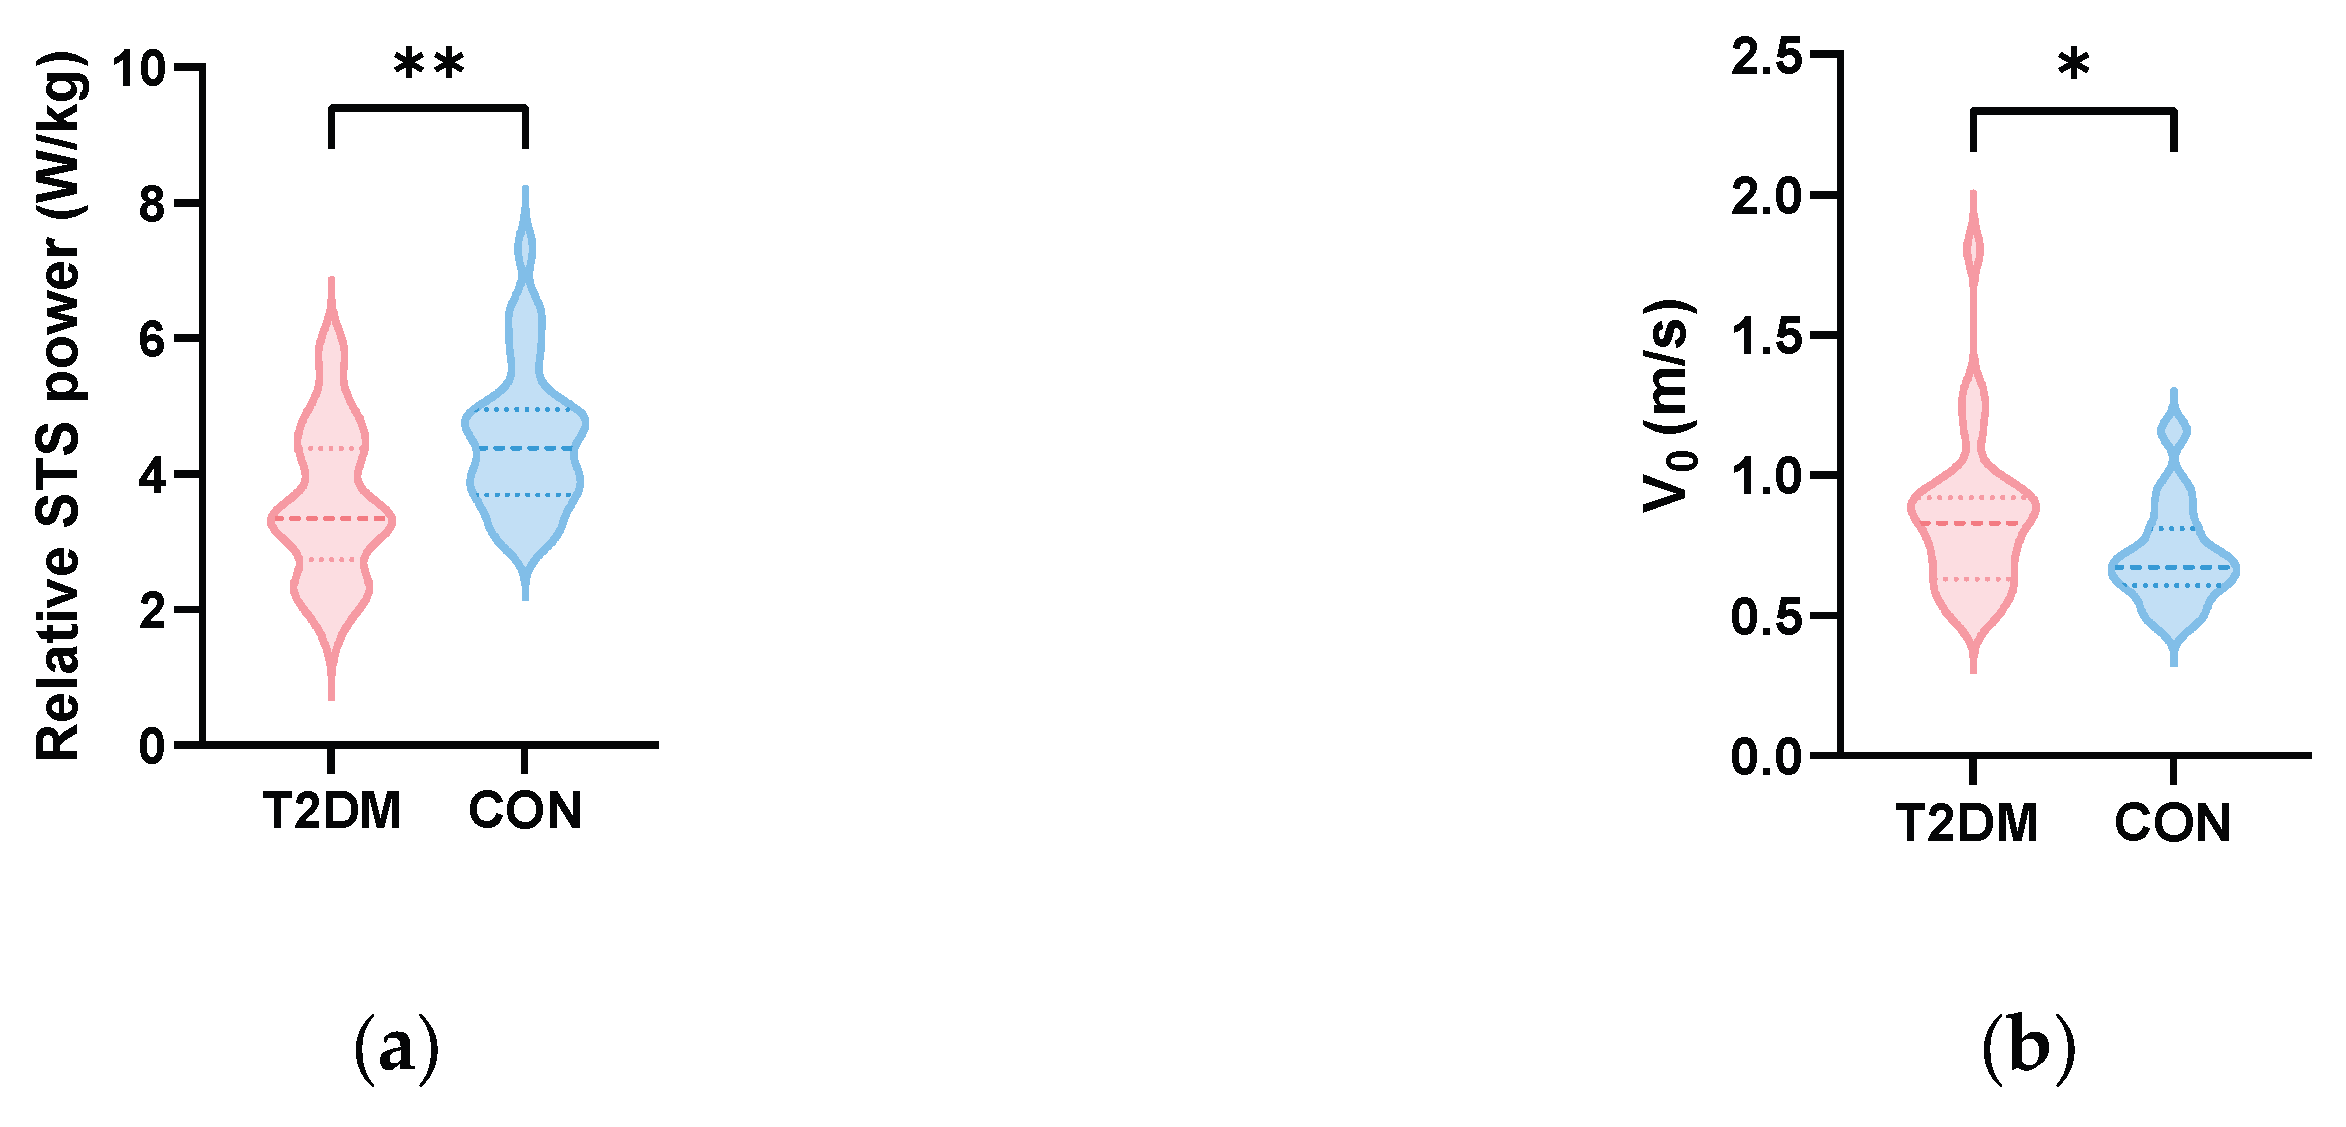
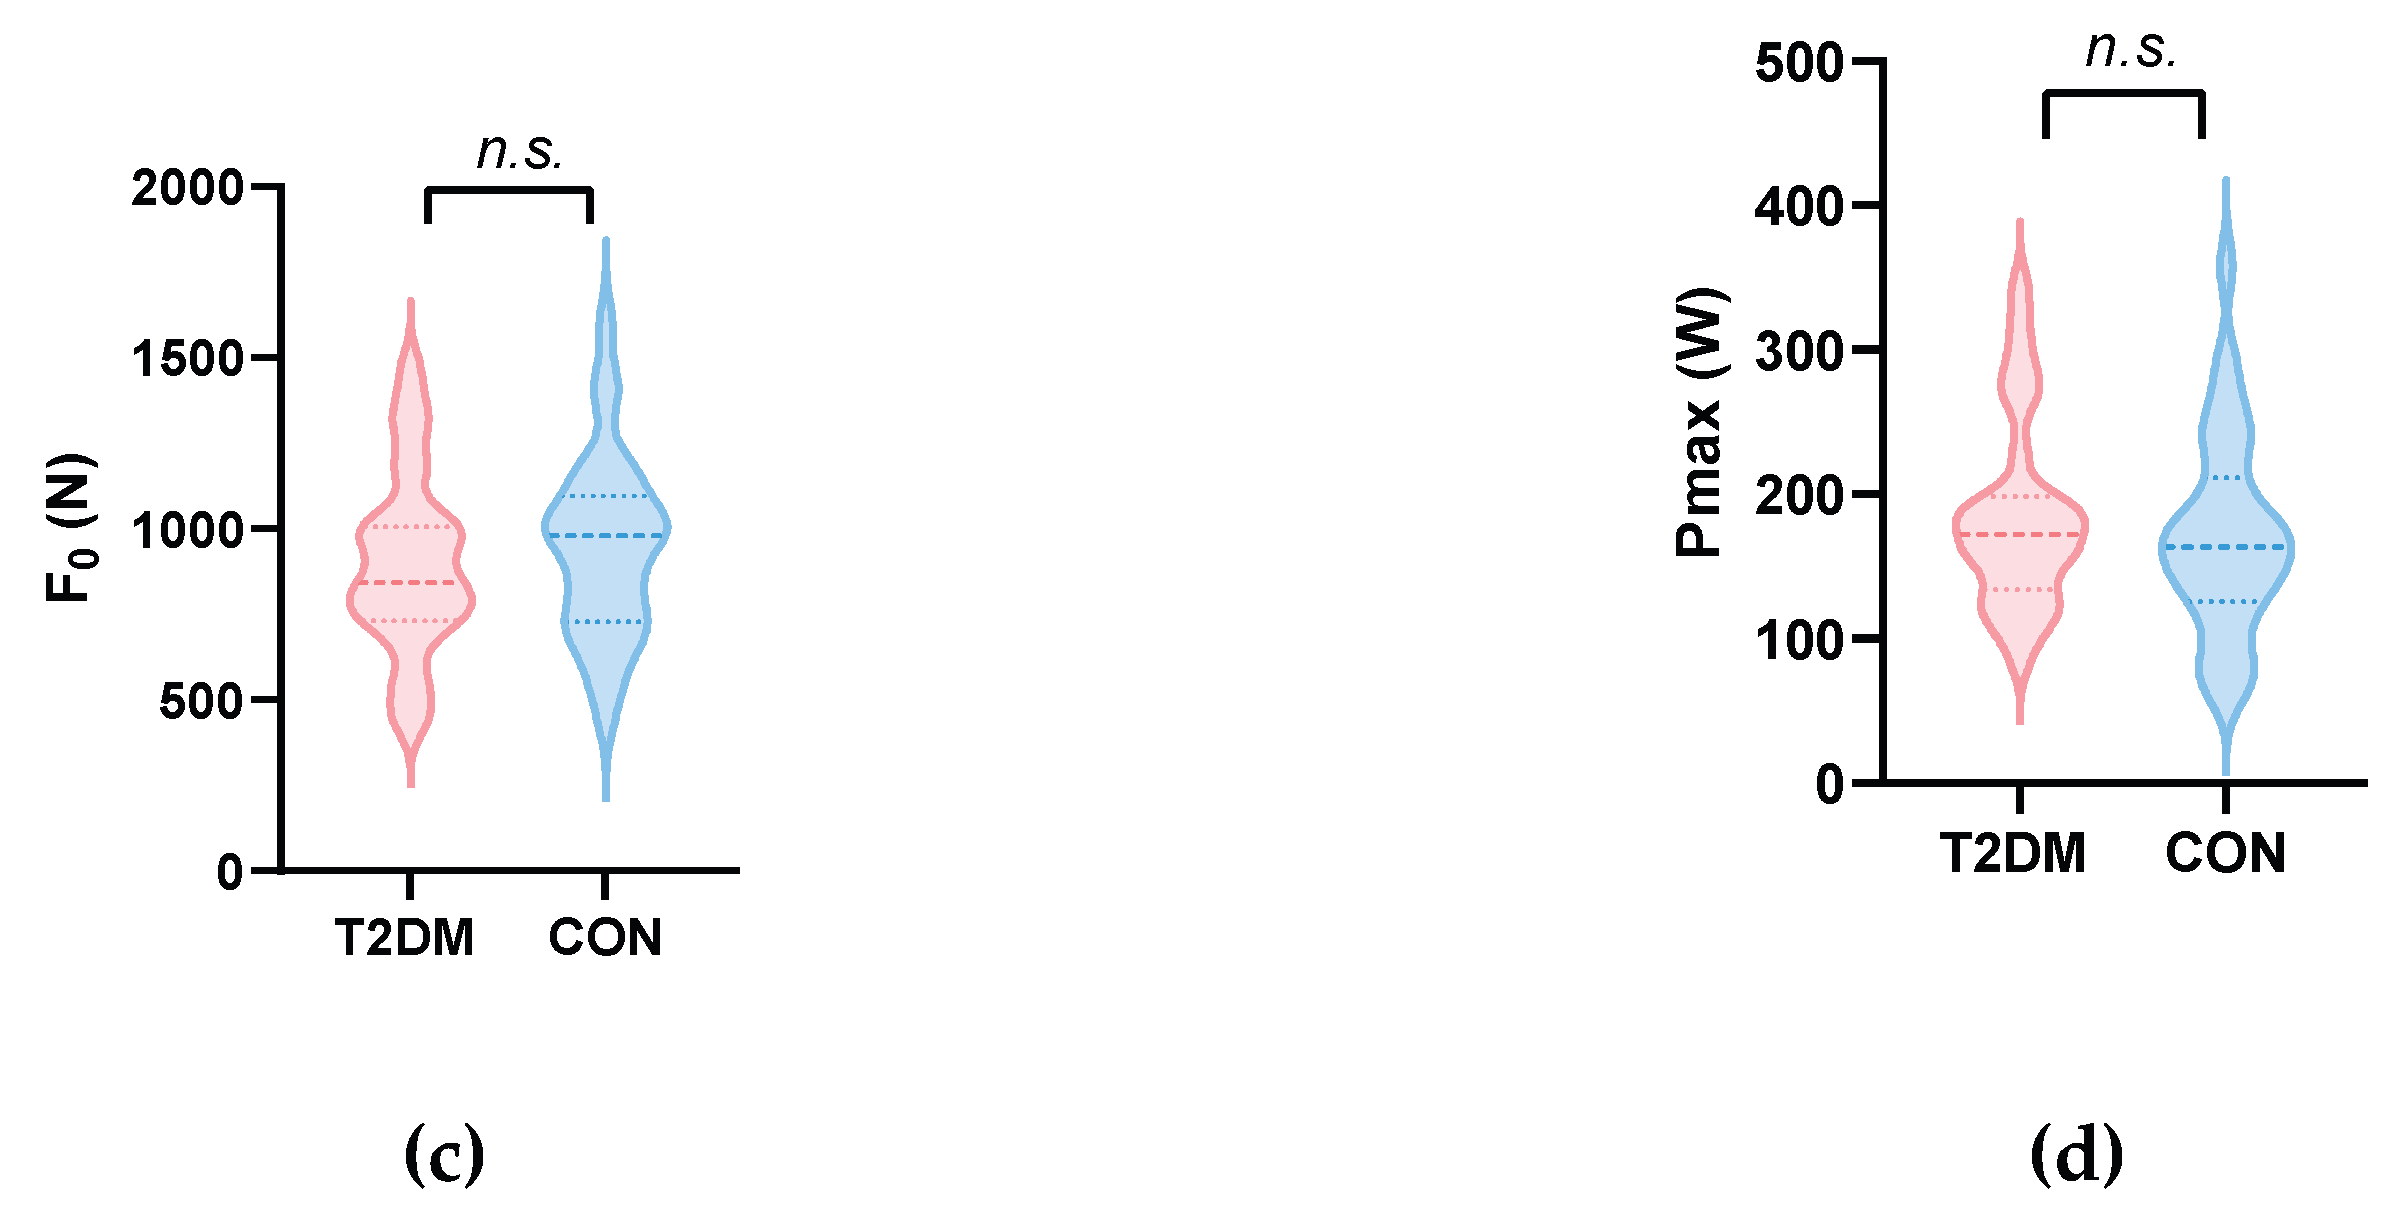
Figure 2.
Receiver operating characteristic (ROC) curves for differentiating older adults with T2DM from controls within the study sample. The combined model was based on predicted probabilities from a binary logistic regression model integrating relative STS power, HOMA-β, V0, and AND/GYN ratio. Relative STS power and Pmax were evaluated as individual markers. The diagonal dashed reference line represents the chance-level discrimination (AUC = 0.500). AUC: area under the curve; STS, sit-to-stand; V₀, theoretical maximal velocity; HOMA-β, homeostatic model assessment of β-cell function; Pmax, maximal power; AND/GYN ratio, android-to-gynoid ratio.
Figure 2.
Receiver operating characteristic (ROC) curves for differentiating older adults with T2DM from controls within the study sample. The combined model was based on predicted probabilities from a binary logistic regression model integrating relative STS power, HOMA-β, V0, and AND/GYN ratio. Relative STS power and Pmax were evaluated as individual markers. The diagonal dashed reference line represents the chance-level discrimination (AUC = 0.500). AUC: area under the curve; STS, sit-to-stand; V₀, theoretical maximal velocity; HOMA-β, homeostatic model assessment of β-cell function; Pmax, maximal power; AND/GYN ratio, android-to-gynoid ratio.
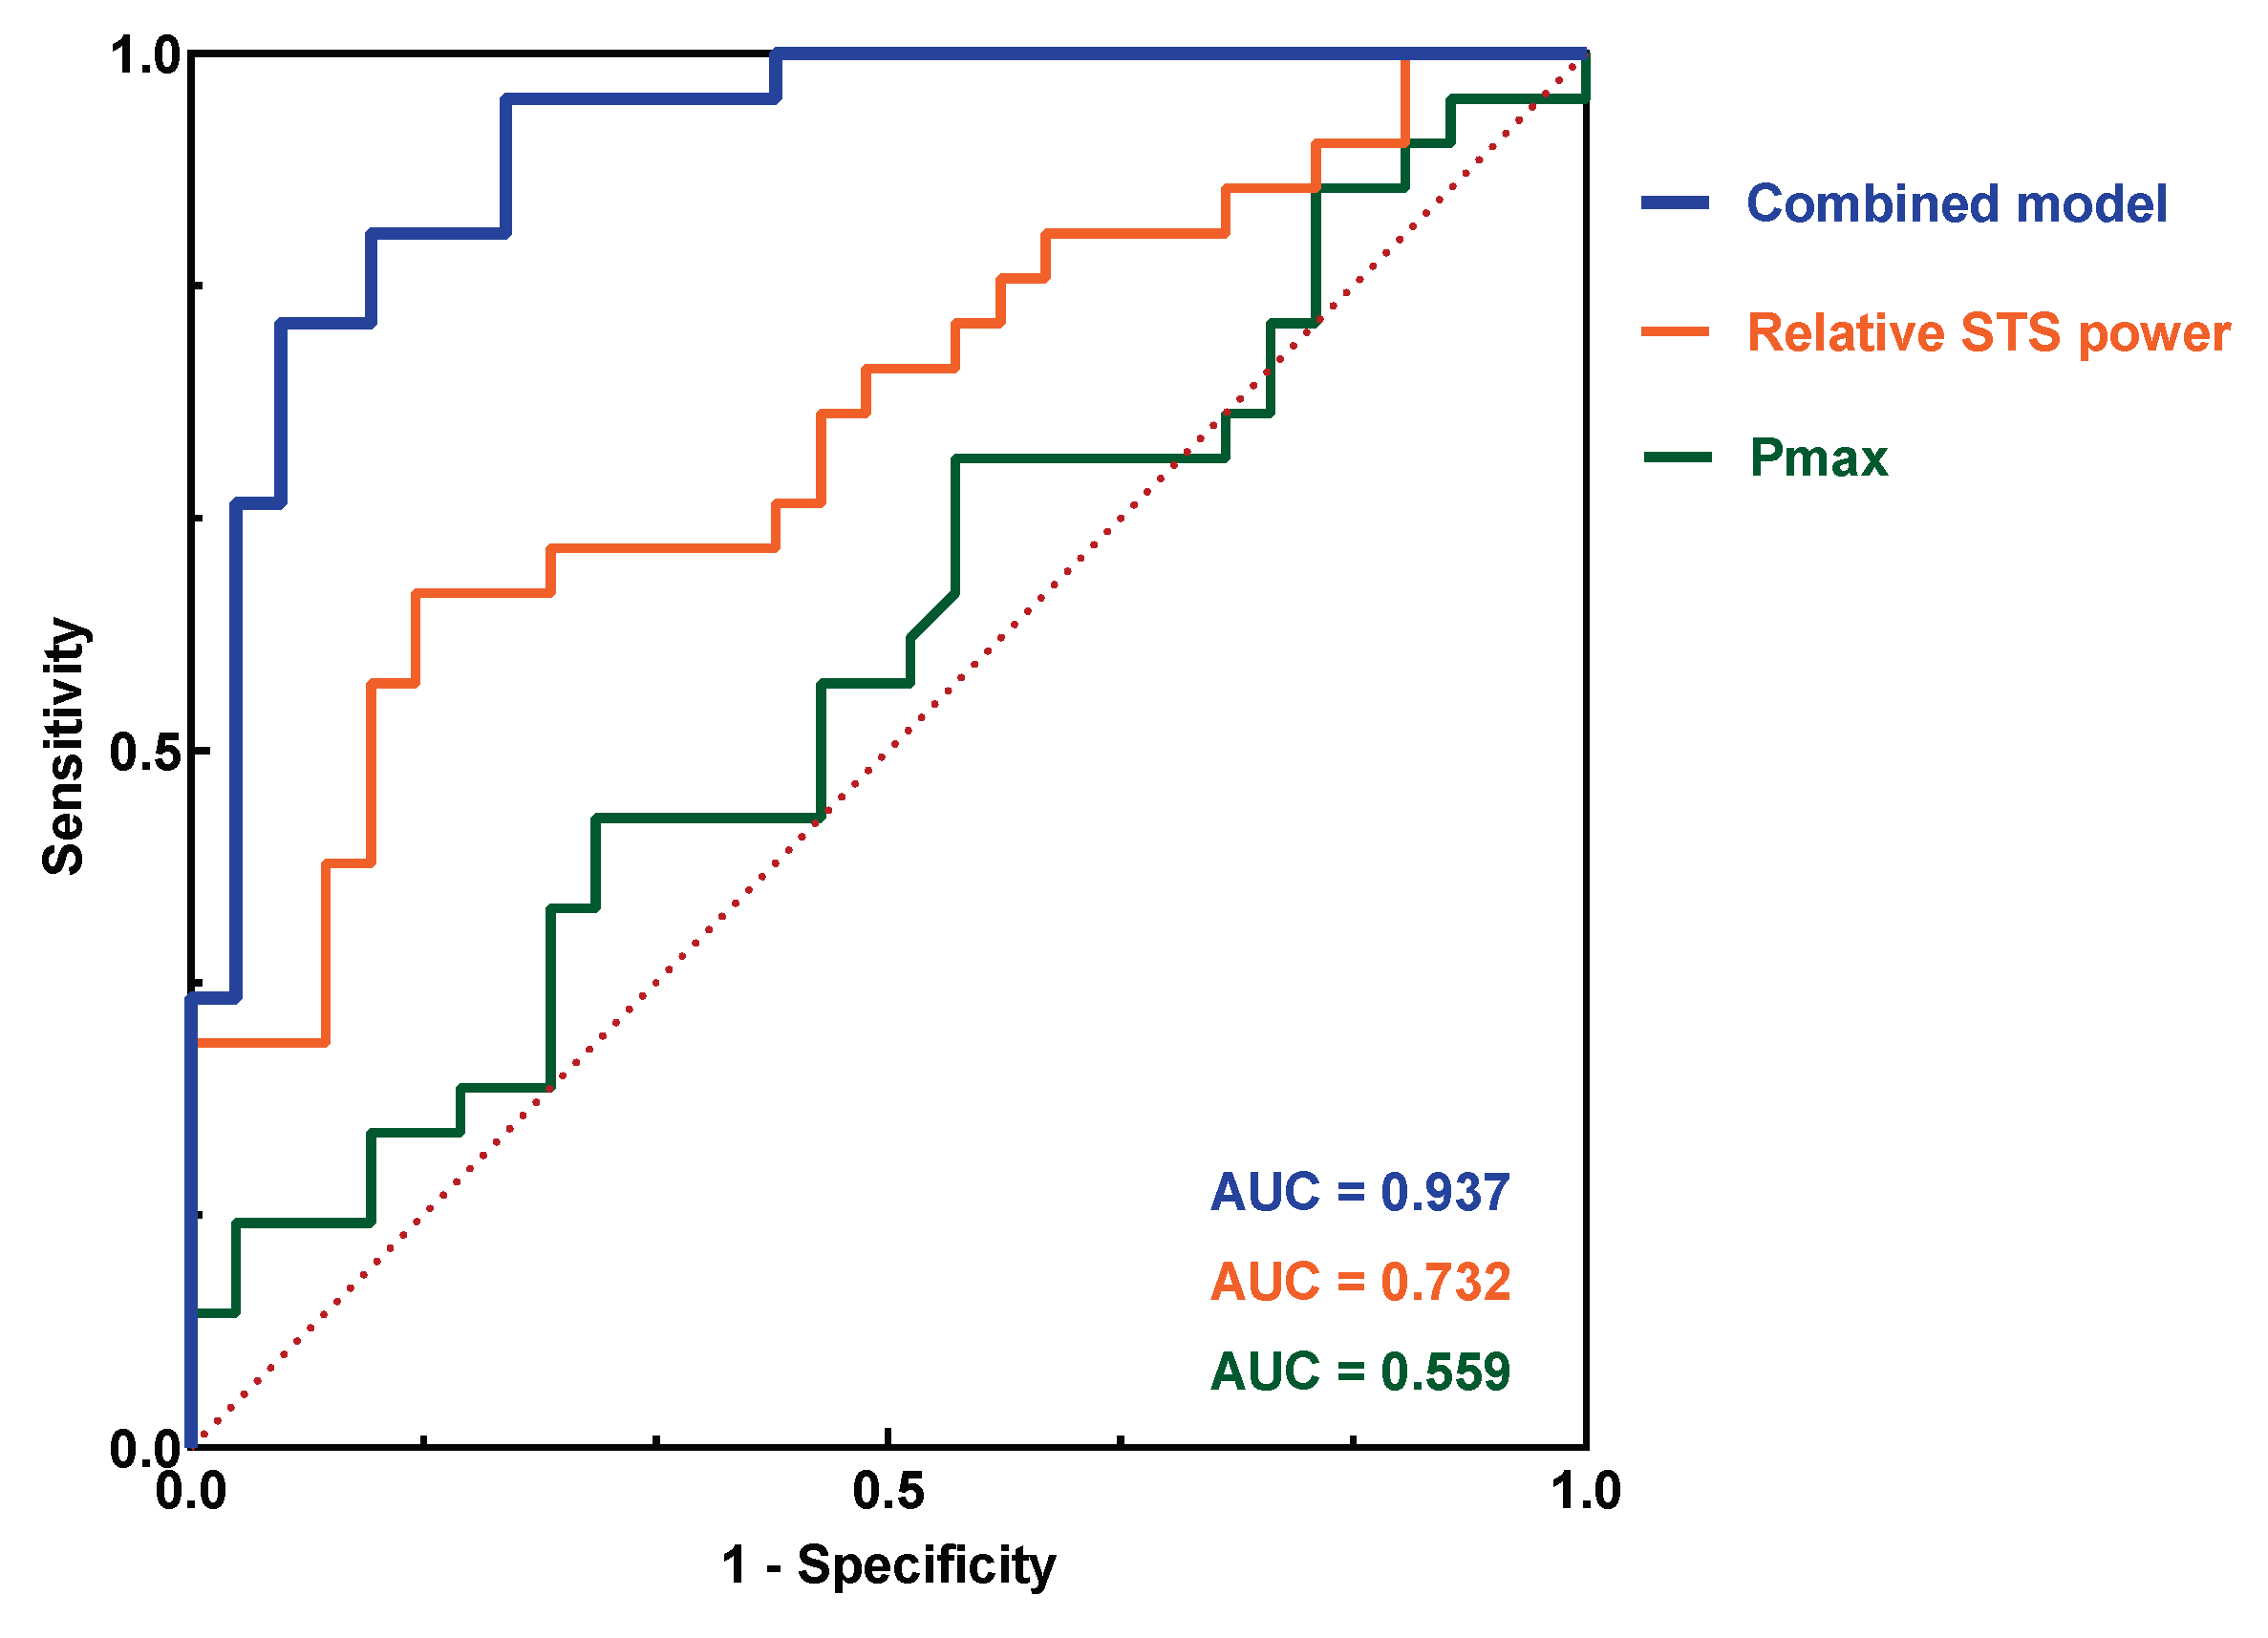

Table 1.
Participant characteristics.
| Variable | T2DM (n = 31) | CON (n = 31) | p |
|---|---|---|---|
| Age (years) | 72.8 ± 3.1 | 71.6 ± 2.3 | 0.130 |
| Sex (male/female) | 16 / 15 | 14 / 17 | 0.658 |
| BMI (kg/m²) | 29.5 ± 3.6 | 28.4 ± 3.8 | 0.234 |
| Married (n, %) | 21 (67.7) | 20 (64.5) | 1.000 |
| Higher education (n, %) | 5 (16.1) | 12 (38.4) | 0.082 |
| Antidiabetic medication use (n, %) | 26 (83.8) | - | - |
| Meeting WHO aerobic PA (n, %) | 31 (100) | 29 (93.5) | 0.492 |
Data are presented as mean ± standard deviation (SD) or n/N (%). BMI, body mass index; PA, physical activity; WHO, World Health Organization; Higher education, bachelor’s degree or above. WHO aerobic physical activity was defined as ≥150 min/week of moderate-to-vigorous activity. Independent t-tests were used for continuous data, and chi-square tests or Fisher’s exact tests were used for categorical data. Percentages were calculated using available data.
Table 2.
Physical function, STS-derived muscle power, and force–velocity profiling.
| Variable | T2DM (n = 31) |
CON (n = 31) |
p |
Cohen’s d |
|---|---|---|---|---|
| Physical function | ||||
| 5-STS (s) | 9.19 ± 2.60 | 7.31 ± 1.39 | 0.001** | 0.903 |
| SPPB-balance | 3.87 ± 0.43 | 3.84 ± 0.45 | 0.774 | 0.073 |
| 4m gait time (s) | 2.94 ± 0.44 | 2.87 ± 0.35 | 0.463 | 0.188 |
| SPPB total score | 11.55 ± 0.68 | 11.84 ± 0.45 | 0.052 | −0.504 |
| Handgrip (kg) | 28.61 ± 9.74 | 29.53 ± 9.64 | 0.712 | −0.094 |
| STS-derived muscle power | ||||
| STS Power (W) | 269.16 ± 101.90 | 342.01 ± 114.84 | 0.010* | −0.671 |
| Relative STS Power (W·kg−1) | 3.57 ± 1.11 | 4.51 ± 1.05 | 0.001** | −0.873 |
| Force–velocity profiling | ||||
| V0 (m/s) | 0.84 ± 0.27 | 0.71 ± 0.18 | 0.026* | 0.580 |
| F0 (N) | 898.86 ± 261.49 | 944.07 ± 262.30 | 0.499 | −0.173 |
| Vopt (m/s) | 0.42 ± 0.13 | 0.36 ± 0.09 | 0.026* | 0.580 |
| Fopt (N) | 449.43 ± 130.74 | 472.03 ±131.14 | 0.499 | −0.173 |
| F–V Slope (N·s/m) | −1182.73 ± 539.74 | −1372.62 ± 448.56 | 0.137 | 0.383 |
| Pmax (W) | 184.65 ± 65.15 | 170.93 ± 68.23 | 0.421 | 0.206 |
Values are presented as mean ± standard deviation (SD). Between-group comparisons were performed using independent-samples t-tests. SPPB, short physical performance battery; 5-STS, 5-times sit-to-stand test; STS Power, absolute sit-to-stand power; Relative STS Power, relative sit-to-stand power; V0, theoretical maximal velocity; Vopt, optimal velocity; F0, theoretical maximal force; Fopt, optimal force; Pmax, maximal power. * p < 0.05, ** p < 0.01, *** p < 0.001.
Table 3.
Body composition, metabolic, and biochemical parameters.
| Variable | T2DM (n = 31) |
CON (n = 31) |
p |
Cohen’s d |
|---|---|---|---|---|
| Body composition | ||||
| Leg lean mass (kg) | 14.04 ± 3.20 | 14.51 ± 3.72 | 0.591 | −0.137 |
| ALM (kg) | 18.92 ± 4.25 | 19.40 ± 5.13 | 0.693 | −0.101 |
| WB lean mass (kg) | 45.70 ± 9.01 | 46.20 ± 10.89 | 0.846 | −0.050 |
| Arm fat mass(kg) | 2.88 ± 0.86 | 3.36 ± 1.02 | 0.050 | −0.509 |
| Leg fat mass (kg) | 7.06 ± 2.91 | 9.17± 3.03 | 0.007** | −0.710 |
| Arm fat (%) | 36.71 ± 10.02 | 39.65 ± 9.94 | 0.251 | −0.294 |
| Leg fat (%) | 32.64 ± 9.94 | 37.50 ± 9.51 | 0.054 | −0.499 |
| AND/GYN ratio | 1.19 ± 0.21 | 1.06 ± 0.18 | 0.013* | 0.650 |
| Arm BMD (g/cm²) | 0.82 ± 0.13 | 0.70 ± 0.11 | < 0.001*** | 0.993 |
| Leg BMD (g/cm²) | 1.20 ± 0.17 | 1.04 ± 0.16 | < 0.001*** | 0.956 |
| Metabolic and biochemical parameters | ||||
| Hemoglobin (g/dL) | 14.04 ± 1.73 | 14.87 ± 1.03 | 0.027* | −0.578 |
| Urea (mg/dL) | 45.71 ± 11.71 | 38.55 ± 6.77 | 0.005** | 0.749 |
| ALT (U/L) | 23.73 ± 10.76 | 19.90 ± 4.42 | 0.073 | 0.468 |
| Glucose (mg/dL) | 123.71 ± 26.16 | 100.45 ± 11.23 | < 0.001*** | 1.155 |
| Insulin (µIU/mL) | 11.91 ± 6.89 | 18.56 ± 9.95 | 0.003** | −0.776 |
| HOMA-β | 76.75 ± 47.91 | 185.02 ± 95.57 | < 0.001*** | −1.432 |
| HOMA-IR | 3.82 ± 2.68 | 4.70 ± 2.73 | 0.205 | −0.325 |
Values are presented as mean ± standard deviation (SD). Between-group comparisons were performed using an independent samples t-test. ALM, appendicular lean mass; WB, whole-body; AND/GYN ratio, android/gynoid ratio; BMD, bone mineral density. ALT, Alanine transaminase; HOMA-IR, homeostatic model assessment of insulin resistance; HOMA-β, homeostatic model assessment of β-cell function. * p < 0.05, ** p < 0.01, *** p < 0.001.
Table 4.
Discriminant function characteristics for group differentiation.
| Indicator | Result | |
|---|---|---|
| Predictors included | relative STS power, HOMA-β, V0, AND/GYN ratio | |
| Wilks’ Λ | 0.508 | |
| χ² (df) | 39.313 (4) | |
| p value | < 0.001 | |
| Eigenvalue | 0.970 | |
| Canonical correlation | 0.702 | |
| Original overall accuracy (%) | 80.6 | |
| Leave-one-out cross-validated accuracy (%) | 79.0 | |
| Structure coefficients | ||
| HOMA-β | 0.739 | |
| Relative STS power | 0.451 | |
| V₀ | −0.300 | |
| AND/GYN ratio | −0.336 | |
Note: The discriminant model included four selected markers: relative STS power, HOMA-β, V₀, and AND/GYN ratio. Structure coefficients represent pooled within-group correlations between each variable and the discriminant function. Classification accuracy is presented for both the original classification and leave-one-out cross-validation. This exploratory analysis was used to characterize group separation within the study sample. STS, sit-to-stand; V₀, theoretical maximal velocity; HOMA-β, homeostatic model assessment of β-cell function; AND/GYN ratio, android-to-gynoid ratio.
Disclaimer/Publisher’s Note: The statements, opinions and data contained in all publications are solely those of the individual author(s) and contributor(s) and not of MDPI and/or the editor(s). MDPI and/or the editor(s) disclaim responsibility for any injury to people or property resulting from any ideas, methods, instructions or products referred to in the content. |
© 2026 by the authors. Licensee MDPI, Basel, Switzerland. This article is an open access article distributed under the terms and conditions of the Creative Commons Attribution (CC BY) license (http://creativecommons.org/licenses/by/4.0/).
Copyright: This open access article is published under a Creative Commons CC BY 4.0 license, which permit the free download, distribution, and reuse, provided that the author and preprint are cited in any reuse.


