

Submitted:
25 June 2026
Posted:
26 June 2026
You are already at the latest version
Abstract
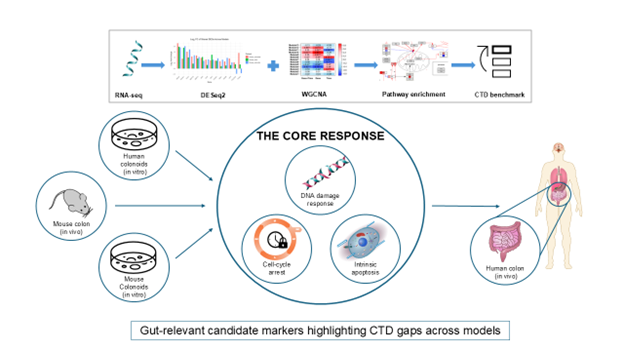
Animal models are standard for safety evaluation, yet physiological differences limit human translation. Doxorubicin (DOX), a chemotherapeutic, can cause off-target gastrointestinal (GI) toxicity and treatment discontinuation. This study evaluated human colonoids as a potential human-relevant epithelial model for DOX-induced GI toxicity by comparing transcriptomic responses across human colonoids, mouse colonoids, and male C57BL/6J mouse colon tissue. Within each dataset, DOX-treated conditions were pooled across model-specific exposure levels and time points to prioritize robust DOX-associated transcriptional signatures. Using a parallelogram approach, differential expression, co-expression, pathway mapping, and Comparative Toxicogenomics Database (CTD) benchmarking were applied to compare model concordance and identify DOX-responsive mechanisms. Shared responses converged on cell-cycle regulation, DNA damage response, DNA repair, and apoptosis. DEG-level concordance was highest between mouse colonoids and mouse colon, while pathway mapping showed similarities between colonoid systems. A core set of p53-associated genes, including BAX, INKA2, and ZMAT3, was shared across datasets, with additional apoptotic and DNA damage response features observed in colonoids. CTD benchmarking supported DOX biology and highlighted underrepresented GI-relevant signals, indicating gaps in intestinal toxicogenomic annotations. Colonoid-based transcriptomics supports human colonoids as controlled epithelial models for mechanistic GI toxicity assessment, although missing vascular, immune, and systemic context means clinical validation remains necessary.
Keywords:
gastrointestinal toxicity
; doxorubicin
; intestinal organoids
; transcriptomics
; new approach methodologies
1. Introduction
Animal models have been used consistently to assess drug toxicity and efficacy [1], serving as a critical tool in biomedical research. These models have been instrumental not only in advancing our understanding of disease mechanisms and biological processes but also in evaluating the therapeutic potential and safety of new treatments. Despite these advancements, physiological and genetic variations, especially in immune system organization and organ-specific toxicity, limit the translation of animal model findings to humans [2,3]. For instance, the immune system of rodents varies considerably from that of humans, and their accelerated metabolic rates may complicate the accurate prediction of human drug-toxicity outcomes [4]. These interspecies differences may hinder the effective translation of drug toxicity results from animal to human scenarios. These limitations, along with ethical concerns about animal experimentation highlight the need for alternative approaches that can predict human responses without animal testing [5,6].
To address these challenges, global initiatives are advancing New Approach Methodologies (NAMs) within Next Generation Risk Assessment (NGRA) frameworks [7]. NAMs integrate advanced in vitro systems, computational modeling, multi-omics data, and predictive machine learning approaches to generate human-relevant evidence for decision-making [8,9,10,11,12,13]. Within this framework, in vitro models are a cornerstone, offering physiologically relevant platforms for studying human biology in controlled environments. Over the years, several in vitro models have been developed to mimic the physiological conditions of human tissues [14]. Two-dimensional (2D) cell cultures are widely used due to their simplicity and cost-effectiveness but have several limitations; they lack the natural 3D tissue architecture, which is critical for replicating complex cell-cell and cell-matrix interactions. For instance, 2D cultures fail to reproduce the structural and cellular complexity of the native tissues, limiting their capability to model tissue-specific responses to drugs or toxicants [15]. Additionally, changes in cell division and morphology in 2D cultures may alter gene expression and cell behavior, as they lack the structural complexity of in vivo environments [16]. Therefore, various three-dimensional (3D) models have been developed to overcome these limitations [17]. These 3D models include spheroids, which are clusters of cells that mimic early-stage tissue organization [18,19]; organoids, which are 3D structures derived from stem cells or primary cells to replicate organ-specific architecture and functions [20,21] and co-cultures, which involve cultivation of multiple cell types to simulate cellular interactions in the tissue microenvironment [22]. The current study adopts organoids, which may better mimic the physiological and functional characteristics of human in vivo tissue compared with 2D cultures [23,24]. Human organoids represent a major advancement in the modeling of human biology [14,25]. These advancements in 3D culture systems have opened new avenues for studying complex drug responses [20,26].
Treatment with chemotherapeutics can often lead to off-target adverse effects [27], such as gastrointestinal (GI) toxicities [28], which may result in discontinuation of treatment. Chemotherapy-induced intestinal mucositis (CIM) is a serious complication in patients undergoing chemotherapy and is marked by inflammation-driven breakdown of the intestinal epithelium. CIM has been linked to off-target GI toxicities including nausea, vomiting, diarrhea, and abdominal pain [29,30,31,32], affecting up to 40% of patients and contributing to decreased quality of life and tolerance to treatment [29,30,33,34]. Despite the high incidence of GI toxicities induced by chemotherapeutics, this area remains underinvestigated compared with extensively studied liver and kidney toxicities. Liver and kidney models are heavily studied because these organs are central to drug metabolism and excretion. Animal studies often fail to capture human-specific responses, such as adverse GI effects induced by chemotherapeutics like doxorubicin (DOX) [28,35]. Colon organoids (also referred to as colonoids) offer a more direct portrayal of normal intestinal physiology than mouse models [36]. In this study, human colonoids were evaluated as a human-relevant alternative to mouse models using DOX-induced GI toxicities as a case study. Colonoids provide a human-relevant, controlled model for studying DOX-induced GI toxicity and are likely to mirror human-specific gastrointestinal responses more accurately than traditional animal models.
We used DOX exposure as an example to demonstrate how species-specific differences between human and mouse models can lead to variations in drug-induced adverse GI toxicities. This was investigated through transcriptomic analysis of three models: mouse colon tissue (mouse in vivo), mouse colonoids (mouse in vitro) and human colonoids (human in vitro) using the parallelogram approach in toxicology. The parallelogram approach is a framework in toxicology used to extrapolate human in vivo responses by comparing data from animal in vivo, animal in vitro, and human in vitro models [37]. Using this approach, we aimed to answer two key research questions: (i) How well do mouse in vitro models mimic the mouse in vivo response? (ii) How closely does the human in vitro model align with the mouse in vivo and in vitro models? To address these questions, we hypothesized that mouse colonoids would retain epithelial transcriptional responses that are comparable to those observed in mouse colon after DOX exposure. We further hypothesized that human colonoids would provide an epithelial response profile for identifying model- and species-dependent differences. Together, this comparative framework was used to identify conserved and model-specific DOX-responsive mechanisms that can guide future validation against human clinical or biopsy-derived intestinal data.
2. Results
2.1. Transcriptomic Changes Induced in Human and Mouse Models
This study aimed to compare doxorubicin (DOX)-induced transcriptomic responses across human colonoids, mouse colonoids, and mouse colon within a shared analytical framework. RNA-sequencing (RNA-seq) datasets from all models were processed using the Omics Data Analysis Framework for Regulatory Application (R-ODAF) pipeline. Differential expression analysis and weighted gene co-expression network analysis (WGCNA) were applied independently to each dataset, followed by pathway analysis and cross-referencing against the Comparative Toxicogenomics Database (CTD). Figure 1 provides an overview of the study design and workflow.
To characterize the transcriptional responses to DOX, differential gene expression analysis was performed on human colonoids, mouse colonoids, and mouse colon (Figure 2A) to identify differentially expressed genes (DEGs; false discovery rate [FDR] < 0.01). Prior to differential expression analysis, principal component analysis (PCA) was performed separately for each dataset to evaluate transcriptional structure and sample variability (Figure S1). In all models, the first principal component (PC1) distinguished DOX-treated from control samples, indicating that treatment accounted for the largest source of expression variance, with dose and time contributing secondary sources of within-group variation. Consistent with this pattern, dose and time were aggregated, and the analysis prioritized DEGs that exhibited robust transcriptional changes and minimized variability due to exposure duration and dose. A total of 564 DEGs were identified in human colonoids, 1,120 in mouse colonoids, and 975 in mouse colon (Figure 2A, File S1). Across all three datasets, 14 DEGs were identified (Figure 2A and Figure S2A), including BAX, INKA2, PCNA and POLR2H. The majority of these 14 shared genes showed similar expression direction except for PCNA and POLR2H, which were downregulated in mouse colonoids and upregulated in the other two models. A comprehensive overview of the shared differentially expressed genes (DEGs) across all three models is provided in Table 1.
To assess concordance at the gene level, expression trends of overlapping DEGs were analyzed across datasets to identify patterns of directional agreement or divergence (Figure 2B, Figure S2B-D). The highest directional concordance was observed between mouse colon and mouse colonoids (88.2%; Figure S2C), suggesting substantial transcriptional similarity between the in vitro and in vivo mouse systems. A lower but still substantial concordance was found between human and mouse colonoids (78.2%, Figure S2B), whereas human colonoids and mouse colon showed the lowest concordance in gene expression direction (Figure S2D), with just 67.9% of overlapping genes exhibiting the same expression change. Several overlapping DEGs showed inverse regulation between models. For example, PCNA and SLC7A11 were upregulated in human colonoids but downregulated in mouse colonoids. Similarly, RAD51 and RRM2 were downregulated in human colonoids and upregulated in mouse colon, underscoring a model-dependent transcriptional response to DOX. Detailed gene-level lists of overlapping DEGs, including directionality across model pairs, are provided in File S1.
2.2. Identification of Significant WGCNA Module Genes
To identify clusters of co-expressed genes responsive to DOX treatment, WGCNA was applied to each dataset to detect modules that were significantly associated with dose and time. Gene significance was determined by the correlation of each gene’s expression profile with the observed traits. In total, three significant modules were identified in human colonoids and five each in mouse colonoids and mouse colon based on p-value < 0.01 (Figure S3A-C).
Following module detection, genes from all significant modules in each dataset were aggregated to form a comprehensive gene set for further analysis. A total of 1,305 genes from human colonoids, 3,108 from mouse colonoids, and 1,951 from mouse colon were identified. A complete overview of the number of DEGs and genes per significant module is provided in Table S2. In addition, a pairwise Jaccard overlap analysis was conducted, in which each significant module from one dataset was compared with all modules in the other datasets (Figure S4) to quantify gene-set overlap. The highest similarity appeared within the mouse models, with a peak value of 0.11 between mouse colonoid Module 8 and mouse colon Module 15. By contrast, the overlap between mouse and human colonoids was low (maximum J < 0.05), and the overlap between mouse colon and human colonoids was likewise limited (J = 0.04), indicating few shared genes in the cross-species comparison.
2.3. Pathways Identified Through DEG and WGCNA Gene Sets
Pathway analysis was performed on both DEGs and gene sets derived from significant WGCNA modules (File S1), using an adjusted p-value < 0.05 to define significance. DEG-based enrichment identified 30 significant pathways in human colonoids, 56 in mouse colonoids, and 19 in mouse colon (Table S3), revealing both shared and model-specific responses. Pathways related to cell cycle regulation, DNA damage, and DNA repair were enriched in all three models, reflecting activation of functionally similar pathways in response to DOX despite differences among systems. Pathway analysis on gene sets derived from significant modules yielded 10 pathways in human colonoids, 54 in mouse colonoids and 52 in mouse colon. Similarly, processes related to cell cycle, DNA damage response, and DNA repair that were enriched among DEGs, were also significant in WGCNA pathways.
Within each dataset, the overlap between DEG- and WGCNA-based enrichment comprised 4 pathways in human colonoids, 17 in mouse colonoids and 8 in mouse colon. Notably, the overlapping pathways in all three models converged on processes involved in DNA damage, including the p53 signaling cascade, miRNA regulated DNA damage response, and encompassed cell-cycle regulation and DNA-repair mechanisms, illustrated by cell-cycle checkpoint control, cell-cycle arrest, and DNA mismatch repair.
2.4. Gene-Level Mapping to DOX-Related Pathways
Comparison of enriched pathways across human colonoids, mouse colonoids and mouse colon provided a framework for mapping genes of interest (GOIs) which included DEGs and WGCNA module genes. These GOIs were mapped to the identified processes (cell cycle regulation, DNA damage response, DNA repair, and programmed cell death) to capture DOX-driven changes at the model level and their relevance to gut-specific toxicity. Most GOIs mapped to these processes were unique to each dataset, indicating model-specific transcriptional changes in response to DOX exposure.
2.4.1. Cell Cycle Arrest and Programmed Cell Death
A substantial number of GOIs from each dataset were mapped to the cell-cycle pathway (Figure 3A), with DNA-damage checkpoint components consistently represented across all models. CDKN1A (p21), a checkpoint effector and MDM2, regulator of p53, were present in both human and mouse colonoids and were upregulated in each. Atr and Chk1 were shared by the two mouse datasets but showed opposite gene expression directionality, being upregulated in mouse colon and downregulated in mouse colonoids indicating model-specific regulation of these kinases. The majority of genes common within the mouse systems likewise displayed opposite regulation. For example, Cdc16, (a subunit of the anaphase-promoting complex) was elevated in mouse colonoids but suppressed in mouse colon, whereas origin-licensing factors (e.g., Mcm2, and Mcm4) followed an inverse pattern, being upregulated in mouse colon and down regulated in mouse colonoids.
To determine how DOX shapes programmed cell-death pathways in each model, GOIs were also mapped onto the apoptosis pathway (Figure 3B). The pathway mapping revealed that most of the genes mapped exclusively to a single model. BAX, a pro-apoptotic BCL-2 family effector, was the only gene common to all three datasets and was uniformly upregulated, indicating a shared intrinsic mitochondrial death response to DOX across the models. By contrast, the death receptor gene FAS appeared only in the human colonoids, where it was upregulated, pointing to a human-specific activation of the extrinsic apoptotic route. MDM2, also identified in the cell cycle pathway, was present in both colonoid models and was upregulated. TP53, also mapped to the cell-cycle pathway (Figure 3A), was detected in the apoptosis pathway in human colonoids, reflecting p53’s central role in coordinating cell cycle arrest and apoptotic execution after DOX exposure. Map2k4 was the only apoptosis-related gene common to the mouse models, and no other apoptosis-related genes overlapped within the mouse systems. By contrast, genes shared between the two colonoid models displayed the same directionality of expression (Figure 3B).
2.4.2. DNA Damage Response and Repair
Overlaying the GOIs on the DNA damage response (DDR) pathway (Figure 4) revealed only two genes, BAX and CCND1, shared by all three models. The remaining genes were largely model specific. Among the genes common to both mouse colon and colonoids, expression patterns were consistently opposite. For example, Brca1 and Cdk4 were upregulated in mouse colon and downregulated in mouse colonoids, and the checkpoint kinase Atr followed the same inverse trend, indicating divergent regulation of DNA repair and checkpoint signaling between the in vivo tissue and its organoid counterpart. In contrast, RRM2B and the previously noted cell-cycle regulators MDM2, and CDKN1A (Figure 3A) were all upregulated in both colonoid datasets (Figure 4). Human colonoids also displayed several unique DDR genes, including FAS and SESN1, which are associated with p53-driven repair and stress-response pathways not found in mouse models.
In addition to DDR pathways, the GOIs were mapped to the DNA repair pathways (Figure S5). Mapped DNA-repair genes were both model-specific as well as sporadically overlapping. Genes shared between mouse colon and mouse colonoids displayed opposite gene expression except for a few genes such as Mgmt and Polk, showing upregulation across the two systems. Similarly, genes common between human and mouse colonoids showed concordant regulation, consistent with the patterns observed in earlier pathways.
2.5. CTD Validation of Model-Derived Genes
To further contextualize the model-derived signatures, overlapping genes from the DEG and WGCNA analyses were queried in the Comparative Toxicogenomics Database (CTD), linking the transcriptomic findings to curated chemical-gene interaction data (File S1) and allowing assessment of their prior documentation in the context of DOX exposure. The resulting comparison showed that cross-referencing of the overlapping DEGs and WGCNA genes against CTD revealed that 60.2% of human colonoid genes had prior CTD annotations for DOX, in contrast to 48.6% in mouse colonoids and 47.5% in mouse colon (Figure 5A). Both mouse models displayed a similar number of DOX-interacting genes compared to human colonoids, yet their larger gene sets lowered their relative CTD coverage. Notably, a substantial proportion of model-derived genes, totaling 619 unique genes identified through an SQL query, (645 when summed across models in Figure 5A), were not present in the CTD interaction dataset used (File S1), suggesting novel or underreported DOX-response signals with model- or intestinal-context specificity. Figure S6A-C highlights the top five upregulated and downregulated genes lacking CTD annotation in each dataset. In human colonoids, the most upregulated genes included EFCAB10, HRNR and the most downregulated genes included PADI1, KIF24. In mouse colonoids, Cox6b2, Dsg3 showed the greatest upregulation and Ooep and Retnlb were the most downregulated. In mouse colon, Ddit4l, and Mmp7 were the most upregulated genes, whereas Wdfy4 and Hla-Dob were the most downregulated genes.
2.5.1. Directionality Concordance with CTD
To further benchmark model-derived transcriptional changes against the literature, CTD’s curated “increase/decrease” annotations for doxorubicin-gene interactions were used as reference. Comparing CTD’s directional annotations with the GOIs indicated 43.5% concordance in human colonoids, 46.6% in mouse colonoids, and 35% in mouse colon, revealing distinct levels of concordance between human and mouse models (Figure 5B). Here “Match” denotes genes whose CTD-reported effect agrees with the observed up/down regulation, “Mismatch” represents the genes whose CTD annotation is opposite to our observed gene expression, and “Ambiguous” denotes genes for which CTD’s interaction terms do not clearly specify directionality. The proportion of mismatched genes was highest in mouse colon (46.1%) and lowest in human colonoids (37.3%). Ambiguous CTD annotations made up approximately 15 to 20% of the overlapping genes list across the three datasets. This comparison illustrates how model-specific expression aligns with curated knowledge, identifying both conserved responses and model-dependent variations.
3. Discussion
In this study, human colonoids were evaluated as a potential human-relevant, epithelium-focused in vitro model for gastrointestinal (GI) toxicity using doxorubicin (DOX), and transcriptomic responses were compared across human colonoids, mouse colonoids, and mouse colon in a parallelogram framework. GI adverse effects are common among chemotherapy recipients and can limit therapeutic dosing and overall treatment success [33]. Because exposure designs were not fully matched (mouse colon included a 6 h time point and two bolus doses, whereas colonoids were first sampled at 24 h under continuous exposure), analyses were pooled across time and dose and cross-model differences should be interpreted accordingly. This pooling strategy prioritized robust DOX-associated transcriptional signatures for cross-model comparison rather than dose- or time-specific dynamics. Mouse colon profiles were generated from mucosal scrapings, whereas colonoids represent an epithelial-only compartment, providing complementary tissue- and epithelium-resolved views of the DOX response and likely contributing to observed cross-model differences.
Differential expression and co-expression network analyses captured both gene-level and coordinated responses to DOX, including conserved cytotoxic programs shared across datasets and model- or species-specific signatures. The strongest DEG overlap was observed between mouse colon and mouse colonoids, with high directional concordance (88.2%; Figure S2C), suggesting that mouse colonoids capture components of the DOX-responsive transcriptional program observed in mouse colon. By contrast, the lowest concordance was observed between the shared DEGs between human colonoids and mouse colon at 67.9% (Figure S2D). Several genes displayed inverse regulation within the mouse systems, including Psat1 and Hspb1 (File S1). Hspb1 encodes a small heat-shock protein whose phosphorylation regulates cytoskeleton recruitment and cell motility [38]. Its upregulation in mouse colon and downregulation in mouse colonoids suggests a protective chaperone response to DOX-induced stress that may be less represented in the organoid model.
Comparison of human and mouse colonoids revealed several shared genes with inverse regulation, including PCNA and SLC7A11 (File S1). SLC7A11, the cystine/glutamate antiporter that supports glutathione synthesis, was downregulated in human colonoids but upregulated in mouse colonoids, suggesting greater susceptibility to DOX-induced oxidative stress in human colonoids and a potential stress-adaptive response in mouse colonoids. Inverse regulation was also observed between human colonoids and mouse colon, including RRM2 and RAD51. RRM2 encodes a subunit of ribonucleotide reductase and was strongly downregulated in human colonoids but only modestly increased in mouse colon, consistent with reduced DNA synthesis capacity and greater DOX sensitivity in the human model. RRM2 is frequently overexpressed in cancer cells, and its inhibition has been reported to enhance anticancer activity [39]. These patterns can alter how DOX-triggered pathways unfold in each system and highlight the importance of which genes are engaged, as well as their direction and magnitude of expression.
Differential gene expression analysis identified 14 genes shared across human colonoids, mouse colonoids, and mouse colon, representing a minimal conserved DOX response enriched for p53-linked DNA damage and apoptosis programs (Table 1, Figure 2A and Figure S2A). BAX, a pro-apoptotic effector, was upregulated in all three models, consistent with p53-dependent intrinsic apoptosis activation [40]. INKA2, a direct p53 target [41], was also consistently upregulated, supporting conserved growth inhibition following DNA damage [42]. In contrast, PCNA and POLR2H were downregulated in mouse colonoids but upregulated in human colonoids and mouse colon, with PCNA showing the strongest increase in human colonoids. WGCNA identified DOX-responsive modules, with greater overlap between mouse colon and mouse colonoids than between mouse and human colonoids. Pairwise Jaccard indices (Figure S4) indicated limited cross-model similarity overall, with no comparison exceeding 0.11 (11% gene-set overlap), consistent with the DEG-based concordance.
Enrichment of DEGs and significant WGCNA modules converged on cell-cycle checkpoints, p53-mediated apoptosis, and DNA repair, highlighting conserved DOX toxicity biology. Genes of interest (GOIs), defined as the intersection of DEGs and significant WGCNA genes, were mapped to cell-cycle, apoptosis, DNA damage response and DNA repair pathways (Figure 3A, 3B, 4, and S5) to compare model- and species-specific pathway-level gene shifts.
DOX exposure activated cell-cycle checkpoint pathways across models (Figure 3A). In both human and mouse colonoids, the p53 targets CDKN1A and MDM2 were upregulated, and TP53 was elevated in human colonoids, consistent with p53-dependent G1/S control and pathway engagement [43,44,45]. In contrast, the checkpoint kinases Atr and Chk1 showed upregulation in mouse colon and downregulation in mouse colonoids, suggesting model-specific replication stress handling [46]. Replication-licensing factors (Mcm2, Mcm4) followed the same pattern, with upregulation in mouse colon and downregulation in mouse colonoids. Elevated Mcm2 has been linked to increased DOX sensitivity in cancer cells [47], consistent with a more proliferative and potentially DOX-vulnerable state in mouse colon versus cell-cycle exit and reduced sensitivity in mouse colonoids.
Apoptosis pathway mapping indicated DOX-induced programmed cell death across models with species- and model-specific features (Figure 3B). BAX, a core effector of intrinsic apoptosis [40,48] was upregulated in all three systems, and its consistent induction supports a p53-linked intrinsic apoptotic response to DOX in both species [45]. Beyond this core, apoptosis programs diverged. FAS was detected only in human colonoids and was upregulated, consistent with death-receptor (extrinsic) signaling. MDM2 was upregulated in both colonoid models, whereas TP53 mapped to apoptosis only in human colonoids, suggesting stronger p53 coupling to apoptotic execution in the human system. Map2k4 was the only apoptosis gene shared between mouse colon and mouse colonoids, implicating stress-activated Mkk4–Jnk/p38 signaling in murine responses. Directionality among apoptosis genes shared between human and mouse colonoids was concordant.
Analysis of the DNA damage response (DDR) pathway showed distinct regulatory signatures (Figure 4). In human colonoids, downregulation of CCNB1 and CCNB2 indicated G2/M checkpoint arrest, while upregulation of FAS, TNFRSF10B, and PID1 supported engagement of extrinsic apoptosis. Both colonoid models mapped MDM2 and CDKN1A to p53 pathway activation, but only human colonoids engaged RRM2B, DDB2, and SESN1 together, consistent with a broader p53-dependent repair program. Mouse colonoids showed Rrm2b upregulation with Ddb2 downregulation, whereas mouse colon did not display a strong repair signature. Homologous recombination factors also differed, with RAD51 downregulated in human colonoids and Brca1 downregulated in mouse colonoids, while both were upregulated in mouse colon. BAX was also upregulated in DDR across all models (Figure 4), supporting conserved intrinsic apoptosis engagement. TP53 and CASP1 were elevated only in human colonoids, whereas Map3k1 and Map2k4 were upregulated only in mouse models, indicating species-specific stress-signaling routes. Overall, GOIs showed the most consistent overlap and directionality between human and mouse colonoids, with lower overlap and greater divergence versus mouse colon.
To benchmark biological relevance, GOIs were cross-referenced against the Comparative Toxicogenomics Database (CTD) for DOX interactions. Human colonoids showed the highest coverage, with 60.2 % of GOIs annotated for DOX, compared with 48.6 % in mouse colonoids and 47.5 % in mouse colon (Figure 5A). The mouse models had similar absolute counts of the CTD listed genes, yet their larger GOI counts lowered the proportional coverage. This likely reflects limited curation of murine data in CTD rather than biological absence.
Several DOX-responsive genes were not listed in CTD yet have plausible roles in gastrointestinal physiology and barrier function. In human colonoids, HRNR and PADI1 were among the most dysregulated genes (Figure S6A). HRNR, a cornified envelope–associated protein with antimicrobial domains [49], was strongly upregulated, consistent with stress-induced barrier reinforcement and suggesting potential as a marker of epithelial integrity under toxicant insult. Whether strong HRNR induction also reflects altered epithelial barrier properties (e.g., permeability or remodeling) warrants targeted functional follow-up.
PADI1 encodes peptidyl arginine deiminase 1, which mediates protein citrullination, and was the most downregulated gene in human colonoids. KIF24 encodes a centriole-associated kinesin reported to regulate ciliogenesis via CP110 and CEP97 [50] and was also downregulated, suggesting altered cilia-related epithelial homeostasis. In mouse colonoids, Dsg3, a desmosomal cadherin essential for cell–cell adhesion [51], was among the most upregulated genes (Figure S6B), whereas Retnlb (RELMβ), implicated in mucosal barrier function and intestinal inflammation [52], and Asrgl1 were among the most downregulated. In mouse colon, Ddit4l and Mmp7 were strongly upregulated (Figure S6C). Mmp7 has been linked to barrier dysfunction through junctional disruption, including claudin-7 degradation [53]. Collectively, these CTD-missing yet GI-relevant signals highlight coverage gaps in GI-focused toxicogenomics. Concordance variations in Figure 5B underscore how different models capture distinct biological signatures while revealing gaps in current toxicogenomic annotation. Together, these findings support the value of cross-model evidence for improving intestinal toxicity annotation and prioritizing candidates for future functional validation.
Despite species-level differences and the absence of stromal or systemic context in organoids, each model captured a common core of CTD-documented DOX targets. Although gene sets differed between models, the DOX response remained centered on the same core pathways, indicating conserved mechanisms despite system-specific gene differences. Directionality analysis comparing CTD-reported increases/decreases with observed GOI up- or downregulation showed moderate concordance (46.6% in mouse colonoids, 43.5% in human colonoids, and 35% in mouse colon; Figure 5B). The mouse in vivo model showed the highest mismatch fraction, while ambiguous CTD direction annotations (no clear direction) comprised ~15–20% of overlapping genes across systems. Although CTD provides useful context for model-derived signals, it does not capture the full GI landscape; consistent with Figure S6, multiple DOX-responsive GOIs lacked CTD entries yet aligned with GI-relevant mechanisms, supporting the value of enriching toxicogenomic databases with curated cross-model evidence to improve translational mapping. Conserved p53/DDR and checkpoint programs in human colonoids suggest candidate epithelial mechanisms that can be tested in DOX-treated patients or clinical intestinal samples. These findings warrant benchmarking against intestinal biopsy transcriptomics and stool-based epithelial injury markers.
The higher DEG-level directional agreement between mouse colonoids and mouse colon, 88.2% (Figure S2C), suggests that mouse colonoids capture part of the in vivo mucosal response to DOX. However, pathway-level mapping of genes involved in cell-cycle regulation, apoptosis, and DNA damage response (Figure 3A, 3B, and 4) indicates that this agreement was not uniform across all mapped genes, with some responses appearing more similar between the two colonoid systems. These findings support the hypothesis that mouse colonoids reflect part of the mouse in vivo response but also show that this agreement is not complete. The pathway-level mapping results add an important nuance, indicating that some DOX responses may be shared by the colonoid context rather than species alone. Human colonoids should therefore be interpreted as controlled human epithelial models for identifying candidate toxicity mechanisms, with their in vivo relevance requiring future validation against DOX-specific clinical or biopsy-derived intestinal data.
Clinical benchmarking of intestinal organoids has been explored in a capecitabine/5-FU study, where healthy colon biopsies from treated patients were compared with 5-FU-exposed human colon organoids [54]. The study identified chemotherapy-associated changes in transport, cellular stress, folate metabolism, and immune-related pathways in patient colon tissue, with selected molecular responses also reflected in the human colonoid model. In the context of the present study, such human-to-human reference data would also help interpret the cross-species comparison by clarifying the extent to which mouse colonoids and mouse colon reflect human intestinal toxicity biology.
Taken together, CTD benchmarking and GOI-based pathway mapping prioritize candidate genes within coordinated cell-cycle, DDR, and apoptosis programs, including CTD-missing yet GI-relevant targets, for functional follow-up of checkpoint control, repair fidelity, and barrier integrity. However, colonoids lack a vascular system for nutrient and oxygen exchange and do not reproduce systemic processes such as bile acid recycling between the intestine and liver [55,56], which may be essential for fully understanding systemic chemotherapy responses.
Integrating human colonoids with complementary systems that add missing biology, including epithelial–immune or epithelial–stromal co-cultures and intestinal microphysiological platforms, together with refined intestinal toxicity datasets, can provide a more human-centric framework to assess DOX and other chemotherapeutics [28], including 5-fluorouracil, irinotecan, and cisplatin, with minimal reliance on animals. In line with the TransQST perspective on QST-enabled drug safety prediction [13], our cross-model transcriptomic comparisons provide mechanistic evidence and candidate biomarkers that can support the development and validation of GI-focused NAM workflows. Furthermore, human in vivo transcriptomic data will be essential to validate and calibrate human colonoid responses, with particular attention to differences in cellular composition between mucosal scrapings and epithelial-only cultures, ensuring that in vitro-to-in vivo inferences reflect patient outcomes.
4. Materials and Methods
4.1. Study Design and Model Systems
This study applied a comparative transcriptomic framework to investigate doxorubicin (DOX)-induced gastrointestinal toxicity across in vitro human colonoids, in vitro mouse colonoids, and in vivo mouse colon. All datasets were processed through a common RNA-seq workflow [57] to reduce bias and ensure comparability across species. The analytical steps summarized in Figure 1 are described in detail below. The RNA-seq datasets generated and/or analyzed in this study are available in BioStudies under accession numbers E-MTAB-16537 and E-MTAB-16565. The code used for this analysis is available at https://github.com/saadlodhi0916/DOX-GI-Transcriptomics.
4.2. In Vivo Mouse
All procedures were conducted in an Association for Assessment and Accreditation of Laboratory Animal Care (AAALAC)-approved facility in accordance with relevant animal-welfare legislation and approved by the institutional ethics committee. The in vivo mouse doxorubicin study design and animal procedures were performed as previously described [58]. Briefly, male C57BL/6J mice (10 weeks old) received doxorubicin (5 or 10 mg/kg) by intravenous bolus injection on days 0 and 1, and were euthanized at 6, 24, 72, or 96 h (Table S1) after treatment initiation (with the 6 h group sampled prior to the second dose). Vehicle controls were dosed on the same schedule as described in the original study. Colon mucosal samples were collected for transcriptomic profiling following the reported procedures, with related tissue collection and sample handling procedures described previously [59]. For the in vivo component, the experimental unit was the individual mouse.
4.3. In Vitro Models
4.3.1. Mouse Colonoids
Murine colonoids were established using intestinal organoid culture principles adapted from a previous study [60]. Briefly, colons from freshly excised adult male C57BL/6J mice were opened longitudinally, thoroughly rinsed with ice-cold phosphate-buffered saline (PBS). Crypts were isolated using EDTA-based chelation (5 mM EDTA in PBS, 2 h at 4 °C with gentle agitation) followed by vigorous shaking in sucrose-sorbitol shaking buffer (43.4 mM sucrose and 59.4 mM sorbitol in PBS) for 2 min, then passed through a 100 µm strainer and collected by centrifugation (200 x g, 10 min, 4 °C). The pellet was resuspended in growth factor-reduced Matrigel (Corning #356237) and plated as 50 µL domes in pre-warmed 24-well plates. Following polymerization (37 °C, 30 min), each dome was overlaid with 500 µL 50% conditioned media from L-WRN cells (ATCC:CRL-3276) [61] and 50% IntestiCultTM Organoid Growth Medium (STEMCELL Technologies, #06005) and maintained at 37 °C in a humidified incubator (95% air/5% CO2). Medium was replaced every 3-4 days, and cultures were passaged every 7-10 days by mechanical disruption in ice-cold PBS using a 27G needle, followed by gentle centrifugation (200 x g, 10 min, 4 °C) and re-embedding in fresh Matrigel.
Following a 72 h recovery after passaging and transfer to 100% Intesticult, colonoids were exposed to DOX (CAS No. 25316-40-9; Sigma-Aldrich, cat. No. D1515), which was prepared from a dimethyl sulfoxide (DMSO) stock and diluted in culture medium to final concentrations of 0.1, 1, and 10 µM, while vehicle controls received 0.1% DMSO. Treatments were applied for 24, 48, or 72 h, with three independent biological replicates for each concentration and three vehicle controls per time point (Table S1). At the end of each exposure, Matrigel domes were dissolved on ice with cold PBS, and the organoids were pelleted by centrifugation (200 x g, 5-10 min, 4°C). The resulting pellets were immediately transferred into RNAlaterTM (Thermo Fisher Scientific), held at 4 °C overnight, and then stored at -80 °C until RNA extraction.
4.3.2. Human Colonoids
Human colonoid experiments to obtain transcriptomic responses to DOX were performed in a previous study [26]. In summary, human colonoids were treated with DOX at 1 µM and 10 µM for 24, 48, or 72 h, with three biological replicates for each treatment and time point, alongside three untreated controls (Table S1).
4.4. PBPK-Informed Dose Selection for Human and Mouse In Vitro Systems
Nominal doxorubicin concentrations were selected to cover clinically relevant intestinal and systemic exposure ranges informed by physiologically based pharmacokinetic (PBPK) simulations. Human colonoids were exposed to 1 and 10 µM doxorubicin [26]. Mouse colonoids were exposed to 0.1, 1, and 10 µM doxorubicin to span the PBPK-informed exposure range reported for the mouse system [58].
4.5. Transcriptomics Profiling
4.5.1. Mouse Samples
Total RNA was extracted from mouse colon tissue (in vivo) and mouse colonoids (in vitro) using the miRNeasy Mini Kit (Qiagen, the Netherlands), according to the manufacturer’s protocol. RNA concentration and purity were assessed using a NanoDrop ND-1000 spectrophotometer (260/230nm and 260/280nm) and RNA integrity was evaluated using Agilent 2100 Bioanalyzer (RNA Nano Chips). Samples with RIN > 6 and total RNA yield of at least 200 ng were selected for sequencing. Libraries were prepared using the Lexogen SENSE mRNA-seq kit and sequenced on Illumina HiSeq 2500 using 100-bp paired-end reads.
4.5.2. Human Samples
For human colonoids (in vitro), transcriptomic data were obtained from a previously published study [26]. Briefly, organoids were collected in QIAzol Lysis reagent, and RNA was isolated using the miRNeasy Mini Kit (Qiagen). Sequencing libraries were prepared using the Lexogen SENSE mRNA Library Preparation Kit (Lexogen, Vienna, Austria). The purified samples were sequenced using the Illumina NovaSeq 6000 system.
4.6. Data Preprocessing
Following sequencing, data from human colonoid, mouse colonoid, and mouse colon were processed using the R-ODAF pipeline [57]. To ensure cross-dataset consistency and minimize bias, the human colonoid data were reprocessed using the same pipeline as the mouse datasets. FastQC v0.11.5 was used to evaluate sequence quality and only the samples that met the established thresholds were retained. Raw reads were then trimmed using fastp v0.19.8 [62], aligned to reference genomes (GRCm39 for mouse; GRCh38 for human) with STAR v2.7.9a [63]. Transcript quantification was performed using RSEM (1.3.3) [64] to obtain raw gene expression counts for downstream normalization and differential expression analysis. To enable cross-species comparison, human and mouse Ensembl IDs were converted to human gene symbols using BioMart [65]. Human gene names were retrieved with the gene parameter, and mouse genes were mapped to their human orthologs. The resulting cross-species mapping table is provided in File S1.
4.7. Identification of Differentially Expressed Genes
Following transcript quantification, differential gene expression analysis was conducted using DESeq2 (1.40.2) [66]. R-ODAF filters were applied (≥75% of samples at ≥1 counts per million [CPM]; third-quartile low abundance removal; spike removal), and counts were normalized before testing. Genes altered in response to DOX were identified across the three datasets. Time points and doses were pooled to enhance robustness of signal detection, i.e., to identify genes that consistently showed differential expression across different treatment conditions, irrespective of variation in exposure duration and dosage. Genes with a false discovery rate (FDR) below 0.01 were considered differentially expressed genes (DEGs).
4.8. Weighted Gene Co-Expression Network Analysis
To identify clusters of highly correlated genes within each dataset, weighted gene co-expression network analysis (WGCNA) was performed using the WGCNA package in R (v1.73) [67]. For each dataset, WGCNA identifies modules, which are groups of genes with coordinated expression patterns that are significantly associated with external traits. Normalized count data served as the input, and the default parameters were applied. Briefly, the goodSampleGenes function was used to identify and remove any outlier genes and the pickSoftThreshold function was used to select the soft-thresholding power for constructing a scale-free network prior to transformation into a topological overlap matrix. WGCNA’s default color module labels were converted to numeric identifiers (e.g., Module 1, Module 2) for consistency across datasets. Each resulting module was assigned a significance score based on the module-trait relationship. Modules with p < 0.01 were considered significant. Both dose and time were included in the trait data for module correlation. To quantify the overlap between module gene sets across datasets, pairwise Jaccard index [68] was calculated between each module pair. For two sets A and B, the Jaccard is defined as the size of the intersection divided by the size of the union (|A ∩ B|/|A ∪ B|). A value of 0 indicates no shared genes, 0.1 indicates 10% overlap, and 1 indicates identical gene membership.
4.9. Pathway Enrichment and Mapping of DEGs and WGCNA Genes
Pathway enrichment analysis was performed to explore biological responses to DOX and assess mechanistic overlap across datasets. This analysis was conducted independently on DEGs and on genes from the significant WGCNA modules using Enrichr [69], querying WikiPathways for pathway annotations. Pathways with adjusted p-value < 0.05 were considered significant. To identify biologically relevant signals, functionally similar pathways enriched in both DEGs and WGCNA genes were first identified. These pathways were then compared across models based on shared underlying mechanisms, focusing on functional similarity rather than relying on identical pathway names or database-specific terms. Selected pathways were visualized in PathVisio 3.3.0 [70] by overlaying DEGs and significant WGCNA genes to highlight gene-level contributions and facilitate cross-model comparisons.
4.10. CTD-Informed Annotation of DEGs-WGCNA Overlap
To contextualize model-derived gene signatures against existing toxicogenomic evidence, a targeted cross-reference analysis was performed using the Comparative Toxicogenomics Database (CTD) [71] to annotate genes with known chemical-gene associations. This cross-reference was implemented in R using an SQLite database and an SQL query to obtain de-duplicated gene-level summaries. All known DOX-interacting genes were retrieved from CTD (accessed date July 3, 2025; File S1) and compared for concordance with the intersecting DEGs and WGCNA genes across all three datasets. Subsequently, the directionality of each CTD-annotated interaction (“increased” or “decreased” expression) was compared with the observed gene expression changes in the datasets to determine concordance, mismatch, or ambiguity across models.
5. Conclusions
We compared DOX-induced transcriptomic responses across human colonoids, mouse colonoids, and mouse colon to evaluate model concordance and translational relevance. Despite limited cross-species gene overlap, pathway-level responses consistently converged on p53-linked DNA-damage response, cell-cycle checkpoint regulation, DNA repair, and apoptosis, indicating a conserved toxicity core within model-specific responses. Mouse colonoids showed the highest DEG-level directional concordance with mouse colon, supporting their value for modeling epithelial components of the mouse in vivo response. CTD benchmarking provided additional toxicogenomic context but revealed only moderate directionality concordance, and highlighted GI-relevant genes that remain underrepresented in current curated resources. The comparative parallelogram approach revealed conserved DOX-induced mechanisms alongside notable model- and species-dependent differences. Human colonoids highlighted candidate human epithelial response features, including extrinsic apoptosis and p53-associated DNA damage and repair signals. Overall, these findings position colonoid-based transcriptomics as a useful mechanistic NAM for chemotherapy-induced intestinal toxicity assessment and support its potential contribution to reducing reliance on animal models. However, because colonoids lack vascular, immune, stromal, and systemic components, future validation against DOX-specific clinical or biopsy-derived intestinal data remains essential to define their predictive scope.
Supplementary Materials
The following supporting information can be downloaded at the website of this
paper posted on Preprints.org. Table S1: Overview of dosing schemes, sampling time points, and numbers of animals or biological replicates across all experimental models; Table S2: Summary of differentially expressed genes and WGCNA module characteristics across mouse colon, mouse colonoid, and human colonoid datasets; Table S3: Summary of pathway enrichment results across models following doxorubicin exposure; Figure S1: Principal component analysis of RNA-seq expression profiles in each model; Figure S2: Gene-expression directionality across overlapping genes and pairwise model comparisons; Figure S3: WGCNA module–trait relationships in human colonoids, mouse colonoids, and mouse colon; Figure S4: Cross-model similarity of significant WGCNA modules based on pairwise Jaccard coefficients; Figure S5: Gene mapping on the DNA repair pathway in response to doxorubicin across all three models; Figure S6: Top upregulated and downregulated CTD-unannotated genes in human colonoids, mouse colonoids, and mouse colon; File S1: Supplementary Excel workbook containing full DEG results, WGCNA module gene lists, pathway enrichment outputs, DEG/WGCNA overlap genes, cross-model overlap and directionality tables, CTD annotation results, CTD-unannotated candidate genes, and cross-species gene mapping tables.
Author Contributions
Conceptualization, S.L., F.C., M.C.T.V. and D.G.J.J.; Methodology, S.L., M.v.H., C.K., H.F.-W., C.A.D., D.M.P., M.C.T.V. and D.G.J.J.; Software, S.L., M.C.T.V. and D.G.J.J.; Validation, M.v.H., M.C.T.V. and D.G.J.J.; Formal Analysis, S.L.; Investigation, S.L., M.v.H. and H.F.-W.; Resources, M.v.H., C.K., H.F.-W., C.A.D., D.M.P., F.C., T.M.C.M.d.K., M.C.T.V. and D.G.J.J.; Data Curation, S.L., M.C.T.V. and D.G.J.J.; Writing—Original Draft Preparation, S.L.; Writing—Review and Editing, S.L., C.A.D., D.M.P., F.C., T.M.C.M.d.K., M.C.T.V. and D.G.J.J.; Visualization, S.L.; Supervision, F.C., M.C.T.V. and D.G.J.J.; Project Administration, M.C.T.V. and D.G.J.J.; Funding Acquisition, T.M.C.M.d.K., D.M.P. and D.G.J.J. All authors have read and agreed to the published version of the manuscript.
Funding
This research was funded by the Virtual Human Platform for Safety Assessment (VHP4Safety), funded by the Dutch Research Council (NWO) under the Netherlands Research Agenda: Research on Routes by Consortia (NWA-ORC), grant number NWA-ORC 1292.19.272, and by TransQST, which received funding from the Innovative Medicines Initiative 2 Joint Undertaking under grant agreement No. 116030, supported by the EU Horizon 2020 research and innovation program and EFPIA. The APC was funded by Maastricht University.
Institutional Review Board Statement
The in vivo mouse study was conducted in an AAALAC-accredited facility and was approved by the Ethics Committee on Animal Experiments of the Research Center of the Belgian Johnson & Johnson facilities (protocol code: 138_02-Absorption Rodents; approval date: 15 December 2021). The study was performed in accordance with EU Directive 2010/63/EU and the Belgian Royal Decree of 29 May 2013. Murine colonoid experiments used tissues derived from commercially obtained wild-type C57BL/6 mice and were conducted under local ethical approval at the University of Liverpool. No new human samples were collected for the present study. Human intestinal colonoid transcriptomic data were reprocessed from prior work [26].
Informed Consent Statement
Not applicable.
Data Availability Statement
All RNA-seq data generated and/or analyzed in this study are available in BioStudies database under accession numbers E-MTAB-16537 and E-MTAB-16565. The code used in this study is available at: https://github.com/saadlodhi0916/DOX-GI-Transcriptomics. Processed result tables supporting the analyses are provided in File S1.
Acknowledgments
We thank Ferran Jardi and colleagues at Janssen Pharmaceutica NV (Johnson & Johnson Innovative Medicine), Beerse, Belgium, for providing the in vivo mouse colon samples and accompanying study metadata used in this work, and for valuable comments on the manuscript. Funding is listed in the funding section.
Conflicts of Interest
The authors declare no conflicts of interest.
Abbreviations
The following abbreviations are used in this manuscript:
| AAALAC | Association for Assessment and Accreditation of Laboratory Animal Care |
| CIM | Chemotherapy-induced intestinal mucositis |
| CPM | Counts per million |
| CTD | Comparative Toxicogenomics Database |
| DDR | DNA damage response |
| DEGs | Differentially expressed genes |
| DMSO | Dimethyl sulfoxide |
| DOX | Doxorubicin |
| FDR | False discovery rate |
| GI | Gastrointestinal |
| GOIs | Genes of interest |
| NAMs | New Approach Methodologies |
| NGRA | Next Generation Risk Assessment |
| PBPK | Physiologically based pharmacokinetic |
| PBS | Phosphate-buffered saline |
| PCA | Principal Component Analysis |
| PC1 | Principal Component 1 |
| R-ODAF | Omics Data Analysis Framework for Regulatory Application |
| RNA | Ribonucleic acid |
| RNA-seq | RNA sequencing |
| WGCNA | Weighted gene co-expression network analysis |
References
- Mukherjee, P.; et al. Role of animal models in biomedical research: a review . Lab Anim. Res. 2022, 38(1), 18. [Google Scholar] [CrossRef] [PubMed]
- Mestas, J.; Hughes, C.C. Of mice and not men: differences between mouse and human immunology . J. Immunol. 2004, 172(5), 2731–8. [Google Scholar] [CrossRef] [PubMed]
- van der Worp, H.B.; et al. Can animal models of disease reliably inform human studies? PLoS Med. 2010, 7(3), e1000245. [Google Scholar] [CrossRef] [PubMed]
- Bracken, M.B. Why animal studies are often poor predictors of human reactions to exposure . J. R Soc. Med. 2009, 102(3), 120–2. [Google Scholar] [CrossRef] [PubMed]
- Kiani, A.K.; et al. Ethical considerations regarding animal experimentation . J. Prev. Med. Hyg. 2022, 63((2) Suppl 3, E255–E266. [Google Scholar] [CrossRef] [PubMed]
- Ferdowsian, H.R.; Beck, N. Ethical and scientific considerations regarding animal testing and research . PLoS ONE 2011, 6(9), e24059. [Google Scholar] [CrossRef] [PubMed]
- Schmeisser, S.; et al. New approach methodologies in human regulatory toxicology - Not if, but how and when! Env. Int. 2023, 178, 108082. [Google Scholar] [CrossRef]
- Carmichael, P.L.; et al. Ready for regulatory use: NAMs and NGRA for chemical safety assurance . ALTEX 2022, 39(3), 359–366. [Google Scholar] [CrossRef] [PubMed]
- Dent, M.P.; et al. Paving the way for application of next generation risk assessment to safety decision-making for cosmetic ingredients . Regul. Toxicol. Pharmacol. 2021, 125, 105026. [Google Scholar] [CrossRef] [PubMed]
- Jiang, J.; et al. Unraveling the mechanisms underlying drug-induced cholestatic liver injury: identifying key genes using machine learning techniques on human in vitro data sets . Arch. Toxicol. 2023, 97(11), 2969–2981. [Google Scholar] [CrossRef] [PubMed]
- O'Donovan, S.D.; et al. Application of transfer learning to predict drug-induced human in vivo gene expression changes using rat in vitro and in vivo data . PLoS ONE 2023, 18(11), e0292030. [Google Scholar] [CrossRef] [PubMed]
- Lin, Z.; Chou, W.C. Machine Learning and Artificial Intelligence in Toxicological Sciences . Toxicol. Sci. 2022, 189(1), 7–19. [Google Scholar] [CrossRef] [PubMed]
- Goldring, C.E.; et al. Quantitative systems toxicology: modelling to mechanistically understand and predict drug safety . Nat. Rev. Drug Discov. 2025. [Google Scholar] [CrossRef] [PubMed]
- Corsini, N.S.; Knoblich, J.A. Human organoids: New strategies and methods for analyzing human development and disease . Cell 2022, 185(15), 2756–2769. [Google Scholar] [CrossRef] [PubMed]
- Biju, T.S.; Priya, V.V.; Francis, A.P. Role of three-dimensional cell culture in therapeutics and diagnostics: an updated review . Drug Deliv. Transl. Res. 2023, 13(9), 2239–2253. [Google Scholar] [CrossRef] [PubMed]
- Kapalczynska, M.; et al. 2D and 3D cell cultures - a comparison of different types of cancer cell cultures . Arch. Med. Sci. 2018, 14(4), 910–919. [Google Scholar] [PubMed]
- Ipek, S.; Ustundag, A.; Eke, B. Can. Three-dimensional (3D) cell culture studies: a review of the field of toxicology . Drug Chem. Toxicol. 2023, 46(3), 523–533. [Google Scholar] [PubMed]
- Cui, X.; Hartanto, Y.; Zhang, H. Advances in multicellular spheroids formation . J. R Soc. Interface 2017, 14(127). [Google Scholar] [CrossRef] [PubMed]
- Fennema, E.; et al. Spheroid culture as a tool for creating 3D complex tissues . Trends Biotechnol. 2013, 31(2), 108–15. [Google Scholar] [CrossRef] [PubMed]
- Rodrigues, D.; et al. A Transcriptomic Approach to Elucidate the Mechanisms of Gefitinib-Induced Toxicity in Healthy Human Intestinal Organoids . Int. J. Mol. Sci. 2022, 23(4). [Google Scholar] [CrossRef] [PubMed]
- Sato, T.; et al. Long-term expansion of epithelial organoids from human colon, adenoma, adenocarcinoma, and Barrett's epithelium . Gastroenterology 2011, 141(5), 1762–72. [Google Scholar] [CrossRef] [PubMed]
- Mountcastle, S.E.; et al. A review of co-culture models to study the oral microenvironment and disease . J. Oral Microbiol. 2020, 12(1), 1773122. [Google Scholar] [CrossRef] [PubMed]
- Fatehullah, A.; Tan, S.H.; Barker, N. Organoids as an in vitro model of human development and disease . Nat. Cell Biol. 2016, 18(3), 246–54. [Google Scholar] [CrossRef] [PubMed]
- Jung, P.; et al. Isolation and in vitro expansion of human colonic stem cells . Nat. Med. 2011, 17(10), 1225–7. [Google Scholar] [CrossRef] [PubMed]
- Kim, J.; Koo, B.K.; Knoblich, J.A. Human organoids: model systems for human biology and medicine . Nat. Rev. Mol. Cell Biol. 2020, 21(10), 571–584. [Google Scholar] [CrossRef] [PubMed]
- Rodrigues, D.; et al. Unravelling Mechanisms of Doxorubicin-Induced Toxicity in 3D Human Intestinal Organoids . Int. J. Mol. Sci. 2022, 23(3). [Google Scholar] [CrossRef] [PubMed]
- Lin, A.; et al. Off-target toxicity is a common mechanism of action of cancer drugs undergoing clinical trials . Sci. Transl. Med. 2019, 11(509). [Google Scholar] [CrossRef] [PubMed]
- Akbarali, H.I.; et al. Chemotherapy induced gastrointestinal toxicities . Adv. Cancer Res. 2022, 155, 131–166. [Google Scholar] [CrossRef] [PubMed]
- Keefe, D.M.; et al. Risk and outcomes of chemotherapy-induced diarrhea (CID) among patients with colorectal cancer receiving multi-cycle chemotherapy . Cancer Chemother. Pharmacol. 2014, 74(4), 675–80. [Google Scholar] [CrossRef] [PubMed]
- Gibson, R.J.; Keefe, D.M. Cancer chemotherapy-induced diarrhoea and constipation: mechanisms of damage and prevention strategies . Support Care Cancer 2006, 14(9), 890–900. [Google Scholar] [CrossRef] [PubMed]
- Chang, C.W.; et al. Fecal Microbiota Transplantation Prevents Intestinal Injury, Upregulation of Toll-Like Receptors, and 5-Fluorouracil/Oxaliplatin-Induced Toxicity in Colorectal Cancer . Int. J. Mol. Sci. 2020, 21(2). [Google Scholar] [PubMed]
- Ribeiro, R.A.; et al. Irinotecan- and 5-fluorouracil-induced intestinal mucositis: insights into pathogenesis and therapeutic perspectives . Cancer Chemother. Pharmacol. 2016, 78(5), 881–893. [Google Scholar] [CrossRef] [PubMed]
- Sougiannis, A.T.; et al. Understanding chemotherapy-induced intestinal mucositis and strategies to improve gut resilience . Am. J. Physiol. Gastrointest. Liver Physiol. 2021, 320(5), G712–G719. [Google Scholar] [CrossRef] [PubMed]
- McCullough, R.W. US oncology-wide incidence, duration, costs and deaths from chemoradiation mucositis and antimucositis therapy benefits . Future Oncol. 2017, 13(30), 2823–2852. [Google Scholar] [CrossRef] [PubMed]
- Uhl, E.W.; Warner, N.J. Mouse Models as Predictors of Human Responses: Evolutionary Medicine . Curr. Pathobiol. Rep. 2015, 3(3), 219–223. [Google Scholar] [CrossRef] [PubMed]
- Zachos, N.C.; et al. Human Enteroids/Colonoids and Intestinal Organoids Functionally Recapitulate Normal Intestinal Physiology and Pathophysiology . J. Biol. Chem. 2016, 291(8), 3759–66. [Google Scholar] [CrossRef] [PubMed]
- Kienhuis, A.S.; et al. Parallelogram approach using rat-human in vitro and rat in vivo toxicogenomics predicts acetaminophen-induced hepatotoxicity in humans . Toxicol. Sci. 2009, 107(2), 544–52. [Google Scholar] [PubMed]
- Hoffman, L.M.; Jensen, C.C.; Beckerle, M.C. Phosphorylation of the small heat shock protein HspB1 regulates cytoskeletal recruitment and cell motility . Mol. Biol. Cell 2022, 33(11), ar100. [Google Scholar] [CrossRef] [PubMed]
- Zhan, Y.; et al. Inhibiting RRM2 to enhance the anticancer activity of chemotherapy . BioMed Pharmacother. 2021, 133, 110996. [Google Scholar] [CrossRef] [PubMed]
- Ebrahim, N.; et al. Prophylactic Evidence of MSCs-Derived Exosomes in Doxorubicin/Trastuzumab-Induced Cardiotoxicity: Beyond Mechanistic Target of NRG-1/Erb Signaling Pathway . Int. J. Mol. Sci. 2022, 23(11). [Google Scholar] [PubMed]
- Liu, Y.Y.; et al. INKA2, a novel p53 target that interacts with the serine/threonine kinase PAK4 . Int. J. Oncol. 2019, 54(6), 1907–1920. [Google Scholar] [CrossRef] [PubMed]
- Williams, A.B.; Schumacher, B. p53 in the DNA-Damage-Repair Process . Cold Spring Harb. Perspect. Med. 2016, 6(5). [Google Scholar] [PubMed]
- Giono, L.E.; Manfredi, J.J. Mdm2 is required for inhibition of Cdk2 activity by p21, thereby contributing to p53-dependent cell cycle arrest . Mol. Cell Biol. 2007, 27(11), 4166–78. [Google Scholar] [CrossRef] [PubMed]
- Moll, U.M.; Petrenko, O. The MDM2-p53 interaction . Mol. Cancer Res. 2003, 1(14), 1001–8. [Google Scholar] [PubMed]
- Kciuk, M.; et al. Doxorubicin-An Agent with Multiple Mechanisms of Anticancer Activity . Cells 2023, 12(4). [Google Scholar] [CrossRef] [PubMed]
- Karnitz, L.M.; Zou, L. Molecular Pathways: Targeting ATR in Cancer Therapy . Clin. Cancer Res. 2015, 21(21), 4780–5. [Google Scholar] [CrossRef] [PubMed]
- Abe, S.; et al. Targeting MCM2 function as a novel strategy for the treatment of highly malignant breast tumors . Oncotarget 2015, 6(33), 34892–909. [Google Scholar] [CrossRef] [PubMed]
- Youle, R.J.; Strasser, A. The BCL-2 protein family: opposing activities that mediate cell death . Nat. Rev. Mol. Cell Biol. 2008, 9(1), 47–59. [Google Scholar] [CrossRef] [PubMed]
- Gerstel, U.; et al. Hornerin contains a Linked Series of Ribosome-Targeting Peptide Antibiotics . Sci. Rep. 2018, 8(1), 16158. [Google Scholar] [CrossRef] [PubMed]
- Kobayashi, T.; et al. Centriolar kinesin Kif24 interacts with CP110 to remodel microtubules and regulate ciliogenesis . Cell 2011, 145(6), 914–25. [Google Scholar] [CrossRef] [PubMed]
- Moftah, H.; et al. Desmoglein 3 regulates membrane trafficking of cadherins, an implication in cell-cell adhesion . Cell Adh Migr. 2017, 11(3), 211–232. [Google Scholar] [PubMed]
- Krimi, R.B.; et al. Resistin-like molecule beta regulates intestinal mucous secretion and curtails TNBS-induced colitis in mice . Inflamm. Bowel Dis. 2008, 14(7), 931–41. [Google Scholar] [CrossRef] [PubMed]
- Xiao, Y.; et al. Matrix metalloproteinase 7 contributes to intestinal barrier dysfunction by degrading tight junction protein Claudin-7 . Front Immunol. 2022, 13, 1020902. [Google Scholar] [CrossRef] [PubMed]
- Rodrigues, D.; et al. Gene expression responses reflecting 5-FU-induced toxicity: Comparison between patient colon tissue and 3D human colon organoids . Toxicol. Lett. 2022, 371, 17–24. [Google Scholar] [CrossRef] [PubMed]
- Huang, Y.; et al. Research Progress, Challenges, and Breakthroughs of Organoids as Disease Models . Front Cell Dev. Biol. 2021, 9, 740574. [Google Scholar] [CrossRef] [PubMed]
- Dawson, P.A.; Karpen, S.J. Intestinal transport and metabolism of bile acids . J. Lipid Res. 2015, 56(6), 1085–99. [Google Scholar] [CrossRef] [PubMed]
- Verheijen, M.C.; et al. R-ODAF: Omics data analysis framework for regulatory application . Regul. Toxicol. Pharmacol. 2022, 131, 105143. [Google Scholar] [CrossRef] [PubMed]
- Gall, L.; et al. A dynamic model of the intestinal epithelium integrates multiple sources of preclinical data and enables clinical translation of drug-induced toxicity . CPT Pharmacomet. Syst. Pharmacol. 2023, 12(10), 1511–1528. [Google Scholar]
- Jardi, F.; et al. Mouse organoids as an in vitro tool to study the in vivo intestinal response to cytotoxicants . Arch. Toxicol. 2023, 97(1), 235–254. [Google Scholar] [PubMed]
- Jones, L.G.; et al. NF-kappaB2 signalling in enteroids modulates enterocyte responses to secreted factors from bone marrow-derived dendritic cells . Cell Death Dis. 2019, 10(12), 896. [Google Scholar] [PubMed]
- Miyoshi, H.; Stappenbeck, T.S. In vitro expansion and genetic modification of gastrointestinal stem cells in spheroid culture . Nat. Protoc. 2013, 8(12), 2471–82. [Google Scholar] [CrossRef] [PubMed]
- Chen, S.; et al. fastp: an ultra-fast all-in-one FASTQ preprocessor . Bioinformatics 2018, 34(17), i884–i890. [Google Scholar] [CrossRef] [PubMed]
- Dobin, A.; et al. STAR: ultrafast universal RNA-seq aligner . Bioinformatics 2013, 29(1), 15–21. [Google Scholar] [PubMed]
- Li, B.; Dewey, C.N. RSEM: accurate transcript quantification from RNA-Seq data with or without a reference genome . BMC Bioinform. 2011, 12, 323. [Google Scholar] [CrossRef]
- Smedley, D.; et al. BioMart--biological queries made easy. BMC Genom. 2009, 10, 22. [Google Scholar]
- Love, M.I.; Huber, W.; Anders, S. Moderated estimation of fold change and dispersion for RNA-seq data with DESeq2. Genome Biol. 2014, 15(12), 550. [Google Scholar] [PubMed]
- Langfelder, P.; Horvath, S. WGCNA: an R package for weighted correlation network analysis. BMC Bioinform. 2008, 9, 559. [Google Scholar] [CrossRef]
- Real, R.; Vargas, J.M. The Probabilistic Basis of Jaccard's Index of Similarity. Syst. Biol. 1996, 45(3), 380–385. [Google Scholar] [CrossRef]
- Kuleshov, M.V.; et al. Enrichr: a comprehensive gene set enrichment analysis web server 2016 update. Nucleic Acids Res. 2016, 44(W1), W90–7. [Google Scholar] [CrossRef] [PubMed]
- Kutmon, M.; et al. PathVisio 3: an extendable pathway analysis toolbox. PLoS Comput Biol. 2015, 11(2), e1004085. [Google Scholar] [CrossRef] [PubMed]
- Davis, A.P.; et al. Comparative Toxicogenomics Database (CTD): update 2023. Nucleic Acids Res. 2023, 51(D1), D1257–D1262. [Google Scholar] [PubMed]
Figure 1.
Workflow illustrates the complete transcriptomics analysis pipeline. The schematic shows the study design across human colonoids, mouse colonoids, and mouse colon. RNA-seq data from all models were processed using the R-ODAF pipeline for quality control, trimming, alignment and quantification. Differential expression analysis (DESeq2) and weighted gene co-expression network analysis (WGCNA) were applied independently to each dataset and significant genes were subjected to pathway analysis and cross-referenced against the Comparative Toxicogenomics Database (CTD).
Figure 1.
Workflow illustrates the complete transcriptomics analysis pipeline. The schematic shows the study design across human colonoids, mouse colonoids, and mouse colon. RNA-seq data from all models were processed using the R-ODAF pipeline for quality control, trimming, alignment and quantification. Differential expression analysis (DESeq2) and weighted gene co-expression network analysis (WGCNA) were applied independently to each dataset and significant genes were subjected to pathway analysis and cross-referenced against the Comparative Toxicogenomics Database (CTD).
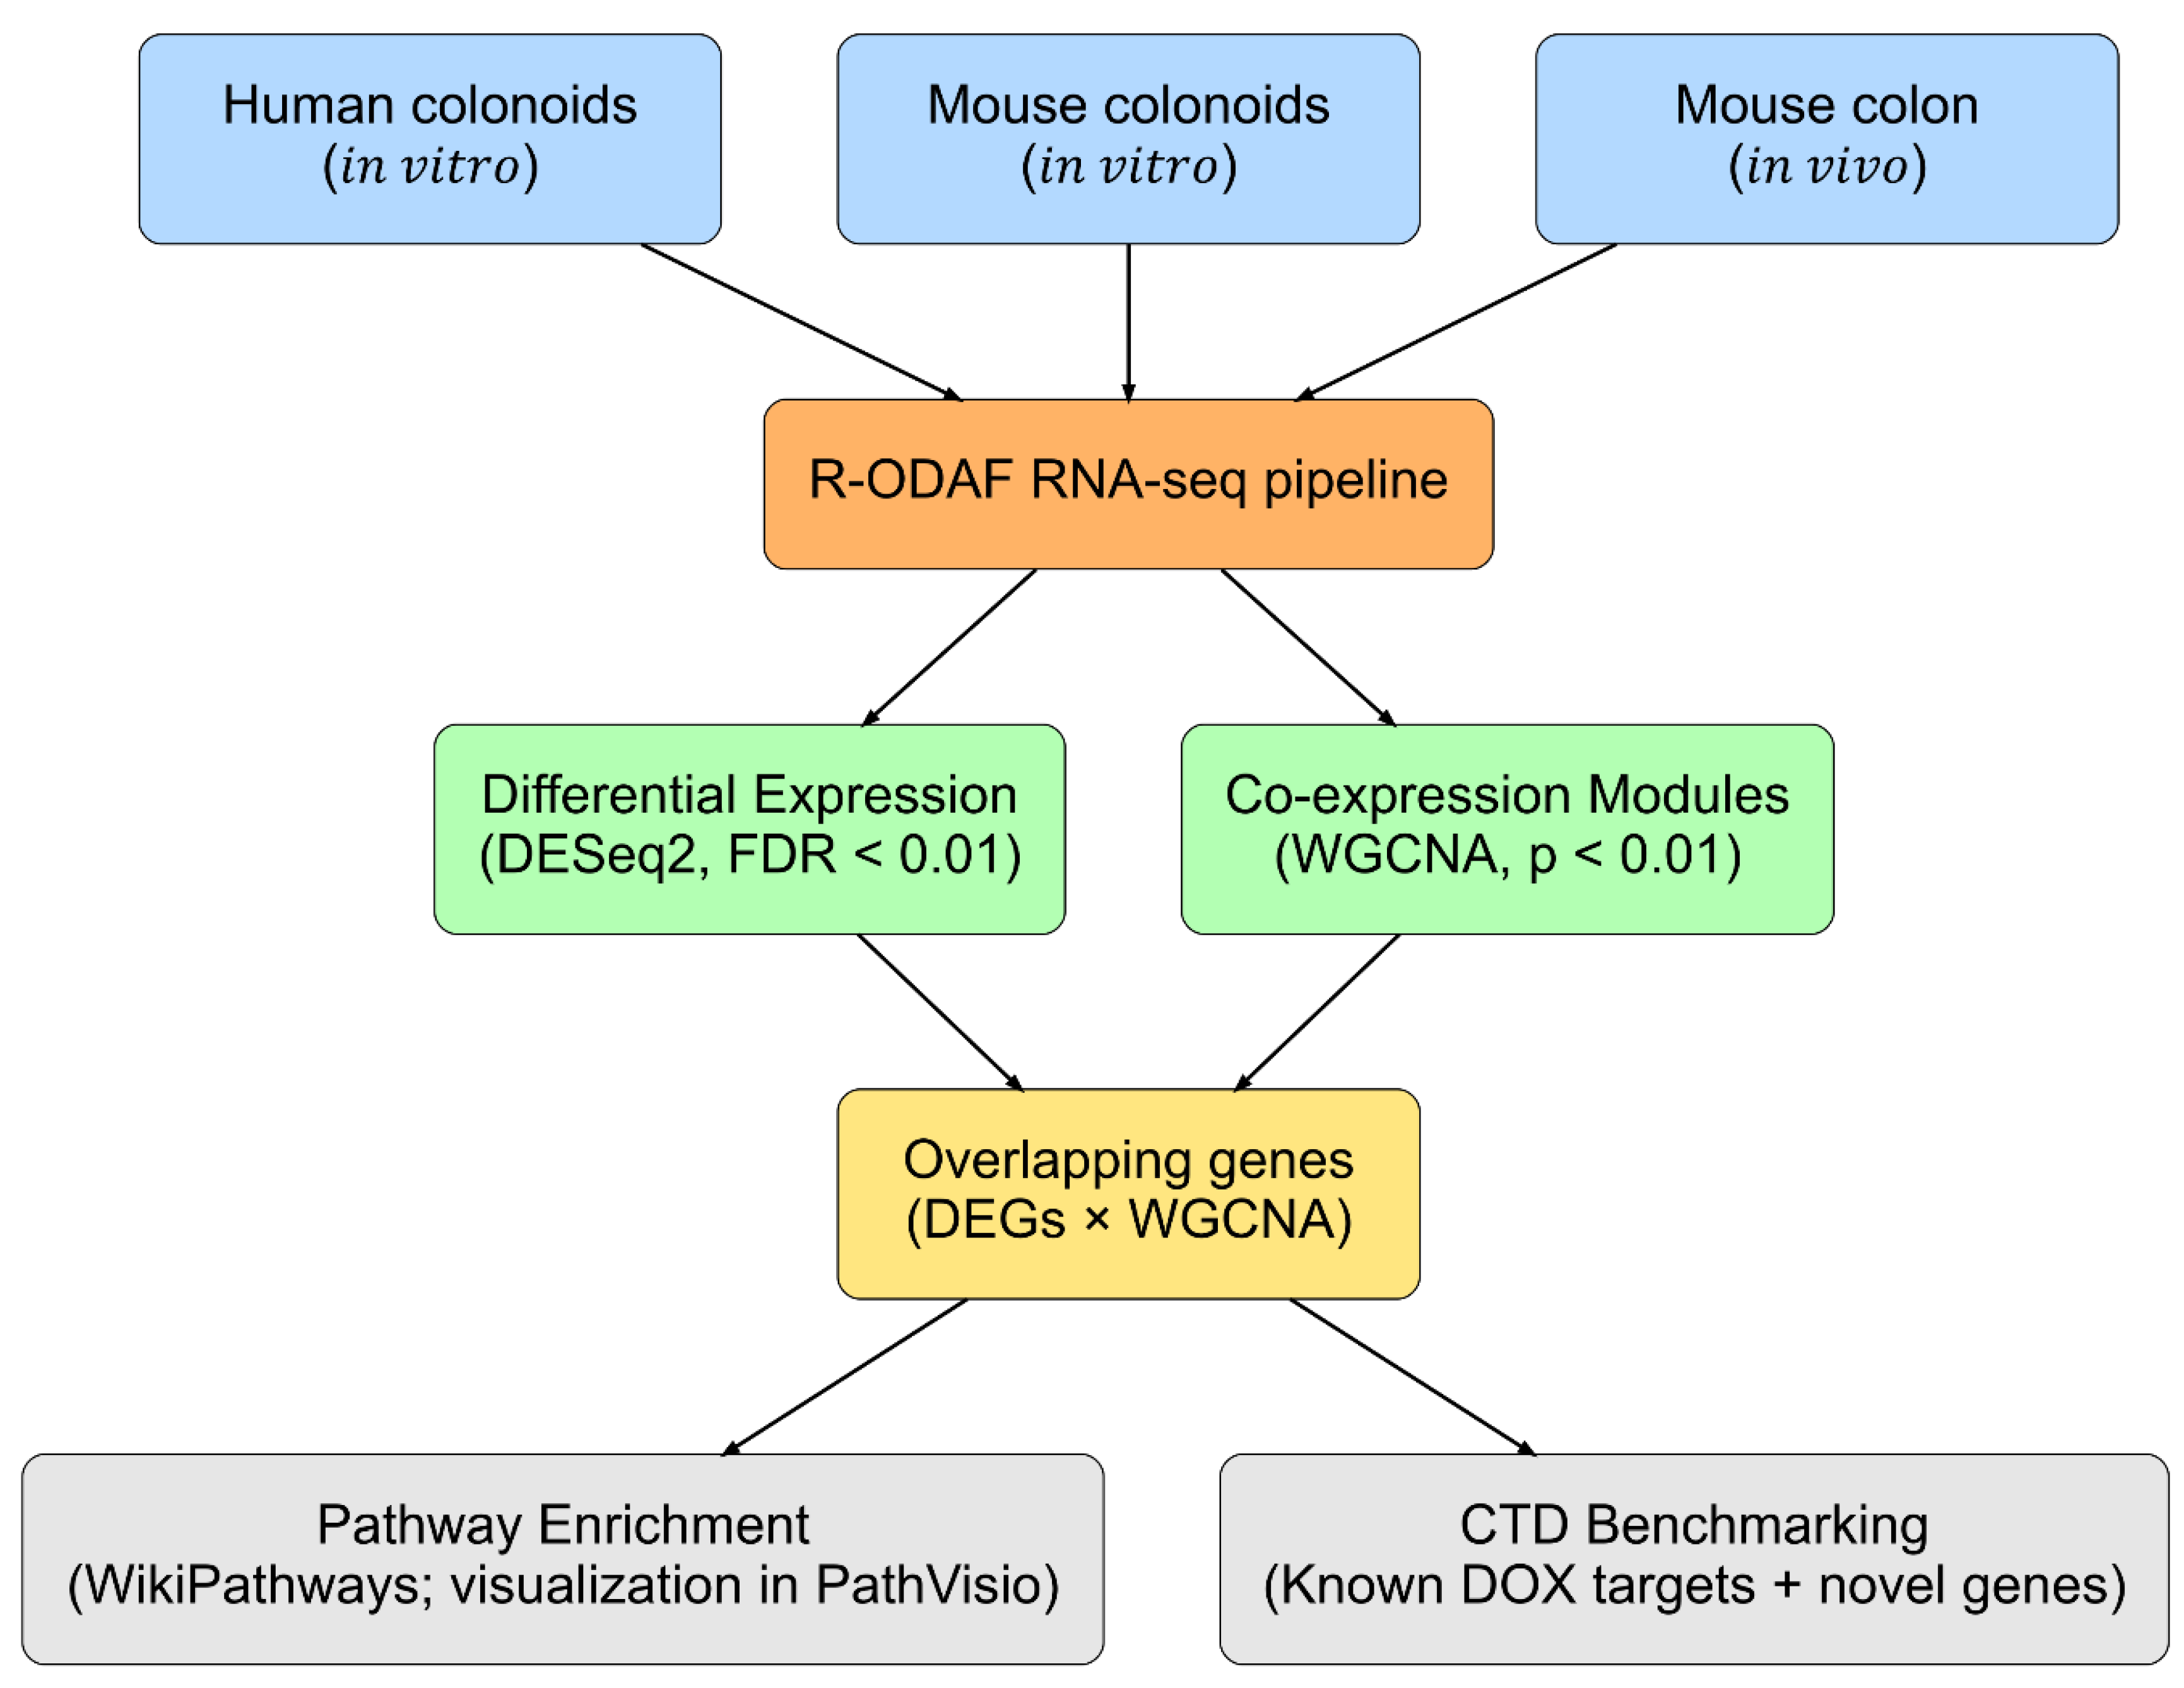
Figure 2.
DEG overlap and directional concordance across models. (A) Venn diagram representing the number of DEGs unique to or shared between human colonoids, mouse colonoids and mouse colon following treatment with DOX. (B) Stacked bar chart showing the number and directionality of overlapping DEGs for each model comparison: mouse colon vs. mouse colonoids, mouse colonoids vs human colonoids, and mouse colon vs human colonoids. “Same direction” (green) indicates that the overlapping DEGs are either upregulated or downregulated in the models compared. “Opposite direction” (red) indicates that the overlapping DEGs are upregulated in one model and downregulated in the other.
Figure 2.
DEG overlap and directional concordance across models. (A) Venn diagram representing the number of DEGs unique to or shared between human colonoids, mouse colonoids and mouse colon following treatment with DOX. (B) Stacked bar chart showing the number and directionality of overlapping DEGs for each model comparison: mouse colon vs. mouse colonoids, mouse colonoids vs human colonoids, and mouse colon vs human colonoids. “Same direction” (green) indicates that the overlapping DEGs are either upregulated or downregulated in the models compared. “Opposite direction” (red) indicates that the overlapping DEGs are upregulated in one model and downregulated in the other.
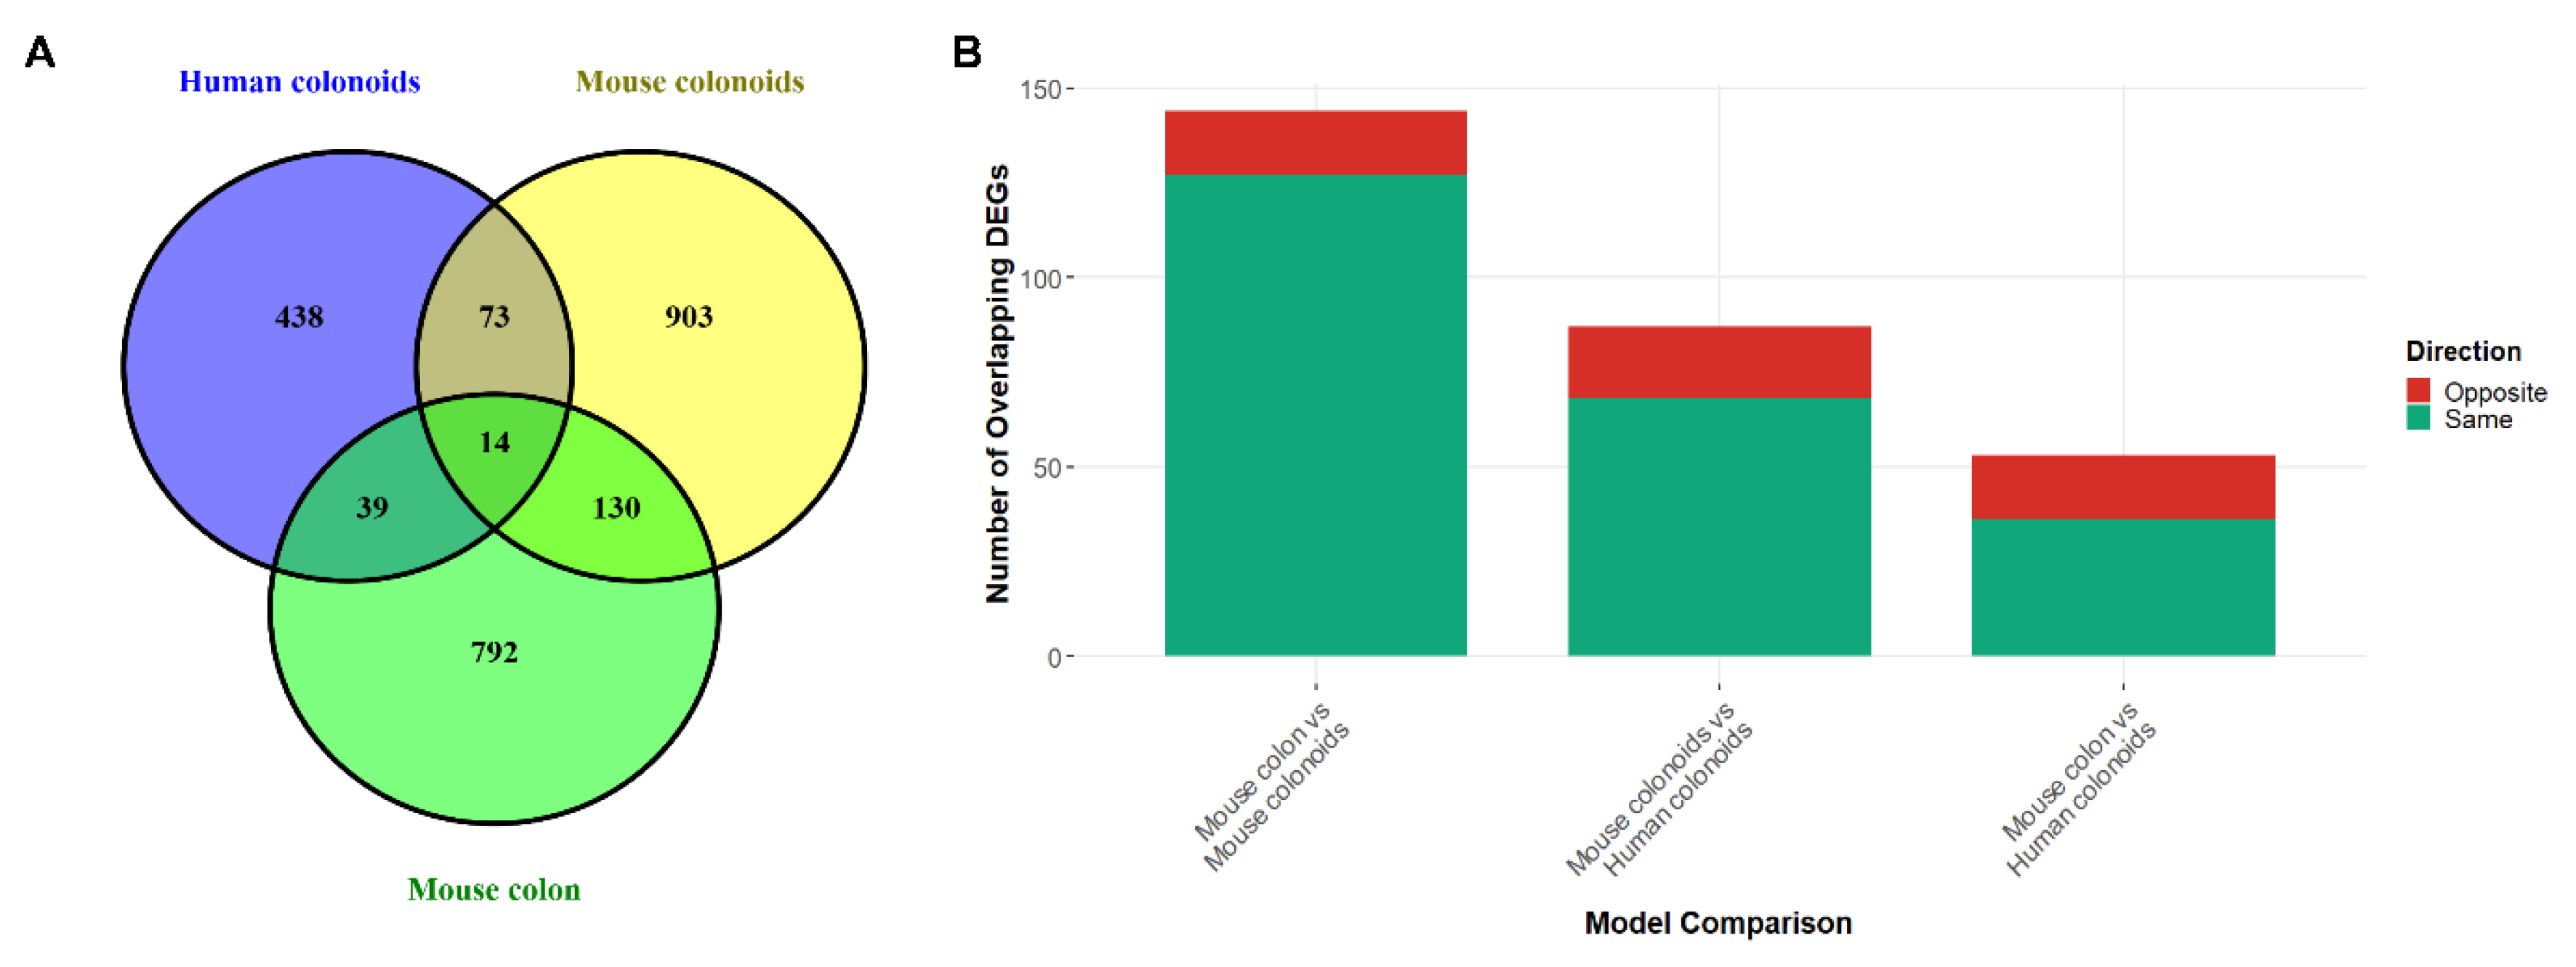
Figure 3.
Gene expression mapping on (A) Cell Cycle and (B) Apoptosis pathway in response to Doxorubicin in all three models. Each gene is depicted as a vertically segmented box colored by log2(fold-change) (–2 = blue, 0 = white, +2 = red), with the left segment representing human colonoids, the middle segment mouse colonoids, and the right segment mouse colon.
Figure 3.
Gene expression mapping on (A) Cell Cycle and (B) Apoptosis pathway in response to Doxorubicin in all three models. Each gene is depicted as a vertically segmented box colored by log2(fold-change) (–2 = blue, 0 = white, +2 = red), with the left segment representing human colonoids, the middle segment mouse colonoids, and the right segment mouse colon.
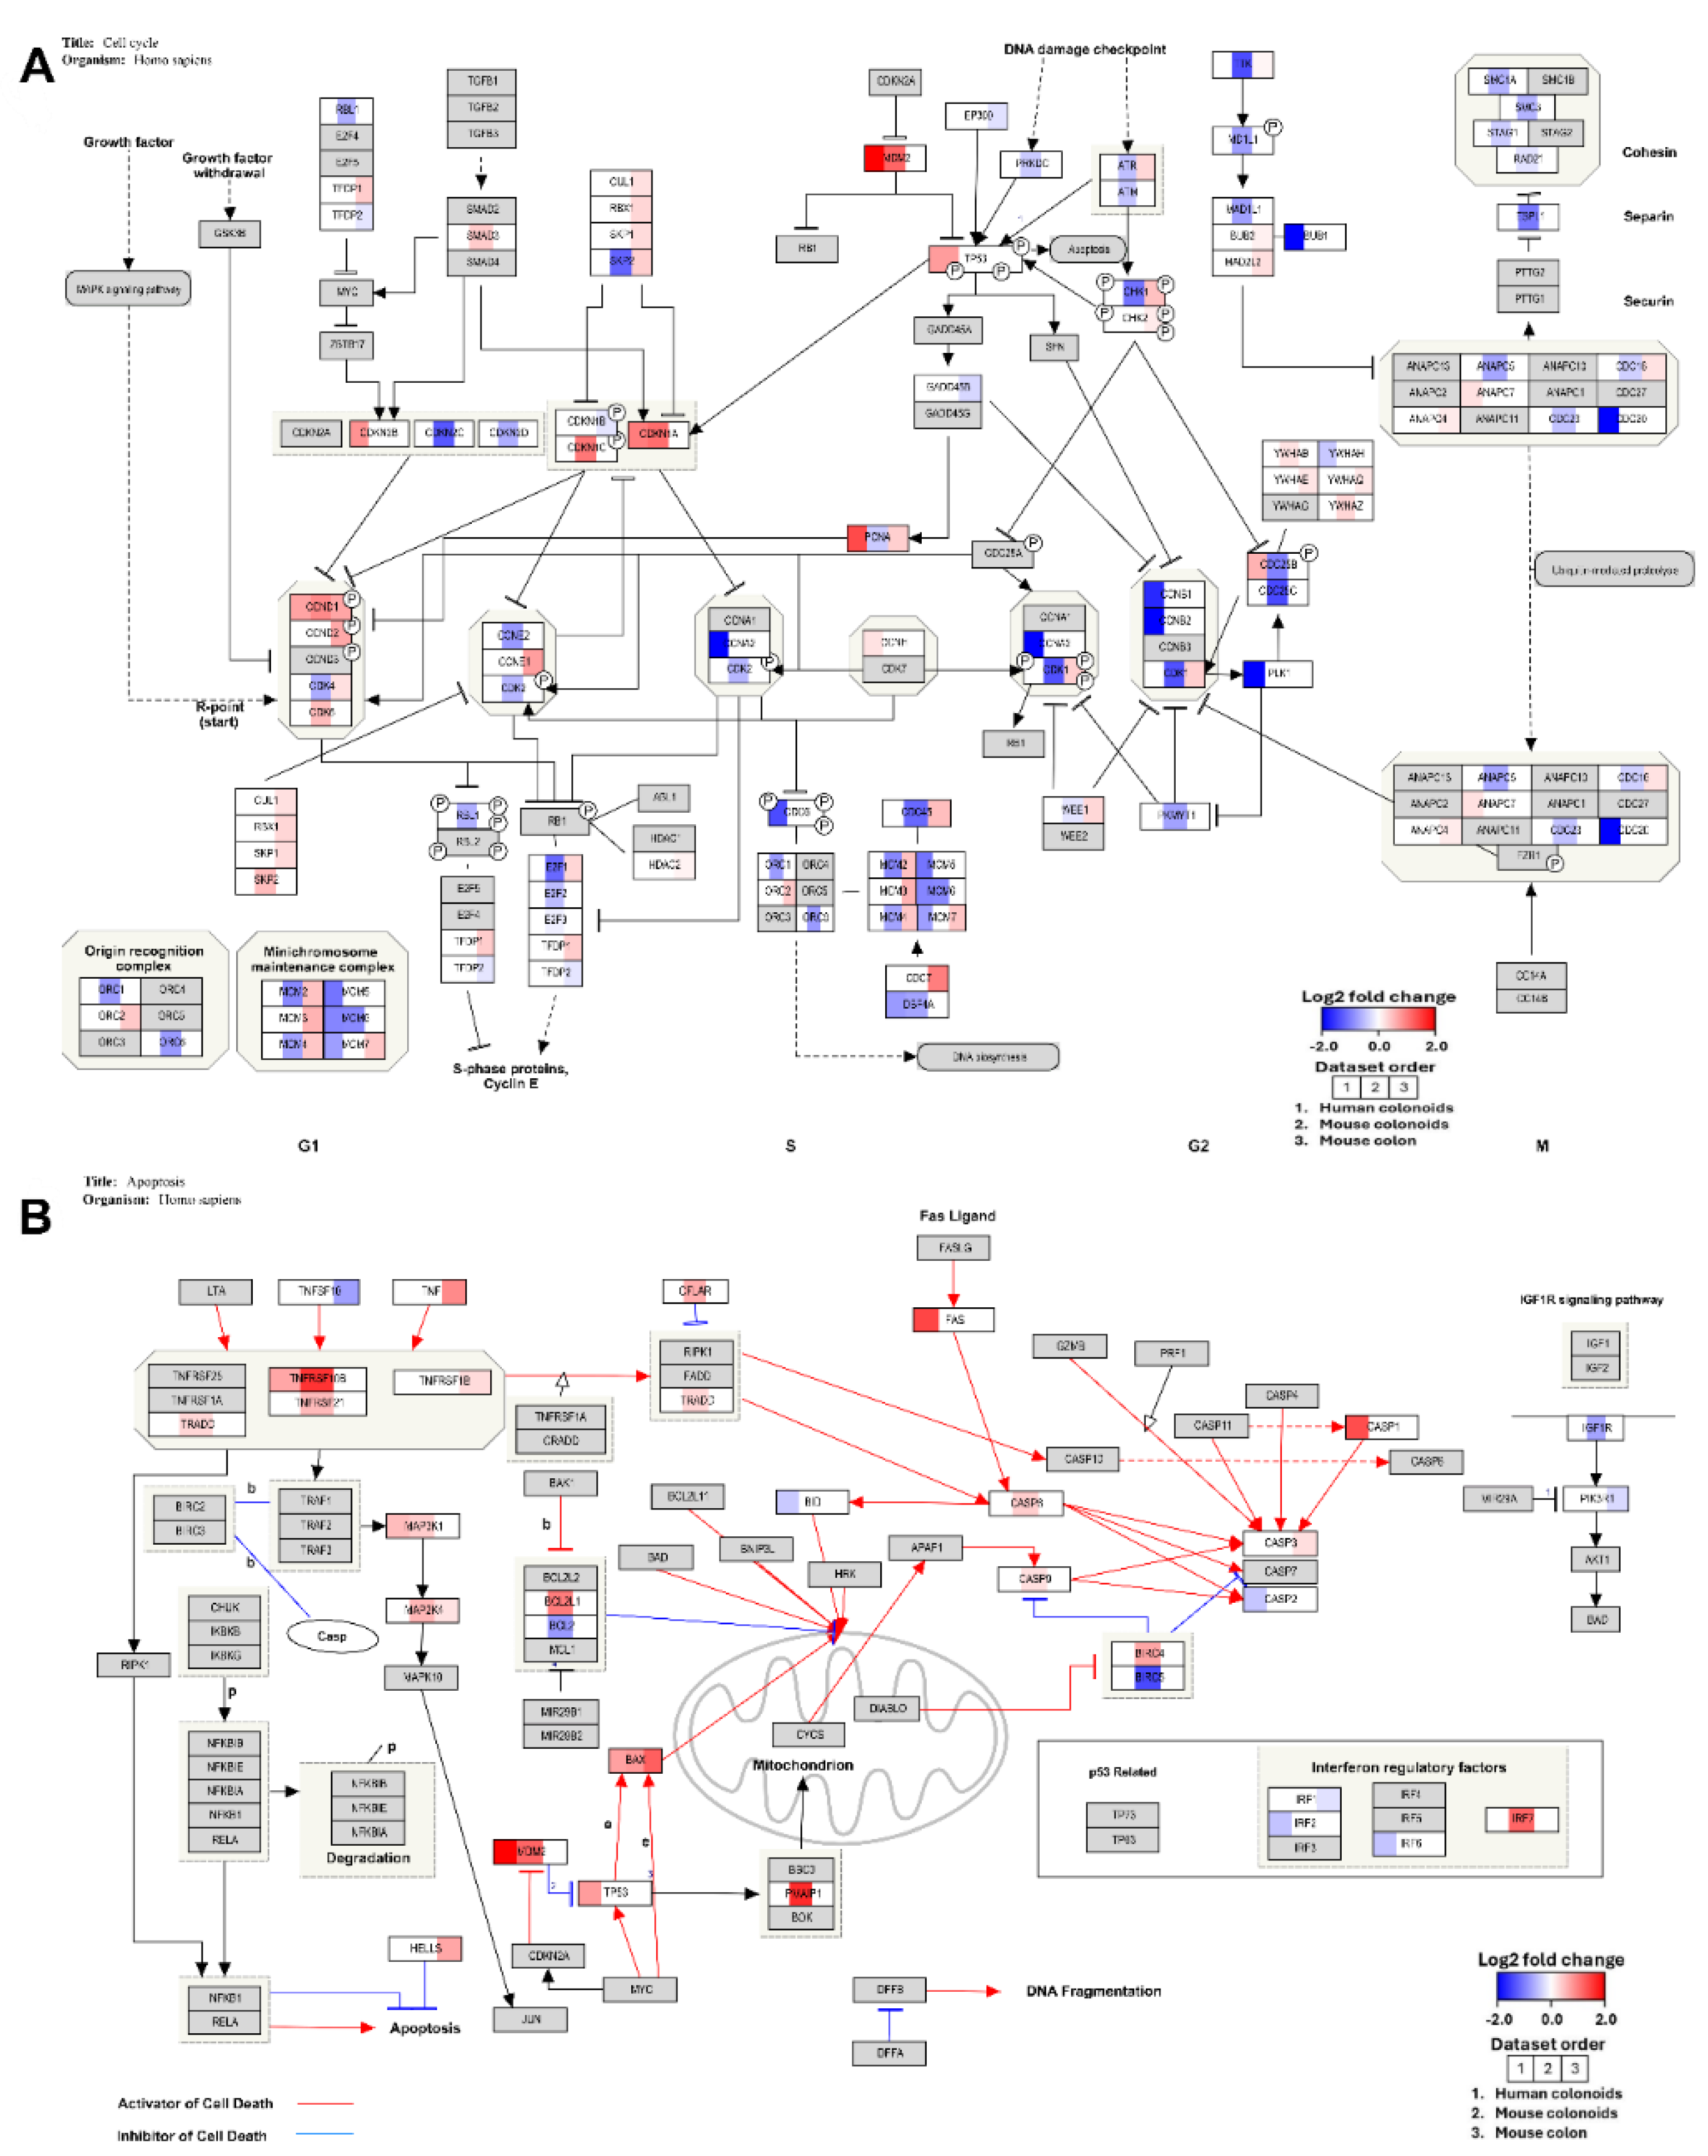
Figure 4.
Gene mapping on DNA Damage Response pathway in response to Doxorubicin in all three models. Each gene is depicted as a vertically segmented box colored by log2(fold-change) (–2 = blue, 0 = white, +2 = red), with the left segment representing human colonoids, the middle segment mouse colonoids, and the right segment mouse colon.
Figure 4.
Gene mapping on DNA Damage Response pathway in response to Doxorubicin in all three models. Each gene is depicted as a vertically segmented box colored by log2(fold-change) (–2 = blue, 0 = white, +2 = red), with the left segment representing human colonoids, the middle segment mouse colonoids, and the right segment mouse colon.
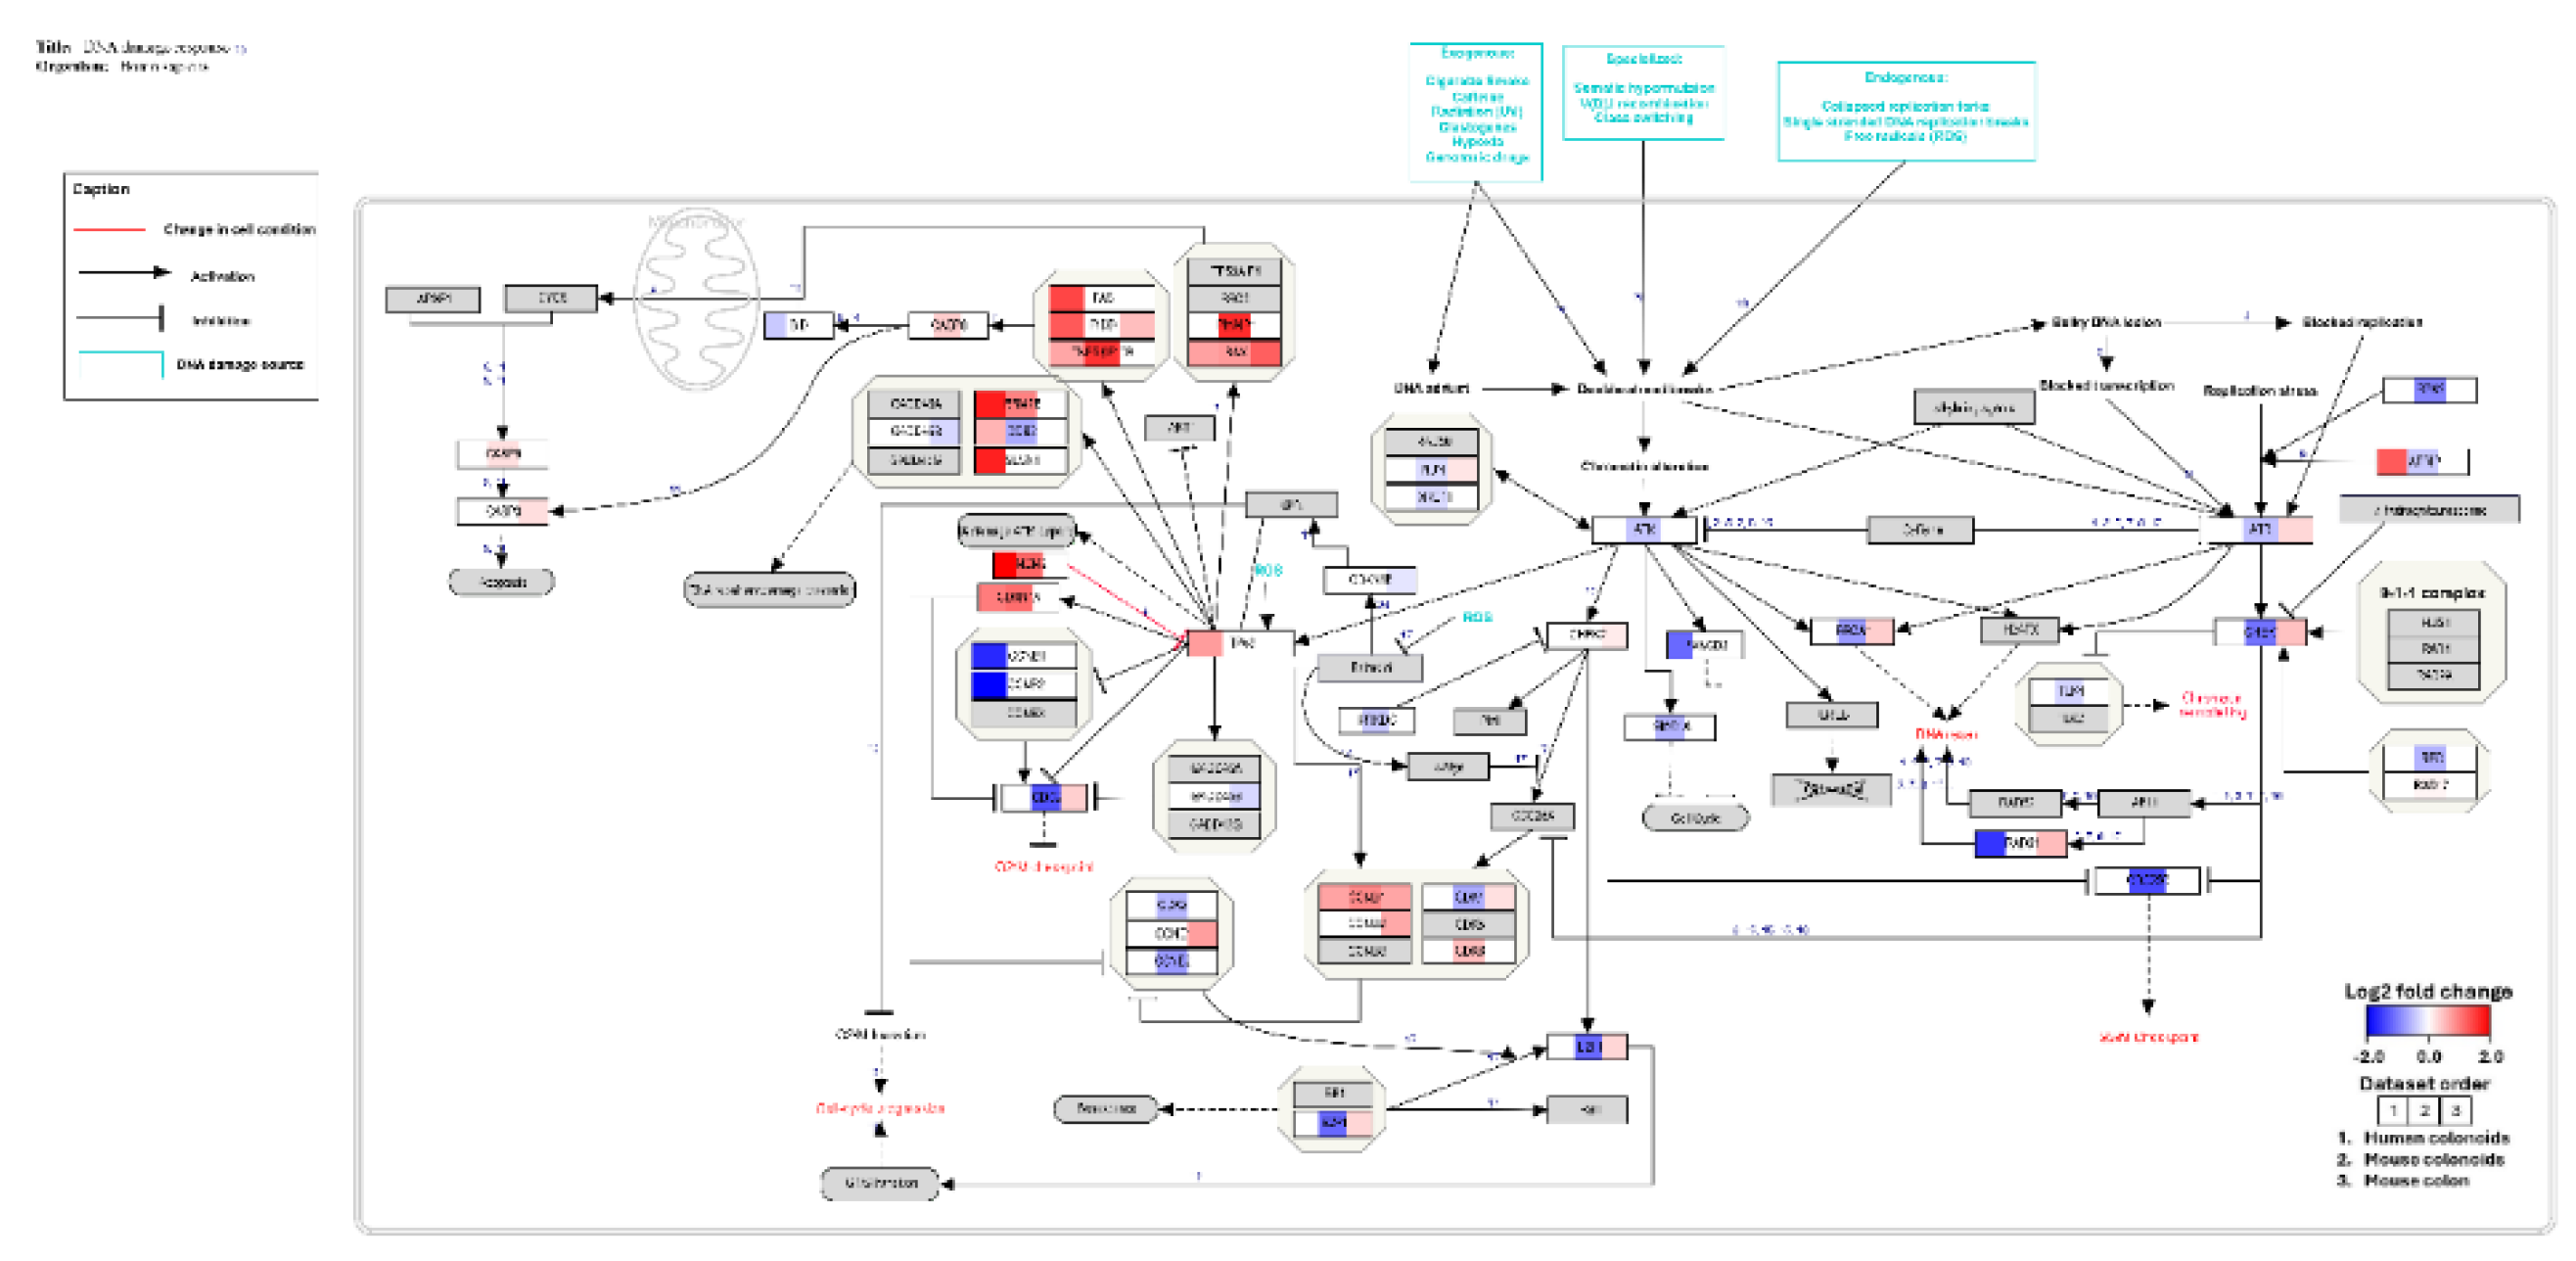
Figure 5.
Cross-referencing the overlapping DEGs and WGCNA genes against CTD. (A) CTD Annotation Coverage of Doxorubicin-Responsive Genes Across Models. (B) Displays the agreement based on Match, Mismatch, or Ambiguous among the CTD-supported genes (209 in Human colonoids, 206 Mouse colon, and 264 Mouse colonoids).
Figure 5.
Cross-referencing the overlapping DEGs and WGCNA genes against CTD. (A) CTD Annotation Coverage of Doxorubicin-Responsive Genes Across Models. (B) Displays the agreement based on Match, Mismatch, or Ambiguous among the CTD-supported genes (209 in Human colonoids, 206 Mouse colon, and 264 Mouse colonoids).
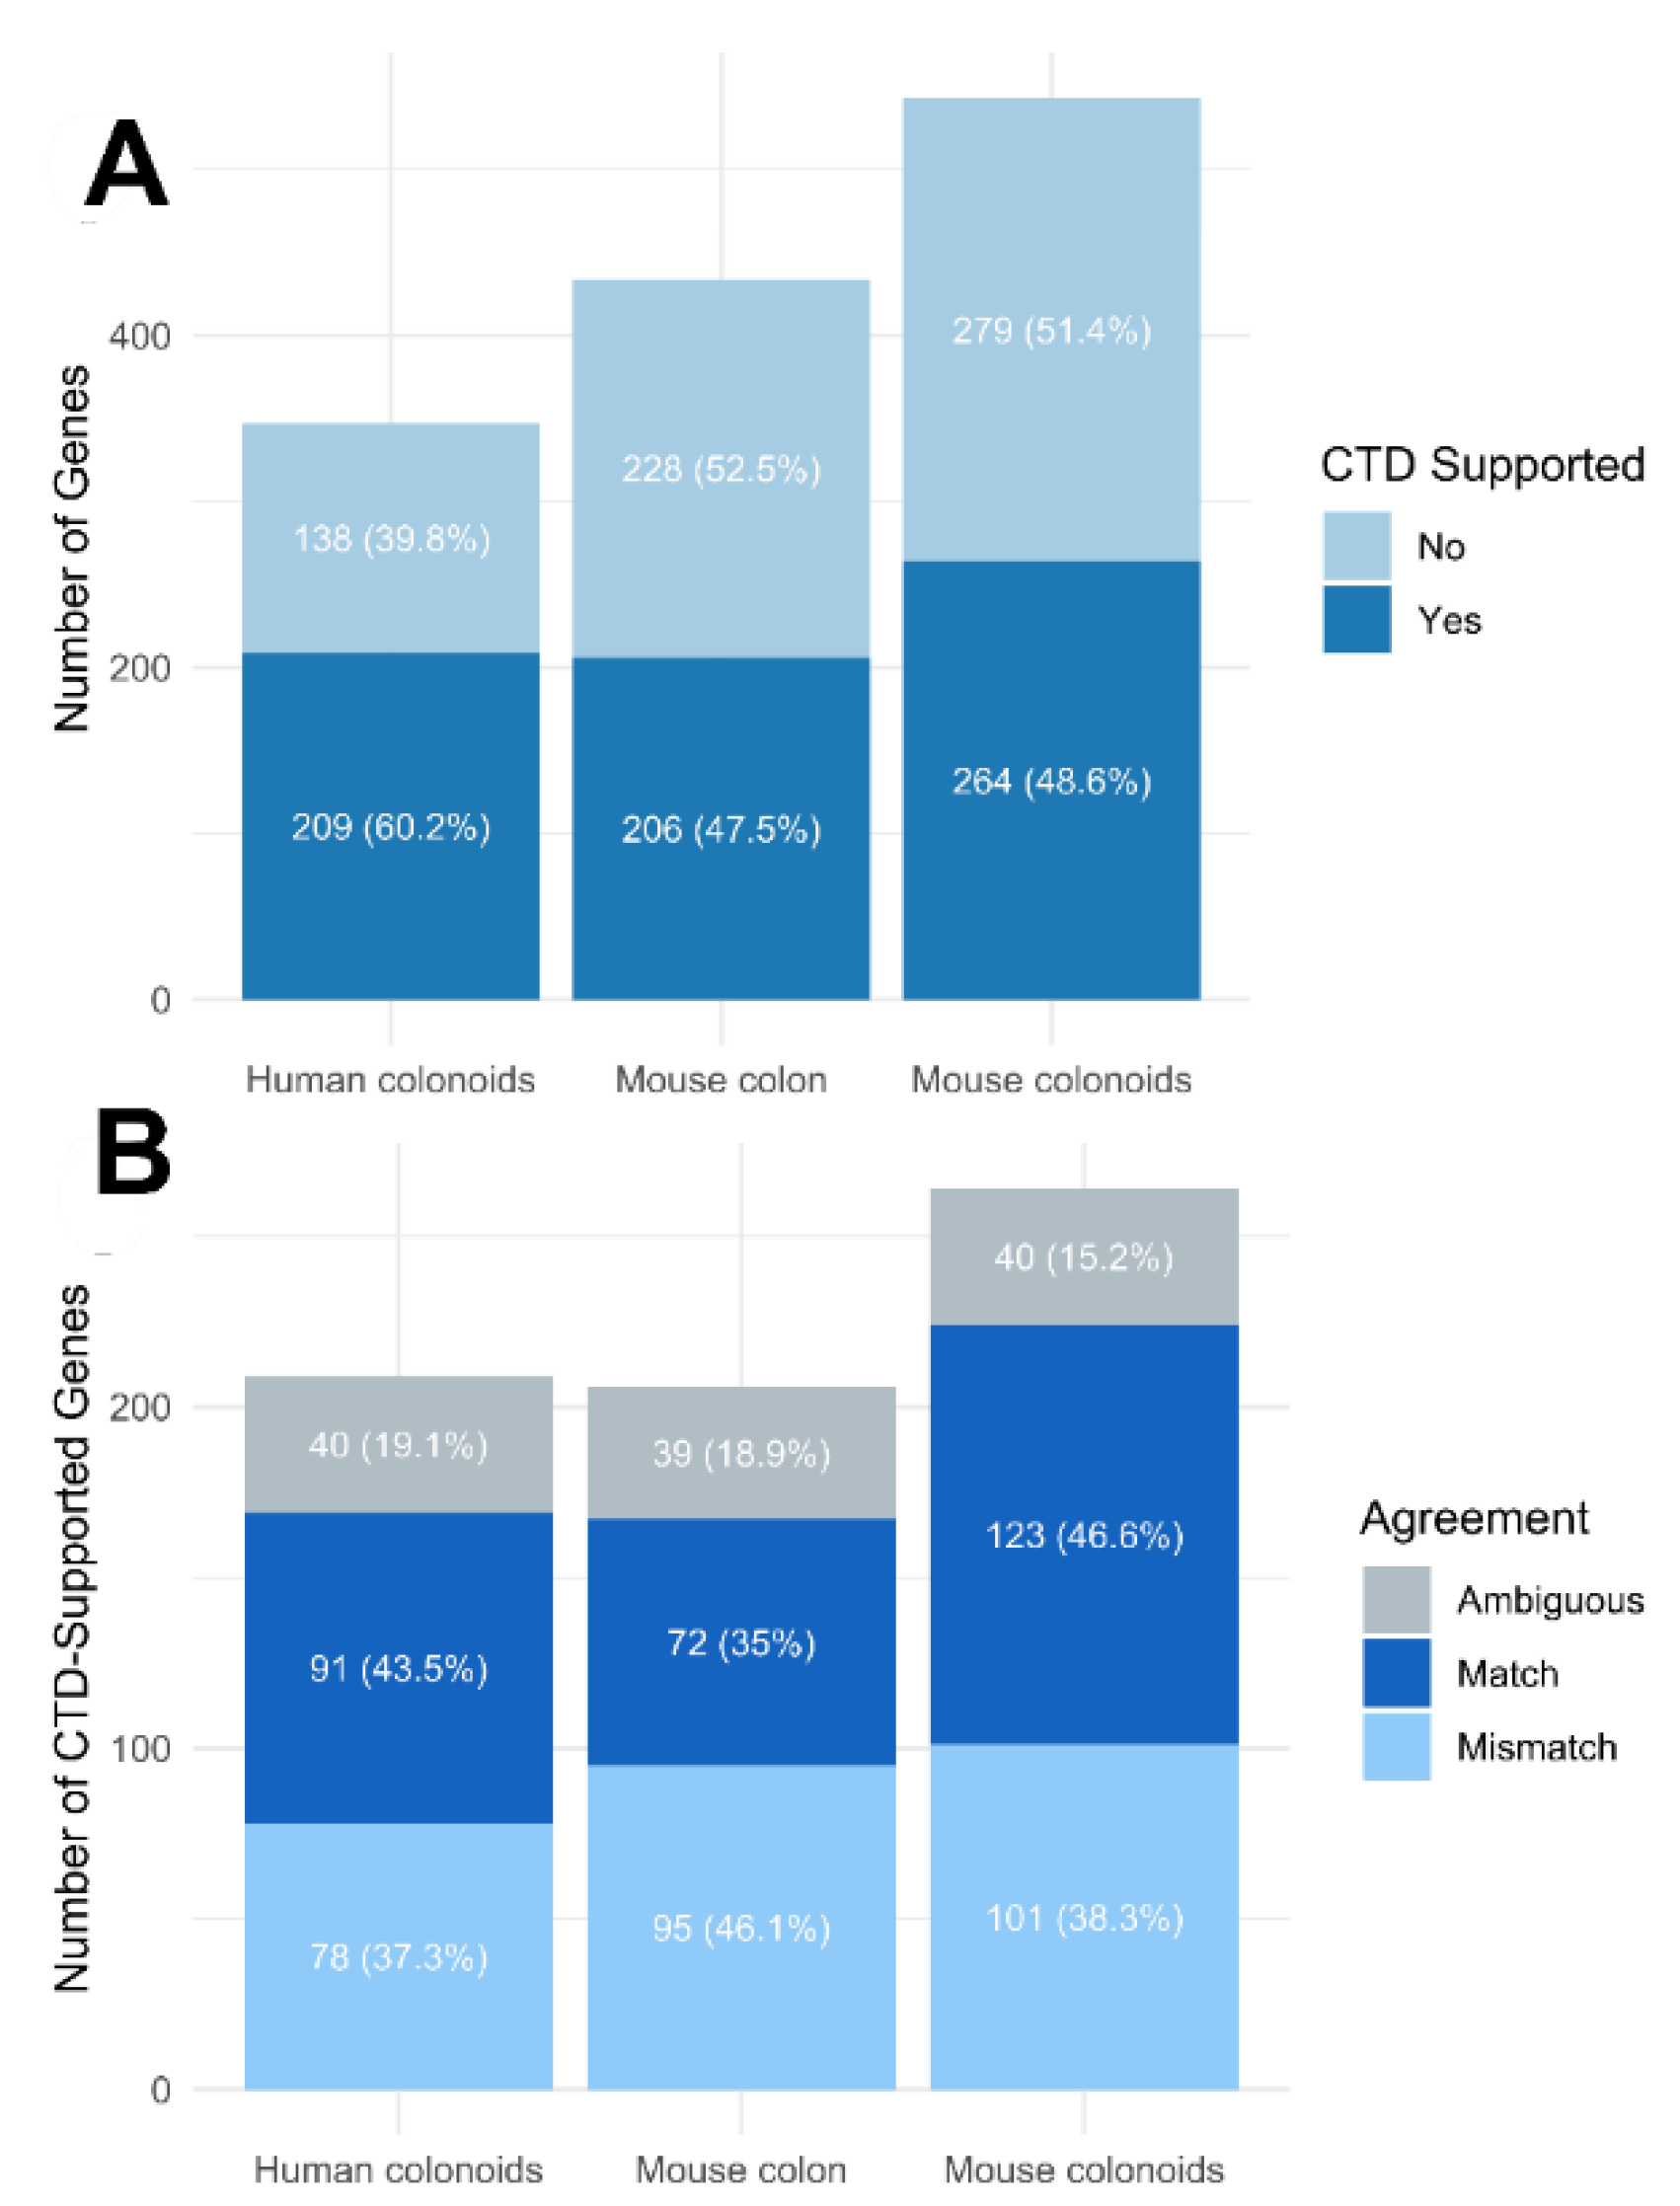

Table 1.
Shared differentially expressed genes (DEGs) across human colonoids, mouse colonoids, and mouse colon.
Table 1.
Shared differentially expressed genes (DEGs) across human colonoids, mouse colonoids, and mouse colon.
| Gene Symbol | Gene Name | General Function |
|---|---|---|
| INKA2 | Inka Box Actin Regulator 2 | PAK4 inhibitor |
| EPHX1 | Epoxide Hydrolase 1 | Lipid metabolism |
| PLK2 | Polo Like Kinase 2 | Cell-cycle regulator |
| MEP1B | Meprin A Subunit Beta | Zinc metalloprotease |
| ZMAT3 | Zinc Finger Matrin-Type 3 | Apoptosis mediator |
| AEN | Apoptosis Enhancing Nuclease | Apoptosis mediator |
| EI24 | Autophagy Associated Transmembrane Protein | Apoptosis mediator |
| BAX | BCL2 Associated X, Apoptosis Regulator | Apoptosis mediator |
| CCND1 | Cyclin D1 | Cell-cycle regulator |
| GBA1 | Glucosylceramidase Beta 1 | Lipid metabolism |
| ITM2B | Integral Membrane Protein 2B | Protease inhibitor |
| LIPA | Lipase A, Lysosomal Acid Type | Lipid metabolism |
| POLR2H | RNA Polymerase II, I And Subunit H | RNA polymerase |
| PCNA | Proliferating Cell Nuclear Antigen | DNA replication |
Disclaimer/Publisher’s Note: The statements, opinions and data contained in all publications are solely those of the individual author(s) and contributor(s) and not of MDPI and/or the editor(s). MDPI and/or the editor(s) disclaim responsibility for any injury to people or property resulting from any ideas, methods, instructions or products referred to in the content. |
© 2026 by the authors. Licensee MDPI, Basel, Switzerland. This article is an open access article distributed under the terms and conditions of the Creative Commons Attribution (CC BY) license (http://creativecommons.org/licenses/by/4.0/).
Copyright: This open access article is published under a Creative Commons CC BY 4.0 license, which permit the free download, distribution, and reuse, provided that the author and preprint are cited in any reuse.


