

Submitted:
25 June 2026
Posted:
26 June 2026
You are already at the latest version
Abstract
Next Generation funds in Spain have represented an injection of resources aimed, among other objectives, at improving the energy efficiency of the housing stock constructed prior to the entry into force of regulations on the reduction of energy consumption and emis-sions. The implementation of these subsidies, the preparation of project documentation and their evaluation using simulation software tools, as well as their execution and the results obtained, have generated a relevant field of study.
Through the direct analysis of a case study and the empirical experience derived from other cases in the Community of Madrid, the differences and similarities between the re-sults of energy simulation models and actual building performance are analyzed, as well as some of the technical-construction and administrative difficulties that arise in the prac-tical implementation of the Next Generation program.
From the results obtained, a series of conclusions and reflections are derived regarding potential improvements, both in the building evaluation phase and in the direct imple-mentation of the program.
Keywords:
energy efficiency
; energy simulation
; energy rehabilitation
1. Introduction
The Next Generation funds of the European Union (NGEU) arise as an EU initiative following the pandemic to promote a more ecological, digital, and resilient economy [1]. A portion of these funds is specifically allocated to improving the energy efficiency of the building stock, and in particular, to improving the energy efficiency of housing [2]. In Spain, the amount of NGEU funds specifically allocated to the Housing Rehabilitation and Urban Regeneration Plan amounts to a total of €6.82 billion. This budget is primarily structured through Component 2 of the Recovery, Transformation and Resilience Plan (PRTR) [3]. Specifically, €3.42 billion is directly allocated to the rehabilitation of housing and neighborhoods.
According to the census published in 2011, Spain currently has a building stock of 25,208,623 dwellings. It is estimated that approximately half of this amount (around 13,000,000) was constructed before 1980 [4], when the first energy insulation regulation began to be applied, the Basic Building Standard NBE-CT-79 on thermal conditions in buildings, which established the first comprehensive energy efficiency regulation for buildings in Spain. This standard was replaced in 2006 by the introduction of the Basic Document HE Energy Saving (DB-HE) of the Technical Building Code (CTE), a document that has been updated in subsequent years, increasing regulatory requirements in terms of limiting CO₂ emissions and reducing energy consumption [5].
The residential building stock in Spain accounts for 19% of the country’s final energy consumption [6], and within this, energy consumption for heating and air conditioning represents 40% of household energy expenditure [7]. In other words, the lack of energy efficiency in housing accounts for 7.9% of the total energy consumed in the country. These deficiencies are not only concentrated in existing housing built without any energy efficiency regulations, but also extend to housing constructed under the NBE-CT-79 standard (approximately 8,000,000 dwellings), which did not limit energy consumption or demand, and only addressed insulation, with standards significantly lower than those required by the later CTE-HE regulation.
Therefore, improving energy efficiency in the residential sector, and specifically the improvement and rehabilitation of those construction elements that determine it, can be considered a strategic national priority for reducing energy demand and limiting CO₂ emissions [8], and as such is included in the PRTR.
Numerous studies have demonstrated the significant reduction in energy demand that can be achieved through comprehensive rehabilitation of residential buildings, both through general studies [9] and in their application to case studies [10]. However, this practice has consistently presented implementation challenges that are difficult to resolve. On the one hand, there is the difficulty of reaching agreement among homeowners’ associations to undertake high-cost works [11], especially considering that the oldest building stock generally corresponds to lower-income populations [12]. On the other hand, there are regulatory challenges associated with such interventions, particularly the requirement to comply with urban planning regulations for buildings which, due to their age, were originally constructed outside of these frameworks.
Although there have been some initiatives from the private sector [13], the only viable solution to address both challenges at scale has been direct public administration involvement, either by fully or partially financing these interventions and facilitating the administrative procedures required for their execution. The Next Generation funds and their regulatory framework were intended to support this objective.
The Next Generation funding and subsidy program has been implemented in Spain through the Autonomous Communities, which have established their own support protocols. For example, the Community of Madrid has defined a program in which subsidies are granted based on two variables: energy consumption savings (kWh/m²·year) and reductions in CO₂ emissions. This is achieved through a system that subsidizes costs according to predefined performance tiers of achieved savings (45%, 65%, 80%), while also establishing maximum limits per dwelling within each tier [14].
In order to access the program, it is necessary to prepare an architectural project specifying the proposed improvement measures and providing a detailed cost assessment. It is also essential to quantify the building’s energy demand and certify its emissions level. In addition, the expected savings resulting from the proposed intervention must be evaluated. Both aspects are carried out using simulation software tools approved by the administration [15].
The challenges encountered in the implementation of the Next Generation program are diverse in nature, but can be broadly summarized in two main categories:
- Technical-scientific challenges: These relate to the practical application of the program elements, for example, the application of simulation tools to actual building performance and the validation of their results by comparing them with measured conditions. They also involve the varying degree of difficulty in the real-world implementation of the architectural and construction corrective measures required for building rehabilitation.
- Administrative challenges: These relate to the slow pace of verification and implementation processes, as well as the difficulties in adapting the proposed solutions to existing regulatory frameworks.
The following sections address both sets of challenges through practical experiences derived from the implementation of the Next Generation program, based on the processing of multiple rehabilitation project files in the Community of Madrid. In addition, more specific issues are examined through a detailed case study.
2. Materials and Methods
In the case of the technical-scientific issues, a residential building rehabilitated under the Next Generation program has been used as a case study, located in a residential expansion area of the city of Alcalá de Henares, in the Community of Madrid. It is a building constructed in 1977 (prior to the entry into force of the NBE-CT-79 standard), comprising 47 dwellings and 12 stories, with 4 dwellings per floor (except for the ground floor, which has 3), with a usable floor area of 84 m² per dwelling and a total gross floor area of approximately 4,700 m² (Figure 1) .
In this building, a rehabilitation project and construction works have been carried out within the framework of the Next Generation program. For this purpose, in addition to preparing the standard project documentation (technical reports, regulatory compliance documentation, specifications, health and safety study, cost estimate, drawings of the existing condition, drawings of the rehabilitated condition, construction details, waste management studies, and life-cycle assessments), it was necessary to carry out an energy evaluation of the building through an officially approved simulation software system, in this case the CE3X V2.3 program, developed by the National Renewable Energy Centre (CENER) and the company Efinovatic. The evaluation consisted of simulating both the pre-intervention condition of the building and the rehabilitated condition.
Following the architectural rehabilitation intervention, and in order to compare the results obtained with those predicted, a study of the actual conditions of the building was carried out using a TESTO 635-2 instrument equipped with an internal probe with three thermocouples for measuring surface temperature of the walls, and a wireless external probe for measuring ambient temperature and humidity. Measurements were conducted in accordance with the Spanish UNE standard governing thermal transmittance (U-value) testing in building enclosures, UNE-ISO 9869-1:2023 [16], specifically for in-situ measurements using the heat flow meter method. This standard establishes the procedure for directly measuring thermal resistance and transmittance in real construction elements under actual conditions. It is applied within the framework of verification of the CTE DB-HE to confirm actual U-values in façades, roofs, and floors, using heat flux sensors and surface and ambient temperature measurements (Figure 2)
Thermographic analyses were also carried out using a FLIR MSX thermal imaging camera, in order to establish comparisons of heat transfer through the building envelope between the pre-intervention and post-intervention conditions.
Based on the measured data obtained and their comparison with theoretical data, several discussions are developed regarding the effectiveness of the measures adopted and the energy efficiency actually achieved, as well as the effectiveness of simulation-based calculation methods. Through empirical methods derived from construction experience, a discussion is also presented regarding the practical applicability of some of the technical-construction measures used. Finally, and also based on empirical experience, in this case derived from approximately ten rehabilitation project files in the Community of Madrid under the Next Generation funding framework, a discussion is presented on their actual management and operational performance, as well as on the challenges associated with their implementation and the implications within the regulatory and urban planning framework of the adopted measures and their management, which are not always straightforward or efficient.
3. Results
3.1. Existing Condition and Description of the Intervention.
The effectiveness of rehabilitation interventions aimed at improving energy efficiency, as previously noted, is well established. Fundamentally, these interventions can be divided into two main categories:
- Intervention on the building envelope: affecting walls, openings, roofs, and spaces beneath floor slabs or ground-floor slabs.
- Intervention on building systems: primarily affecting heating and cooling systems, domestic hot water (DHW), lighting, and electrical supply for household appliances.
Envelope interventions are primarily focused on improving the thermal transmittance of construction elements. In the case of walls without insulation, as in the case study (since it is a building constructed prior to any sector-specific regulation), the intervention consists of adding either internal or external insulation. Internal insulation is typically implemented by injecting insulating materials into cavities, in order to avoid reducing usable interior space through the addition of new layers. However, this solution limits the thickness of the insulation and does not provide continuity across the façade, and therefore does not eliminate thermal bridges.
External insulation systems are implemented either through superimposed insulation in ventilated façades (a more expensive option), or through External Thermal Insulation Composite System (ETICS). These systems have the advantage of reducing or eliminating thermal bridges, as they provide continuity across the façade (slab edges and façade columns) and can wrap lintels and jambs of openings, although typically with reduced thicknesses. Although the large-scale implementation of these systems in rehabilitation is still under development, there are already some studies regarding their effectiveness [17]. In the case study, the use of the approved DANOTHERM MW system was selected [18]. This system incorporates mineral wool as the insulating material, with a thermal conductivity of 0.034 W/m·K and a Euroclass A1 fire rating (“non-combustible”), preventing external fire propagation (Figure 3).
The roof was addressed by improving waterproofing and installing, above it, a drained concrete paver system together with 8 cm of XPS insulation. The ground floor slab was insulated using a system of 4 cm XPS insulation boards adhered to the underside within the cavity between the slab and the ground.
However, the improvement of windows could not be included in this rehabilitation, and based on other empirical experience, it has been found that this is generally a difficult component to incorporate. In residential communities of a certain scale, such as the case under study, it is common to find a high degree of variation between different residential units. Some retain original window frames from the time of construction, made of aluminum or steel without thermal break and with 4 mm glazing, with very high thermal transmittance values (around 5.7 W/m²·K). Others have undergone renovations and incorporate more modern frames and glazing that comply with current regulations. Between these extremes, there are numerous intermediate situations resulting from highly varied renovation interventions.
Given that the subsidy system is applied uniformly at the building level and does not allow for exceptions or case-by-case evaluation, the common approach in the region, in order to avoid conflicts or perceived inequities, is not to include a comprehensive renovation of openings in the project. This clearly has a negative impact on the final results of the post-intervention evaluation.
With regard to building systems, it is also not common to undertake their renovation unless they are centralized systems. In the case study, the building had highly heterogeneous individual heating and cooling systems, including some heat pump systems for space conditioning and electric water heaters for DHW, but predominantly gas boilers (both sealed and atmospheric) for heating and DHW production. In some cases, individual dwellings also had air conditioning units or heat pumps for cooling.
This heterogeneity of systems, together with established patterns of individual energy consumption, creates an additional challenge when proposing centralized heating and cooling systems which, although more efficient, require unanimous approval for their installation. The same applies to the inclusion of renewable corrective measures, such as the installation of solar panels on the roof for on-site electricity generation. Clearly, the exclusion of these measures negatively affects the final energy efficiency of the intervention, although it reduces its direct cost.
3.2. Energy Performance Evaluation.
As previously noted, the evaluation of the building’s energy efficiency for submission to the Next Generation subsidy program is carried out using the CE3X V2.3 simulation software. The program requires certain general building data (surface areas, climate zone according to CTE-DB-HE, DHW consumption per occupant) and adopts some default values, such as ventilation (0.6 air changes per hour).
Once the building envelope data (walls, roofs, ground floor slabs) have been defined, it is possible to specify the openings and types of windows, as well as to define the dimensions and characteristics of thermal bridges. The program also allows the introduction of shading parameters by façade, opening, and orientation. All data are entered manually without incorporating form factors, and therefore the program assimilates the data to that of a reference rectangular building, which significantly reduces the accuracy of the results. In another tab, data relating to the building systems are introduced (type of generation system, fuel, and system efficiency).
The program accepts default values according to year of construction, although this definition is also clearly imprecise. It also allows the input of known values through a layer-based interface that calculates the total thermal transmittance of the envelope element by summing the thermal resistances of each layer. In the case study, the following results were obtained (Figure 4).
Thee results, when compared empirically with other buildings from the same period, of similar construction and floor area and within the same climate zone, fall within a consistent range of values [19,20].
The envelope improvements proposed in the rehabilitation project involved the installation of an ETICS with 10 cm of external mineral wool insulation applied to the existing wall. The resulting difference in thermal transmittance between the two wall conditions was significant, decreasing from approximately 1.56 W/m²·K in the original wall to approximately 0.26 W/m²·K in the rehabilitated wall, according to the values calculated by the simulation program. The rest of the envelope also improved its transmittance values with the addition of insulation in the roof (8 cm of XPS) and beneath the slab (4 cm of XPS). Openings (windows and frames) and building systems were maintained in their initial condition, as previously indicated. The final energy simulation results for the rehabilitated condition yielded the following theoretical values, calculated by the program (Figure 5).
The difference between the reduction in energy demand (kWh/m²) (56.11%) and the reduction in CO₂ emissions (48.49%) is explained by the different basis of their calculation. While energy demand refers to the total amount of energy required by the building to satisfy its thermal needs, regardless of the energy source, emissions are associated with the CO₂ impact required to supply that demand, depending on the efficiency of the systems and the type of energy source used. This impact is determined through the so-called “valores de paso,” namely the primary energy conversion factors defined by the Spanish Government [21].
Once the building’s energy demand and the initial and final emissions values have been determined, it is possible to apply for Next Generation funding based on the results obtained. This is done through an application system of the Community of Madrid that correlates these values with the predefined subsidy tiers [22]. The percentage improvement in energy demand reduction determines whether the project falls within the range of eligible interventions, while the percentage improvement in emissions determines the level of subsidy applicable to the cost of the rehabilitation. In the case study, the building remained within a subsidy range corresponding to a 45% to 60% reduction in CO₂ emissions, which implies a subsidy level of 65% of the construction costs
4. Discussion
Given that the level of subsidy depends on the results of the energy savings achieved, it is relevant to examine how the data supporting those savings are obtained. An important aspect to consider is that the verification of the results is carried out exclusively on the basis of the outputs from the simulation software. The program only accepts as known data those derived from predefined construction layer configurations. This is because the simulations performed for the proposed condition, incorporating insulation layers, must use as a baseline the same wall elements defined in the original condition. These elements are standardized within a database associated with the software.
In order to verify how thermal transmittance is calculated, a comparison was made between the calculation performed using the CE3X program and another calculation carried out using the UBAKUS program. In the CE3X certification program, a thermal transmittance value of 1.56 W/m²·K was obtained for the original façade of the building. However, in the UBAKUS program, using the same layers, dimensions, and construction definitions of the elements composing the wall, the resulting transmittance value was 1.26 W/m²·K. This difference is due to the different construction element libraries used by both programs, in which certain parameters, such as the thermal conductivity of materials, vary.
In reality, both calculations are approximate, given the difficulty of establishing the actual conditions of materials dating from the 1970s. However, in the simulations carried out for the rehabilitated wall, with the inclusion of external insulation, there are hardly any differences between the transmittance values obtained in the CE3X simulation program (0.26 W/m²·K) and those obtained in the UBAKUS program (0.27 W/m²·K). This demonstrates that the inclusion of external insulation minimizes differences and tends to produce more consistent thermal transmittance values, regardless of variations in the composition of the original wall assembly. This is due to the strong influence of the thermal conductivity of the insulation material on the overall behavior of the wall compared to the other components.
Another output provided by the UBAKUS program relates to the condensation point of the enclosure. In the original enclosure, it is observed that interstitial condensation may occur within the cavity at temperatures below 4°C, whereas this risk disappears in the rehabilitated enclosure with the addition of external insulation (Figure 6).
To verify the baseline assumptions, field testing was carried out in parallel with the energy simulation work during the execution of the construction works, consisting of obtaining the actual thermal transmittance values of the building in both the pre-intervention condition and the final condition. For this purpose, both the original façade walls and the rehabilitated insulated walls were tested.
The field measurements obtained, excluding outlier data, yielded values for the original wall on the order of 2.4 W/m²·K (significantly higher than those obtained in the simulation programs), and values of approximately 0.25 W/m²·K for the insulated wall, even improving upon the values obtained in the prior simulation (Figure 7).
The first result, although it appears to deviate from what would be expected based on the simulation data, nevertheless confirms a pattern that has been observed in other tests carried out on existing walls: namely, that the actual building behavior does not correspond to that of a system under stable and predefined conditions [23]. Deficient construction execution, deterioration over time, and successive interventions on the walls have led to weathering, cracking, material loss, and increased porosity, which have affected the physical properties of the materials, reducing the initial thermal resistance of both the individual materials and the enclosure as a whole.
The simulation program indicates the possibility of condensation on the interior surface of the air cavity below certain temperatures. Several studies have demonstrated the direct relationship between increased moisture content in masonry walls and increased thermal transmittance, a phenomenon directly related to material degradation and increased porosity and water absorption capacity [24]. In addition, the loss of mortar due to weathering has created voids and pores that allow air leakage between the cavity and the exterior, compromising the airtightness of the wall and increasing heat loss from the interior.
All of these factors significantly alter the baseline conditions assumed to be optimal in simulation programs, which makes the differences observed between simulation results and in-situ measurements fully understandable.
The close agreement between the measured data and the simulation results for the rehabilitated wall can be explained by two factors. On the one hand, the tendency toward homogenization of results due to the dominant influence of the thermal conductivity of the insulation within the wall assembly, as previously observed in the simulation data. On the other hand, the physical effect of the installation of the insulation and its external protective layer, which protects and seals the wall, minimizing thermal losses due to material porosity and reducing moisture content by preventing external water ingress.
In order to complement the data obtained and to verify the correct execution of the construction works with respect to the installation of the insulation, thermographic analyses of the façade were also carried out. These show the deficient condition of the exposed brick masonry prior to the intervention, its porosity, and the significant amount of energy lost through the wall. By contrast, the thermographic images obtained after the intervention show the compactness of the wall and its improved airtightness with respect to heat loss (Figure 8).
Finally, it should be noted that the improvement in energy efficiency also implies an improvement in indoor comfort conditions. This can be observed in the differences in temperature curves derived from the transmittance calculations of the UBAKUS program, where a flattening of indoor temperature variations can be seen in the rehabilitated building compared to the variations in outdoor temperature. This effect is also related to the position of the external insulation, which improves the capacity for stabilization of indoor temperature due to the effect of the wall’s thermal mass (Figure 9).
5. Conclusions
The main conclusions derived from the experience of carrying out an energy rehabilitation intervention in a residential building within the Next Generation program in Spain are, first, of a methodological nature, and second, related to administrative management.
As previously discussed, the funds allocated to rehabilitation are granted according to the level of CO₂ emissions savings achieved through the intervention. However, as demonstrated, there is a difference between the measurement of energy efficiency in terms of the reduction in energy demand and the reduction in emissions, with the latter always being lower due to the penalties associated with the primary energy conversion factors. This difference tends to disadvantage buildings equipped with individual heating and cooling systems.
Additionally, potential savings derived from the replacement of window frames and glazing are not included in this calculation. According to some studies, these savings could be estimated at approximately 6% when using commercially available glazing at an acceptable cost [25]. However, as previously noted, these interventions are also difficult to implement in multi-family buildings due to the specific circumstances described earlier. For this reason, it is very difficult for such buildings to exceed the savings threshold established between 45% and 60% reduction in CO₂ emissions.
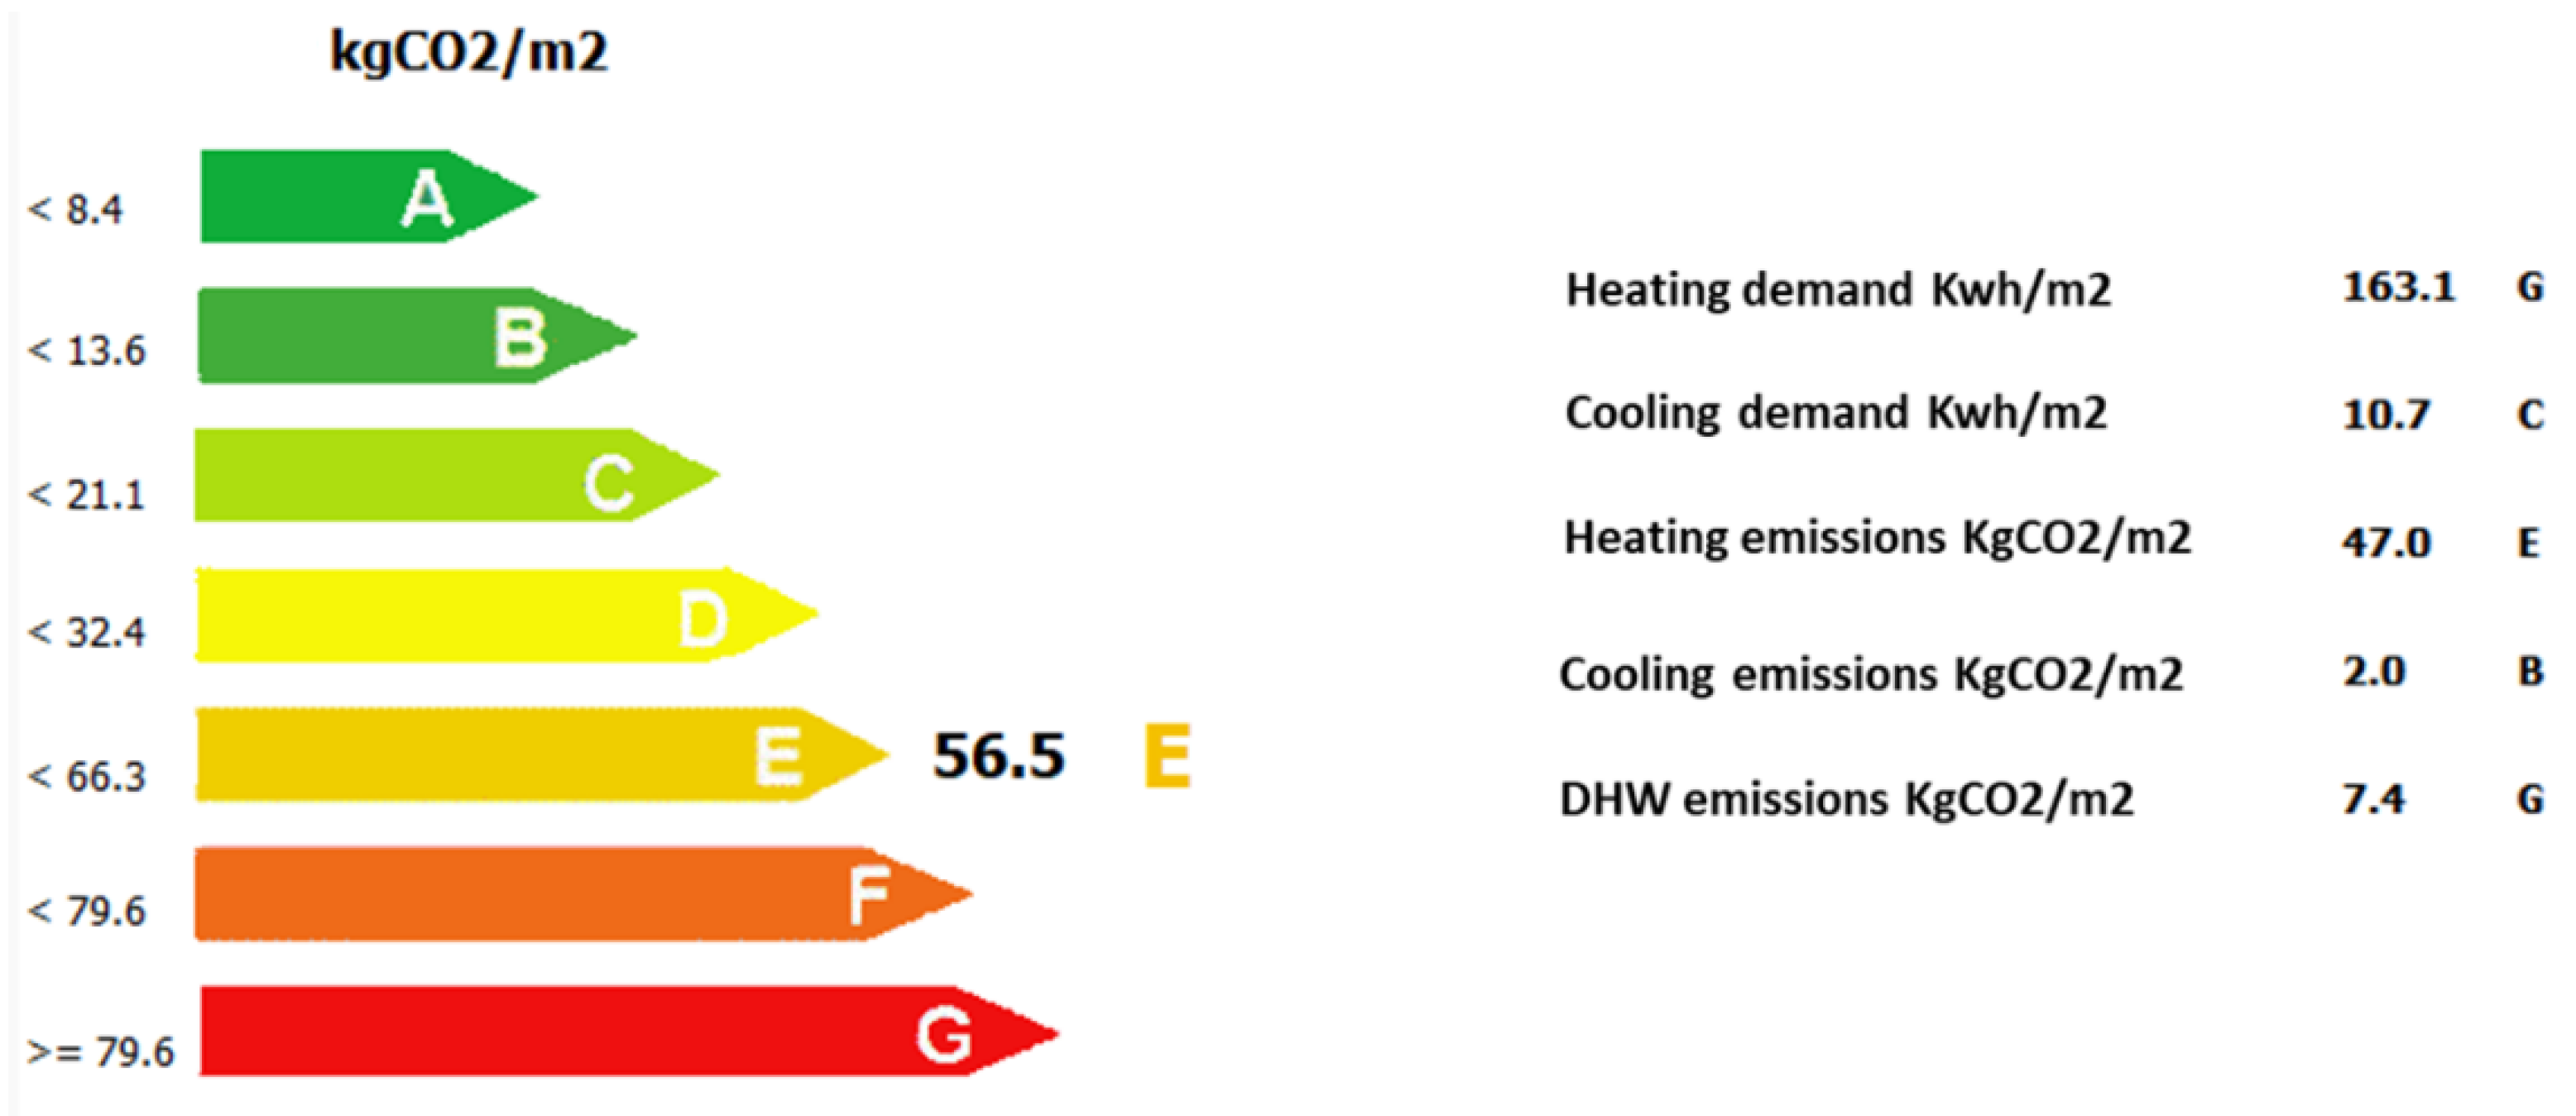
On the other hand, a discrepancy has been identified between the theoretical thermal transmittance values derived from the summation of the thermal resistances of each material layer, as calculated according to the databases of the simulation programs, and the actual transmittance values measured experimentally. If the measured transmittance values had been used as input in the CE3X simulation, significantly higher values of energy demand and emissions would have been obtained, and consequently the difference between the pre-intervention and post-intervention conditions would also have been significantly greater (Figure 10).
These differences imply an increase of approximately 8% in emissions and 10% in energy demand compared to the initially calculated values. Even so, the savings relative to the rehabilitated building would amount to approximately 60% in energy demand and 52% in emissions, still below the 60% emissions reduction threshold required to move to the next subsidy tier. A remaining difference of approximately 8% would be difficult to offset solely through window replacement and would necessarily require adjustments in the design of the building systems.
In any case, the analysis demonstrates, on the one hand, that the existing housing stock is in a state of thermal deficiency greater than previously estimated, and on the other hand, that the savings achieved through building envelope rehabilitation are also greater than those theoretically predicted. Clearly, introducing the measured transmittance values of existing elements as input variables in simulation programs would increase the complexity of project development and administrative processing (technical validation of measurements, calculation protocols, etc.), and could even introduce additional challenges due to limited access to certain elements. However, it would be possible to define adjustment factors based on observed material degradation, or alternatively to accept empirically derived values as valid inputs.
It is noteworthy, for example, how meticulous the administration is in requiring detailed verification of heat loss to thermal bridges in project documentation, despite the fact that this has a significantly lower impact than substantial variations in thermal transmittance across the entire building envelope [26].
Finally, it should be noted that, although these rehabilitation interventions have the greatest impact on reducing CO₂ emissions in the building sector—far exceeding other types of measures—neither the central nor the regional administration has been able to adequately manage the volume of applications submitted. The project verification and control system, structured around the validation of simulation results, has focused on requiring designers to repeatedly verify minor variables, such as those related to thermal bridges or the impact on energy balance of façade recesses resulting from increased insulation thickness. As has been shown, these factors are of much lower significance than others, such as the actual condition of the building envelope.
This has generated a volume of administrative workload, in the form of requests and responses, that has exceeded the management capacity of the administration. At present, three months before the conclusion of the Next Generation funding program (June 30, 2026), only 59% of the available funds in the Community of Madrid have been executed [27]. This demonstrates that interventions of this nature, which have a significant impact on the national energy balance and, more importantly, on the well-being and comfort of citizens, must be managed with approaches at a different scale than those typically employed by the public administration.
Author Contributions
Conceptualization, Flavio Celis, Fernando da Casa, Ernesto Echeverria. methodology, Flavio Celis, Fernando da Casa, Ernesto Echeverria. software, Flavio Celis and Daniel Diedrich, validation,Flavio Celis and Daniel Diedrich, formal analysis, Flavio Celis, Fernando da Casa, Ernesto Echeverria. Investigation, Flavio Celis, Fernando da Casa, Ernesto Echeverria and Daniel Diedrich. resources, Flavio Celis and Daniel Diedrich. data curation, Flavio Celis and Daniel Diedrich. writing—original draft preparation, Flavio Celis. writing—review and editing, Flavio Celis, Fernando da Casa, Ernesto Echeverria. Visualization, Flavio Celis. supervision, Flavio Celis, Fernando da Casa, Ernesto Echeverria. project administration, Flavio Celis, Fernando da Casa, Ernesto Echeverria. Funding acquisition, Flavio Celis, Fernando da Casa, Ernesto Echeverria. All authors have read and agreed to the published version of the manuscript.
References
- European Commission. The EU’s 2021-2027 long-term Budget and Next Generation EU; Publications Office of the European Union: Luxemburg, 2021. [Google Scholar]
- European Commission. Recovery and Resilience Facility for clean energy. Available online: https://energy.ec.europa.eu/.
- Ministerio de Vivienda y Agenda Urbana. Componente 2: Implementación de la Agenda Urbana española: Plan de rehabilitación y regeneración urbana. Available online: https://www.mivau.gob.es/ministerio/proyectos-singulares/prtr/vivienda-y-agenda-urbana/componentes.
- Ministerio de Fomento – Instituto Juan de Herrera. Análisis de las características de la edificación residencial en España en 2011 a nivel nacional y por comunidad autónoma. Madrid, 2014, pag.6. Madrid. Available online: https://www.mivau.gob.es/recursos_mfom/pdf/AC9B43D8-942F-493D-A291-C09D6885F28A/135888/TomoI_Informe_.pdf.
- Carmona, 5 D.; De La Maya, D.; García, A.; Horrillo, L.A.; Reyes, A.M. The road to nearly zero energy buildings. Case of study: Spain. Comparison between CTE HE 2006 and 2013 in a simulated model. RE&PQJ 2015, Vol.1(n.13), 652–697. [Google Scholar] [CrossRef]
- Ministerio para la transición ecológica y el reto demográfico. La energía en España 2020. Madrid, 2022, pág.48. Madrid. Available online: https://www.miteco.gob.es/content/dam/miteco/es/energia/files-1/balances/Balances/LibrosEnergia/Libro_Energia_Espana_2020.pdf.
- IDAE. Informe Web - Consumo por usos del sector residencial - 16ª edición - Marzo 2025. Available online: https://informesweb.idae.es/consumo-usos-residencial/informe.php.
- Aguacil, S. Rehabilitación energética de edificios residenciales en España y objetivo europeo 2050. Doctoral Thesis, UPC, Barcelona, 18 07 2017. [Google Scholar] [CrossRef]
- Fernández, P.X.; Rubio, C.; Guevara, F.J. Energy rehabilitation of homes in Spain: thermal comfort and effectiveness. An. De Edif. 2019, Vol. 5(Nº 1), 37–50. [Google Scholar] [CrossRef]
- García, J.; Valdivieso, M.; González, M. J. Construction costs and energy consumptions resulting from energy retrofitting in a residential building in Madrid (Spain). J. Constr. 2013, Vol.12(3), 67–75. [Google Scholar]
- Fernández Ans, P. Optimal cost and the economic viability of energy efficient housing renovation in Spain. Habitat Sustentable 2019, Vol. 9(N°. 2), 64–77. [Google Scholar] [CrossRef]
- Lizundia, I.; Etxepare, L.; Sagarna, M.; Uranga, E. J. The cost of the mandatory energy refurbishment of collective housing: a social problem? Inf. De La Construcción 2018, Vol. 70, 551. [Google Scholar] [CrossRef]
- Marmolejo, C.; Biere, R.; Spairani, S.; Crespo, E. Las One-Stop-Shops como modelo emergente en la gestión de la rehabilitación energética en España. Ciudad Y Territ. Estud. Territ. 2022, Vol. LIV, N.213, 593–620. [Google Scholar] [CrossRef]
- Comunidad de Madrid. Ayudas a las actuaciones de rehabilitación energética de edificios residenciales y viviendas – PRTR. Available online: https://www.comunidad.madrid/servicios/vivienda/ayudas-actuaciones-rehabilitacion-energetica-edificios-residenciales-viviendas-prtr.
- Ministerio para la transición ecológica y el reto demográfico. Procedimientos para la certificación de edificios. Available online: https://www.miteco.gob.es/es/energia/eficiencia/certificacion-energetica/documentos-reconocidos/procedimientos-certificacion-proyecto-terminados.html.
- NormaUNE-ISO 9869-1:2023. Available online: https://www.une.org/encuentra-tu-norma/busca-tu-norma/norma?c=N0071788.
- Varela, S. Análisis experimental y simulación del comportamiento térmico del Sistema de Aislamiento Térmico por el Exterior (SATE) en un edificio de viviendas rehabilitado: caso de estudio en Madrid. Doctoral Thesis, Universidad Politécnica de Madrid, 2023. [Google Scholar] [CrossRef]
- Sistema DANOTHERM MW. Available online: https://d7rh5s3nxmpy4.cloudfront.net/CMP1814/files/FCH10_es.pdf.
- de Oteiza San José, I.; Alonso, C.; Martín-Consuegra, F.; Monjó, J.; González, J. M.; Bulson, A. La envolvente energética de la vivienda social. El caso de Madrid en el periodo 1939-1979. CSIC, Madrid, Spain, 2018. pp.21-23. Available online: https://cpage.mpr.gob.es/producto/la-envolvente-energetica-de-la-vivienda-social/.
- Alonso, C. Rehabilitación energética de fachadas: Propuesta metodológica para la evaluación de soluciones innovadoras, basándose en el diagnóstico de viviendas sociales construidas entre 1940 y 1980. Doctoral Thesis, Universidad Politécnica de Madrid, 2015. [Google Scholar] [CrossRef]
- Ministerio de Industria; Energía y Turismo; Ministerio de Fomento. Documento Reconocido del Reglamento de Instalaciones Térmicas en los Edificios (RITE). Factores de emisión de CO2 y coeficientes de paso a energía primaria de diferentes fuentes de energía final consumidas en el sector de edificios en España. Versión 20/07/2014. Available online: https://www.miteco.gob.es/content/dam/miteco/es/energia/files-1/Eficiencia/RITE/documentosreconocidosrite/Otros%20documentos/Factores_emision_CO2.pdf.
- Available online: https://www.comunidad.madrid/sites/default/files/doc/vivienda/rehab_fe_edif_herramienta_indicadores_energeticos_v3.xlsx.
- Echeverría, E.; Celis, F.; De Miguel, M.; Domínguez, P.; Delgado, I.; Mozas, A.; Moreno, K.; Vega, J. M.; Martín, F. Integrated system for energy optimization and reduction of building CO² footprint. Int. J. Sustain. Build. Technol. Urban Dev. 2017, Vol. 8(No. 2), 228–236. [Google Scholar] [CrossRef]
- Cabeza, A. Evaluación de la influencia de la humedad en el comportamiento térmico en los cerramientos de fábrica de ladrillo del patrimonio cultural. Propuesta de ensayo para evaluar el contenido de agua. Doctoral Thesis, Universidad de Valladolid, 2022. [Google Scholar] [CrossRef]
- Hee, W.J.; Alghoul, M. A.; Bakhtyar, B.; Elayeb, O.; Shameri, M.A.; Alrubaih, M.S.; Sopian, K. The role of window glazing on daylighting and energy saving in buildings. Renew. Sustain. Energy Rev. 2015, Volume 42, 323–343. [Google Scholar] [CrossRef]
- Smusz, R.; Korzeniowski, M. Experimental investigation of thermal bridges in building at real conditions. Personal Communication, 2018. In 3S Web Conference, Volume 70, 2018, 17th International Conference Heat Transfer and Renewable Sources of Energy (HTRSE-2018). Article Number 03013. [CrossRef]
- Available online: https://planderecuperacion.gob.es/sites/default/files/2026-04/28022026_Madrid_Comunidad_de.pdf.
Figure 1.
Case study.
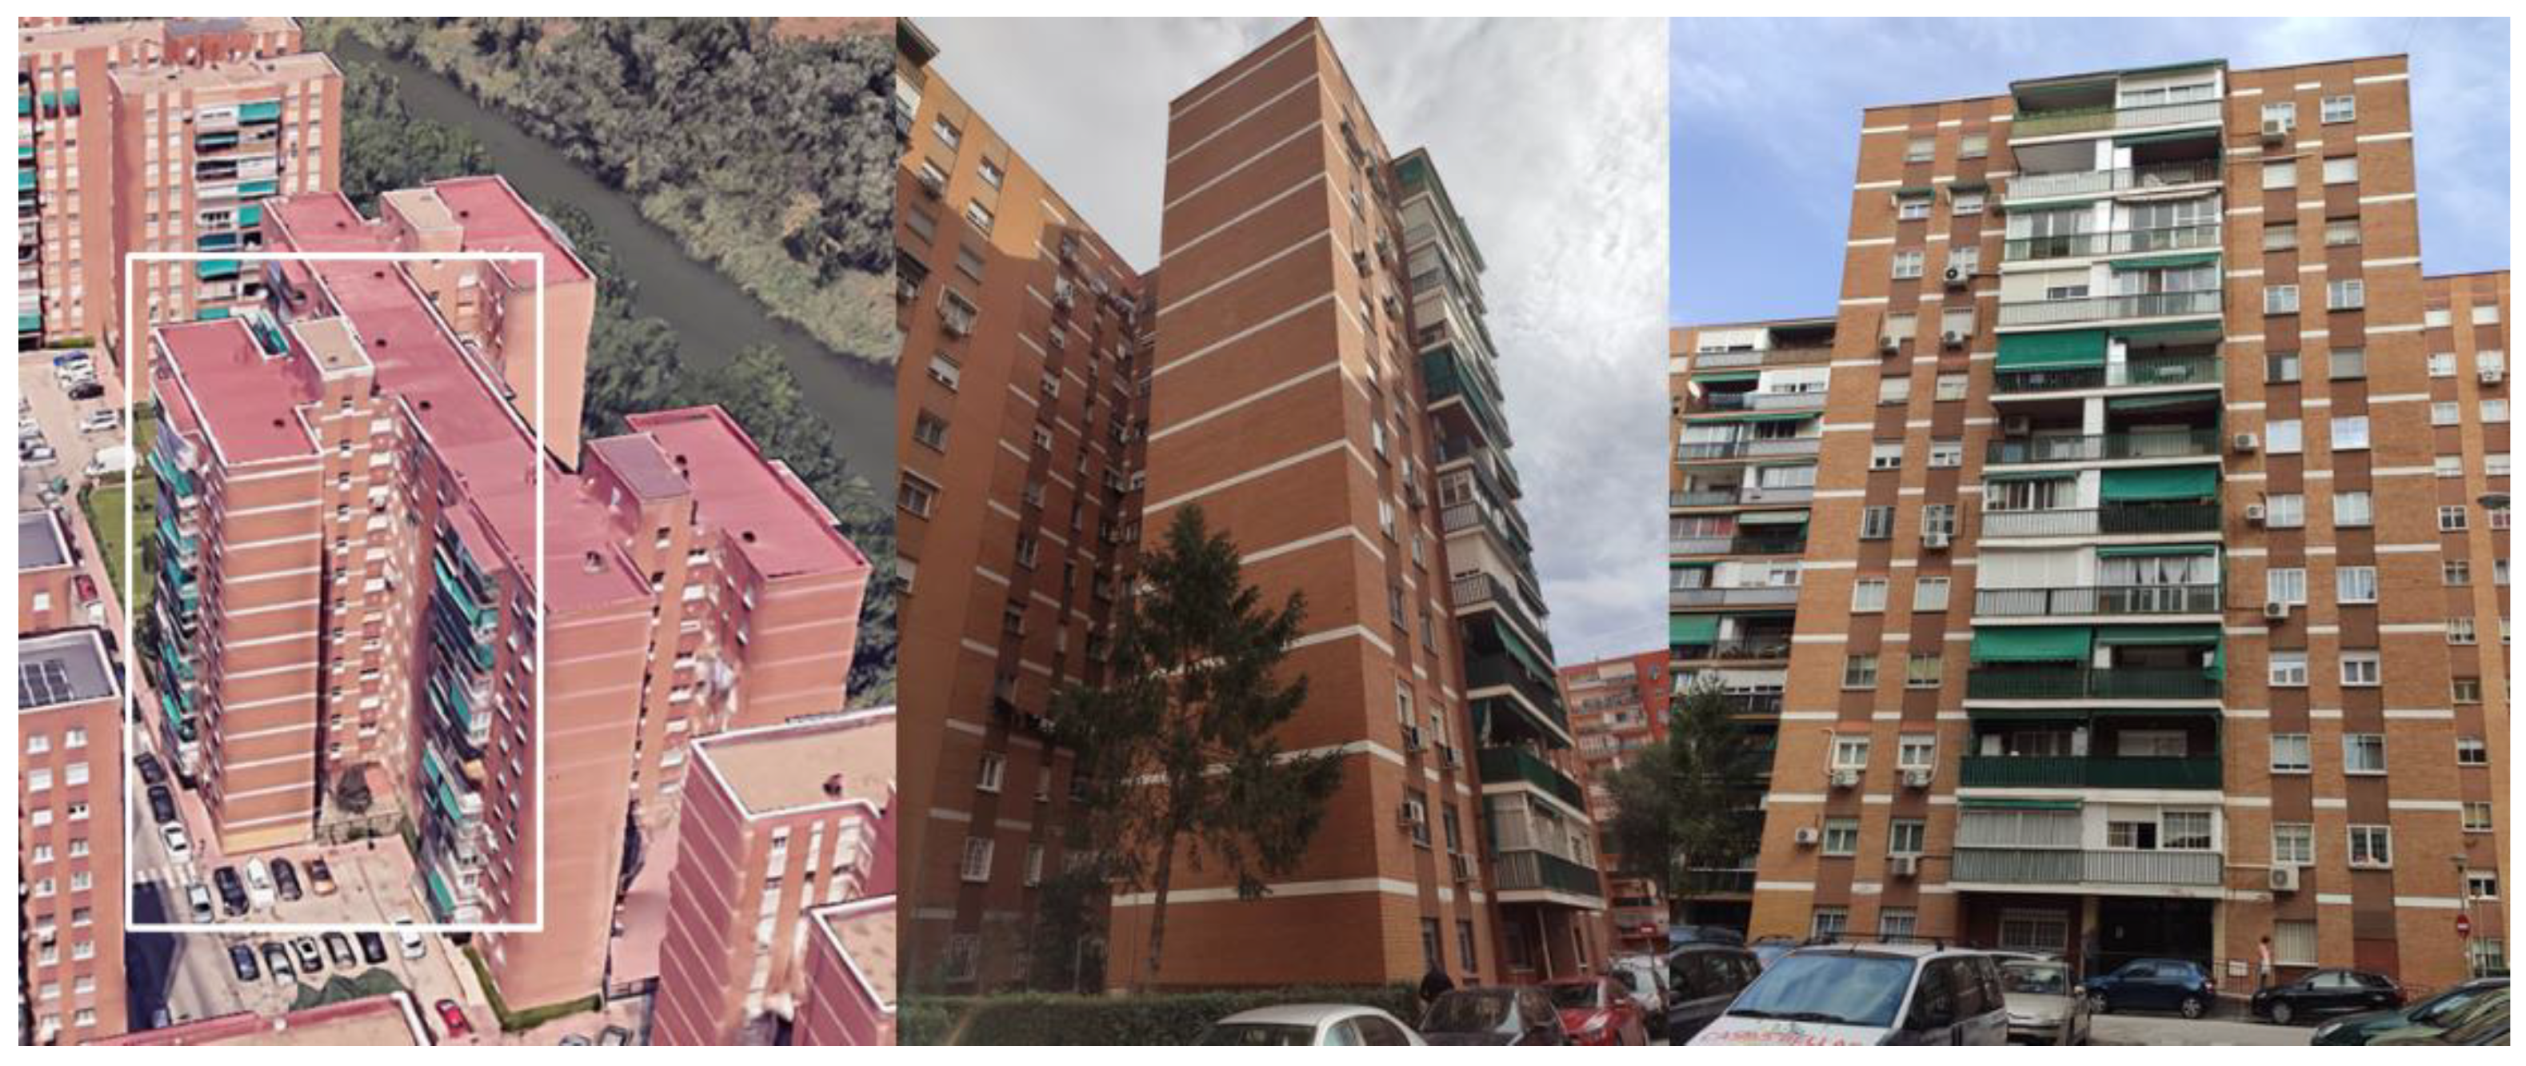
Figure 2.
In-situ U-value measurements.
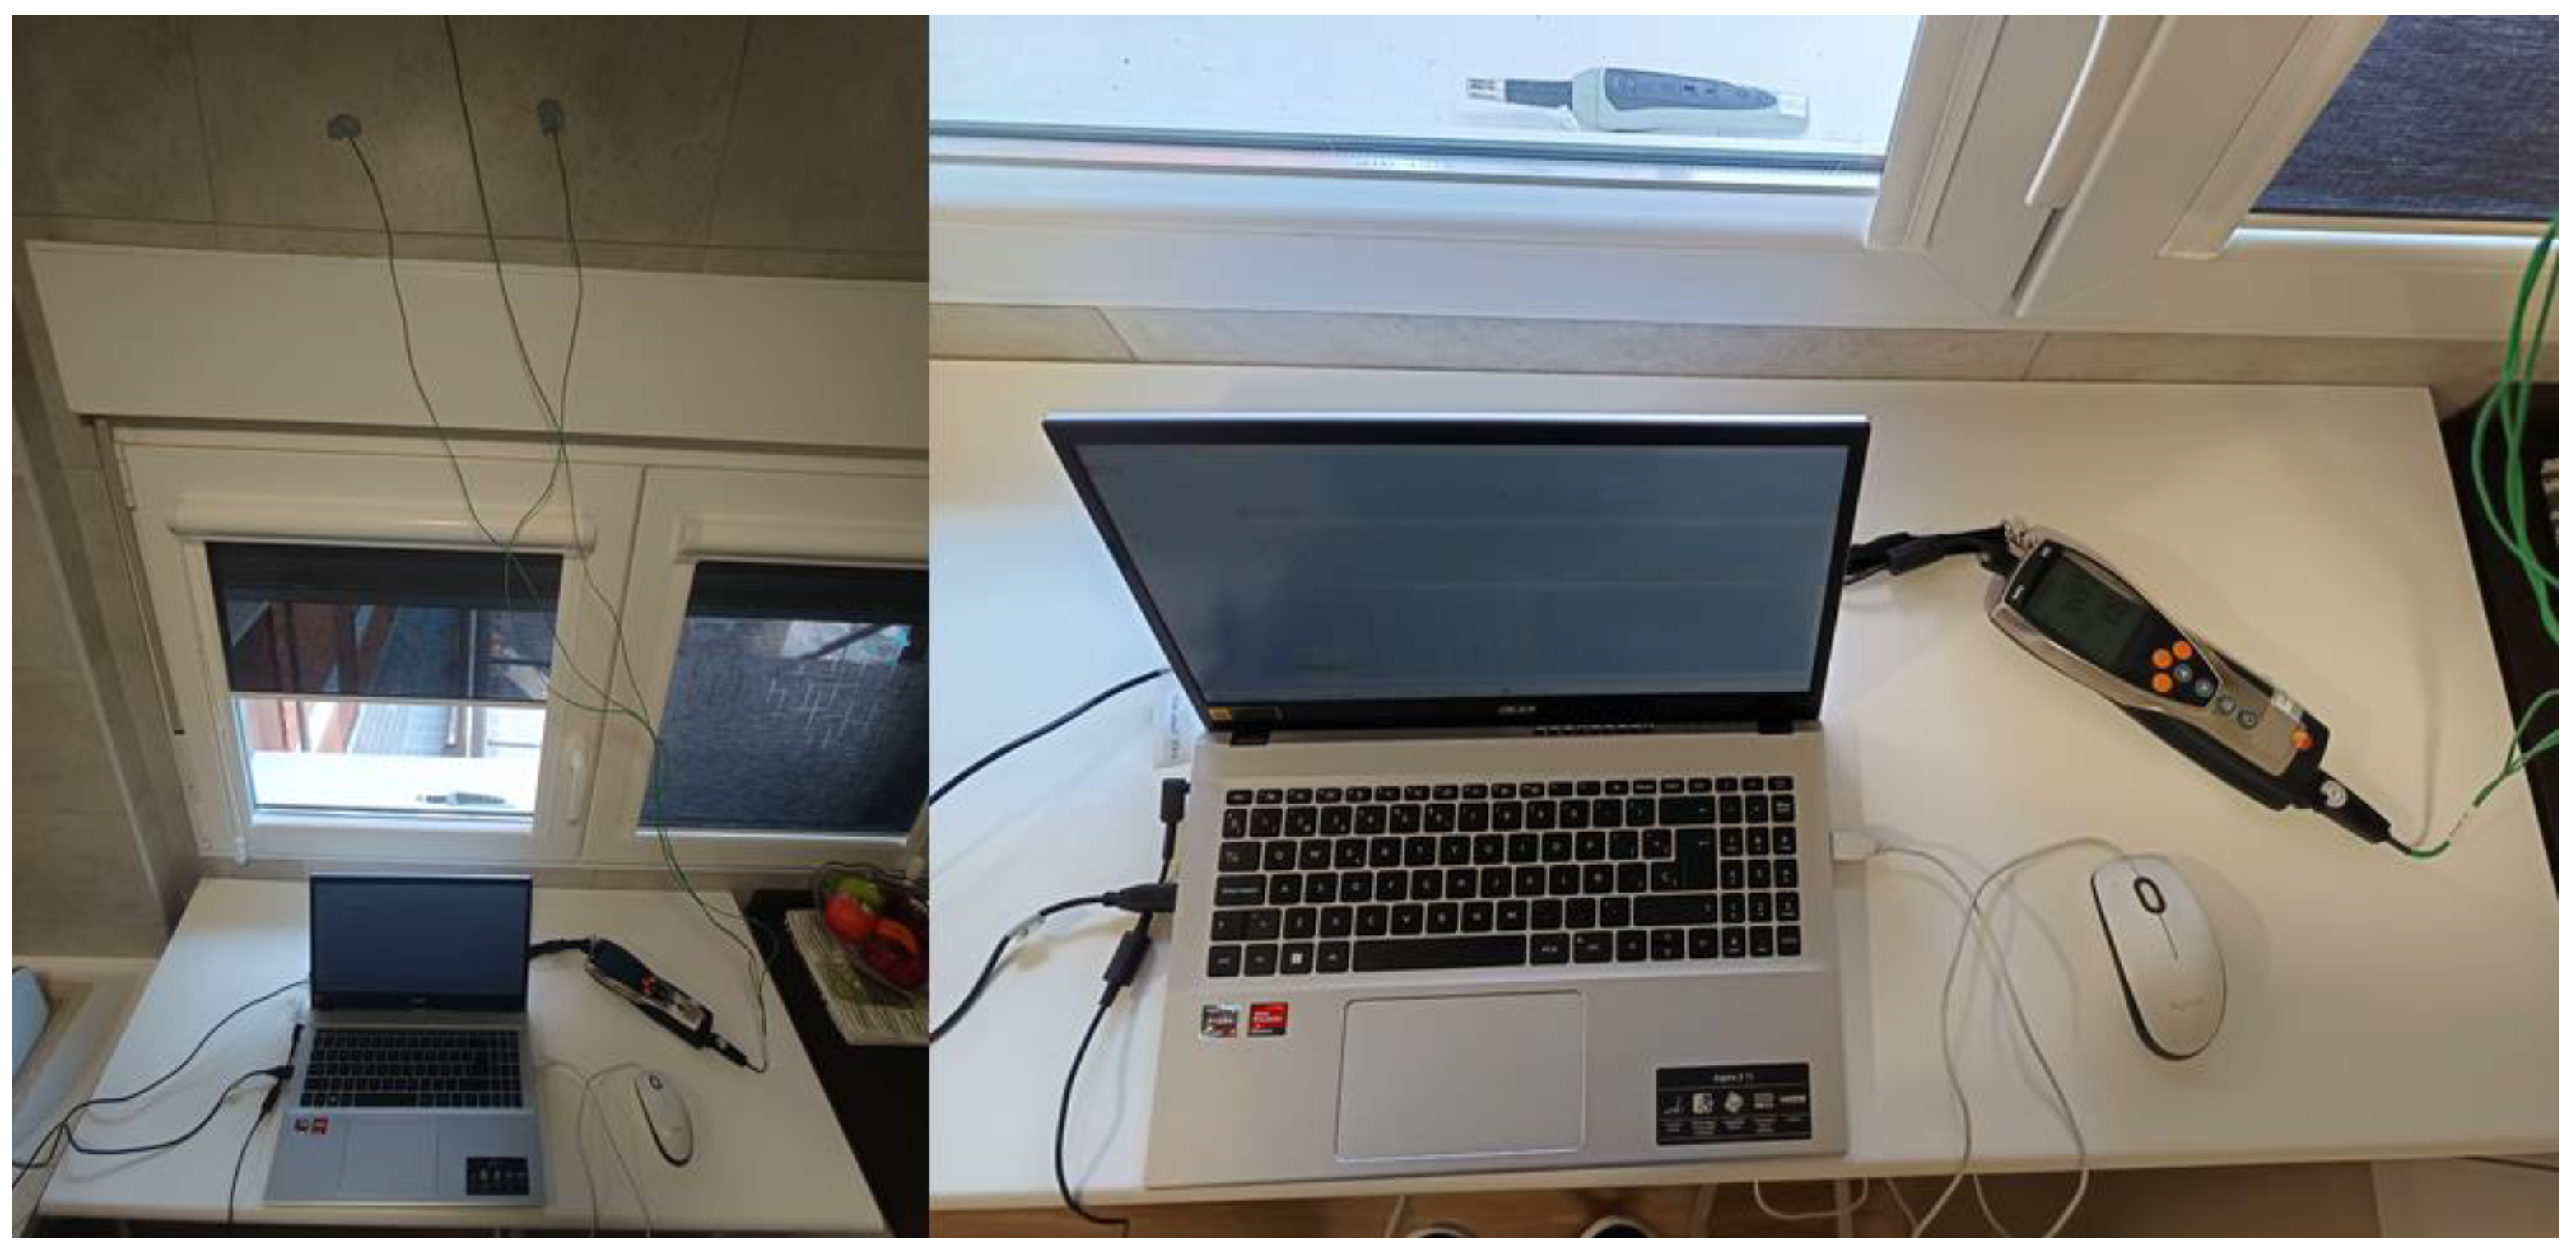
Figure 3.
External Thermal Insulation Composite System (ETICS).
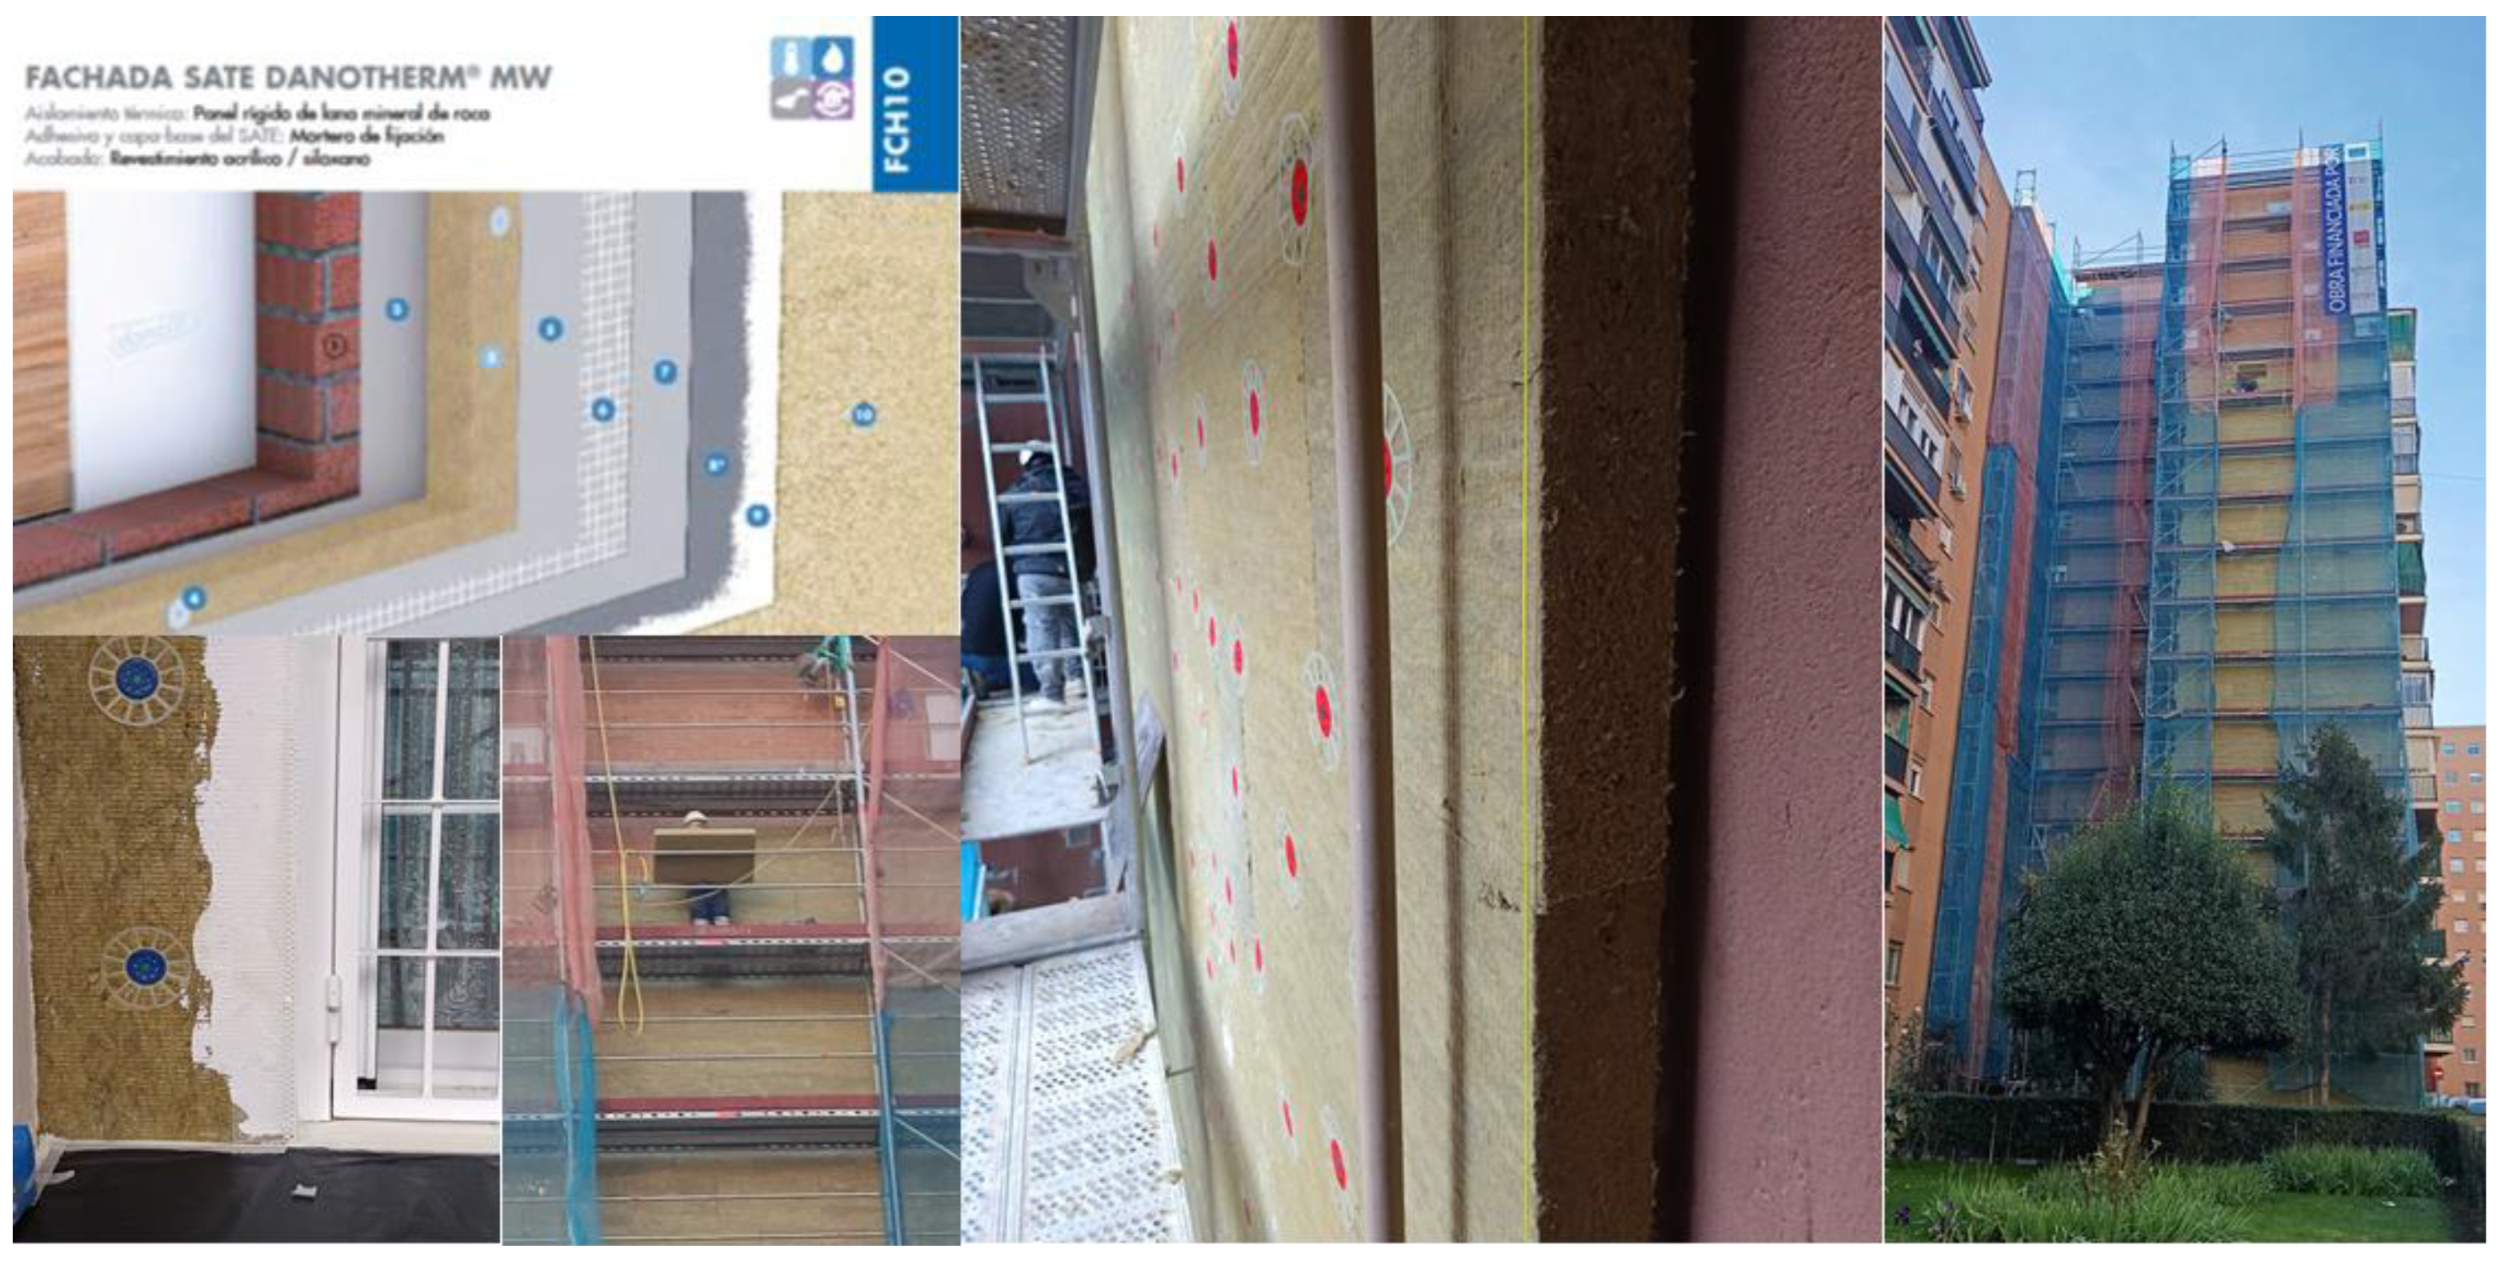
Figure 4.
Energy demand and CO2 emissions of the existing building as determined by building performance simulation (BPS).
Figure 4.
Energy demand and CO2 emissions of the existing building as determined by building performance simulation (BPS).
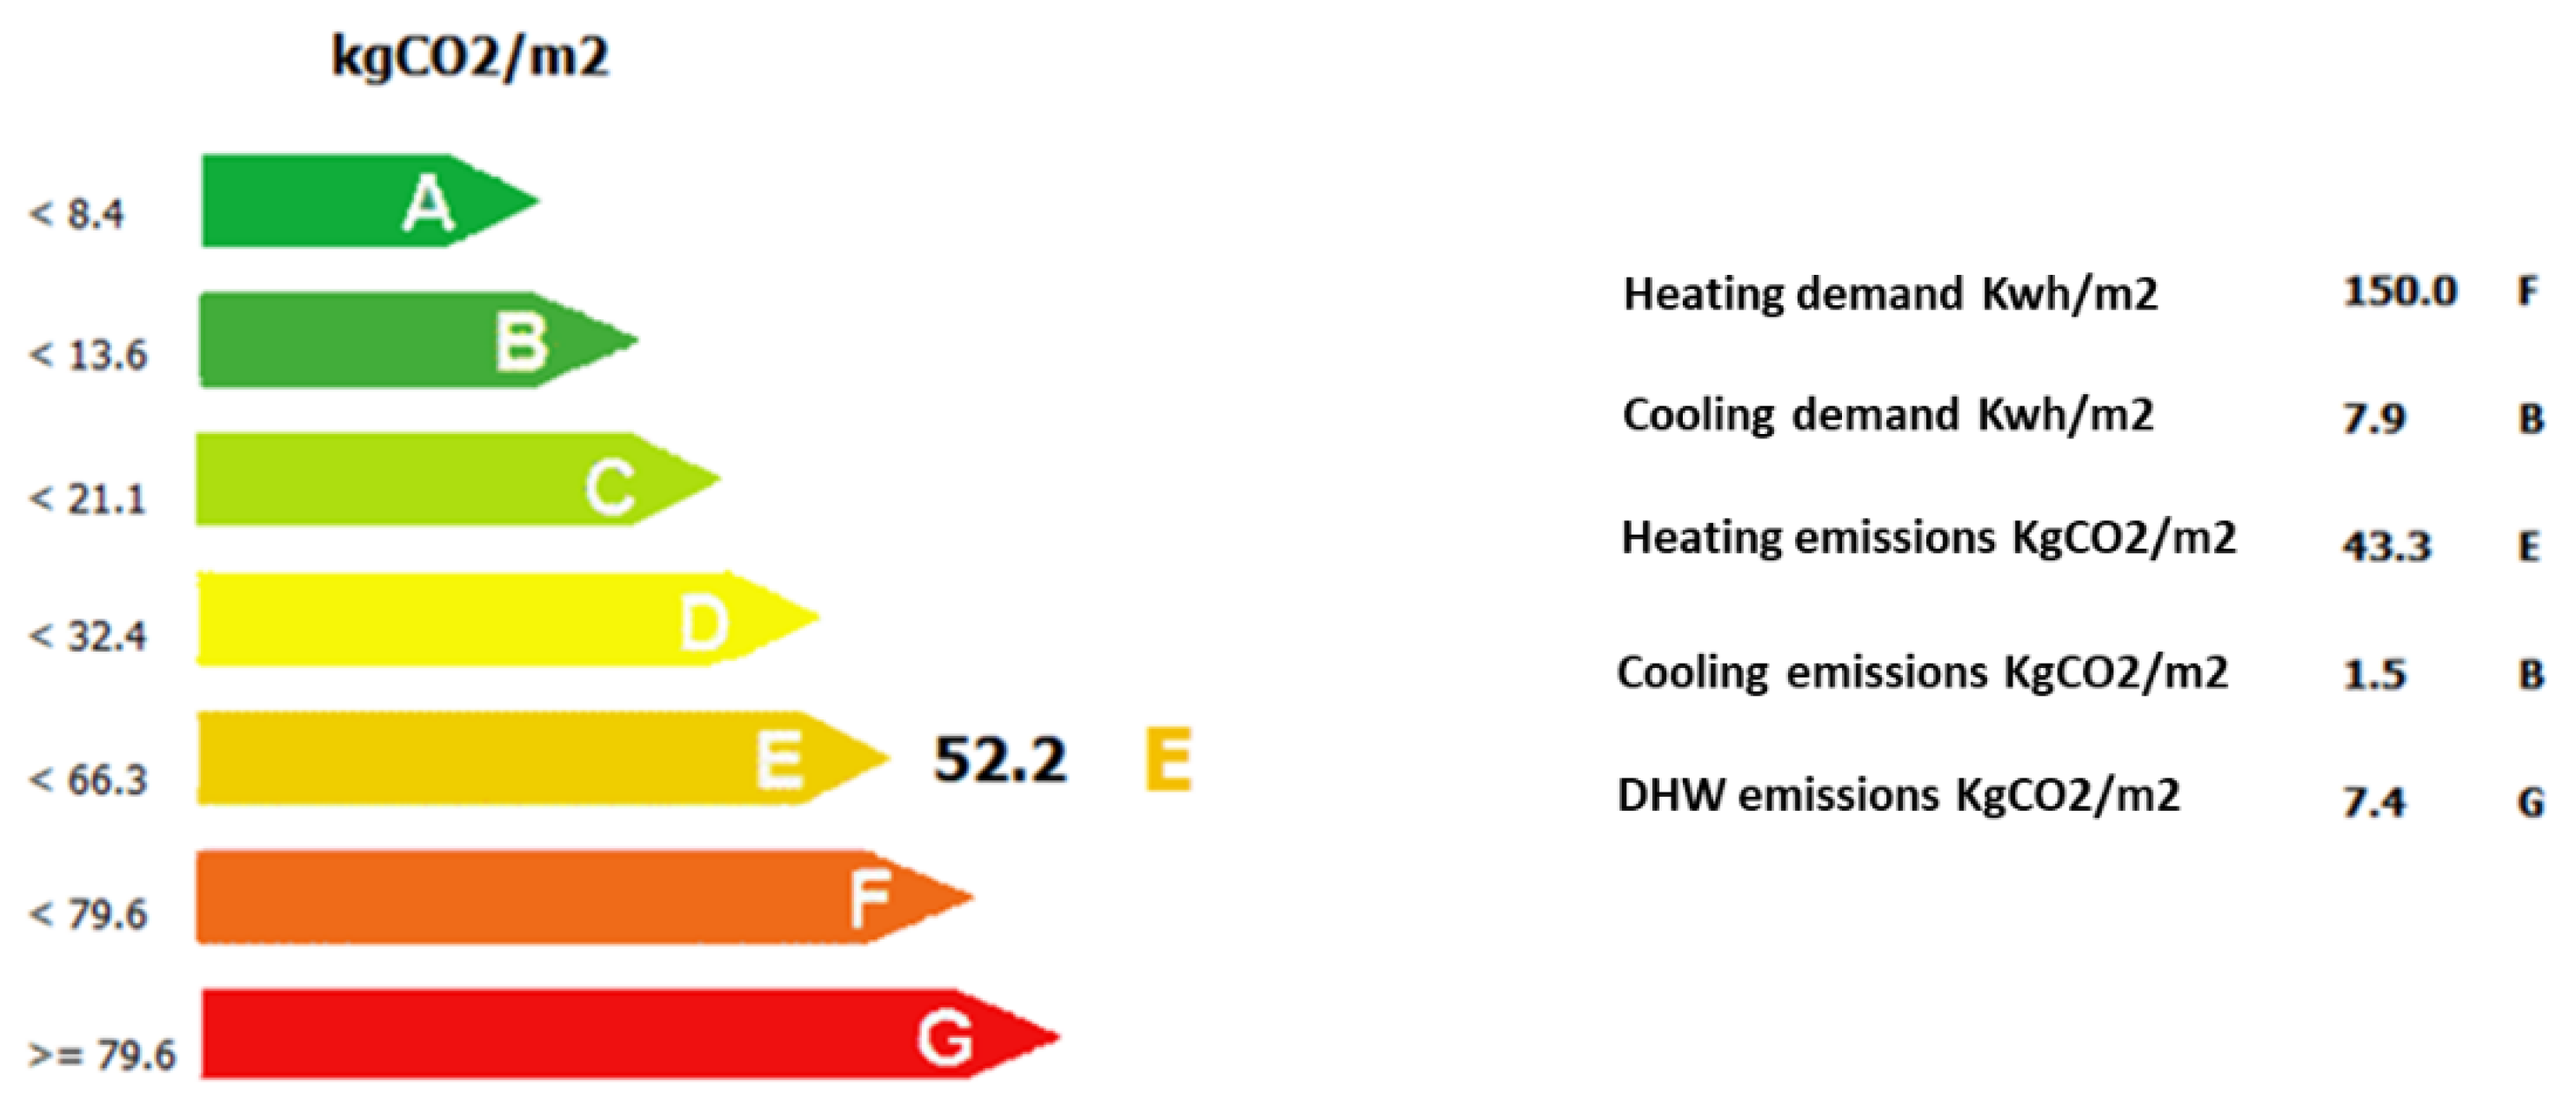
Figure 5.
Energy demand and CO2 emissions of the rehabilitation building as determined by building performance simulation (BPS).
Figure 5.
Energy demand and CO2 emissions of the rehabilitation building as determined by building performance simulation (BPS).
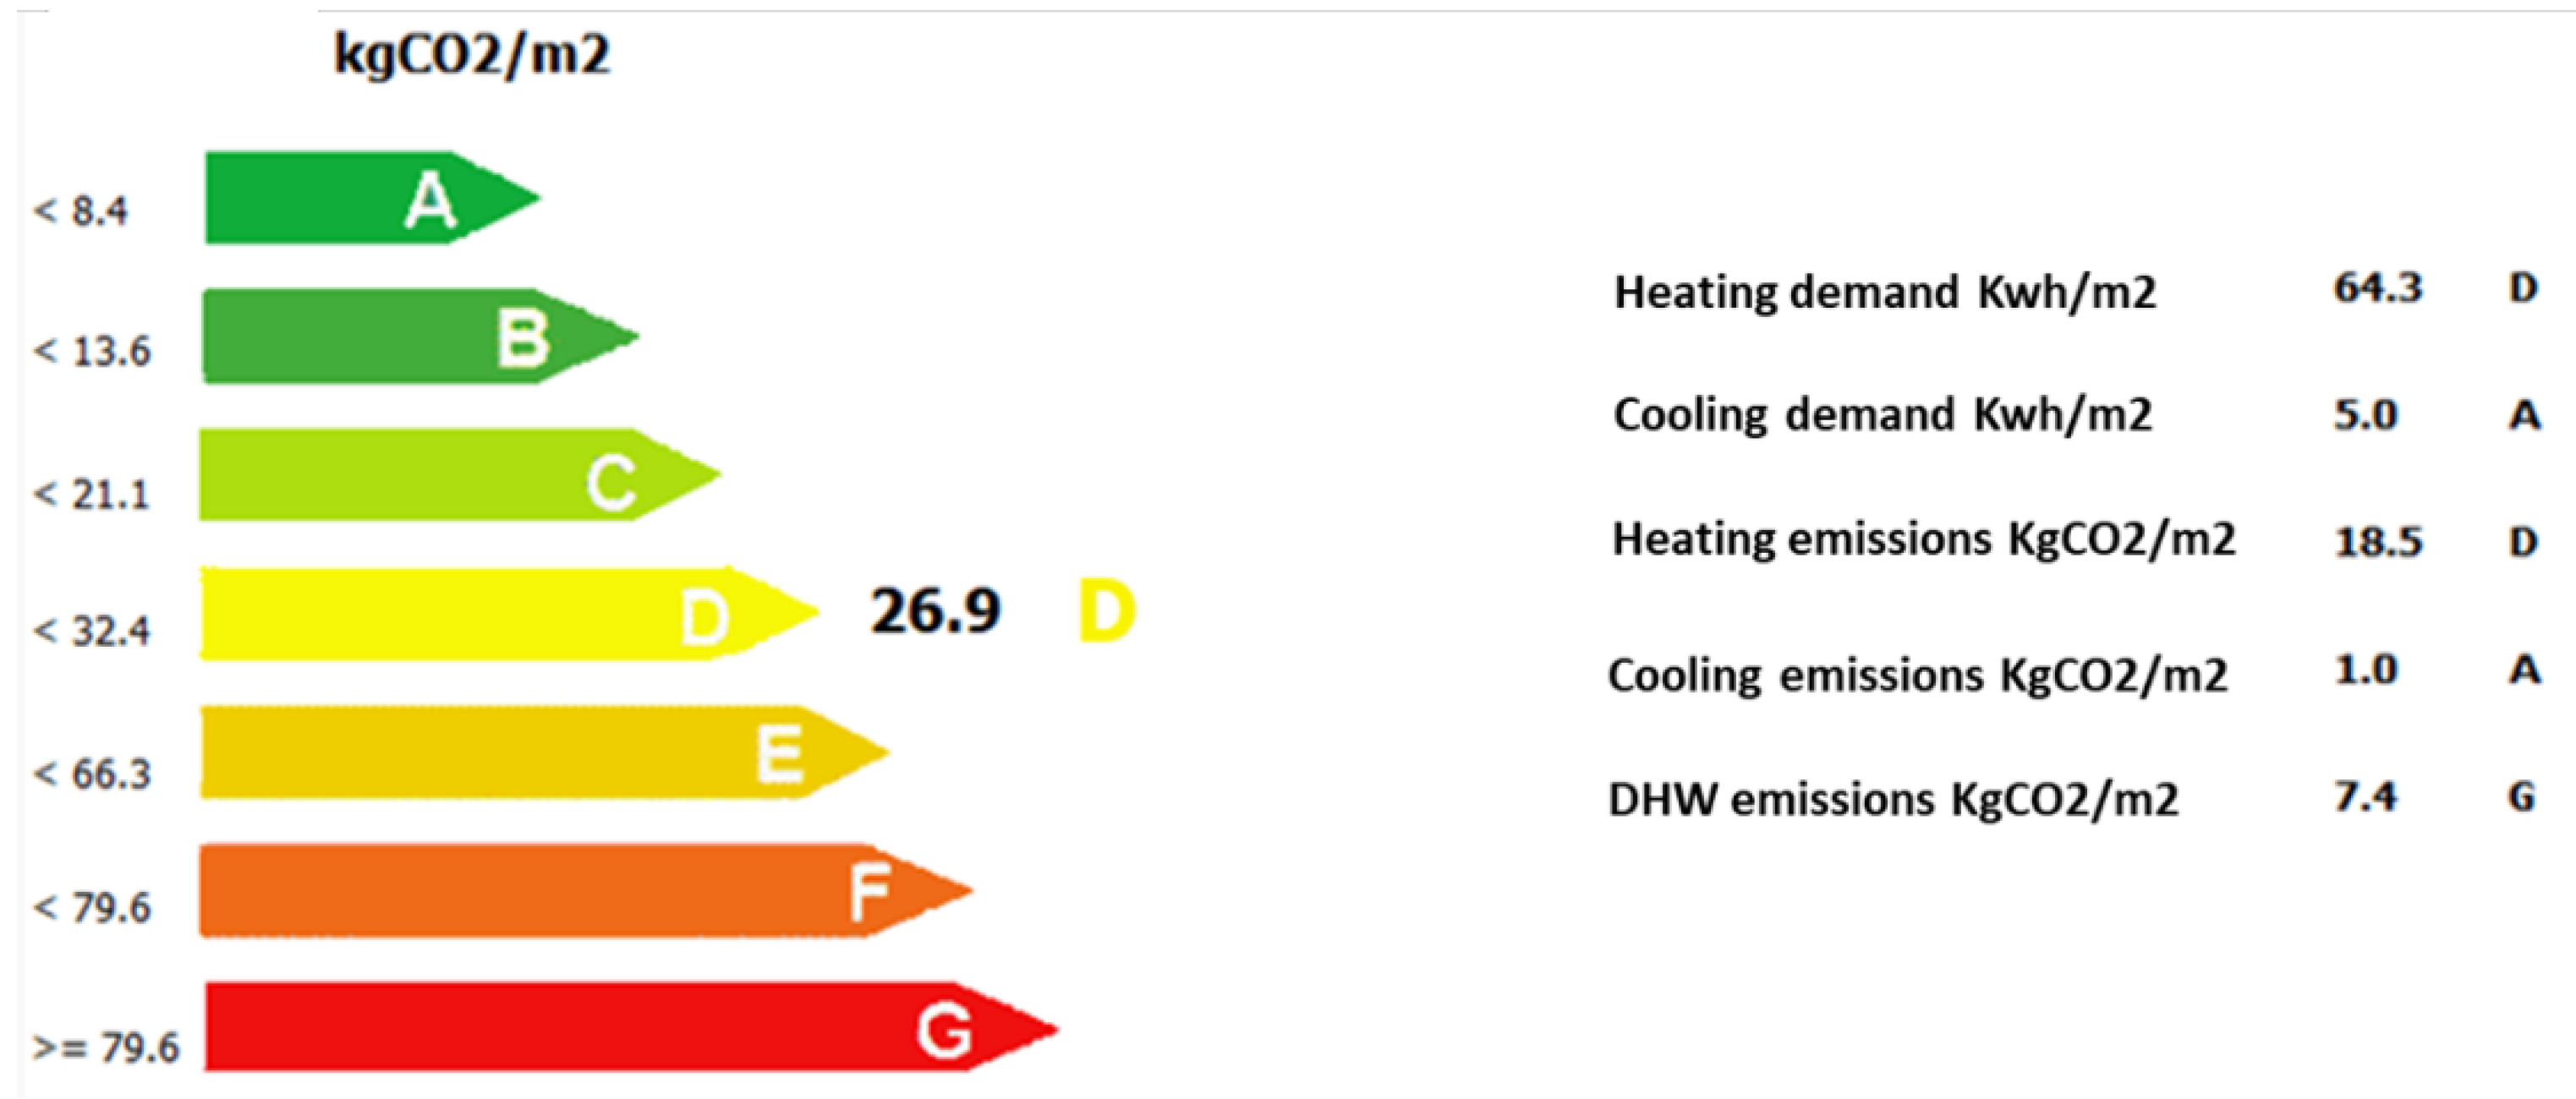
Figure 6.
Heat transfer and condensation risk in walls.
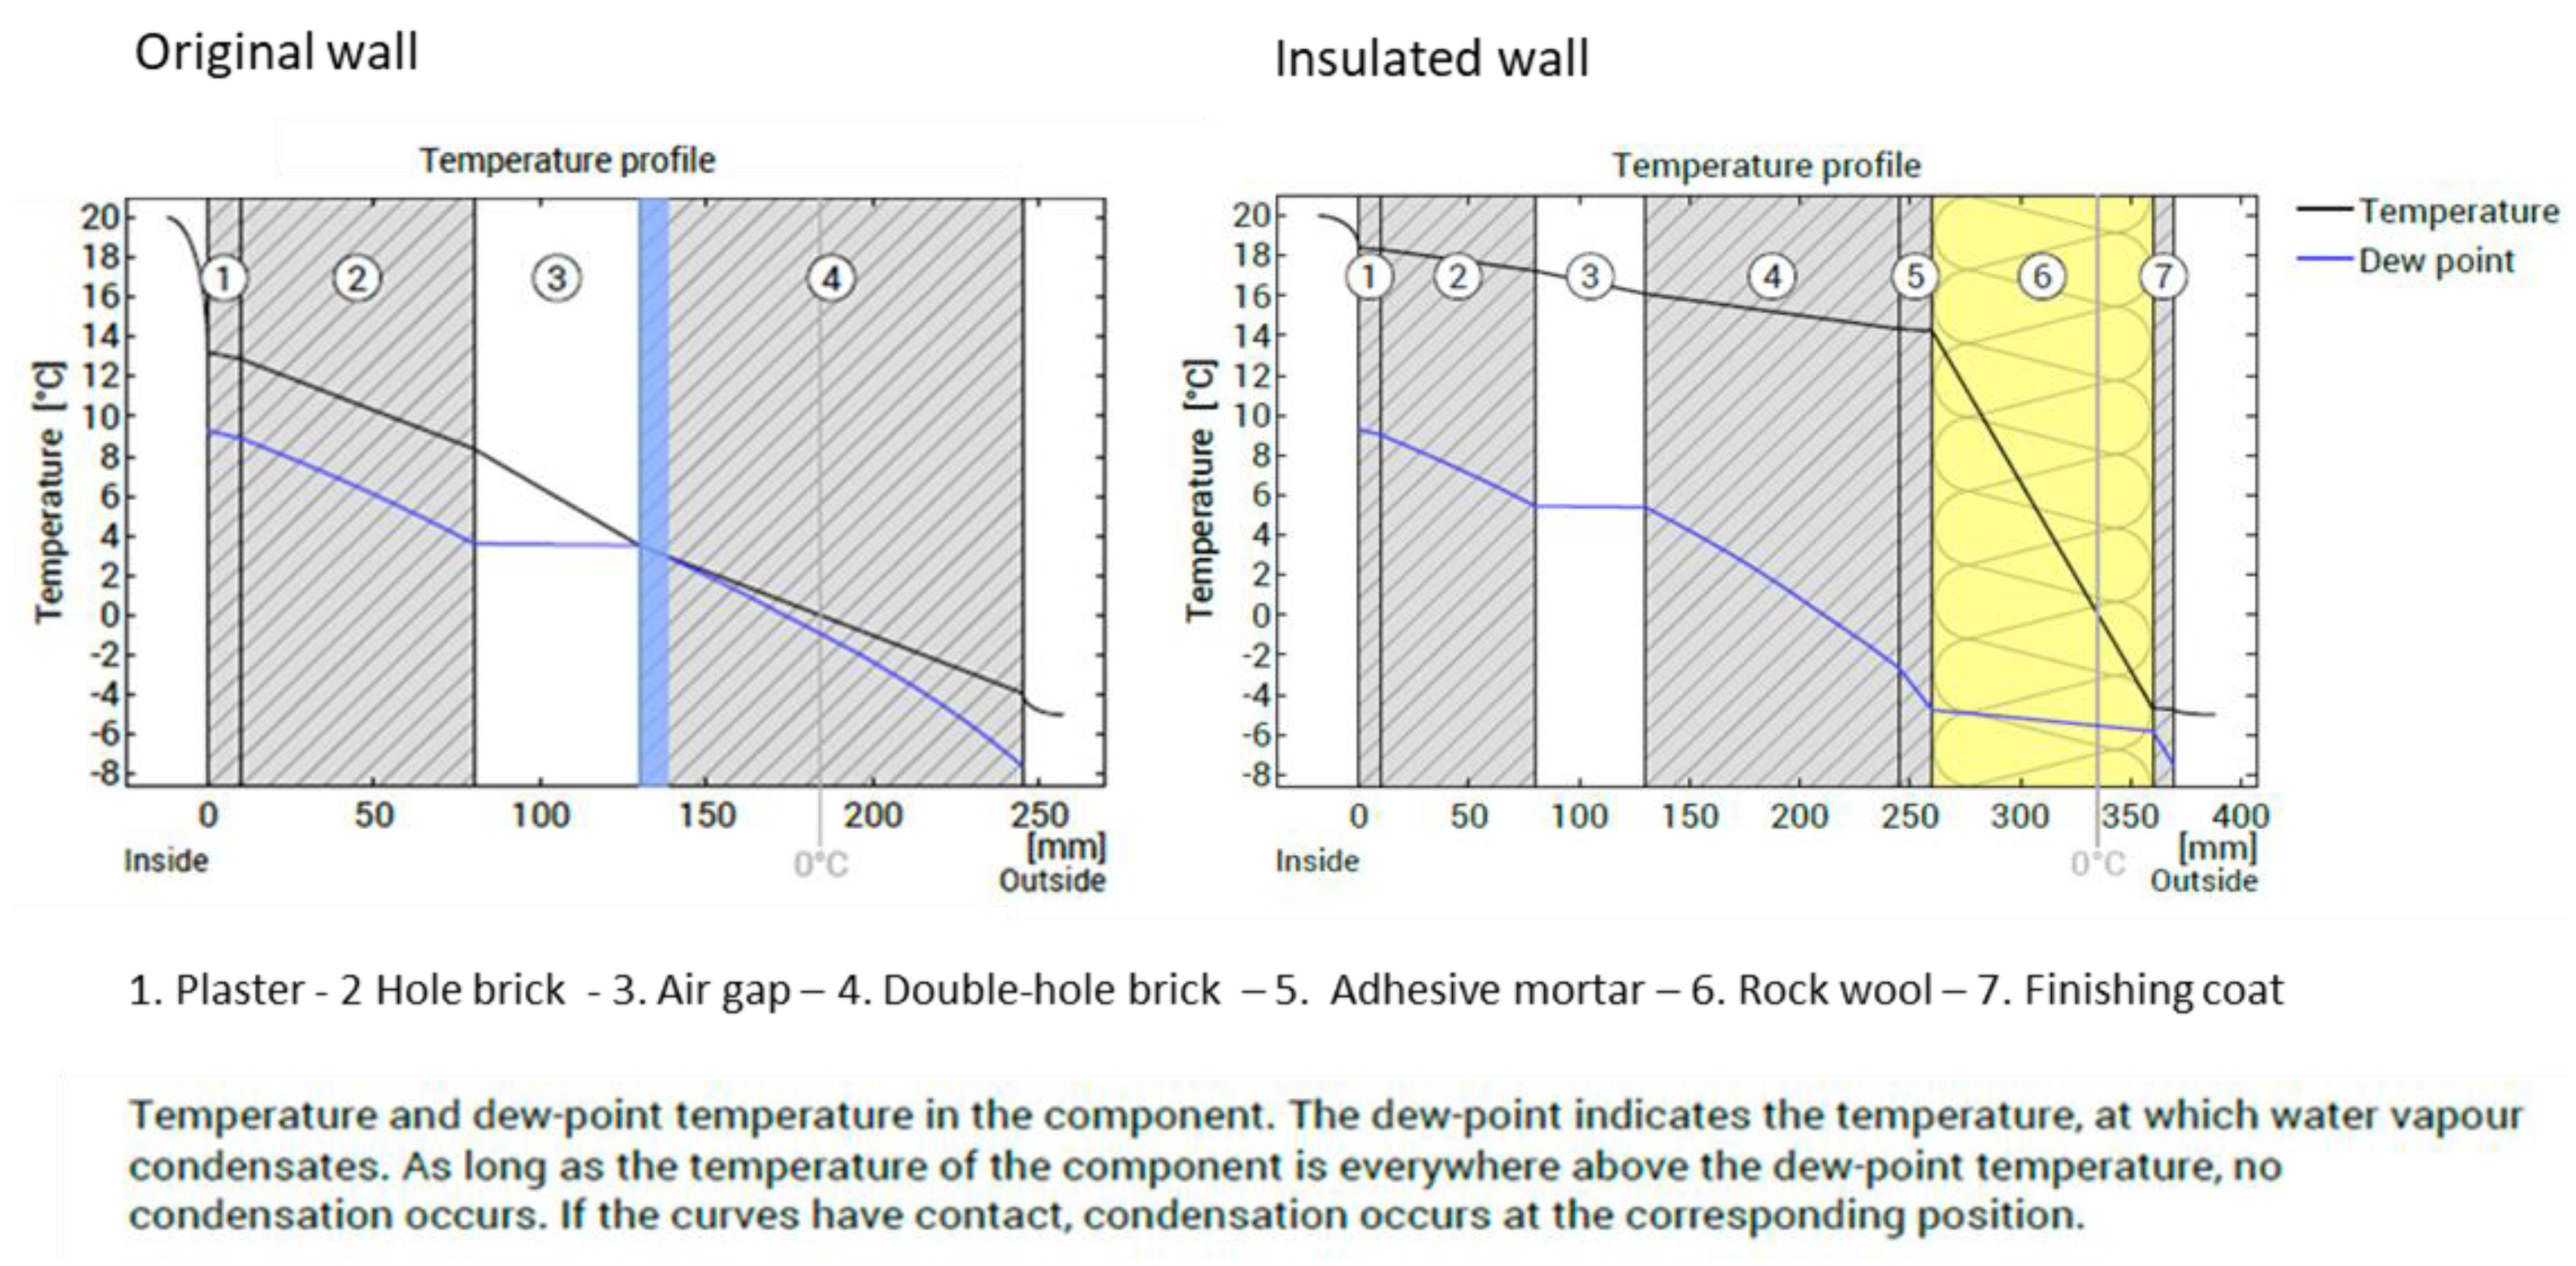
Figure 7.
Analysis of original (top) and insulated (bottom) wall transmittances measured using a TESTO 635-2 probe.
Figure 7.
Analysis of original (top) and insulated (bottom) wall transmittances measured using a TESTO 635-2 probe.
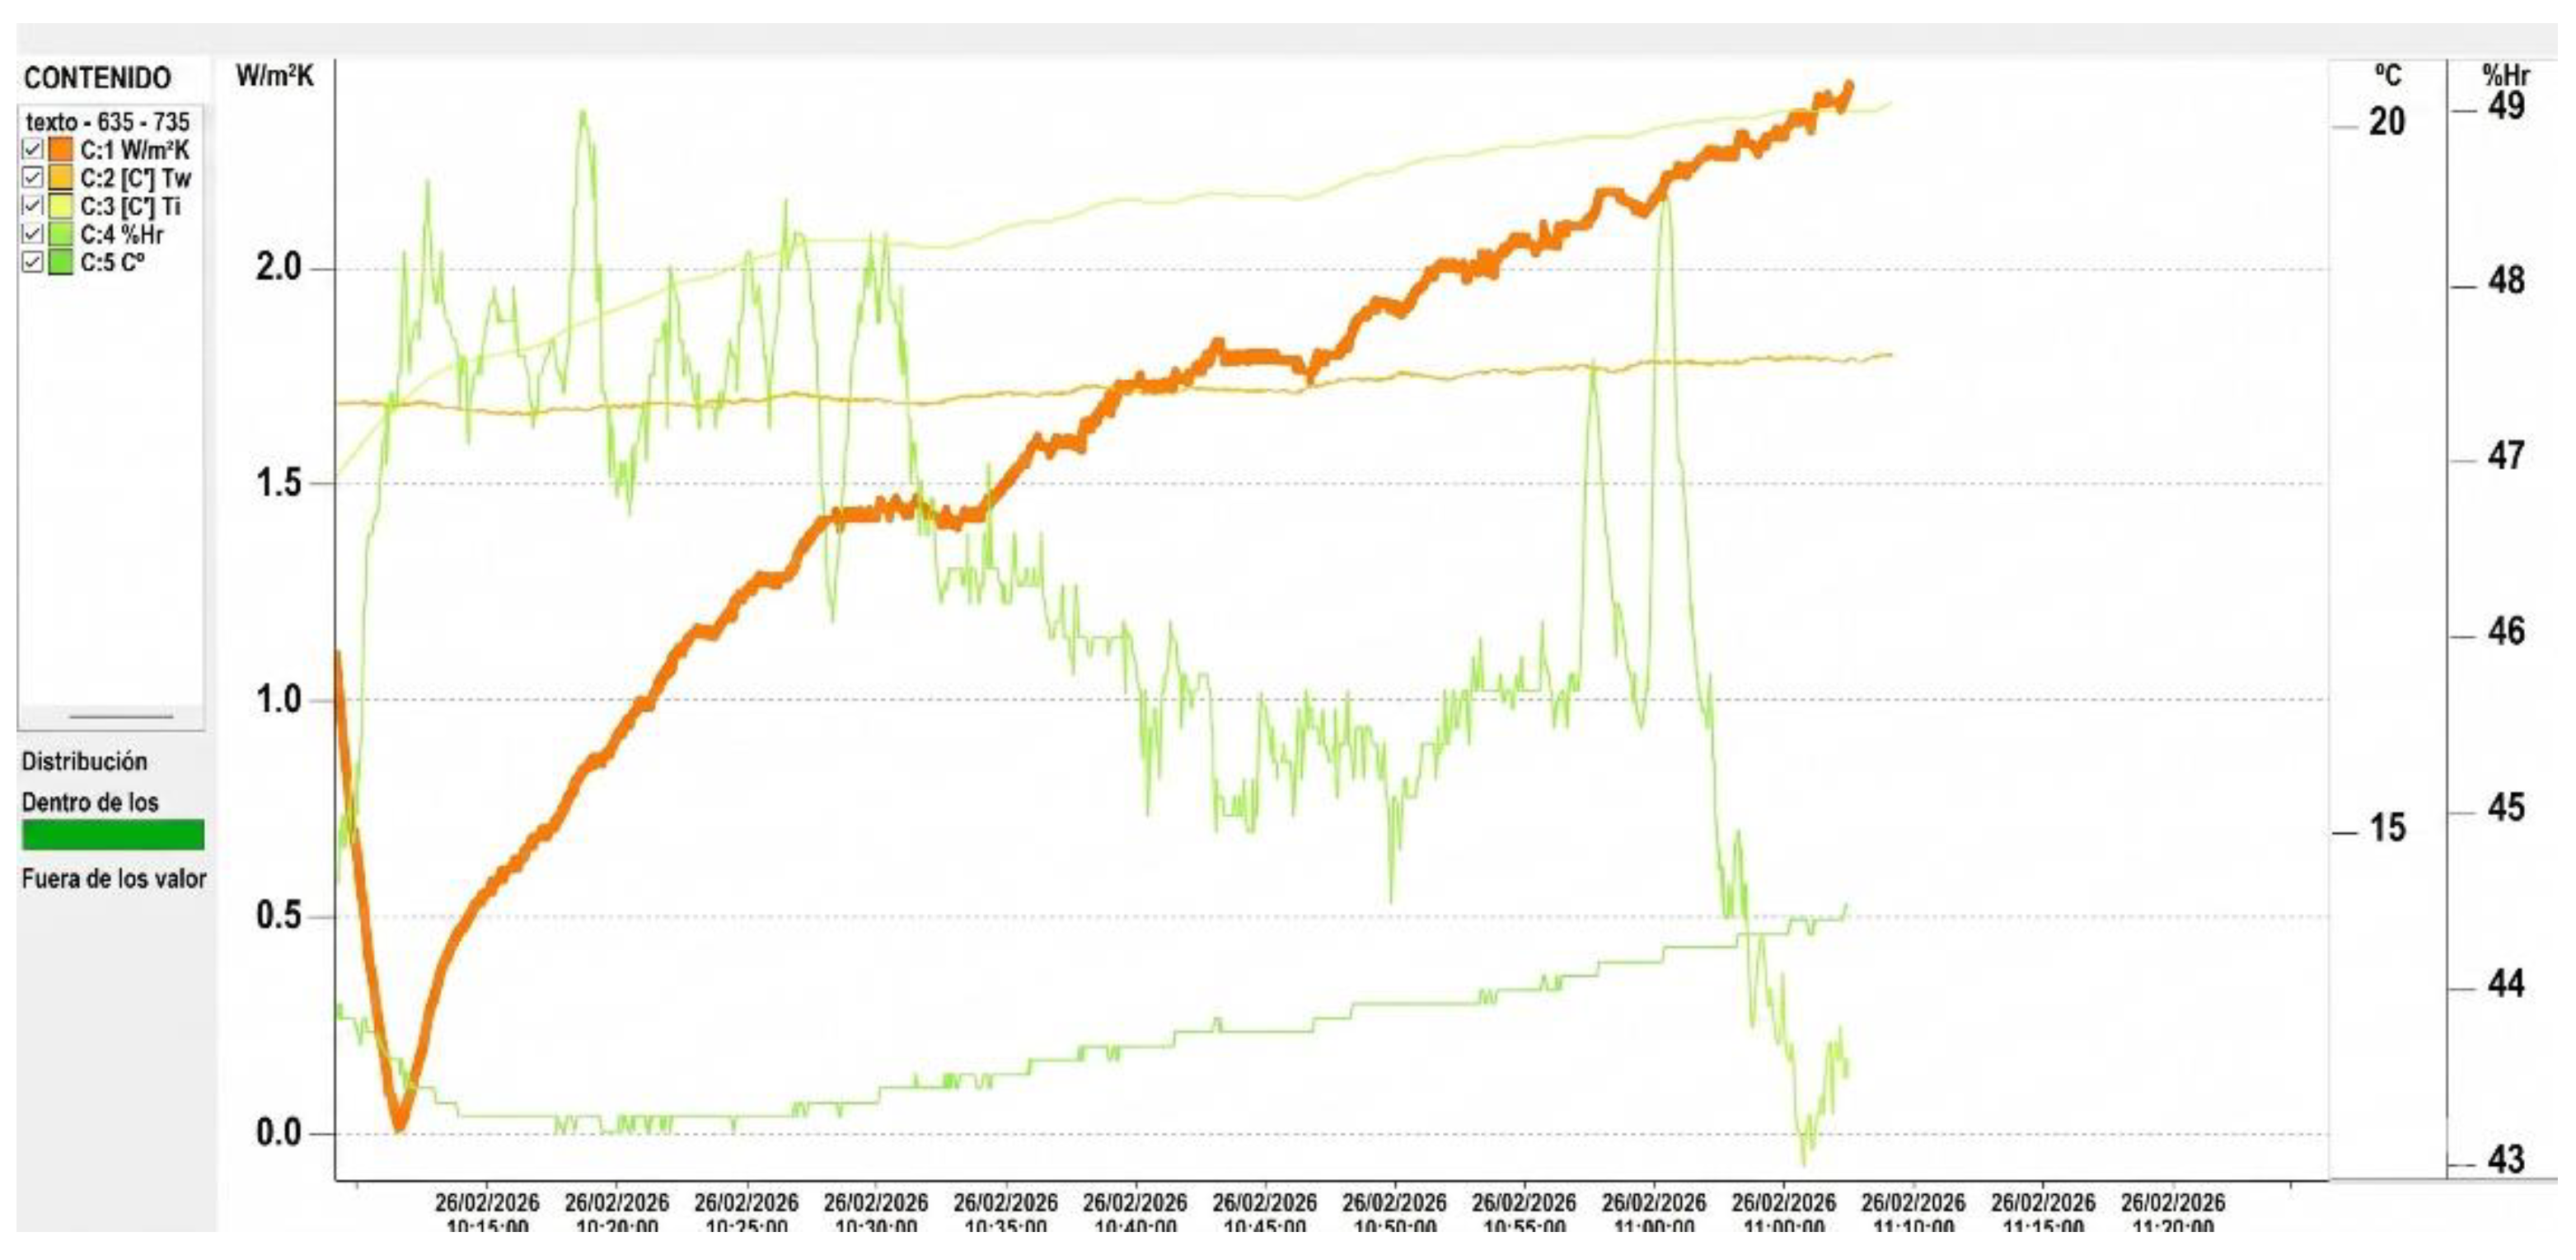
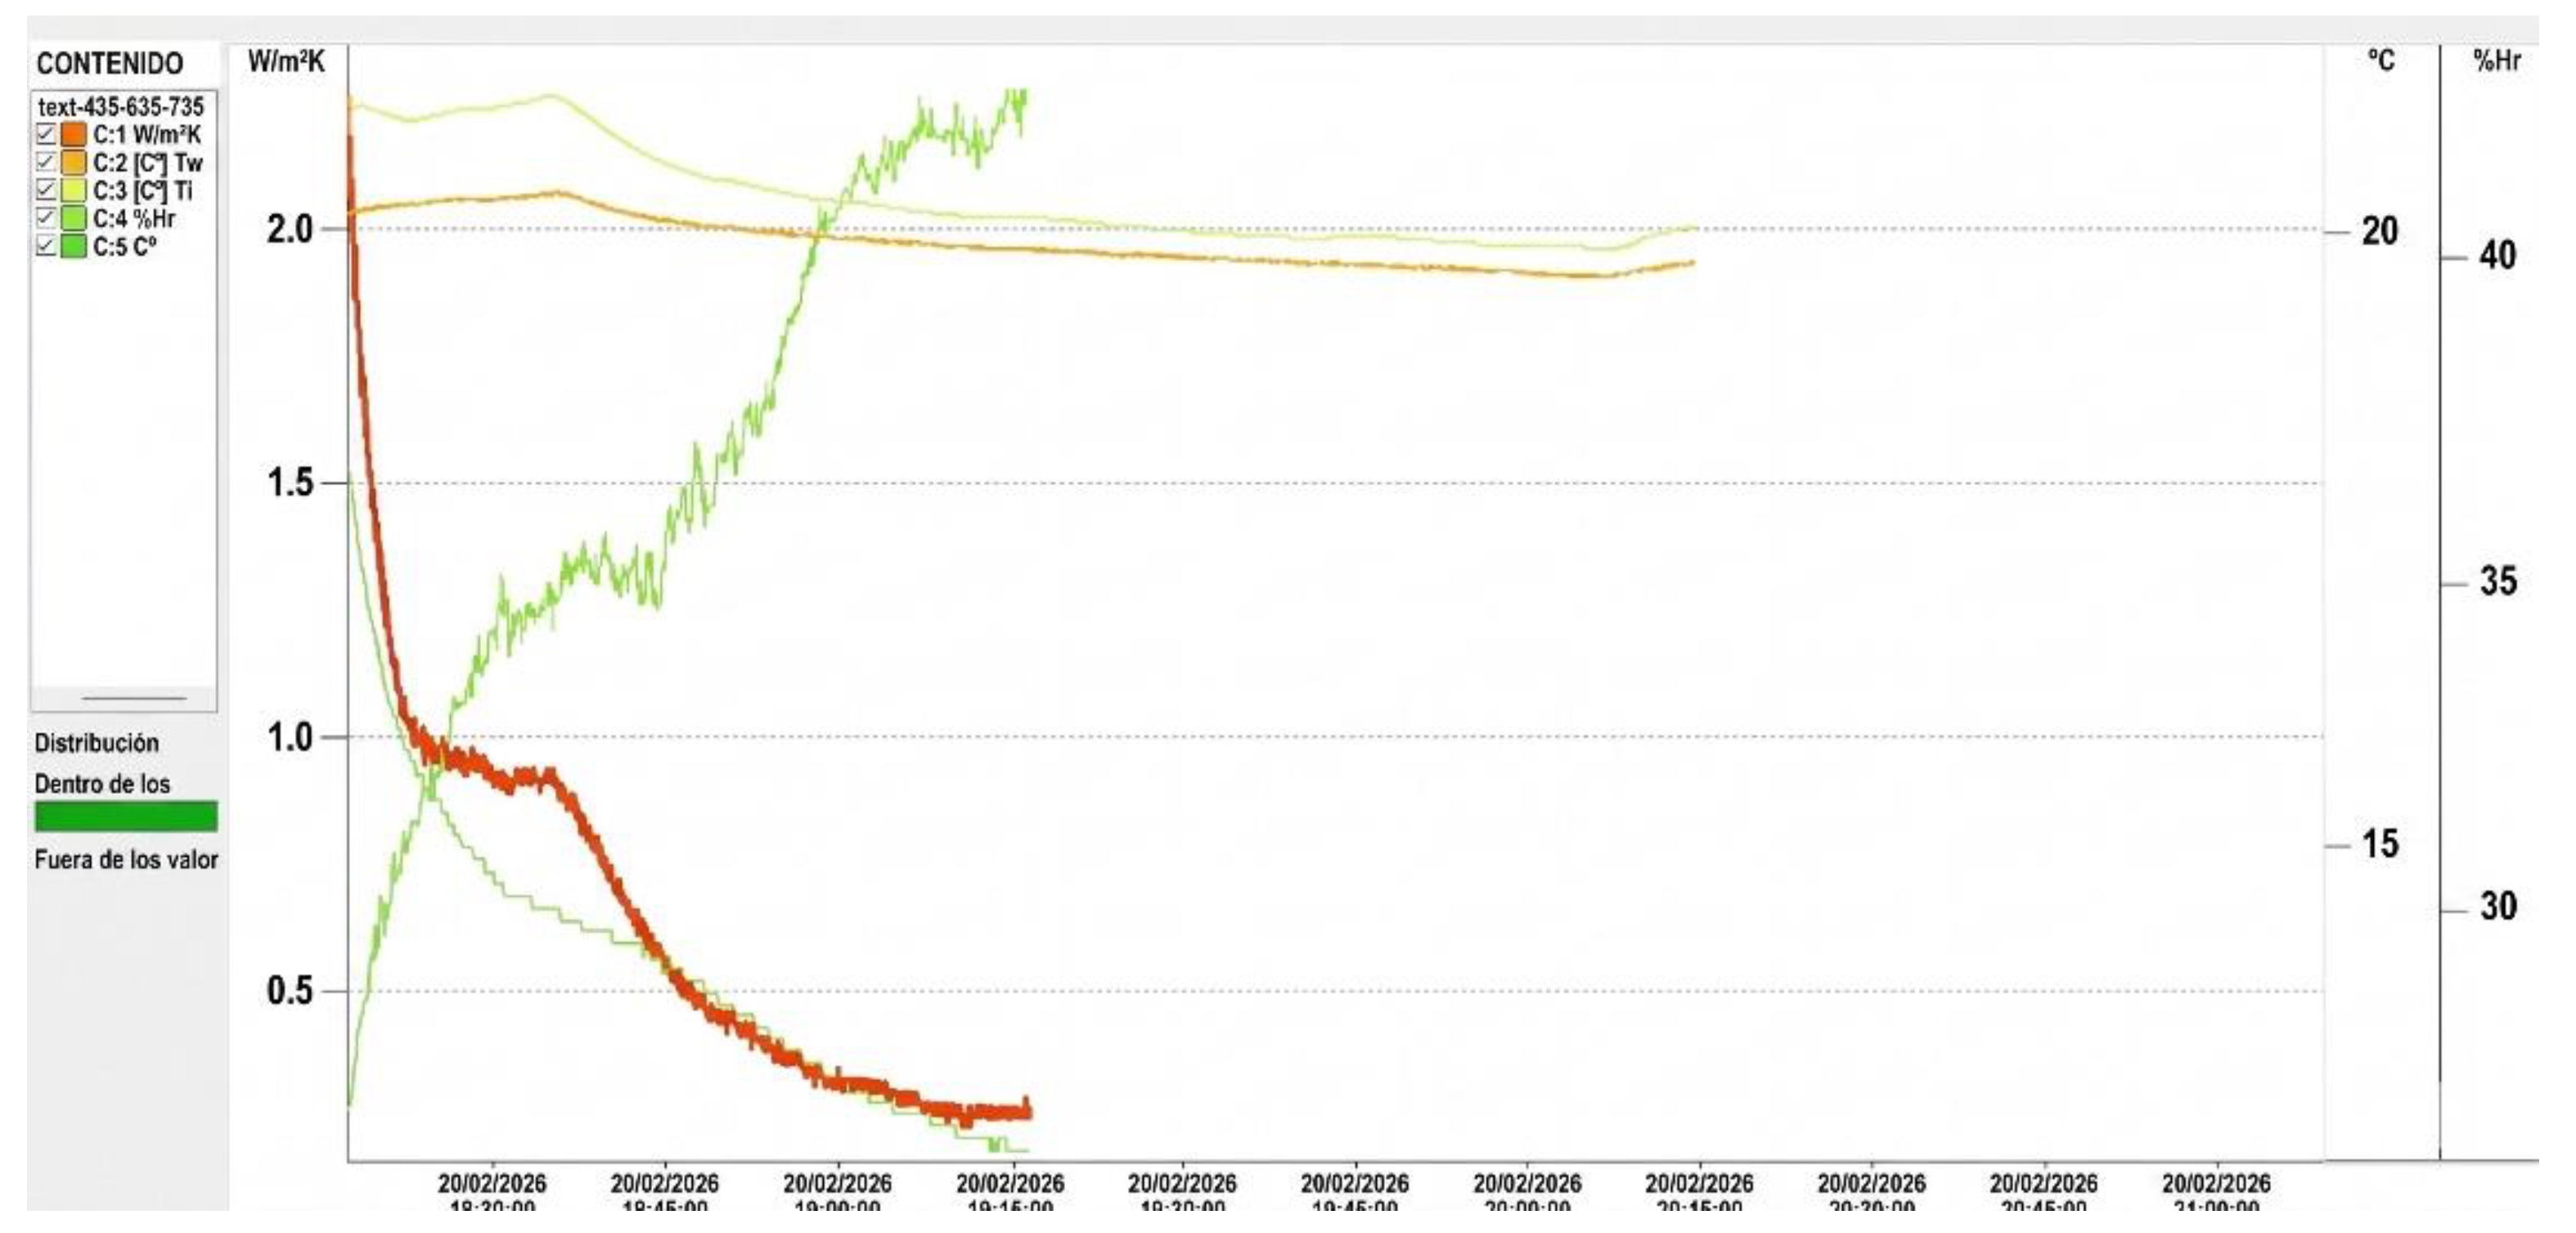
Figure 8.
Left: Original wall; heat loss is visible through windows and facade thermal bridges. Right: Rehabilitated wall with exterior insulation. The continuity of the insulation layer across the facade is clearly visible.
Figure 8.
Left: Original wall; heat loss is visible through windows and facade thermal bridges. Right: Rehabilitated wall with exterior insulation. The continuity of the insulation layer across the facade is clearly visible.
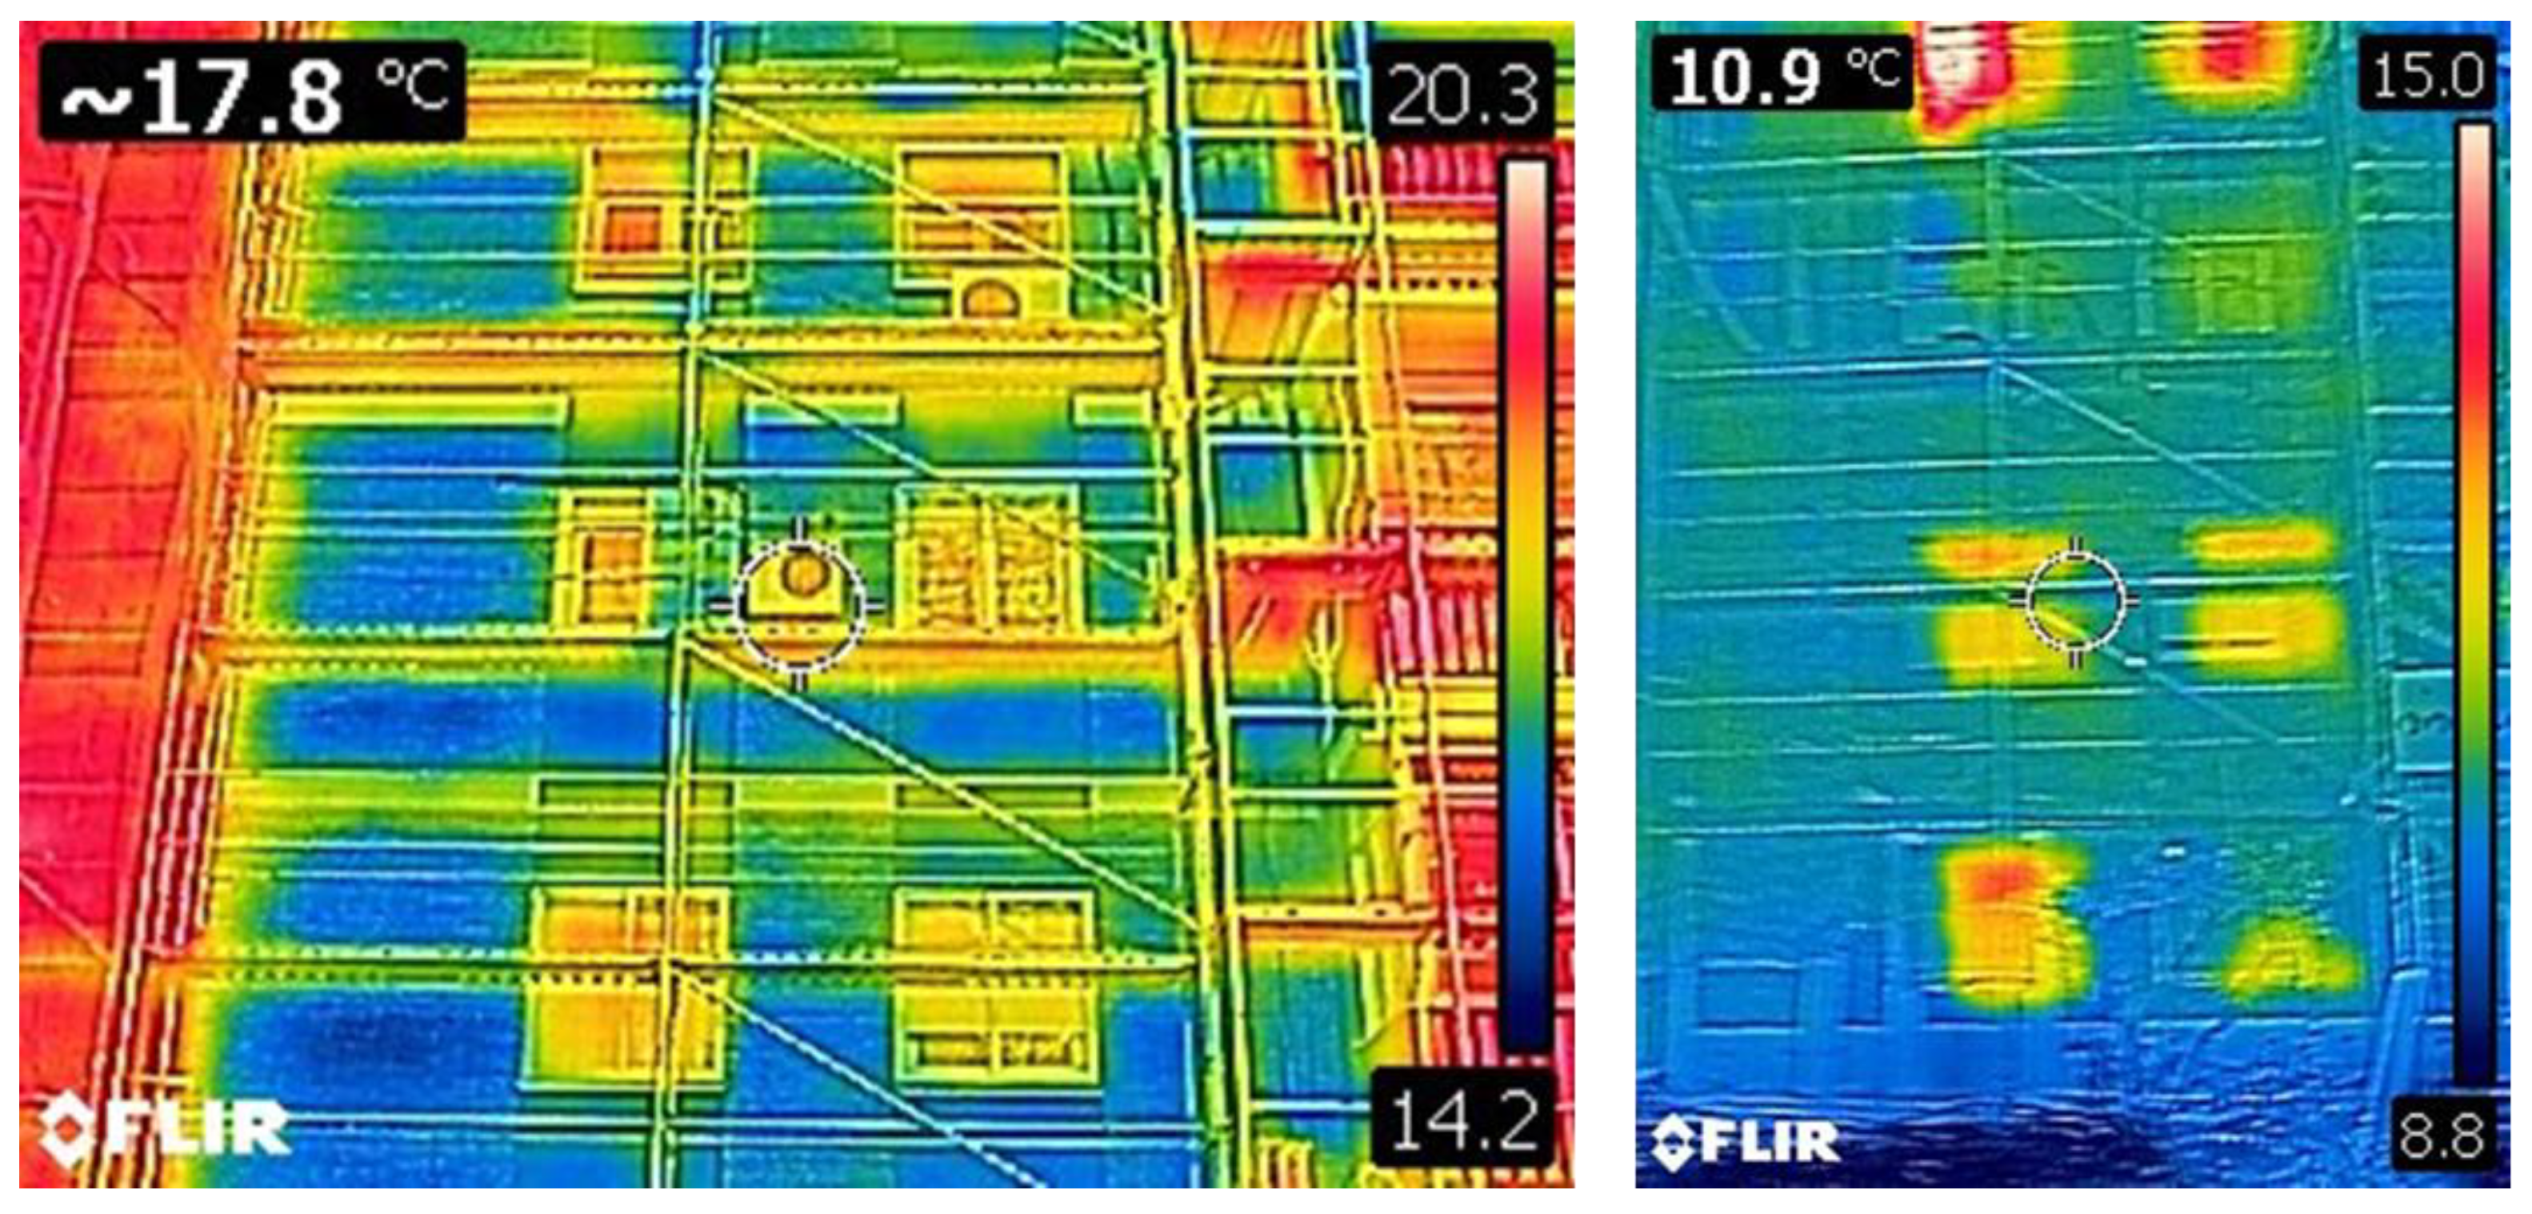
Figure 9.
Temperature on the outer (red) and inner (blue) surface in the course of a day. The arrows indicate the location of the temperature maximum values. The maximum of the inner surface temperature should preferably occur during the second half of the night.
Figure 9.
Temperature on the outer (red) and inner (blue) surface in the course of a day. The arrows indicate the location of the temperature maximum values. The maximum of the inner surface temperature should preferably occur during the second half of the night.
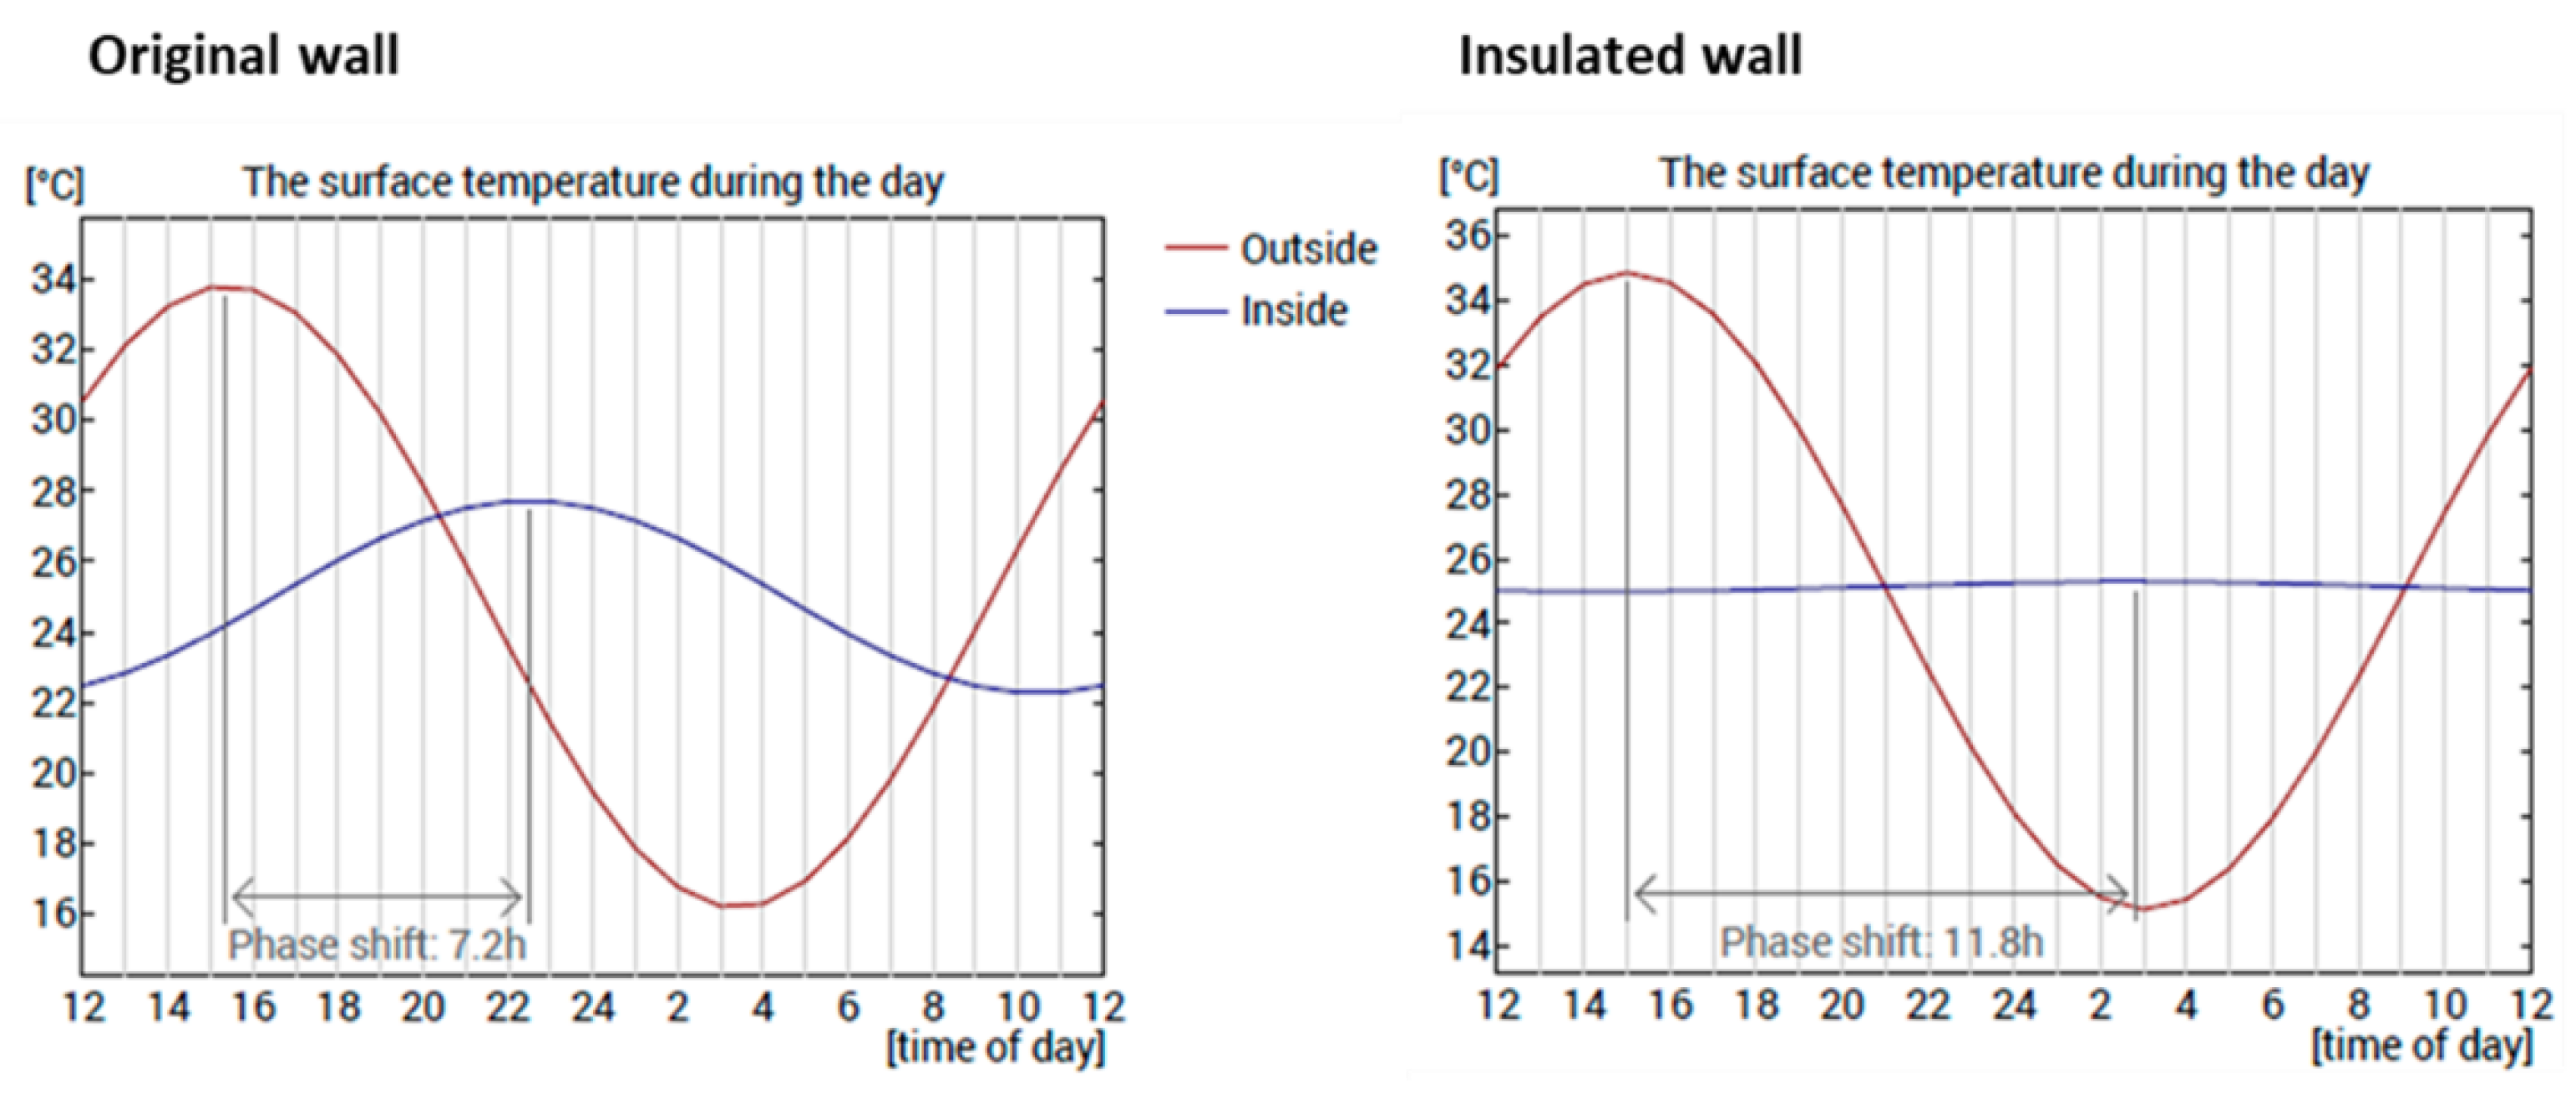
Figure 10.
Energy demand and CO2 emissions of the existing building as determined by real measurements.
Figure 10.
Energy demand and CO2 emissions of the existing building as determined by real measurements.
Disclaimer/Publisher’s Note: The statements, opinions and data contained in all publications are solely those of the individual author(s) and contributor(s) and not of MDPI and/or the editor(s). MDPI and/or the editor(s) disclaim responsibility for any injury to people or property resulting from any ideas, methods, instructions or products referred to in the content. |
© 2026 by the authors. Licensee MDPI, Basel, Switzerland. This article is an open access article distributed under the terms and conditions of the Creative Commons Attribution (CC BY) license (http://creativecommons.org/licenses/by/4.0/).
Copyright: This open access article is published under a Creative Commons CC BY 4.0 license, which permit the free download, distribution, and reuse, provided that the author and preprint are cited in any reuse.


